Chapter VII Measures of Correlation
|
|
|
- Roy Lucas
- 6 years ago
- Views:
Transcription
1 Chapter VII Measures of Correlatio A researcher may be iterested i fidig out whether two variables are sigificatly related or ot. For istace, he may be iterested i kowig whether metal ability is sigificatly related to school performace; whether work performace is sigificatly related to level of morale of the employees; or whether study habits sigificatly relate to grades i mathematics. I all these problems, the researcher ca choose a research desig that will help him establish such relatioships. The simplest thig that he ca do is to study the patters of values of the two variables. This is the area of correlatio aalysis. Basic Cocepts i Correlatio Aalysis Correlatio aalysis is cocered with the aalysis of liear relatioship betwee two or more variables. It is used if oe wats to determie whether the variables are sigificatly related or ot. The relatioship betwee two variables could be positive or egative. A positive liear relatioship betwee two variables exists if a icrease i the value of oe correspods to a icrease i the value of the other. Equivaletly, a positive correlatio exists if a decrease i the value of oe variable correspods to a decrease i the value of the other variable. O the other had, a egative liear relatioship betwee two variables exists if a decrease i the value of oe variable correspods to a icrease i the value of the other variable. Or, if a icrease i the value of oe variable correspods to a decrease i the value of the other, the a egative correlatio exists. Example: Example: It has bee show that IQ ad academic performace are positively related. The followig variables are egatively correlated. 1. academic achievemet ad hours per week of watchig TV. time spet i practice ad umber of typig errors 3. abseteeism rate ad job satisfactio I order to determie the stregth of the associatio or correlatio betwee variables we compute for a statistic kow as correlatio coefficiet. It measures the degree or stregth of the liear relatioship betwee two or more variables. There are several coefficiets of correlatio ad their use depeds o the type of data (e. g. Pearso r, Spearma rho, Cramer s V, Poit-biserial, etc.). Most coefficiets of correlatio assume values betwee -1 ad +1. Qualitative descriptio of the stregth of correlatio is based o the followig suggested guide.


2 Figure 1. Guide i iterpretig correlatio coefficiets. The Scatter Plot A scatter plot, also kow as scatter diagram, is a graphical represetatio of the liear relatioship betwee two variables. The followig scatter plots show the various types ad degrees of liear associatio betwee two variables. Figure a. Strog positive correlatio Figure b. Low egative correlatio

 ad therefore are correlated with each other (Spurious correlatio).")

3 Figure c. Strog Negative Correlatio Figure d. No correlatio Figure e. Low positive correlatio Spurious Correlatio ad Causality Causality, also kow as causatio, is defied as a cause-effect relatioship betwee two variables. A sigificat correlatio does ot ecessarily idicate causality but rather a commo likage i a sequece of evets. Oe type of sigificat correlatio situatio is whe both variables are iflueced by a commo cause (cofoudig variable) ad therefore are correlated with each other (Spurious correlatio). For example, idividuals with a higher level of icome have both higher levels of savigs ad spedig. We might fid that there is a positive correlatio betwee level of savigs ad level of spedig but this does ot mea that oe variable causes the other. Moore (1993) foud a sigificat strog correlatio betwee amout of ice cream sold ad the umber of deaths by drowig. But this does ot mea that eatig ice cream causes death by drowig or the other way aroud. This sigificat correlatio is actually due to seaso (summer time). If a researcher wats to show cause-ad-effect, he should coduct a cotrolled experimet.
4 Correlatio Betwee Two Iterval Variables (Pearso r) The Pearso product-momet correlatio coefficiet, popularly kow as Pearso s r, is the most widely used correlatio coefficiet. Values of r for pairs of variables are commoly reported i research reports ad jourals as a meas of summarizig the extet of the relatioship betwee two variables measured i at least iterval scale. This coefficiet is appropriate if observatios are sampled from a bivariate ormal distributio. Give sample data, Pearso r is computed usig the followig formula: r i1 X i X iyi X iyi i1 i1 i1 i1 X i i1 Y Testig for the Sigificace of Pearso s r Whe computig a correlatio coefficiet, it is also useful to test the correlatio coefficiet for sigificace. This provides the researcher with some idea of how large a correlatio coefficiet must be before cosiderig it to demostrate that there really is a relatioship betwee two variables. It may be that two variables are related by chace, ad a hypothesis test for r allows the researcher to decide whether the observed r could have emerged by chace or ot. I order to test the correlatio coefficiet for statistical sigificace, it is ecessary to defie the true correlatio coefficiet that would be observed if all populatio values were available. This true correlatio coefficiet is usually deoted by the Greek letter ρ (rho). The ull hypothesis is that there is o relatioship betwee the two variables X ad Y. I symbol, H0: = 0 The ull hypothesis may be tested agaist ay oe of the followig alterative hypotheses: a) Ha: 0 b) Ha: > 0 c) Ha: < 0 The test statistic for the hypothesis test above is the sample or observed correlatio coefficiet r. As various samples are draw, each of sample size, the values of r vary from sample to sample. The samplig distributio of r is approximated by a t distributio with - degrees for freedom. Hece, the test statistic for testig for the sigificace of r is give by r t 1 r i i1 Y i

5 Example: The followig table presets data o years of formal educatio (X) ad age of etry ito the labour force (Y) of a radom sample of 1 workers. X Y X Y XY X 149 Y 14 X 1999 Y 3876 XY 716 r r X XY X X Y Y Y Therefore, there is a moderate positive correlatio betwee years of formal educatio (X) ad age of etry ito the labour force (Y). Computig ad testig the sigificace of Pearso r usig Stata 1. The data shall be typed i Stata Editor (or i Excel), the way it appears i the table above (oly the colums of X ad Y).

6 . From the meu at the top of the scree, click o StatisticsSummaries, tables, ad testssummary ad descriptive statisticspairwise correlatios. 3. I the Mai tab of the dialog box, select X ad Y i the pull-dow meu. 4. Check the boxes opposite Prit sigificace level for each etry ad sigificace level for displayig with a star. 5. Click OK. SCREENSHOTS
.")
7 OUTPUT. pwcorr x y, sig star(5) x x y Commad Pearso r y 0.641* p-value Iterpretatio: There is a sigificat moderate positive correlatio betwee years of formal educatio ad age of etry ito the labour force (r=0.641, p=0.0301). Correlatio Betwee Two Ordial Variables (Spearma rho) If both variables are measured i the ordial scale, the the most appropriate correlatio coefficiet is the Spearma rak coefficiet, popularly kow as Spearma rho. The value of the Spearma rho coefficiet is calculated based o the raks of the observatios. The computatioal formula of Spearma s rho together with the test statistic for testig its sigificace are give by 6 d r s 1 3 where d = paired differeces betwee the raks. = the umber of paired raks.
. The hypothetical data is give below.")
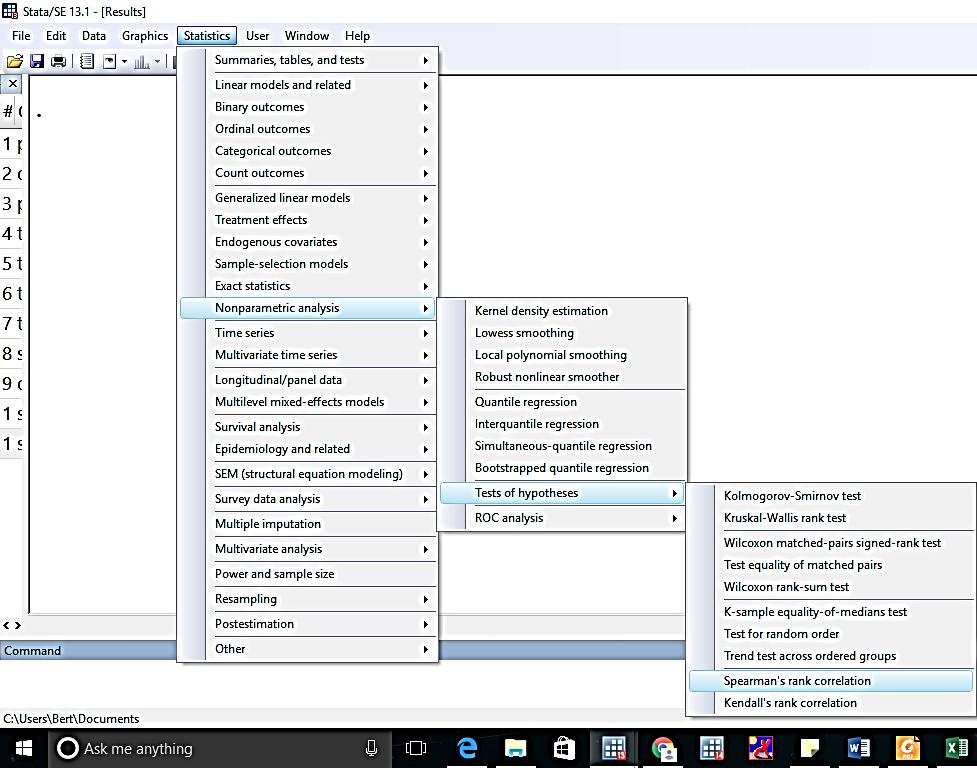
8 t r s 1 rs Example: Thus, Suppose that a researcher wats to fid out the relatioship betwee job performace of 6 employees (measured i a scale of 1 to 10) ad their job satisfactio (also measured i a scale of 1 to 10). The hypothetical data is give below. Performace Satisfactio Differece (d) d 10 (1) 8 (3) 4 8 (3) 9 () () 10 (1) (6) 5 (5) (5) 3 (6) (4) 6 (4) 0 0 r s d 8 6( 8 ) there exists a strog liear relatioship betwee performace ad satisfactio Computig ad testig the sigificace of Spearma rho usig Stata 1. The data whe typed i Stata Editor (or i Excel) will look like this:. From the meu at the top of the scree, click o StatisticsNoparametric aalysistests of hypothesesspearma s rak correlatio. 3. I the Mai tab of the dialog box, select X ad Y i the pull-dow meu. 4. Check the boxes opposite Prit sigificace level for each etry ad sigificace level for displayig with a star. 5. Click OK.
9 SCREENSHOTS
10 OUTPUT. spearma performace satisfactio, star(0.05) Number of obs = 6 Spearma's rho = Commad Spearma rho Test of Ho: performace ad satisfactio are idepedet Prob > t = p-value Iterpretatio: There is a strog liear relatioship betwee performace ad satisfactio(rs=0.7714). However, the correlatio is ot sigificat (p=0.074). The strog liear associatio betwee these two variables may oly be due to chace. Or, maybe because of very small sample size. Correlatio Betwee a Iterval Variable ad a Two-category Nomial Variable If oe of the two variables i the aalysis is dichotomous (two-category omial) ad the other is iterval i scale, the poit-biserial correlatio coefficiet is appropriate. The computatioal formula poit biserial coefficiet is give by y1 y 0 pq rpbi s where: y 1 y 0 y - mea of the Y scores for those idividuals with X scores equal to 1 - mea of the Y score for those idividuals with X scores equal to 0 s - stadard deviatio of all Y scores y p - proportio of idividuals with a X score equal to 1 q - proportio of idividuals with a X score equal to 0 Similar to the Pearso r ad the Spearma rho, the sigificace of the poit-biserial coefficiet is tested usig a T test. Example Cosider the dexterity scores of a radom sample of male ad female respodets. Let 1 deote male ad 0 deote female. Subject Sex Dexterity

11 Solutio: The stadard deviatio of dexterity scores is s y ; p = 0.5 ad q = 0.5. Hece, r pbi r pbi y 1 y s 0 y pq Therefore, there exists a high correlatio betwee sex ad dexterity scores. Males ted to have higher dexterity tha females. Computig ad testig the sigificace of Poit-biserial coefficiet usig Stata 1. Type the data Stata Editor (or i Excel) as it appears i the table above.. Istall the poit-biserial (pbis) package. I the Commad widow, type fidit pbis. Hit Eter. Follow istructios below. Wait util istallatio is complete.
 Np= 5 p= 0.50 Nq= 5 q= 0.")

12 Click o this lik 3. I the Commad widow, type pbis sex dexterity. Hit Eter.. pbis sex dexterityscore OUTPUT Commad (obs= 10) Np= 5 p= 0.50 Nq= 5 q= 0.50 Poit-biserial coefficiet p-value Coef.= t= P> t = df= 8
13 Iterpretatio: There exists a sigificat strog correlatio betwee sex ad dexterity scores. Further, males have sigificatly higher dexterity tha females. Correlatio Betwee Two Dichotomous Nomial Variables The Phi () coefficiet is useful whe both variables are omial i scale or categorical with two categories (dichotomous). I this case, the data is arraged i a x cotigecy table. The computatioal formula of phi coefficiet together with the test statistic for testig its sigificace are give by t bc ad a bc d a cb d 1 Example: Cosider the problem of determiig the correlatio betwee sex ad political party affiliatio. Suppose we have 10 subjects with the followig data: Perso Sex (X) Party (Y) A 1 1 B 1 1 C 1 0 D 1 1 E 1 1 F 0 0 G 0 1 H 0 1 I 0 0 J 0 0 where: sex - 1 if male; 0 if female party 1 if Republica; 0 if Democrat The correspodig x cotigecy table is give below. Party (Y) Sex (X) Total Total The,


14 Therefore, there exists a relatively moderate positive associatio betwee sex ad political party affiliatio. Computig ad testig the sigificace of Phi coefficiet usig Stata 1. Type the data Stata Editor (or i Excel) as it appears below.. Istall the Phi coefficiet (phi) package. I the Commad widow, type fidit phi. Hit Eter. Scroll dow to this lik: sp3 from Click o this lik
15 Wait util istallatio is complete. 3. I the Commad widow, type phi sex party. Hit Eter.. phi sex party OUTPUT Commad Party (Y) Sex (X) 0 1 Total Total p-value Phi coefficiet Pearso chi(1) = Pr = phi = Cohe's w = fourfold poit correlatio = phi-squared = Iterpretatio: There exists a o-sigificat moderate associatio betwee sex ad political party affiliatio ( =0.408, p=0.197). There is o sufficiet data to coclude that oe sex category is domiatly affiliated with a political party. REMARK: The value of the Phi coefficiet ca also be computed based i the value of the chi-square test statistic. It is calculated as X. N
 associatio betwee variables based o the chi-square test.")
16 Chi-square-based Measures of Associatio for Categorical Variables The chi-square test for idepedece of two categorical variables is used to determie whether the variables are associated or ot. However, it does ot provide iformatio o the stregth of the associatio. The followig are some measures of (oliear) associatio betwee variables based o the chi-square test. The sigificace of these measures follows that of the chi-square test statistic. a) Cramer s V The Cramer s V is appropriate if the dimesio of the cotigecy table is larger tha a x ad the umber of rows is ot equal to the umber of colums. This is cosidered as a alterative for phi coefficiet. The value of V ca be calculated based o the chi-square statistic as follows: X V NL 1 where X is the value of the chi-square statistic N = the grad total L = the umber of rows or colums, whichever is smaller Example: Suppose that we are iterested i the relatioship betwee work performace problems of employees ad their use of three treatmet cliics. The data are give below. Type of Problem Type of Cliic Total Cardiovascular Metal Alcoholism Health Abseteeism Tardiess Poor Quality Work Problems with Other Workers Total Aalysis usig Stata 1. Type the data Stata Editor (or i Excel) as it appears below.
17 . Type the followig commad i the Commad widow: tabulate problem cliic [fweight=um_workers], chi V. Press Eter. OUTPUT. tabulate problem cliic [fweight=um_workers], chi V cliic problem Cardiovas Metal he Alcoholis Total Abseteeism Tardiess Poor quality of work Problem with co-worke Total Pearso chi(6) = Pr = Cramér's V = Iterpretatio: There exists a sigificatly low associatio betwee work performace problem ad type of treatmet cliic (V=0.849, p=0.000). Majority of workers with problems i abseteeism usually atted to Cardiovascular treatmet; while, workers with problems with their co-workers usually atted to Alcoholism treatmet cliic. b) Cotigecy coefficiet C The Cotigecy C is appropriate if the dimesio of the cotigecy table is larger tha a x ad the umber of rows is equal to the umber of colums. The value of C is calculated as: X C X N where X is the value of the chi-squared statistic N = the grad Ufortuately, there is o available Stata package for computig the value of C. Its value has to be computed maually. Example: A radom sample of 00 married me, all retired, were classified accordig to educatio ad umber of childre. Is there a sigificat associatio betwee the size of the family ad the level of educatio attaied by the father? Educatio Number of Childre Over 3 Total Elemetary Secodary College Total
![Aalysis usig Stata 1. Type the data Stata Editor (or i Excel) as it appears below.. Type the followig commad i the Commad widow: tabulate educ umchild [fweight=um_me], chi. Press Eter. OUTPUT.](/docs-images/72/67319699/images/18-0.jpg "tabulate educ umchild [fweight=um_me], chi umchild educ 0-1 -3 Over 3 Total Elemetary 14 37 3 83 High School 19 4 17 78 College 1 17 10 39 Total 45 96 59 00 Pearso chi(4) = 7.4644 Pr = 0.113 3.")
18 Aalysis usig Stata 1. Type the data Stata Editor (or i Excel) as it appears below.. Type the followig commad i the Commad widow: tabulate educ umchild [fweight=um_me], chi. Press Eter. OUTPUT. tabulate educ umchild [fweight=um_me], chi umchild educ Over 3 Total Elemetary High School College Total Pearso chi(4) = Pr = To geerate the value of C, type the commad: display sqrt(7.4644/( )) C= Iterpretatio: There exists a o-sigificat very low associatio betwee the level of educatio of the father ad the umber of childre of the family (C=0.1897, p=0.1130). Other measures of associatio 1. Gamma coefficiet. Kedall s rak correlatio 3. Eta coefficiet
Chapter 22. Comparing Two Proportions. Copyright 2010 Pearson Education, Inc.
 Chapter 22 Comparig Two Proportios Copyright 2010 Pearso Educatio, Ic. Comparig Two Proportios Comparisos betwee two percetages are much more commo tha questios about isolated percetages. Ad they are more
Continuous Data that can take on any real number (time/length) based on sample data. Categorical data can only be named or categorised
 based on sample data. Categorical data can only be named or categorised") Questio 1. (Topics 1-3) A populatio cosists of all the members of a group about which you wat to draw a coclusio (Greek letters (μ, σ, Ν) are used) A sample is the portio of the populatio selected for
Questio 1. (Topics 1-3) A populatio cosists of all the members of a group about which you wat to draw a coclusio (Greek letters (μ, σ, Ν) are used) A sample is the portio of the populatio selected for
Chapter 22. Comparing Two Proportions. Copyright 2010, 2007, 2004 Pearson Education, Inc.
 Chapter 22 Comparig Two Proportios Copyright 2010, 2007, 2004 Pearso Educatio, Ic. Comparig Two Proportios Read the first two paragraphs of pg 504. Comparisos betwee two percetages are much more commo
Response Variable denoted by y it is the variable that is to be predicted measure of the outcome of an experiment also called the dependent variable
 Statistics Chapter 4 Correlatio ad Regressio If we have two (or more) variables we are usually iterested i the relatioship betwee the variables. Associatio betwee Variables Two variables are associated
MOST PEOPLE WOULD RATHER LIVE WITH A PROBLEM THEY CAN'T SOLVE, THAN ACCEPT A SOLUTION THEY CAN'T UNDERSTAND.
 XI-1 (1074) MOST PEOPLE WOULD RATHER LIVE WITH A PROBLEM THEY CAN'T SOLVE, THAN ACCEPT A SOLUTION THEY CAN'T UNDERSTAND. R. E. D. WOOLSEY AND H. S. SWANSON XI-2 (1075) STATISTICAL DECISION MAKING Advaced
1 Inferential Methods for Correlation and Regression Analysis
 1 Iferetial Methods for Correlatio ad Regressio Aalysis I the chapter o Correlatio ad Regressio Aalysis tools for describig bivariate cotiuous data were itroduced. The sample Pearso Correlatio Coefficiet
Chapter 12 Correlation
 Chapter Correlatio Correlatio is very similar to regressio with oe very importat differece. Regressio is used to explore the relatioship betwee a idepedet variable ad a depedet variable, whereas correlatio
Chapter If n is odd, the median is the exact middle number If n is even, the median is the average of the two middle numbers
 Chapter 4 4-1 orth Seattle Commuity College BUS10 Busiess Statistics Chapter 4 Descriptive Statistics Summary Defiitios Cetral tedecy: The extet to which the data values group aroud a cetral value. Variatio:
Chapter 1 (Definitions)
") FINAL EXAM REVIEW Chapter 1 (Defiitios) Qualitative: Nomial: Ordial: Quatitative: Ordial: Iterval: Ratio: Observatioal Study: Desiged Experimet: Samplig: Cluster: Stratified: Systematic: Coveiece: Simple
FINAL EXAM REVIEW Chapter 1 (Defiitios) Qualitative: Nomial: Ordial: Quatitative: Ordial: Iterval: Ratio: Observatioal Study: Desiged Experimet: Samplig: Cluster: Stratified: Systematic: Coveiece: Simple
INSTRUCTIONS (A) 1.22 (B) 0.74 (C) 4.93 (D) 1.18 (E) 2.43
 1.22 (B) 0.74 (C) 4.93 (D) 1.18 (E) 2.43") PAPER NO.: 444, 445 PAGE NO.: Page 1 of 1 INSTRUCTIONS I. You have bee provided with: a) the examiatio paper i two parts (PART A ad PART B), b) a multiple choice aswer sheet (for PART A), c) selected formulae
PAPER NO.: 444, 445 PAGE NO.: Page 1 of 1 INSTRUCTIONS I. You have bee provided with: a) the examiatio paper i two parts (PART A ad PART B), b) a multiple choice aswer sheet (for PART A), c) selected formulae
Overview. p 2. Chapter 9. Pooled Estimate of. q = 1 p. Notation for Two Proportions. Inferences about Two Proportions. Assumptions
 Chapter 9 Slide Ifereces from Two Samples 9- Overview 9- Ifereces about Two Proportios 9- Ifereces about Two Meas: Idepedet Samples 9-4 Ifereces about Matched Pairs 9-5 Comparig Variatio i Two Samples
Final Examination Solutions 17/6/2010
 The Islamic Uiversity of Gaza Faculty of Commerce epartmet of Ecoomics ad Political Scieces A Itroductio to Statistics Course (ECOE 30) Sprig Semester 009-00 Fial Eamiatio Solutios 7/6/00 Name: I: Istructor:
Common Large/Small Sample Tests 1/55
 Commo Large/Small Sample Tests 1/55 Test of Hypothesis for the Mea (σ Kow) Covert sample result ( x) to a z value Hypothesis Tests for µ Cosider the test H :μ = μ H 1 :μ > μ σ Kow (Assume the populatio
11 Correlation and Regression
 11 Correlatio Regressio 11.1 Multivariate Data Ofte we look at data where several variables are recorded for the same idividuals or samplig uits. For example, at a coastal weather statio, we might record
Chapter 13, Part A Analysis of Variance and Experimental Design
 Slides Prepared by JOHN S. LOUCKS St. Edward s Uiversity Slide 1 Chapter 13, Part A Aalysis of Variace ad Eperimetal Desig Itroductio to Aalysis of Variace Aalysis of Variace: Testig for the Equality of
TABLES AND FORMULAS FOR MOORE Basic Practice of Statistics
 TABLES AND FORMULAS FOR MOORE Basic Practice of Statistics Explorig Data: Distributios Look for overall patter (shape, ceter, spread) ad deviatios (outliers). Mea (use a calculator): x = x 1 + x 2 + +
Goodness-of-Fit Tests and Categorical Data Analysis (Devore Chapter Fourteen)
") Goodess-of-Fit Tests ad Categorical Data Aalysis (Devore Chapter Fourtee) MATH-252-01: Probability ad Statistics II Sprig 2019 Cotets 1 Chi-Squared Tests with Kow Probabilities 1 1.1 Chi-Squared Testig................
Goodess-of-Fit Tests ad Categorical Data Aalysis (Devore Chapter Fourtee) MATH-252-01: Probability ad Statistics II Sprig 2019 Cotets 1 Chi-Squared Tests with Kow Probabilities 1 1.1 Chi-Squared Testig................
STA Learning Objectives. Population Proportions. Module 10 Comparing Two Proportions. Upon completing this module, you should be able to:
 STA 2023 Module 10 Comparig Two Proportios Learig Objectives Upo completig this module, you should be able to: 1. Perform large-sample ifereces (hypothesis test ad cofidece itervals) to compare two populatio
Sample Size Determination (Two or More Samples)
") Sample Sie Determiatio (Two or More Samples) STATGRAPHICS Rev. 963 Summary... Data Iput... Aalysis Summary... 5 Power Curve... 5 Calculatios... 6 Summary This procedure determies a suitable sample sie
Sample Sie Determiatio (Two or More Samples) STATGRAPHICS Rev. 963 Summary... Data Iput... Aalysis Summary... 5 Power Curve... 5 Calculatios... 6 Summary This procedure determies a suitable sample sie
Regression, Inference, and Model Building
 Regressio, Iferece, ad Model Buildig Scatter Plots ad Correlatio Correlatio coefficiet, r -1 r 1 If r is positive, the the scatter plot has a positive slope ad variables are said to have a positive relatioship
Data Analysis and Statistical Methods Statistics 651
 Data Aalysis ad Statistical Methods Statistics 651 http://www.stat.tamu.edu/~suhasii/teachig.html Suhasii Subba Rao Review of testig: Example The admistrator of a ursig home wats to do a time ad motio
Lecture 5: Parametric Hypothesis Testing: Comparing Means. GENOME 560, Spring 2016 Doug Fowler, GS
 Lecture 5: Parametric Hypothesis Testig: Comparig Meas GENOME 560, Sprig 2016 Doug Fowler, GS (dfowler@uw.edu) 1 Review from last week What is a cofidece iterval? 2 Review from last week What is a cofidece
Power and Type II Error
 Statistical Methods I (EXST 7005) Page 57 Power ad Type II Error Sice we do't actually kow the value of the true mea (or we would't be hypothesizig somethig else), we caot kow i practice the type II error
Describing the Relation between Two Variables
 Copyright 010 Pearso Educatio, Ic. Tables ad Formulas for Sulliva, Statistics: Iformed Decisios Usig Data 010 Pearso Educatio, Ic Chapter Orgaizig ad Summarizig Data Relative frequecy = frequecy sum of
To make comparisons for two populations, consider whether the samples are independent or dependent.
 Sociology 54 Testig for differeces betwee two samle meas Cocetually, comarig meas from two differet samles is the same as what we ve doe i oe-samle tests, ecet that ow the hyotheses focus o the arameters
Mathematical Notation Math Introduction to Applied Statistics
 Mathematical Notatio Math 113 - Itroductio to Applied Statistics Name : Use Word or WordPerfect to recreate the followig documets. Each article is worth 10 poits ad ca be prited ad give to the istructor
ST 305: Exam 3 ( ) = P(A)P(B A) ( ) = P(A) + P(B) ( ) = 1 P( A) ( ) = P(A) P(B) σ X 2 = σ a+bx. σ ˆp. σ X +Y. σ X Y. σ X. σ Y. σ n.
 = P(A)P(B A) ( ) = P(A) + P(B) ( ) = 1 P( A) ( ) = P(A) P(B) σ X 2 = σ a+bx. σ ˆp. σ X +Y. σ X Y. σ X. σ Y. σ n.") ST 305: Exam 3 By hadig i this completed exam, I state that I have either give or received assistace from aother perso durig the exam period. I have used o resources other tha the exam itself ad the basic
ST 305: Exam 3 By hadig i this completed exam, I state that I have either give or received assistace from aother perso durig the exam period. I have used o resources other tha the exam itself ad the basic
This chapter focuses on two experimental designs that are crucial to comparative studies: (1) independent samples and (2) matched pair samples.
 independent samples and (2) matched pair samples.") Chapter 9 & : Comparig Two Treatmets: This chapter focuses o two eperimetal desigs that are crucial to comparative studies: () idepedet samples ad () matched pair samples Idepedet Radom amples from Two
Chapter 9 & : Comparig Two Treatmets: This chapter focuses o two eperimetal desigs that are crucial to comparative studies: () idepedet samples ad () matched pair samples Idepedet Radom amples from Two
Topic 9: Sampling Distributions of Estimators
 Topic 9: Samplig Distributios of Estimators Course 003, 2016 Page 0 Samplig distributios of estimators Sice our estimators are statistics (particular fuctios of radom variables), their distributio ca be
Topic 9: Sampling Distributions of Estimators
 Topic 9: Samplig Distributios of Estimators Course 003, 2018 Page 0 Samplig distributios of estimators Sice our estimators are statistics (particular fuctios of radom variables), their distributio ca be
Read through these prior to coming to the test and follow them when you take your test.
 Math 143 Sprig 2012 Test 2 Iformatio 1 Test 2 will be give i class o Thursday April 5. Material Covered The test is cummulative, but will emphasize the recet material (Chapters 6 8, 10 11, ad Sectios 12.1
7-1. Chapter 4. Part I. Sampling Distributions and Confidence Intervals
 7-1 Chapter 4 Part I. Samplig Distributios ad Cofidece Itervals 1 7- Sectio 1. Samplig Distributio 7-3 Usig Statistics Statistical Iferece: Predict ad forecast values of populatio parameters... Test hypotheses
5. A formulae page and two tables are provided at the end of Part A of the examination PART A
 Istructios: 1. You have bee provided with: (a) this questio paper (Part A ad Part B) (b) a multiple choice aswer sheet (for Part A) (c) Log Aswer Sheet(s) (for Part B) (d) a booklet of tables. (a) I PART
S Y Y = ΣY 2 n. Using the above expressions, the correlation coefficient is. r = SXX S Y Y
 1 Sociology 405/805 Revised February 4, 004 Summary of Formulae for Bivariate Regressio ad Correlatio Let X be a idepedet variable ad Y a depedet variable, with observatios for each of the values of these
GG313 GEOLOGICAL DATA ANALYSIS
 GG313 GEOLOGICAL DATA ANALYSIS 1 Testig Hypothesis GG313 GEOLOGICAL DATA ANALYSIS LECTURE NOTES PAUL WESSEL SECTION TESTING OF HYPOTHESES Much of statistics is cocered with testig hypothesis agaist data
Properties and Hypothesis Testing
 Chapter 3 Properties ad Hypothesis Testig 3.1 Types of data The regressio techiques developed i previous chapters ca be applied to three differet kids of data. 1. Cross-sectioal data. 2. Time series data.
Topic 9: Sampling Distributions of Estimators
 Topic 9: Samplig Distributios of Estimators Course 003, 2018 Page 0 Samplig distributios of estimators Sice our estimators are statistics (particular fuctios of radom variables), their distributio ca be
Categorical Data Analysis
 Categorical Data Aalysis Refereces : Ala Agresti, Categorical Data Aalysis, Wiley Itersciece, New Jersey, 2002 Bhattacharya, G.K., Johso, R.A., Statistical Cocepts ad Methods, Wiley,1977 Outlie Categorical
TABLES AND FORMULAS FOR MOORE Basic Practice of Statistics
 TABLES AND FORMULAS FOR MOORE Basic Practice of Statistics Explorig Data: Distributios Look for overall patter (shape, ceter, spread) ad deviatios (outliers). Mea (use a calculator): x = x 1 + x 2 + +
Class 27. Daniel B. Rowe, Ph.D. Department of Mathematics, Statistics, and Computer Science. Marquette University MATH 1700
 Class 7 Daiel B. Rowe, Ph.D. Departmet of Mathematics, Statistics, ad Computer Sciece Copyright 013 by D.B. Rowe 1 Ageda: Skip Recap Chapter 10.5 ad 10.6 Lecture Chapter 11.1-11. Review Chapters 9 ad 10
Chapter 22: What is a Test of Significance?
 Chapter 22: What is a Test of Sigificace? Thought Questio Assume that the statemet If it s Saturday, the it s the weeked is true. followig statemets will also be true? Which of the If it s the weeked,
Correlation. Two variables: Which test? Relationship Between Two Numerical Variables. Two variables: Which test? Contingency table Grouped bar graph
 Correlatio Y Two variables: Which test? X Explaatory variable Respose variable Categorical Numerical Categorical Cotigecy table Cotigecy Logistic Grouped bar graph aalysis regressio Mosaic plot Numerical
A statistical method to determine sample size to estimate characteristic value of soil parameters
 A statistical method to determie sample size to estimate characteristic value of soil parameters Y. Hojo, B. Setiawa 2 ad M. Suzuki 3 Abstract Sample size is a importat factor to be cosidered i determiig
Formulas and Tables for Gerstman
 Formulas ad Tables for Gerstma Measuremet ad Study Desig Biostatistics is more tha a compilatio of computatioal techiques! Measuremet scales: quatitative, ordial, categorical Iformatio quality is primary
Chapter 6 Sampling Distributions
 Chapter 6 Samplig Distributios 1 I most experimets, we have more tha oe measuremet for ay give variable, each measuremet beig associated with oe radomly selected a member of a populatio. Hece we eed to
General IxJ Contingency Tables
 page1 Geeral x Cotigecy Tables We ow geeralize our previous results from the prospective, retrospective ad cross-sectioal studies ad the Poisso samplig case to x cotigecy tables. For such tables, the test
Investigating the Significance of a Correlation Coefficient using Jackknife Estimates
 Iteratioal Joural of Scieces: Basic ad Applied Research (IJSBAR) ISSN 2307-4531 (Prit & Olie) http://gssrr.org/idex.php?joural=jouralofbasicadapplied ---------------------------------------------------------------------------------------------------------------------------
EXAMINATIONS OF THE ROYAL STATISTICAL SOCIETY
 EXAMINATIONS OF THE ROYAL STATISTICAL SOCIETY HIGHER CERTIFICATE IN STATISTICS, 017 MODULE 4 : Liear models Time allowed: Oe ad a half hours Cadidates should aswer THREE questios. Each questio carries
Pearson Edexcel Level 3 Advanced Subsidiary and Advanced GCE in Statistics
 Pearso Edecel Level 3 Advaced Subsidiary ad Advaced GCE i Statistics Statistical formulae ad tables For first certificatio from Jue 018 for: Advaced Subsidiary GCE i Statistics (8ST0) For first certificatio
2 1. The r.s., of size n2, from population 2 will be. 2 and 2. 2) The two populations are independent. This implies that all of the n1 n2
 The two populations are independent. This implies that all of the n1 n2") Chapter 8 Comparig Two Treatmets Iferece about Two Populatio Meas We wat to compare the meas of two populatios to see whether they differ. There are two situatios to cosider, as show i the followig examples:
Chapter 8 Comparig Two Treatmets Iferece about Two Populatio Meas We wat to compare the meas of two populatios to see whether they differ. There are two situatios to cosider, as show i the followig examples:
Because it tests for differences between multiple pairs of means in one test, it is called an omnibus test.
 Math 308 Sprig 018 Classes 19 ad 0: Aalysis of Variace (ANOVA) Page 1 of 6 Itroductio ANOVA is a statistical procedure for determiig whether three or more sample meas were draw from populatios with equal
Math 140 Introductory Statistics
 8.2 Testig a Proportio Math 1 Itroductory Statistics Professor B. Abrego Lecture 15 Sectios 8.2 People ofte make decisios with data by comparig the results from a sample to some predetermied stadard. These
Table 12.1: Contingency table. Feature b. 1 N 11 N 12 N 1b 2 N 21 N 22 N 2b. ... a N a1 N a2 N ab
 Sectio 12 Tests of idepedece ad homogeeity I this lecture we will cosider a situatio whe our observatios are classified by two differet features ad we would like to test if these features are idepedet
Chapter 13: Tests of Hypothesis Section 13.1 Introduction
 Chapter 13: Tests of Hypothesis Sectio 13.1 Itroductio RECAP: Chapter 1 discussed the Likelihood Ratio Method as a geeral approach to fid good test procedures. Testig for the Normal Mea Example, discussed
BIOS 4110: Introduction to Biostatistics. Breheny. Lab #9
 BIOS 4110: Itroductio to Biostatistics Brehey Lab #9 The Cetral Limit Theorem is very importat i the realm of statistics, ad today's lab will explore the applicatio of it i both categorical ad cotiuous
Chapter 5: Hypothesis testing
 Slide 5. Chapter 5: Hypothesis testig Hypothesis testig is about makig decisios Is a hypothesis true or false? Are wome paid less, o average, tha me? Barrow, Statistics for Ecoomics, Accoutig ad Busiess
Correlation and Covariance
 Correlatio ad Covariace Tom Ilveto FREC 9 What is Next? Correlatio ad Regressio Regressio We specify a depedet variable as a liear fuctio of oe or more idepedet variables, based o co-variace Regressio
Chapter 4 - Summarizing Numerical Data
 Chapter 4 - Summarizig Numerical Data 15.075 Cythia Rudi Here are some ways we ca summarize data umerically. Sample Mea: i=1 x i x :=. Note: i this class we will work with both the populatio mea µ ad the
Expectation and Variance of a random variable
 Chapter 11 Expectatio ad Variace of a radom variable The aim of this lecture is to defie ad itroduce mathematical Expectatio ad variace of a fuctio of discrete & cotiuous radom variables ad the distributio
SIMPLE LINEAR REGRESSION AND CORRELATION ANALYSIS
 SIMPLE LINEAR REGRESSION AND CORRELATION ANALSIS INTRODUCTION There are lot of statistical ivestigatio to kow whether there is a relatioship amog variables Two aalyses: (1) regressio aalysis; () correlatio
Parameter, Statistic and Random Samples
 Parameter, Statistic ad Radom Samples A parameter is a umber that describes the populatio. It is a fixed umber, but i practice we do ot kow its value. A statistic is a fuctio of the sample data, i.e.,
II. Descriptive Statistics D. Linear Correlation and Regression. 1. Linear Correlation
 II. Descriptive Statistics D. Liear Correlatio ad Regressio I this sectio Liear Correlatio Cause ad Effect Liear Regressio 1. Liear Correlatio Quatifyig Liear Correlatio The Pearso product-momet correlatio
MATH 320: Probability and Statistics 9. Estimation and Testing of Parameters. Readings: Pruim, Chapter 4
 MATH 30: Probability ad Statistics 9. Estimatio ad Testig of Parameters Estimatio ad Testig of Parameters We have bee dealig situatios i which we have full kowledge of the distributio of a radom variable.
Biostatistics for Med Students. Lecture 2
 Biostatistics for Med Studets Lecture 2 Joh J. Che, Ph.D. Professor & Director of Biostatistics Core UH JABSOM JABSOM MD7 February 22, 2017 Lecture Objectives To uderstad basic research desig priciples
Stat 139 Homework 7 Solutions, Fall 2015
 Stat 139 Homework 7 Solutios, Fall 2015 Problem 1. I class we leared that the classical simple liear regressio model assumes the followig distributio of resposes: Y i = β 0 + β 1 X i + ɛ i, i = 1,...,,
Issues in Study Design
 Power ad Sample Size: Issues i Study Desig Joh McGready Departmet of Biostatistics, Bloomberg School Lecture Topics Re-visit cocept of statistical power Factors ifluecig power Sample size determiatio whe
Statistics 20: Final Exam Solutions Summer Session 2007
 1. 20 poits Testig for Diabetes. Statistics 20: Fial Exam Solutios Summer Sessio 2007 (a) 3 poits Give estimates for the sesitivity of Test I ad of Test II. Solutio: 156 patiets out of total 223 patiets
Comparing Two Populations. Topic 15 - Two Sample Inference I. Comparing Two Means. Comparing Two Pop Means. Background Reading
 Topic 15 - Two Sample Iferece I STAT 511 Professor Bruce Craig Comparig Two Populatios Research ofte ivolves the compariso of two or more samples from differet populatios Graphical summaries provide visual
MIT : Quantitative Reasoning and Statistical Methods for Planning I
 MIT 11.220 Sprig 06 Recitatio 4 March 16, 2006 MIT - 11.220: Quatitative Reasoig ad Statistical Methods for Plaig I Recitatio #4: Sprig 2006 Cofidece Itervals ad Hypothesis Testig I. Cofidece Iterval 1.
t distribution [34] : used to test a mean against an hypothesized value (H 0 : µ = µ 0 ) or the difference
![t distribution [34] : used to test a mean against an hypothesized value (H 0 : µ = µ 0 ) or the difference](/thumbs/95/125833971.jpg "t distribution [34] : used to test a mean against an hypothesized value (H 0 : µ = µ 0 ) or the difference") EXST30 Backgroud material Page From the textbook The Statistical Sleuth Mea [0]: I your text the word mea deotes a populatio mea (µ) while the work average deotes a sample average ( ). Variace [0]: The
EXST30 Backgroud material Page From the textbook The Statistical Sleuth Mea [0]: I your text the word mea deotes a populatio mea (µ) while the work average deotes a sample average ( ). Variace [0]: The
Lecture 7: Non-parametric Comparison of Location. GENOME 560, Spring 2016 Doug Fowler, GS
 Lecture 7: No-parametric Compariso of Locatio GENOME 560, Sprig 2016 Doug Fowler, GS (dfowler@uw.edu) 1 Review How ca we set a cofidece iterval o a proportio? 2 Review How ca we set a cofidece iterval
Class 23. Daniel B. Rowe, Ph.D. Department of Mathematics, Statistics, and Computer Science. Marquette University MATH 1700
 Class 23 Daiel B. Rowe, Ph.D. Departmet of Mathematics, Statistics, ad Computer Sciece Copyright 2017 by D.B. Rowe 1 Ageda: Recap Chapter 9.1 Lecture Chapter 9.2 Review Exam 6 Problem Solvig Sessio. 2
PSYCHOLOGICAL RESEARCH (PYC 304-C) Lecture 9
 Lecture 9") Hypothesis testig PSYCHOLOGICAL RESEARCH (PYC 34-C Lecture 9 Statistical iferece is that brach of Statistics i which oe typically makes a statemet about a populatio based upo the results of a sample. I
Hypothesis testig PSYCHOLOGICAL RESEARCH (PYC 34-C Lecture 9 Statistical iferece is that brach of Statistics i which oe typically makes a statemet about a populatio based upo the results of a sample. I
Sample Size Estimation in the Proportional Hazards Model for K-sample or Regression Settings Scott S. Emerson, M.D., Ph.D.
 ample ie Estimatio i the Proportioal Haards Model for K-sample or Regressio ettigs cott. Emerso, M.D., Ph.D. ample ie Formula for a Normally Distributed tatistic uppose a statistic is kow to be ormally
Correlation Regression
 Correlatio Regressio While correlatio methods measure the stregth of a liear relatioship betwee two variables, we might wish to go a little further: How much does oe variable chage for a give chage i aother
1036: Probability & Statistics
 036: Probability & Statistics Lecture 0 Oe- ad Two-Sample Tests of Hypotheses 0- Statistical Hypotheses Decisio based o experimetal evidece whether Coffee drikig icreases the risk of cacer i humas. A perso
6 Sample Size Calculations
 6 Sample Size Calculatios Oe of the major resposibilities of a cliical trial statisticia is to aid the ivestigators i determiig the sample size required to coduct a study The most commo procedure for determiig
Important Formulas. Expectation: E (X) = Σ [X P(X)] = n p q σ = n p q. P(X) = n! X1! X 2! X 3! X k! p X. Chapter 6 The Normal Distribution.
![Important Formulas. Expectation: E (X) = Σ [X P(X)] = n p q σ = n p q. P(X) = n! X1! X 2! X 3! X k! p X. Chapter 6 The Normal Distribution.](/thumbs/96/128489792.jpg "Important Formulas. Expectation: E (X) = Σ [X P(X)] = n p q σ = n p q. P(X) = n! X1! X 2! X 3! X k! p X. Chapter 6 The Normal Distribution.") Importat Formulas Chapter 3 Data Descriptio Mea for idividual data: X = _ ΣX Mea for grouped data: X= _ Σf X m Stadard deviatio for a sample: _ s = Σ(X _ X ) or s = 1 (Σ X ) (Σ X ) ( 1) Stadard deviatio
Importat Formulas Chapter 3 Data Descriptio Mea for idividual data: X = _ ΣX Mea for grouped data: X= _ Σf X m Stadard deviatio for a sample: _ s = Σ(X _ X ) or s = 1 (Σ X ) (Σ X ) ( 1) Stadard deviatio
Chapter two: Hypothesis testing
 : Hypothesis testig - Some basic cocepts: - Data: The raw material of statistics is data. For our purposes we may defie data as umbers. The two kids of umbers that we use i statistics are umbers that result
4 Multidimensional quantitative data
 Chapter 4 Multidimesioal quatitative data 4 Multidimesioal statistics Basic statistics are ow part of the curriculum of most ecologists However, statistical techiques based o such simple distributios as
MATH/STAT 352: Lecture 15
 MATH/STAT 352: Lecture 15 Sectios 5.2 ad 5.3. Large sample CI for a proportio ad small sample CI for a mea. 1 5.2: Cofidece Iterval for a Proportio Estimatig proportio of successes i a biomial experimet
Lesson 11: Simple Linear Regression
 Lesso 11: Simple Liear Regressio Ka-fu WONG December 2, 2004 I previous lessos, we have covered maily about the estimatio of populatio mea (or expected value) ad its iferece. Sometimes we are iterested
Stat 200 -Testing Summary Page 1
 Stat 00 -Testig Summary Page 1 Mathematicias are like Frechme; whatever you say to them, they traslate it ito their ow laguage ad forthwith it is somethig etirely differet Goethe 1 Large Sample Cofidece
CEE 522 Autumn Uncertainty Concepts for Geotechnical Engineering
 CEE 5 Autum 005 Ucertaity Cocepts for Geotechical Egieerig Basic Termiology Set A set is a collectio of (mutually exclusive) objects or evets. The sample space is the (collectively exhaustive) collectio
Econ 325 Notes on Point Estimator and Confidence Interval 1 By Hiro Kasahara
 Poit Estimator Eco 325 Notes o Poit Estimator ad Cofidece Iterval 1 By Hiro Kasahara Parameter, Estimator, ad Estimate The ormal probability desity fuctio is fully characterized by two costats: populatio
UCLA STAT 110B Applied Statistics for Engineering and the Sciences
 UCLA STAT 110B Applied Statistics for Egieerig ad the Scieces Istructor: Ivo Diov, Asst. Prof. I Statistics ad Neurology Teachig Assistats: Bria Ng, UCLA Statistics Uiversity of Califoria, Los Ageles,
Chapters 5 and 13: REGRESSION AND CORRELATION. Univariate data: x, Bivariate data (x,y).
.") Chapters 5 ad 13: REGREION AND CORRELATION (ectios 5.5 ad 13.5 are omitted) Uivariate data: x, Bivariate data (x,y). Example: x: umber of years studets studied paish y: score o a proficiecy test For each
Chapters 5 ad 13: REGREION AND CORRELATION (ectios 5.5 ad 13.5 are omitted) Uivariate data: x, Bivariate data (x,y). Example: x: umber of years studets studied paish y: score o a proficiecy test For each
If, for instance, we were required to test whether the population mean μ could be equal to a certain value μ
 STATISTICAL INFERENCE INTRODUCTION Statistical iferece is that brach of Statistics i which oe typically makes a statemet about a populatio based upo the results of a sample. I oesample testig, we essetially
Descriptive measures of association for bivariate distributions
 Chapter 4 Descriptive measures of associatio for bivariate distributios Now we come to describe ad characterise specific features of bivariate frequecy distributios, ie, itrisic structures of raw data
Agreement of CI and HT. Lecture 13 - Tests of Proportions. Example - Waiting Times
 Sigificace level vs. cofidece level Agreemet of CI ad HT Lecture 13 - Tests of Proportios Sta102 / BME102 Coli Rudel October 15, 2014 Cofidece itervals ad hypothesis tests (almost) always agree, as log
Chapter Objectives. Bivariate Data. Terminology. Lurking Variable. Types of Relations. Chapter 3 Linear Regression and Correlation
 Chapter Objectives Chapter 3 Liear Regressio ad Correlatio Descriptive Aalysis & Presetatio of Two Quatitative Data To be able to preset two-variables data i tabular ad graphic form Display the relatioship
UNIVERSITY OF TORONTO Faculty of Arts and Science APRIL/MAY 2009 EXAMINATIONS ECO220Y1Y PART 1 OF 2 SOLUTIONS
 PART of UNIVERSITY OF TORONTO Faculty of Arts ad Sciece APRIL/MAY 009 EAMINATIONS ECO0YY PART OF () The sample media is greater tha the sample mea whe there is. (B) () A radom variable is ormally distributed
Lesson 2. Projects and Hand-ins. Hypothesis testing Chaptre 3. { } x=172.0 = 3.67
 Lesso 7--7 Chaptre 3 Projects ad Had-is Project I: latest ovember Project I: latest december Laboratio Measuremet systems aalysis I: latest december Project - are volutary. Laboratio is obligatory. Give
Bivariate Sample Statistics Geog 210C Introduction to Spatial Data Analysis. Chris Funk. Lecture 7
 Bivariate Sample Statistics Geog 210C Itroductio to Spatial Data Aalysis Chris Fuk Lecture 7 Overview Real statistical applicatio: Remote moitorig of east Africa log rais Lead up to Lab 5-6 Review of bivariate/multivariate
Worksheet 23 ( ) Introduction to Simple Linear Regression (continued)
 Introduction to Simple Linear Regression (continued)") Worksheet 3 ( 11.5-11.8) Itroductio to Simple Liear Regressio (cotiued) This worksheet is a cotiuatio of Discussio Sheet 3; please complete that discussio sheet first if you have ot already doe so. This
Worksheet 3 ( 11.5-11.8) Itroductio to Simple Liear Regressio (cotiued) This worksheet is a cotiuatio of Discussio Sheet 3; please complete that discussio sheet first if you have ot already doe so. This
Topic 18: Composite Hypotheses
 Toc 18: November, 211 Simple hypotheses limit us to a decisio betwee oe of two possible states of ature. This limitatio does ot allow us, uder the procedures of hypothesis testig to address the basic questio:
LINEAR REGRESSION ANALYSIS. MODULE IX Lecture Multicollinearity
 LINEAR REGRESSION ANALYSIS MODULE IX Lecture - 9 Multicolliearity Dr Shalabh Departmet of Mathematics ad Statistics Idia Istitute of Techology Kapur Multicolliearity diagostics A importat questio that
Chapter 11: Asking and Answering Questions About the Difference of Two Proportions
 Chapter 11: Askig ad Aswerig Questios About the Differece of Two Proportios These otes reflect material from our text, Statistics, Learig from Data, First Editio, by Roxy Peck, published by CENGAGE Learig,
(7 One- and Two-Sample Estimation Problem )
") 34 Stat Lecture Notes (7 Oe- ad Two-Sample Estimatio Problem ) ( Book*: Chapter 8,pg65) Probability& Statistics for Egieers & Scietists By Walpole, Myers, Myers, Ye Estimatio 1 ) ( ˆ S P i i Poit estimate:
34 Stat Lecture Notes (7 Oe- ad Two-Sample Estimatio Problem ) ( Book*: Chapter 8,pg65) Probability& Statistics for Egieers & Scietists By Walpole, Myers, Myers, Ye Estimatio 1 ) ( ˆ S P i i Poit estimate:
Statistics Lecture 27. Final review. Administrative Notes. Outline. Experiments. Sampling and Surveys. Administrative Notes
 Admiistrative Notes s - Lecture 7 Fial review Fial Exam is Tuesday, May 0th (3-5pm Covers Chapters -8 ad 0 i textbook Brig ID cards to fial! Allowed: Calculators, double-sided 8.5 x cheat sheet Exam Rooms: