CH19 Confidence Intervals for Proportions. Confidence intervals Construct confidence intervals for population proportions
|
|
|
- Griffin Rose
- 6 years ago
- Views:
Transcription
1 CH19 Cofidece Itervals for Proportios Cofidece itervals Costruct cofidece itervals for populatio proportios
2 Motivatio
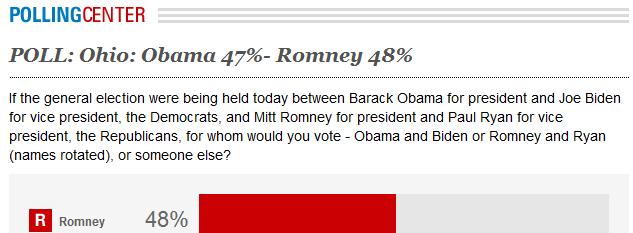
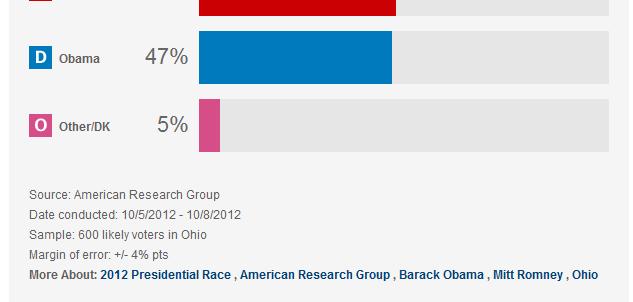
3 Motivatio We are iterested i the populatio proportio who support Mr. Obama. This sample has sample size 600 ad sample proportio 47%. What ca we say about the populatio proportio from this sample? Ca we say the populatio proportio is 47%? 51%? 43%? Or betwee 43% ad 51%?
4 Motivatio Clarificatio: The populatio proportio is a costat. The value of the populatio proportio is fixed. We do ot kow this value. The sample proportio is radom. Differet samples may result differet values of sample proportio. We ca compute sample proportio from a sample.
5 Review: samplig distributio of sample proportio The sample proportio is a radom variable. The samplig distributio of the sample proportio ^pof samples of size is approximately Normalwith mea p ad stadard deviatio p(1 p) provided that the sampled values are idepedet (e.g. a simple radom sample from a large populatio) ad the sample size is large eough,
6 Review: samplig distributio of sample proportio mea( = p, ad SD( = p(1 p). p 3SD( p 2SD( pˆ ) p SD( p p SD ( pˆ ) p 2SD( pˆ ) p 3SD( pˆ ) ^ The probability that p beig 2 sd from p is 95%
7 Cofidece iterval The probability that pis withi 2 stadard deviatio from pis 95%. Same as ^ The probability that p 2SD( pˆ ) pˆ p+ 2SD( pˆ ) is 95%. Same as The probability that p ˆ 2SD( pˆ ) p pˆ + is 95%. 2SD( pˆ )
8 Cofidece iterval Cautios: The populatio proportio p is ot radom. The iterval ( p ˆ 2SD( pˆ ), pˆ + 2SD( pˆ )) is radom. With 95% chace, this radom iterval will cotai the populatio proportio p.
9 Cofidece iterval Problem The radom iterval ( p ˆ 2SD( pˆ ), pˆ + 2SD( pˆ )) still depeds o psice p(1 p) SD( =. Remedy: use stadard error to replace stadard deviatio of ^p: pˆ(1 SE( =.
10 Cetral Limit Theorem for sample proportio The samplig distributio of the sample proportio pof samples of size is approximately Normal with mea p ad stadard deviatio pˆ(1, provided that the sampled values are idepedet (e.g. a simple radom sample from a large populatio) ad the sample size is large eough ^
11 Cofidece iterval The 95% cofidece iterval for populatio proportio p costructed from samples of size with sample proportio ^pis give by pˆ 2 pˆ(1, pˆ + 2 pˆ(1 For example, a 95% cofidece iterval for the populatio proportio of supportig Mr. Obama (=600, ^p=47%) is (0.4292, ).
12 Meaig of cofidece What do we mea by 95%? Or more specifically, what do we mea by sayig we have 95% cofidece that the iterval (0.4292, ) cotais the true populatio proportio? The populatio proportio is a costat, ot radom. So is the iterval (0.4292, ). The the probability that the populatio proportio is i (0.4292, ) is 0 or 1.
13 Meaig of cofidece The iterval is radom. pˆ 2 pˆ(1, pˆ(1 The actual iterval varies sample by sample. Amog all possible itervals costructed this way, 95% of them will cotai the populatio proportio p. pˆ + 2
14 Meaig of cofidece Amog all possible itervals costructed this way, 95% of them will cotai the populatio proportio p.
15 Meaig of cofidece Whe we say we have 95% cofidece that the iterval (0.4292, ) cotais the true populatio proportio, we mea that we are 95% cofidet the iterval (0.4292, ) is oe of those itervals which cotais the true populatio proportio.
16 Margi of error The 95% cofidece iterval for p is pˆ 2 This is same as pˆ(1 pˆ ± 2, pˆ pˆ(1 + 2 pˆ(1 The extet of the iterval o either side of pis called the margi of error (ME). Margi of Error ^
17 Margi of error Margi of error measures our tolerace for error. It is closely related to cofidece level. For example, based o the CNN poll with =600, ^p=47%, which of the followig statemets are you more cofidet? The populatio proportio pof supportig Mr. Obama is betwee 0 ad 100%; pis betwee 43% ad 51%; pis betwee 45% ad 49%; pis betwee 46.9% ad 47.1%. Margi of error icreases as cofidece level icreases.
18 Margi of error The margi of error correspodig to 95% cofidece level is 2SE(p). ^ E.g. For the CNN poll, the stadard error is pˆ(1 0.47(1 0.47) SE ( = = = , 600 ad the margi of error correspodig to 95% cofidece level is 2(0.0204)= What is the margi of error correspodig to 99% cofidece level?
19 Margi of error ad critical values For cofidece itervals of populatio proportio, the margi of error equals z*se(p), ^ where z* is determied by the cofidece level C. z* is called the critical value correspodig to cofidece level C. Youmayfidz* withti usigbelowcommad: For C=(1-α)%, ivnorm( 1-α/2, 0,1) For example C=95%, α=0.05, 1-α/2=0.975, ivnorm( 0.975, 0,1)= C=90%, α=0.10, 1-α/2=0.95, ivnorm( 0.95, 0,1)=1.645 C=99%, α=0.01, 1-α/2=0.995, ivnorm( 0.995, 0,1)=2.575
20 Cofidece itervals I geeral the level C cofidece iterval for populatio proportio pis give by pˆ z * pˆ(1, pˆ + z * pˆ(1 where ^pis the sample proportio, is the sample size, ad z* is the critical value correspodig to the cofidece level C.
21 Cofidece itervals We may also use ˆ± ME p to deote the level C cofidece iterval for populatio proportio p, where ^pis the sample proportio ad ME is the margi of error: ME= z pˆ(1 * pˆ )
22 Cofidece itervals Practice A CNN poll shows that 47% of 600 surveyed Ohio voters will support Mr. Obama. We are iterested i the populatio proportio pof all Ohio voters who will support Mr. Obama. Costruct a 90% cofidece iterval for p. Costruct a 96% cofidece iterval for p. Costruct a 98% cofidece iterval for p.
23 Sample size Sample size for desired margi of error: The level C cofidece iterval for a populatio proportio pwill have margi of error approximately equal to a specified value mwhe the sample size is 2 * z = m p * (1 where p* is a guessed value for the sample proportio. The margi of error will be at most m if p* is take to be 0.5. p * )
24 Practice A isurace compay checks police records o 582 accidets selected at radom ad otes that teeagers were at the wheel i 91 of them. Create a 95% cofidece iterval for the percetage of all auto accidets that ivolve teeage drivers. Explai what 95% cofidece meas. A politicia urgig tighter restrictios o drivers liceses issued to tees says, I oe of every five auto accidets, a teeager is behid the wheel. Does our cofidece iterval support or cotradict this statemet? If this politicia wat to have a 95% cofidece iterval with margi of error 0.10, how large a sample should he survey?
25 Assumptios ad coditios Idepedece Assumptio: the sampled values must be idepedet of each other Radomizatio Coditio: a radom sample 10% Coditio: the sample size must be o larger tha 10% of the populatio Sample Size Assumptio: the sample size must be large eough Success/Failure Coditio: the sample size has to be big eough so that we expect at least 10 successes ad at least 10 failures.
26 Suggested exercises from the textbook: Ch19 7, 9, 11, 13, 21, 23, 25, 29, 31, 35, 37, 39, 41
Chapter 8: Estimating with Confidence
 Chapter 8: Estimatig with Cofidece Sectio 8.2 The Practice of Statistics, 4 th editio For AP* STARNES, YATES, MOORE Chapter 8 Estimatig with Cofidece 8.1 Cofidece Itervals: The Basics 8.2 8.3 Estimatig
STA Learning Objectives. Population Proportions. Module 10 Comparing Two Proportions. Upon completing this module, you should be able to:
 STA 2023 Module 10 Comparig Two Proportios Learig Objectives Upo completig this module, you should be able to: 1. Perform large-sample ifereces (hypothesis test ad cofidece itervals) to compare two populatio
Chapter 22. Comparing Two Proportions. Copyright 2010 Pearson Education, Inc.
 Chapter 22 Comparig Two Proportios Copyright 2010 Pearso Educatio, Ic. Comparig Two Proportios Comparisos betwee two percetages are much more commo tha questios about isolated percetages. Ad they are more
Chapter 22. Comparing Two Proportions. Copyright 2010, 2007, 2004 Pearson Education, Inc.
 Chapter 22 Comparig Two Proportios Copyright 2010, 2007, 2004 Pearso Educatio, Ic. Comparig Two Proportios Read the first two paragraphs of pg 504. Comparisos betwee two percetages are much more commo
Overview. p 2. Chapter 9. Pooled Estimate of. q = 1 p. Notation for Two Proportions. Inferences about Two Proportions. Assumptions
 Chapter 9 Slide Ifereces from Two Samples 9- Overview 9- Ifereces about Two Proportios 9- Ifereces about Two Meas: Idepedet Samples 9-4 Ifereces about Matched Pairs 9-5 Comparig Variatio i Two Samples
Instructor: Judith Canner Spring 2010 CONFIDENCE INTERVALS How do we make inferences about the population parameters?
 CONFIDENCE INTERVALS How do we make ifereces about the populatio parameters? The samplig distributio allows us to quatify the variability i sample statistics icludig how they differ from the parameter
(7 One- and Two-Sample Estimation Problem )
") 34 Stat Lecture Notes (7 Oe- ad Two-Sample Estimatio Problem ) ( Book*: Chapter 8,pg65) Probability& Statistics for Egieers & Scietists By Walpole, Myers, Myers, Ye Estimatio 1 ) ( ˆ S P i i Poit estimate:
34 Stat Lecture Notes (7 Oe- ad Two-Sample Estimatio Problem ) ( Book*: Chapter 8,pg65) Probability& Statistics for Egieers & Scietists By Walpole, Myers, Myers, Ye Estimatio 1 ) ( ˆ S P i i Poit estimate:
Topic 9: Sampling Distributions of Estimators
 Topic 9: Samplig Distributios of Estimators Course 003, 2016 Page 0 Samplig distributios of estimators Sice our estimators are statistics (particular fuctios of radom variables), their distributio ca be
MATH/STAT 352: Lecture 15
 MATH/STAT 352: Lecture 15 Sectios 5.2 ad 5.3. Large sample CI for a proportio ad small sample CI for a mea. 1 5.2: Cofidece Iterval for a Proportio Estimatig proportio of successes i a biomial experimet
A quick activity - Central Limit Theorem and Proportions. Lecture 21: Testing Proportions. Results from the GSS. Statistics and the General Population
 A quick activity - Cetral Limit Theorem ad Proportios Lecture 21: Testig Proportios Statistics 10 Coli Rudel Flip a coi 30 times this is goig to get loud! Record the umber of heads you obtaied ad calculate
Estimation of a population proportion March 23,
 1 Social Studies 201 Notes for March 23, 2005 Estimatio of a populatio proportio Sectio 8.5, p. 521. For the most part, we have dealt with meas ad stadard deviatios this semester. This sectio of the otes
Statistics 511 Additional Materials
 Cofidece Itervals o mu Statistics 511 Additioal Materials This topic officially moves us from probability to statistics. We begi to discuss makig ifereces about the populatio. Oe way to differetiate probability
Big Picture. 5. Data, Estimates, and Models: quantifying the accuracy of estimates.
 5. Data, Estimates, ad Models: quatifyig the accuracy of estimates. 5. Estimatig a Normal Mea 5.2 The Distributio of the Normal Sample Mea 5.3 Normal data, cofidece iterval for, kow 5.4 Normal data, cofidece
Econ 325 Notes on Point Estimator and Confidence Interval 1 By Hiro Kasahara
 Poit Estimator Eco 325 Notes o Poit Estimator ad Cofidece Iterval 1 By Hiro Kasahara Parameter, Estimator, ad Estimate The ormal probability desity fuctio is fully characterized by two costats: populatio
- E < p. ˆ p q ˆ E = q ˆ = 1 - p ˆ = sample proportion of x failures in a sample size of n. where. x n sample proportion. population proportion
 1 Chapter 7 ad 8 Review for Exam Chapter 7 Estimates ad Sample Sizes 2 Defiitio Cofidece Iterval (or Iterval Estimate) a rage (or a iterval) of values used to estimate the true value of the populatio parameter
Lecture 5. Materials Covered: Chapter 6 Suggested Exercises: 6.7, 6.9, 6.17, 6.20, 6.21, 6.41, 6.49, 6.52, 6.53, 6.62, 6.63.
 STT 315, Summer 006 Lecture 5 Materials Covered: Chapter 6 Suggested Exercises: 67, 69, 617, 60, 61, 641, 649, 65, 653, 66, 663 1 Defiitios Cofidece Iterval: A cofidece iterval is a iterval believed to
Confidence Intervals for the Population Proportion p
 Cofidece Itervals for the Populatio Proportio p The cocept of cofidece itervals for the populatio proportio p is the same as the oe for, the samplig distributio of the mea, x. The structure is idetical:
Topic 9: Sampling Distributions of Estimators
 Topic 9: Samplig Distributios of Estimators Course 003, 2018 Page 0 Samplig distributios of estimators Sice our estimators are statistics (particular fuctios of radom variables), their distributio ca be
BIOS 4110: Introduction to Biostatistics. Breheny. Lab #9
 BIOS 4110: Itroductio to Biostatistics Brehey Lab #9 The Cetral Limit Theorem is very importat i the realm of statistics, ad today's lab will explore the applicatio of it i both categorical ad cotiuous
AP Statistics Review Ch. 8
 AP Statistics Review Ch. 8 Name 1. Each figure below displays the samplig distributio of a statistic used to estimate a parameter. The true value of the populatio parameter is marked o each samplig distributio.
Inferential Statistics. Inference Process. Inferential Statistics and Probability a Holistic Approach. Inference Process.
 Iferetial Statistics ad Probability a Holistic Approach Iferece Process Chapter 8 Poit Estimatio ad Cofidece Itervals This Course Material by Maurice Geraghty is licesed uder a Creative Commos Attributio-ShareAlike
Exam II Covers. STA 291 Lecture 19. Exam II Next Tuesday 5-7pm Memorial Hall (Same place as exam I) Makeup Exam 7:15pm 9:15pm Location CB 234
 Makeup Exam 7:15pm 9:15pm Location CB 234") STA 291 Lecture 19 Exam II Next Tuesday 5-7pm Memorial Hall (Same place as exam I) Makeup Exam 7:15pm 9:15pm Locatio CB 234 STA 291 - Lecture 19 1 Exam II Covers Chapter 9 10.1; 10.2; 10.3; 10.4; 10.6
STA 291 Lecture 19 Exam II Next Tuesday 5-7pm Memorial Hall (Same place as exam I) Makeup Exam 7:15pm 9:15pm Locatio CB 234 STA 291 - Lecture 19 1 Exam II Covers Chapter 9 10.1; 10.2; 10.3; 10.4; 10.6
Mathacle. PSet Stats, Concepts In Statistics Level Number Name: Date: Confidence Interval Guesswork with Confidence
 PSet ----- Stats, Cocepts I Statistics Cofidece Iterval Guesswork with Cofidece VII. CONFIDENCE INTERVAL 7.1. Sigificace Level ad Cofidece Iterval (CI) The Sigificace Level The sigificace level, ofte deoted
Chapter 18 Summary Sampling Distribution Models
 Uit 5 Itroductio to Iferece Chapter 18 Summary Samplig Distributio Models What have we leared? Sample proportios ad meas will vary from sample to sample that s samplig error (samplig variability). Samplig
Common Large/Small Sample Tests 1/55
 Commo Large/Small Sample Tests 1/55 Test of Hypothesis for the Mea (σ Kow) Covert sample result ( x) to a z value Hypothesis Tests for µ Cosider the test H :μ = μ H 1 :μ > μ σ Kow (Assume the populatio
Confidence Interval for one population mean or one population proportion, continued. 1. Sample size estimation based on the large sample C.I.
 Cofidece Iterval for oe populatio mea or oe populatio proportio, cotiued 1. ample size estimatio based o the large sample C.I. for p ˆ(1 ˆ) ˆ(1 ˆ) From the iterval ˆ p p Z p ˆ, p Z p p L legh of your 100(1
Topic 9: Sampling Distributions of Estimators
 Topic 9: Samplig Distributios of Estimators Course 003, 2018 Page 0 Samplig distributios of estimators Sice our estimators are statistics (particular fuctios of radom variables), their distributio ca be
Introduction to Econometrics (3 rd Updated Edition) Solutions to Odd- Numbered End- of- Chapter Exercises: Chapter 3
 Solutions to Odd- Numbered End- of- Chapter Exercises: Chapter 3") Itroductio to Ecoometrics (3 rd Updated Editio) by James H. Stock ad Mark W. Watso Solutios to Odd- Numbered Ed- of- Chapter Exercises: Chapter 3 (This versio August 17, 014) 015 Pearso Educatio, Ic. Stock/Watso
Itroductio to Ecoometrics (3 rd Updated Editio) by James H. Stock ad Mark W. Watso Solutios to Odd- Numbered Ed- of- Chapter Exercises: Chapter 3 (This versio August 17, 014) 015 Pearso Educatio, Ic. Stock/Watso
7-1. Chapter 4. Part I. Sampling Distributions and Confidence Intervals
 7-1 Chapter 4 Part I. Samplig Distributios ad Cofidece Itervals 1 7- Sectio 1. Samplig Distributio 7-3 Usig Statistics Statistical Iferece: Predict ad forecast values of populatio parameters... Test hypotheses
S160 #12. Review of Large Sample Result for Sample Proportion
 S160 #12 Samplig Distributio of the Proportio, Part 2 JC Wag February 25, 2016 Review of Large Sample Result for Sample Proportio Recall that for large sample (ie, sample size is large, say p > 5 ad (1
CONFIDENCE INTERVALS STUDY GUIDE
 CONFIDENCE INTERVALS STUDY UIDE Last uit, we discussed how sample statistics vary. Uder the right coditios, sample statistics like meas ad proportios follow a Normal distributio, which allows us to calculate
S160 #12. Sampling Distribution of the Proportion, Part 2. JC Wang. February 25, 2016
 S160 #12 Samplig Distributio of the Proportio, Part 2 JC Wag February 25, 2016 Outlie 1 Estimatig Proportio Usig Itervals Cofidece Iterval for the Populatio Proportio iclicker Questios 2 JC Wag (WMU) S160
Statistical Inference (Chapter 10) Statistical inference = learn about a population based on the information provided by a sample.
 Statistical inference = learn about a population based on the information provided by a sample.") Statistical Iferece (Chapter 10) Statistical iferece = lear about a populatio based o the iformatio provided by a sample. Populatio: The set of all values of a radom variable X of iterest. Characterized
Statistical Iferece (Chapter 10) Statistical iferece = lear about a populatio based o the iformatio provided by a sample. Populatio: The set of all values of a radom variable X of iterest. Characterized
STAT 203 Chapter 18 Sampling Distribution Models
 STAT 203 Chapter 18 Samplig Distributio Models Populatio vs. sample, parameter vs. statistic Recall that a populatio cotais the etire collectio of idividuals that oe wats to study, ad a sample is a subset
Statistical Intervals for a Single Sample
 3/5/06 Applied Statistics ad Probability for Egieers Sixth Editio Douglas C. Motgomery George C. Ruger Chapter 8 Statistical Itervals for a Sigle Sample 8 CHAPTER OUTLINE 8- Cofidece Iterval o the Mea
Interval Estimation (Confidence Interval = C.I.): An interval estimate of some population parameter is an interval of the form (, ),
: An interval estimate of some population parameter is an interval of the form (, ),") Cofidece Iterval Estimatio Problems Suppose we have a populatio with some ukow parameter(s). Example: Normal(,) ad are parameters. We eed to draw coclusios (make ifereces) about the ukow parameters. We
Cofidece Iterval Estimatio Problems Suppose we have a populatio with some ukow parameter(s). Example: Normal(,) ad are parameters. We eed to draw coclusios (make ifereces) about the ukow parameters. We
1 Models for Matched Pairs
 1 Models for Matched Pairs Matched pairs occur whe we aalyse samples such that for each measuremet i oe of the samples there is a measuremet i the other sample that directly relates to the measuremet i
Expectation and Variance of a random variable
 Chapter 11 Expectatio ad Variace of a radom variable The aim of this lecture is to defie ad itroduce mathematical Expectatio ad variace of a fuctio of discrete & cotiuous radom variables ad the distributio
Mathacle. PSet Stats, Concepts In Statistics Level Number Name: Date:
 PSet ----- Stats, Cocepts I Statistics 7.3. Cofidece Iterval for a Mea i Oe Sample [MATH] The Cetral Limit Theorem. Let...,,, be idepedet, idetically distributed (i.i.d.) radom variables havig mea µ ad
Agreement of CI and HT. Lecture 13 - Tests of Proportions. Example - Waiting Times
 Sigificace level vs. cofidece level Agreemet of CI ad HT Lecture 13 - Tests of Proportios Sta102 / BME102 Coli Rudel October 15, 2014 Cofidece itervals ad hypothesis tests (almost) always agree, as log
ENGI 4421 Confidence Intervals (Two Samples) Page 12-01
 Page 12-01") ENGI 44 Cofidece Itervals (Two Samples) Page -0 Two Sample Cofidece Iterval for a Differece i Populatio Meas [Navidi sectios 5.4-5.7; Devore chapter 9] From the cetral limit theorem, we kow that, for sufficietly
ENGI 44 Cofidece Itervals (Two Samples) Page -0 Two Sample Cofidece Iterval for a Differece i Populatio Meas [Navidi sectios 5.4-5.7; Devore chapter 9] From the cetral limit theorem, we kow that, for sufficietly
Statistics 300: Elementary Statistics
 Statistics 300: Elemetary Statistics Sectios 7-, 7-3, 7-4, 7-5 Parameter Estimatio Poit Estimate Best sigle value to use Questio What is the probability this estimate is the correct value? Parameter Estimatio
Confidence Intervals รศ.ดร. อน นต ผลเพ ม Assoc.Prof. Anan Phonphoem, Ph.D. Intelligent Wireless Network Group (IWING Lab)
") Cofidece Itervals รศ.ดร. อน นต ผลเพ ม Assoc.Prof. Aa Phophoem, Ph.D. aa.p@ku.ac.th Itelliget Wireless Network Group (IWING Lab) http://iwig.cpe.ku.ac.th Computer Egieerig Departmet Kasetsart Uiversity,
Cofidece Itervals รศ.ดร. อน นต ผลเพ ม Assoc.Prof. Aa Phophoem, Ph.D. aa.p@ku.ac.th Itelliget Wireless Network Group (IWING Lab) http://iwig.cpe.ku.ac.th Computer Egieerig Departmet Kasetsart Uiversity,
MATH 320: Probability and Statistics 9. Estimation and Testing of Parameters. Readings: Pruim, Chapter 4
 MATH 30: Probability ad Statistics 9. Estimatio ad Testig of Parameters Estimatio ad Testig of Parameters We have bee dealig situatios i which we have full kowledge of the distributio of a radom variable.
Estimating the Population Mean - when a sample average is calculated we can create an interval centered on this average
 6. Cofidece Iterval for the Populatio Mea p58 Estimatig the Populatio Mea - whe a sample average is calculated we ca create a iterval cetered o this average x-bar - at a predetermied level of cofidece
Homework 5 Solutions
 Homework 5 Solutios p329 # 12 No. To estimate the chace you eed the expected value ad stadard error. To do get the expected value you eed the average of the box ad to get the stadard error you eed the
KLMED8004 Medical statistics. Part I, autumn Estimation. We have previously learned: Population and sample. New questions
 We have previously leared: KLMED8004 Medical statistics Part I, autum 00 How kow probability distributios (e.g. biomial distributio, ormal distributio) with kow populatio parameters (mea, variace) ca give
Sample Size Determination (Two or More Samples)
") Sample Sie Determiatio (Two or More Samples) STATGRAPHICS Rev. 963 Summary... Data Iput... Aalysis Summary... 5 Power Curve... 5 Calculatios... 6 Summary This procedure determies a suitable sample sie
Sample Sie Determiatio (Two or More Samples) STATGRAPHICS Rev. 963 Summary... Data Iput... Aalysis Summary... 5 Power Curve... 5 Calculatios... 6 Summary This procedure determies a suitable sample sie
Working with Two Populations. Comparing Two Means
 Workig with Two Populatios Comparig Two Meas Coditios for Two-Sample Iferece The data are from two radom samples from two distict idepedet populatios. Normality. Two sample t procedures are more robust
Sampling Error. Chapter 6 Student Lecture Notes 6-1. Business Statistics: A Decision-Making Approach, 6e. Chapter Goals
 Chapter 6 Studet Lecture Notes 6-1 Busiess Statistics: A Decisio-Makig Approach 6 th Editio Chapter 6 Itroductio to Samplig Distributios Chap 6-1 Chapter Goals After completig this chapter, you should
MBACATÓLICA. Quantitative Methods. Faculdade de Ciências Económicas e Empresariais UNIVERSIDADE CATÓLICA PORTUGUESA 9. SAMPLING DISTRIBUTIONS
 MBACATÓLICA Quatitative Methods Miguel Gouveia Mauel Leite Moteiro Faculdade de Ciêcias Ecoómicas e Empresariais UNIVERSIDADE CATÓLICA PORTUGUESA 9. SAMPLING DISTRIBUTIONS MBACatólica 006/07 Métodos Quatitativos
Chapter 20. Comparing Two Proportions. BPS - 5th Ed. Chapter 20 1
 Chapter 0 Comparig Two Proportios BPS - 5th Ed. Chapter 0 Case Study Machie Reliability A study is performed to test of the reliability of products produced by two machies. Machie A produced 8 defective
MOST PEOPLE WOULD RATHER LIVE WITH A PROBLEM THEY CAN'T SOLVE, THAN ACCEPT A SOLUTION THEY CAN'T UNDERSTAND.
 XI-1 (1074) MOST PEOPLE WOULD RATHER LIVE WITH A PROBLEM THEY CAN'T SOLVE, THAN ACCEPT A SOLUTION THEY CAN'T UNDERSTAND. R. E. D. WOOLSEY AND H. S. SWANSON XI-2 (1075) STATISTICAL DECISION MAKING Advaced
Math 140 Introductory Statistics
 8.2 Testig a Proportio Math 1 Itroductory Statistics Professor B. Abrego Lecture 15 Sectios 8.2 People ofte make decisios with data by comparig the results from a sample to some predetermied stadard. These
Sampling Distributions, Z-Tests, Power
 Samplig Distributios, Z-Tests, Power We draw ifereces about populatio parameters from sample statistics Sample proportio approximates populatio proportio Sample mea approximates populatio mea Sample variace
STAT 155 Introductory Statistics Chapter 6: Introduction to Inference. Lecture 18: Estimation with Confidence
 The UNIVERSITY of NORTH CAROLINA at CHAPEL HILL STAT 155 Itroductory Statistics Chapter 6: Itroductio to Iferece Lecture 18: Estimatio with Cofidece 11/14/06 Lecture 18 1 Itroductio Statistical Iferece
Stat 200 -Testing Summary Page 1
 Stat 00 -Testig Summary Page 1 Mathematicias are like Frechme; whatever you say to them, they traslate it ito their ow laguage ad forthwith it is somethig etirely differet Goethe 1 Large Sample Cofidece
The variance of a sum of independent variables is the sum of their variances, since covariances are zero. Therefore. V (xi )= n n 2 σ2 = σ2.
= n n 2 σ2 = σ2.") SAMPLE STATISTICS A radom sample x 1,x,,x from a distributio f(x) is a set of idepedetly ad idetically variables with x i f(x) for all i Their joit pdf is f(x 1,x,,x )=f(x 1 )f(x ) f(x )= f(x i ) The sample
SAMPLE STATISTICS A radom sample x 1,x,,x from a distributio f(x) is a set of idepedetly ad idetically variables with x i f(x) for all i Their joit pdf is f(x 1,x,,x )=f(x 1 )f(x ) f(x )= f(x i ) The sample
UNIT 8: INTRODUCTION TO INTERVAL ESTIMATION
 STATISTICAL METHODS FOR BUSINESS UNIT 8: INTRODUCTION TO INTERVAL ESTIMATION 8..- Itroductio to iterval estimatio 8..- Cofidece itervals. Costructio ad characteristics 8.3.- Cofidece itervals for the mea
Statistical inference: example 1. Inferential Statistics
 Statistical iferece: example 1 Iferetial Statistics POPULATION SAMPLE A clothig store chai regularly buys from a supplier large quatities of a certai piece of clothig. Each item ca be classified either
STATISTICAL PROPERTIES OF LEAST SQUARES ESTIMATORS. Comments:
 Recall: STATISTICAL PROPERTIES OF LEAST SQUARES ESTIMATORS Commets:. So far we have estimates of the parameters! 0 ad!, but have o idea how good these estimates are. Assumptio: E(Y x)! 0 +! x (liear coditioal
Lesson 7: Estimation 7.3 Estimation of Population Proportio. 1-PropZInterval
 Lesso 7: Estimatio 7.3 Estimatio of Populatio Proportio p 1-PropZIterval October 18 Goals Preview Compute a cofidece iterval of the populatio proportio p. Cofidece Iterval for p We would estimate the populatio
Discrete Mathematics for CS Spring 2008 David Wagner Note 22
 CS 70 Discrete Mathematics for CS Sprig 2008 David Wager Note 22 I.I.D. Radom Variables Estimatig the bias of a coi Questio: We wat to estimate the proportio p of Democrats i the US populatio, by takig
1 Inferential Methods for Correlation and Regression Analysis
 1 Iferetial Methods for Correlatio ad Regressio Aalysis I the chapter o Correlatio ad Regressio Aalysis tools for describig bivariate cotiuous data were itroduced. The sample Pearso Correlatio Coefficiet
Simple Random Sampling!
 Simple Radom Samplig! Professor Ro Fricker! Naval Postgraduate School! Moterey, Califoria! Readig:! 3/26/13 Scheaffer et al. chapter 4! 1 Goals for this Lecture! Defie simple radom samplig (SRS) ad discuss
Announcements. Unit 5: Inference for Categorical Data Lecture 1: Inference for a single proportion
 Housekeepig Aoucemets Uit 5: Iferece for Categorical Data Lecture 1: Iferece for a sigle proportio Statistics 101 Mie Çetikaya-Rudel PA 4 due Friday at 5pm (exteded) PS 6 due Thursday, Oct 30 October 23,
This chapter focuses on two experimental designs that are crucial to comparative studies: (1) independent samples and (2) matched pair samples.
 independent samples and (2) matched pair samples.") Chapter 9 & : Comparig Two Treatmets: This chapter focuses o two eperimetal desigs that are crucial to comparative studies: () idepedet samples ad () matched pair samples Idepedet Radom amples from Two
Chapter 9 & : Comparig Two Treatmets: This chapter focuses o two eperimetal desigs that are crucial to comparative studies: () idepedet samples ad () matched pair samples Idepedet Radom amples from Two
This is an introductory course in Analysis of Variance and Design of Experiments.
 1 Notes for M 384E, Wedesday, Jauary 21, 2009 (Please ote: I will ot pass out hard-copy class otes i future classes. If there are writte class otes, they will be posted o the web by the ight before class
Properties and Hypothesis Testing
 Chapter 3 Properties ad Hypothesis Testig 3.1 Types of data The regressio techiques developed i previous chapters ca be applied to three differet kids of data. 1. Cross-sectioal data. 2. Time series data.
Section 9.2. Tests About a Population Proportion 12/17/2014. Carrying Out a Significance Test H A N T. Parameters & Hypothesis
 Sectio 9.2 Tests About a Populatio Proportio P H A N T O M S Parameters Hypothesis Assess Coditios Name the Test Test Statistic (Calculate) Obtai P value Make a decisio State coclusio Sectio 9.2 Tests
Frequentist Inference
 Frequetist Iferece The topics of the ext three sectios are useful applicatios of the Cetral Limit Theorem. Without kowig aythig about the uderlyig distributio of a sequece of radom variables {X i }, for
October 25, 2018 BIM 105 Probability and Statistics for Biomedical Engineers 1
 October 25, 2018 BIM 105 Probability ad Statistics for Biomedical Egieers 1 Populatio parameters ad Sample Statistics October 25, 2018 BIM 105 Probability ad Statistics for Biomedical Egieers 2 Ifereces
24.1 Confidence Intervals and Margins of Error
 24.1 Cofidece Itervals ad Margis of Error Essetial Questio: How do you calculate a cofidece iterval ad a margi of error for a populatio proportio or populatio mea? Resource Locker Explore Idetifyig Likely
Solutions. Discussion D1. a. The middle 95% of a sampling distribution for a binomial proportion ˆp is cut off by the two points
 formulas at the AP Exam. Studets should be able to derive it from the expressio for margi of error E i the formula for the cofidece iterval, amely, E z p(1 p) Modelig Good Aswers Oce studets have completed
Computing Confidence Intervals for Sample Data
 Computig Cofidece Itervals for Sample Data Topics Use of Statistics Sources of errors Accuracy, precisio, resolutio A mathematical model of errors Cofidece itervals For meas For variaces For proportios
Comparing Two Populations. Topic 15 - Two Sample Inference I. Comparing Two Means. Comparing Two Pop Means. Background Reading
 Topic 15 - Two Sample Iferece I STAT 511 Professor Bruce Craig Comparig Two Populatios Research ofte ivolves the compariso of two or more samples from differet populatios Graphical summaries provide visual
Simulation. Two Rule For Inverting A Distribution Function
 Simulatio Two Rule For Ivertig A Distributio Fuctio Rule 1. If F(x) = u is costat o a iterval [x 1, x 2 ), the the uiform value u is mapped oto x 2 through the iversio process. Rule 2. If there is a jump
Recall the study where we estimated the difference between mean systolic blood pressure levels of users of oral contraceptives and non-users, x - y.
 Testig Statistical Hypotheses Recall the study where we estimated the differece betwee mea systolic blood pressure levels of users of oral cotraceptives ad o-users, x - y. Such studies are sometimes viewed
FACULTY OF MATHEMATICAL STUDIES MATHEMATICS FOR PART I ENGINEERING. Lectures
 FACULTY OF MATHEMATICAL STUDIES MATHEMATICS FOR PART I ENGINEERING Lectures MODULE 5 STATISTICS II. Mea ad stadard error of sample data. Biomial distributio. Normal distributio 4. Samplig 5. Cofidece itervals
Stat 421-SP2012 Interval Estimation Section
 Stat 41-SP01 Iterval Estimatio Sectio 11.1-11. We ow uderstad (Chapter 10) how to fid poit estimators of a ukow parameter. o However, a poit estimate does ot provide ay iformatio about the ucertaity (possible
Confidence intervals summary Conservative and approximate confidence intervals for a binomial p Examples. MATH1005 Statistics. Lecture 24. M.
 MATH1005 Statistics Lecture 24 M. Stewart School of Mathematics ad Statistics Uiversity of Sydey Outlie Cofidece itervals summary Coservative ad approximate cofidece itervals for a biomial p The aïve iterval
April 18, 2017 CONFIDENCE INTERVALS AND HYPOTHESIS TESTING, UNDERGRADUATE MATH 526 STYLE
 April 18, 2017 CONFIDENCE INTERVALS AND HYPOTHESIS TESTING, UNDERGRADUATE MATH 526 STYLE TERRY SOO Abstract These otes are adapted from whe I taught Math 526 ad meat to give a quick itroductio to cofidece
Understanding Dissimilarity Among Samples
 Aoucemets: Midterm is Wed. Review sheet is o class webpage (i the list of lectures) ad will be covered i discussio o Moday. Two sheets of otes are allowed, same rules as for the oe sheet last time. Office
Stat 225 Lecture Notes Week 7, Chapter 8 and 11
 Normal Distributio Stat 5 Lecture Notes Week 7, Chapter 8 ad Please also prit out the ormal radom variable table from the Stat 5 homepage. The ormal distributio is by far the most importat distributio
Introduction There are two really interesting things to do in statistics.
 ECON 497 Lecture Notes E Page 1 of 1 Metropolita State Uiversity ECON 497: Research ad Forecastig Lecture Notes E: Samplig Distributios Itroductio There are two really iterestig thigs to do i statistics.
Hypothesis Testing. Evaluation of Performance of Learned h. Issues. Trade-off Between Bias and Variance
 Hypothesis Testig Empirically evaluatig accuracy of hypotheses: importat activity i ML. Three questios: Give observed accuracy over a sample set, how well does this estimate apply over additioal samples?
24.1. Confidence Intervals and Margins of Error. Engage Confidence Intervals and Margins of Error. Learning Objective
 24.1 Cofidece Itervals ad Margis of Error Essetial Questio: How do you calculate a cofidece iterval ad a margi of error for a populatio proportio or populatio mea? Resource Locker LESSON 24.1 Cofidece
Statistics 20: Final Exam Solutions Summer Session 2007
 1. 20 poits Testig for Diabetes. Statistics 20: Fial Exam Solutios Summer Sessio 2007 (a) 3 poits Give estimates for the sesitivity of Test I ad of Test II. Solutio: 156 patiets out of total 223 patiets
Chapter 8: STATISTICAL INTERVALS FOR A SINGLE SAMPLE. Part 3: Summary of CI for µ Confidence Interval for a Population Proportion p
 Chapter 8: STATISTICAL INTERVALS FOR A SINGLE SAMPLE Part 3: Summary of CI for µ Cofidece Iterval for a Populatio Proportio p Sectio 8-4 Summary for creatig a 100(1-α)% CI for µ: Whe σ 2 is kow ad paret
Statistical Inference About Means and Proportions With Two Populations
 Departmet of Quatitative Methods & Iformatio Systems Itroductio to Busiess Statistics QM 220 Chapter 10 Statistical Iferece About Meas ad Proportios With Two Populatios Fall 2010 Dr. Mohammad Zaial 1 Chapter
PSYCHOLOGICAL RESEARCH (PYC 304-C) Lecture 9
 Lecture 9") Hypothesis testig PSYCHOLOGICAL RESEARCH (PYC 34-C Lecture 9 Statistical iferece is that brach of Statistics i which oe typically makes a statemet about a populatio based upo the results of a sample. I
Hypothesis testig PSYCHOLOGICAL RESEARCH (PYC 34-C Lecture 9 Statistical iferece is that brach of Statistics i which oe typically makes a statemet about a populatio based upo the results of a sample. I
If, for instance, we were required to test whether the population mean μ could be equal to a certain value μ
 STATISTICAL INFERENCE INTRODUCTION Statistical iferece is that brach of Statistics i which oe typically makes a statemet about a populatio based upo the results of a sample. I oesample testig, we essetially
Mathematical Notation Math Introduction to Applied Statistics
 Mathematical Notatio Math 113 - Itroductio to Applied Statistics Name : Use Word or WordPerfect to recreate the followig documets. Each article is worth 10 poits ad ca be prited ad give to the istructor
Statistical Inference Procedures
 Statitical Iferece Procedure Cofidece Iterval Hypothei Tet Statitical iferece produce awer to pecific quetio about the populatio of iteret baed o the iformatio i a ample. Iferece procedure mut iclude a
Creative Commons Attribution-NonCommercial-Share Alike License
 Author: Breda Guderso, Ph.D., 2015 Licese: Uless otherwise oted, this material is made available uder the terms of the Creative Commos Attributio- NoCommercial-Share Alike 3.0 Uported Licese: http://creativecommos.org/liceses/by-c-sa/3.0/
Read through these prior to coming to the test and follow them when you take your test.
 Math 143 Sprig 2012 Test 2 Iformatio 1 Test 2 will be give i class o Thursday April 5. Material Covered The test is cummulative, but will emphasize the recet material (Chapters 6 8, 10 11, ad Sectios 12.1
Final Examination Solutions 17/6/2010
 The Islamic Uiversity of Gaza Faculty of Commerce epartmet of Ecoomics ad Political Scieces A Itroductio to Statistics Course (ECOE 30) Sprig Semester 009-00 Fial Eamiatio Solutios 7/6/00 Name: I: Istructor:
Chapter 1 (Definitions)
") FINAL EXAM REVIEW Chapter 1 (Defiitios) Qualitative: Nomial: Ordial: Quatitative: Ordial: Iterval: Ratio: Observatioal Study: Desiged Experimet: Samplig: Cluster: Stratified: Systematic: Coveiece: Simple
FINAL EXAM REVIEW Chapter 1 (Defiitios) Qualitative: Nomial: Ordial: Quatitative: Ordial: Iterval: Ratio: Observatioal Study: Desiged Experimet: Samplig: Cluster: Stratified: Systematic: Coveiece: Simple
MIT : Quantitative Reasoning and Statistical Methods for Planning I
 MIT 11.220 Sprig 06 Recitatio 4 March 16, 2006 MIT - 11.220: Quatitative Reasoig ad Statistical Methods for Plaig I Recitatio #4: Sprig 2006 Cofidece Itervals ad Hypothesis Testig I. Cofidece Iterval 1.
STAT 350 Handout 19 Sampling Distribution, Central Limit Theorem (6.6)
") STAT 350 Hadout 9 Samplig Distributio, Cetral Limit Theorem (6.6) A radom sample is a sequece of radom variables X, X 2,, X that are idepedet ad idetically distributed. o This property is ofte abbreviated
STAT 350 Hadout 9 Samplig Distributio, Cetral Limit Theorem (6.6) A radom sample is a sequece of radom variables X, X 2,, X that are idepedet ad idetically distributed. o This property is ofte abbreviated