DYNAMIC IMPLOSION OF UNDERWATER CYLINDRICAL SHELLS: Experiments and Computations. January 2013
|
|
|
- Erik Quinn
- 6 years ago
- Views:
Transcription
1 DYNAMIC IMPLOSION OF UNDERWATER CYLINDRICAL SHELLS: Experiments and Computations by C. Farhat 1,2,3, K. Wang 3, A. Main, S. Kyriakides 4, L.-H. Lee 4, K. Ravi-Chandar 4, and T. Belytschko 5 1 Department of Aeronautics and Astronautics, Stanford University 2 Department of Mechanical Engineering, Stanford University 3 Institute for Computational and Mathematical Engineering, Stanford University 4 Research Center for Mechanics of Solids, Structures & Materials University of Texas at Austin 5 Department of Mechanical Engineering, Northwestern University January 2013
2 Abstract The implosion of an underwater structure is a dynamic event caused by the ambient constant pressure environment. It produces a short duration pressure pulse that radiates outwards and can damage adjacent structures. This paper presents results from a combined experimental/numerical study that aims to understand the underlying physics and establish the parameters that govern the nature of such pressure pulses. Collapse experiments on small-scale metal shells were conducted in a custom testing facility under constant pressure conditions representative of those in deep waters. The dynamic collapse of the shells was monitored using high-speed photography and the pressure around the structure with dynamic pressure transducers. Synchronization of the high-speed images with the data acquisition allowed temporal and spatial resolution of the events and the pressure pulses. Results from two experiments on shells that buckled and collapses in modes 4 and 2 are reported. A computational framework developed for the solution of highly nonlinear fluid-structure interaction problems characterized by shocks, large deformations, and self-contact is outlined. It features an Eulerian embedded boundary method for Computational Fluid Dynamics capable of achieving secondorder spatial accuracy including at the fluid-structure interface; an explicit structural analyzer with nonlinear geometric, material, and contact capabilities; and a loosely-coupled implicitexplicit fluid-structure time-integrator with a second-order time-accuracy and excellent numerical stability properties. The numerical tool is used to simulate the two experiments and shown to reproduce with good accuracy both the large deformations of the structure as well as the compression waves that emanate from it. The results demonstrate that the pressure pulse generated is influenced by the mode of buckling as well as the associated localization of collapse.
3 1. INTRODUCTION The buckling of structures under external pressure is a classical stability problem that has received significant attention from the research community because it is a major design criterion for underwater structures (e.g., see Timoshenko and Gere [1961], Singer et al. [2002]). For metal structures such as cylindrical and spherical shells, buckling can start in the elastic regime but inelastic material behavior leads to catastrophic collapse. In a constant pressure environment like that in deep waters, the collapse is dynamic and the structure interacts with the surrounding fluid. The term implosion, as used here, refers to such a dynamic event. Although typically the designer of such structures is mainly concerned with avoidance of buckling and collapse, in some applications the dynamics of such implosion is of interest. In its simplest form, the fast inward traveling water surrounding the receding walls of a collapsing structure stops suddenly when the walls come into contact and reflect as shockwaves. Such pressure pulses can be large enough to damage adjacent structures and must be understood (Turner and Ambrico [2013]). The problem is further complicated if the collapsing structure fractures or fragments due to the additional interaction between the air inside the structure and the inward rushing water. The significant amplitude, short duration and generally the signature of emanating pressure pulses were first recorded in experiments on glass spheres (e.g., Orr and Schoenberg [1976], Harben and Boro [2001], Turner [2007]), which under external pressure implode and shatter. The potential of destruction to neighboring structures was demonstrated in a 2001 accident that occurred at the Super-Kamiokande facility in Japan. The facility uses a large number of glass photomultiplier tubes in an underground tank filled with water to detect the mass of neutrinos. It was reported that during one filling of the tank one of the tubes imploded. The resultant shock damaged neighboring tubes causing them to implode; they in turn triggered their neighbors to implode and in this manner about 7,000 of the 11,000 tubes were destroyed in a short time leading to the closure of the facility for several months for expensive repairs (Cartlidge [2001]). The influence of the pressurizing medium on the dynamic collapse of long tubes under external pressure has also been observed in the related problem of dynamic buckle propagation and arrest in offshore pipelines. In such long structures, collapse under external pressure starts locally but can propagate at velocities of the order of hundreds of m/s to quickly destroy essentially the whole structure. Experiments have shown that the velocity of buckle propagation 1
4 is significantly lower if the pressurizing medium is water rather than air (Kyriakides and Babcock [1979], Kyriakides and Netto [2000]). One way of limiting the extent of this catastrophic collapse is to periodically install ring stiffeners buckle arrestors at regular intervals along the line. The design of buckle arrestors requires understanding of the dynamics of the problem and the associated fluid-structure interaction (Netto and Kyriakides [2000a]). Dynamic propagation and arrest in air or vacuum have been simulated numerically successfully (Netto and Kyriakides [2000b]). Recognizing that compressibility of water plays a role in the radiated energy, the velocity of propagation has been calculated using an approximate fluid structure interaction model with some success (Song and Tassoulas, [1993], Netto et al. [1999]). The aim of the present study has been: (a) to use experiments to establish the signature of pressure pulses emanating from imploding submerged metal structures; (b) to report on a numerical model that can simulate the transient high-speed fluid structure interaction problem characterized by ultrahigh compressions, shock waves, large structural displacements and deformations, and self-contact; (c) to use the results to understand the factors that influence the signatures of such pressure pulses. This paper describes the progress made in characterizing and simulating the implosion problem. Section 2 briefly outlines the experimental facility developed for this study and then presents detailed results from two representative experiments (out of tens performed). Section 3 outlines the formulation behind the dynamic fluid and structural models developed and their interaction. Section 4 compares critically the results from simulations to those from the experiments, and Section 5 summarizes conclusions from this comparison. 2. EXPERIMENTAL STUDY 2.1. Implosion Experimental Set-up Implosion is the dynamic collapse of an underwater structure or volume under constant pressure conditions. Part of the energy associated with the reduction of volume due to collapse is radiated out as a pressure wave. Of interest to this investigation is the signature of the emanating pressure pulse that is embodied in its peak amplitude, duration and impulse. Thus, the first objective of the investigation was to develop a custom pressure testing facility in which the constant pressure subsea conditions can be replicated, implosion events can be monitored, and the emanating pressure pulses recorded, free of interference from reflections. A photograph of the custom implosion facility is shown in Fig. 1a and in a schematic diagram in Fig. 1b. It consists of a 54-inch (1370 mm) internal diameter cylindrical pressure vessel with elliptical end- 2
5 caps. The vessel has an overall length of 102 in (3000 mm) and a seam-to-seam length of 72 in (1830 mm). These dimensions provide a reflection-free time window of approximately 1 ms. The facility has a pressure capacity of 1440 psi (100 bar) and can be pressurized by compressed air or water. It sits at a small inclination of 1.2 o to the horizontal with an access hole in the top serving as a vent (see Fig. 1). The vessel has an 18-inch (457 mm) diameter opening equipped with a Sentry quick opening door that allows operator access to the inside of the pressure vessel. A 6-inch (152 mm) opening on the opposite side is used for electrical signal access. Five 4-inch diameter windows arranged circumferentially at mid-length, as shown in the cross sectional view in Fig. 2, are used for lighting and observing the implosion events. The facility was used to monitor the dynamic collapse of circular cylindrical shell specimens with diameters of in (25-38 mm), various lengths and wall thicknesses. The shell is closed with solid steel plugs bonded in place as shown for example in Fig. 3a. It is then mounted onto a relatively unobtrusive adjustable cage-like frame in a way that allows free axial motion as shown in Fig. 4. The cage hangs in the vessel from thin wires that allow placement of the specimen in the vessel at the desired position typically placed slightly below the axis of the vessel. The slim construction of the cage was chosen so as to minimize interference with the pressure pulse that emanates from the structure when it implodes. The dynamic pressure associated with an implosion event is monitored with eight PCB Piezotronics-138A06 Underwater ICP Blast dynamic pressure sensors. In the experiments described here six of them were located in a circular arrangement at the mid-span of the specimen and two on the sides as shown in Fig. 4. The sensors were typically placed approximately one shell diameter from the surface of the shell, but the exact locations were recorded prior to each test. The vessel is filled with water leaving a small air pocket at the top. It is pressurized with air using a pair of air boosters. Each specimen is designed to implode at a particular pressure. The pressure is gradually increased until the shell implodes. The test set-up provides a soft loading system that ensures that the far field pressure remains essentially constant during implosion despite the small increase in the internal volume of the vessel caused by the collapse of the shell. 3
6 The dynamic pressure sensors consist of a tourmaline piezoelectric crystal enclosed in a soft polymeric tube filled with silicone oil. The crystal is connected to a signal conditioner (Dytran Instruments 4114B1) outside the vessel through a coaxial cable. Special hermetically sealed connectors were used to bring the cables outside the tank. The sensors have a resolution of 0.1 psi (0.69 kpa), a rise time of 1.5 µs, and a resonant frequency of 1 MHz. The sensor signals are monitored via a National Instruments high-speed data acquisition system. The system consists of a PXI-1042Q chassis, an 8-channel PXI-6123 acquisition card, and a NI PXI-8196 PC using LabView. The system records at a rate of 500 khz with a 16-bit resolution per channel data points are acquired per channel over a total period of 16 ms. The system continuously records data, saving them when the signal from one of the sensors triggers it by reaching a predefined voltage. Data from the eight sensors are stored beginning at 8 ms before the trigger and ending at 8 ms after the trigger. The static pressure in the vessel is monitored by pressure gages and a pressure transducer connected to a separate data acquisition system. The implosion event is monitored by one or two Photron Fastcam SA1 high-speed digital cameras looking through the windows as shown in Fig. 2. Zoom lenses enable viewing the entire length of the specimen for each case. The remaining windows are used to light the specimen with high intensity halogen lamps. To avoid overheating the PMMA windows, the lamps were turned on when the vessel pressure approached the calculated collapse pressure of the shell, and off soon after implosion. The cameras were run at 6,000-12,000 frames/s and images were captured at a resolution of about pixels storing events spanning up to 1.5 s. As with the data acquisition system, the cameras are continuously capturing images but start to record them when triggered by a TTL signal from a pulse generator. The cameras are triggered by the same pressure signal as the data acquisition system. The trigger option was set at the center of the 1.5 s recording time, so that images pre- and post- the implosion event were recorded. A unique feature of the testing facility is synchronization of the high-speed data acquisition system with the high-speed camera so that correspondence between the pressure signals and the images is achieved to within a few microseconds. This is accomplished by establishing a time relationship between the pressure and the video image time intervals based on the common trigger. 4
7 2.2. Experimental Results a. L/D = 2.0 The first experiment to be analyzed involves a 1.5-inch diameter seamless Al-6061-T6 shell with a length-to-diameter ratio ( L / D) of 2.0 and a diameter-to-thickness ratio ( D/t) of 53.6 (see Table 1 for main dimensional and material parameters). The shell was sealed with solid steel plugs that penetrate it by 1.0 in (25 mm) as shown in Fig. 3a. The plugs have rounded ends and are bonded in place using epoxy, leaving the innermost 0.3 in (7.5 mm) unbonded. Table 1 Main geometric and material parameters of shells tested Exp. No. Tube No. IMP69 A12 IMP88 A18 D in (mm) (38.1) (38.2) t in (mm) (0.711) (0.711) L D " o (%) " o (%) E Msi (GPa) 10.1 (69.6) 10.3 (70.8)! o ksi (MPa) (270) (304) P CO psi (bar) 676 (44.6) 197 (13.6) Mode (φ ο ) 4 (37) 2 (0) The shell collapsed in mode 4 at a pressure of 676 psi (44.6 bar), a level that is close to the critical pressure predicted by elastic buckling shell analysis (e.g., Timoshenko and Gere [1962], Brush and Almroth [1975]). The event was captured with digital photography at a speed of 6,250 frames/s. Figure 5 shows a set of seven images of the dynamic collapse of the shell recorded by the LHS camera in Fig. 2. The locations of the crystals of the six central sensors are shown in Fig. 3b, which also shows schematically the orientation of the four extrados of the collapse mode. Figures 6a-6d show the dynamic pressure signals recorded from four of the sensors over a period of 3 ms. The times corresponding to the images are marked with numbered bullets on the four pressure signals. A post-test photograph of the collapsed shell is shown in Fig. 7a. With the exception of a minor tear seen on the LHS of this photograph, the shell collapsed essentially intact (the tear is also seen on the top RHS of images to in Fig. 5). As is typical for drawn or extruded tubes, the tubular specimen exhibited a small amount of wall eccentricity " o = 2.3% defined by " o = (t max # t min ) /(t max + t min ). This was sufficient to cause a small asymmetry in the collapse 5
8 mode with one side of the collapse penetrating more than the other three as illustrated in Fig. 7b. The small asymmetry resulted in some bending of the shell that can be seen to develop in images to in Fig. 5. In this case, the slightly thinner side of the shell was at the bottom and thus the bending occurred in the vertical plane of Fig. 5. In image at T = ms, the shell is intact and all pressure signals remain at zero. The walls start to recede at approximately ms and simultaneously the dynamic sensors start recording a drop in the pressure. The receding walls can be seen in image at T = ms. In image at T = ms, the walls continue to recede, the mode 4 collapse is clearly visible and the pressure continues to drop at all four locations. The drop in pressure with time differs to some degree between the four sensors because of differences in their locations relative to the four troughs that form. The minimum value of -124 psi (8.55 bar) is recorded by sensor 6 (the minimum pressures at the other locations are listed under P min in Table 2 see definition schematic in Fig. 8). Beyond image, the inward motion of the collapsing walls starts to decelerate due to the built-up of axial tension and the inertial forces from the solid end-plugs. The deceleration leads to an increase in pressure so that by image at ms the pressure is near zero for all four sensors. The duration of the four negative pulses ( "T # in Fig. 8) given in Table 2 varies somewhat but is of the order of 0.80 ms. We define the pressure impulse, I ", as the time integral of the pressure over "T # and the values are listed in Table 2 (see also Fig. 8). Sens. No Table 2 Characteristics of the pressure pulses for Exp. IMP69 P min psi (bar) -118 (-8.14) -94 (-6.48) -113 (-7.79) -124 (-8.55) "T # ms I " psi.ms (bar.ms) (2.54) (2.21) (2.57) (2.78) P max psi (bar) 472 (32.55) 349 (24.07) 416 (28.69) 622 (42.90) "T + ms I + psi.ms (bar.ms) (2.61) (2.21) (2.66) (2.72) We estimate that just past image at ms the walls of the collapsing shell start to come into contact, abruptly stopping the inward travel of water, which results in compression waves radiating outwards. These are captured by the four sensors as sharp positive pressure 6
9 pulses. The overall duration of the pressure pulses, listed in Table 2 under "T +, is of the order of ms. The positive pressure pulses exhibit an initial high pressure spike followed shortly thereafter by a number of lower secondary ones most prominently displayed by sensor 1 in Fig. 6a. The higher pressure spikes were recorded by sensors 6 and 1, 622 psi and 472 psi respectively (42.9 and 32.6 bar) while sensors 3 and 5 recorded spikes of 349 and 416 psi (24.1 and 28.7 bar) respectively. By image at T = 0.13 ms, the shell is fully collapsed and starts to bend slightly upwards and the recoded pressure is on the way down for all sensors. The pressure reaches zero level at all four locations by approximately T = 0.20 ms. A small negative depression develops followed by a small pressure peak at T = 0.29 ms which corresponds with image. The extent of the deformation of the shell remains the same but the overall bending has increased slightly. By image at 0.45 ms, the implosion is fully completed and the pressure hovers about zero level for all sensors. The pressure disturbance between 0.88 and 1.15 ms is influenced by reflections from the tank wall. Image shows the shell to have experienced slightly more overall bending. The positive pressure impulses, I +, as defined in Fig. 8 are listed in Table 2. They vary to some degree with the one for sensor 6 being the largest. The variation is not so significant indicating that a nearly cylindrical pressure pulse is emanating from the imploding structure. Interestingly, although the positive pressure pulses have much shorter durations and much higher pressure peaks than the negative ones, the two impulses have very similar magnitudes at all locations. b. L/D = 8.0 We now consider a shell with nearly the same diameter, wall thickness and basic material properties as the previous one but with an L/D of 8.0 (see Table 1). It was sealed with similar dimension steel plugs to those shown in Fig. 3a. The mid-length sensor arrangement is also similar (Fig. 9a) but two additional sensors were placed approximately at the quarter length positions on the lower surface of the shell as shown in Fig. 9b. Due to its much longer length the shell buckled and collapsed at a pressure of 197 psi (13.6 bar) in mode 2, again a level that corresponds quite well to elastic bifurcation buckling. The longer diameter of the mode 2 collapsing cross section is oriented along the o orientation as shown schematically in the inset of Fig. 9a. This corresponds to the orientation of the initial ovality reported in Table 1 as 7
10 " o = 0.05%. The dynamic implosion event was captured by the digital cameras at a frame rate of 8,000 fr/s, thus the images are separated by ms. Figure 10 shows a set of nine images extracted from the recording of the LHS camera (see Fig. 2; here several images are separated by more than ms). Figure 11 shows the signals recorded by four of the sensors over a period of ±1.5 ms on either side of the pulse. Once more, the times and pressures corresponding to the 10 images are marked with numbered bullets on the pressure signals. Figure 12 shows two views of the collapsed specimen at the end of the experiment. Most of the length of the shell is significantly flattened with the cross section essentially folded (note the sharp curvatures of the edges of the cross section). The ends of the shell are deformed significantly due to constraints offered by the solid end-plugs. Although the dynamic pressure recorded by all sensors at T = -1.5 ms is nearly zero, the complete photographic record shows that a small amount of ovalization started occurring at T " #1.93 ms. The walls begin to recede relatively slowly at first contributing no dynamic pressure. Their motion starts to accelerate approximately at -1.4 ms when the sensors start recording dynamic drops in pressure. By T = ms, corresponding to image in Fig. 10, the shell is clearly ovalizing, the walls are receding, the pressure at sensor 1 is -31 psi (2.14 bar) and similar values are recorded by the other sensors at mid-span. The drop in pressure is initially gradual but by image, at ms, the pressure at sensor 1 has dropped down to -49 psi (3.38 bar). The initially ovalized cross section has reverted to localized plastic deformation concentrated at four narrow axial zones at 90 o angular intervals and the deformation is concentrated in a central section approximately 4D long (see image ). Continuing with sensor 1, the pressure reaches a minimum of -54 psi (3.7 bar) just before at T = "0.174 ms and records a very sharp spike (duration ~10 µs) at T = 0. (Note that, given that the rise time of our sensors is 1.5 µs, the maximum pressure of this short duration spike may have been missed.) Such spikes are characteristic of mode 2 implosions and are presumably due to an initial essentially line contact of the collapsing walls of the shell near mid-span. Such spikes are usually used to trigger the data acquisition system and the cameras, as indeed was the case here. Interestingly, although sensor 5 is closer to one of the convex parts of the deforming shell cross section that is moving towards the sensor rather than away from it, the initial descending part of the signal is very similar to that of sensor 1 (see also Table 3). The first spike is of somewhat longer duration but has smaller amplitude. The remaining sensors at mid-span follow similar 8
11 trends to those seen in Fig. 11. Included in Table 3 are the minimum values of pressures recorded by five of the sensors ( P min ), the periods of the negative pressure parts of theirs signals ("T # ), and the impulse of these signals ( I " ) (see definitions in Fig. 8). Sens. No Table 3 Characteristics of the pressure pulses for Exp. IMP88 P min psi (bar) -54 (-3.7) -57 (3.9) -57 (3.9) -37 (-2.6) -45 (-3.1) "T # ms I " psi.ms (bar.ms) (2.91) (3.01) (2.98) (1.85) (2.19) P max psi (bar) 241 (16.6) 213 (14.7) 198 (13.7) 78 (5.38) 80 (5.52) "T + ms I + psi.ms (bar.ms) (2.68) (2.23) (2.48) (1.38) (1.81) Sensors 7 and 8 respectively located 3.28D and 2.36D on either side of mid-span recorded somewhat different pressure signals (Figs. 11c and 11d). Both sense the pressure trough that develops due to the receding walls. Sensor 7 recorded a smaller drop in pressure with the minimum value being -42 psi (2.9 bar) and a smaller I ". Sensor 8 recorded a deeper trough (-52 psi 3.6 bar) and a higher I ", presumably because it was located closer to the mid-section that is collapsing (see Fig. 9). The sharp pressure spike at T = 0 is missed by both indicating that this was a very local event with little radiated energy. Returning to sensor 1, following the sharp spike at T = 0 the pressure returns back to negative values until about T = ms when it enters positive territory. Simultaneously, contact of the walls at mid-span starts to spread as is evident from image at T = ms. Between image and image at ms, the contacting area has grown covering a length of more than 2D. This rather sudden increase in the contact area implies that a wider column of fluid has come to a stop and is now rebounding as a compression wave. This in turn is responsible for the sharp rise in pressure to a peak of 241 psi (16.6 bar) at ms and to the longer duration of this signal. At T = ms, the pressure starts to drop and at ms an undulating pressure plateau of 70 to 50 psi ( bar) of ms duration develops. Image at ms corresponds to the region close to the end of this plateau. During this time contact 9
12 between the shell walls grows both longitudinally but also across the width. The spreading of contact continues in images and at ms and ms respectively; however the front of the collapse is progressively moving away from mid-span and consequently the pressures recorded by sensors 1 and 5 are decaying. Hence, at ms the pressure at sensor 1 is about 34.5 psi (2.38 bar) and at ms is 36 psi (2.48 bar). In image at ms most of the shell has collapsed but a pressure of 12 psi (0.83 bar) is still registered by sensor 1. The pressure of this sensor drops to nearly zero at 0.87 ms somewhat past image. A last pressure peak is recorded with a maximum of 53 psi (3.65 bar) at 0.95 ms. This is caused by the collapsing shell engaging the solid end-plug, which terminates the deformation causing a compression wave to emanate from this area. The time it is recorded at mid-span has a built-in delay for the signal to travel the 6-inch distance that separates them. The impulse of the signal of sensor 1 ( I + ) reported in Table 3 includes the last pressure peak. It has a duration ( "T + ) of ms and a value of psi.ms. Interestingly, it is somewhat smaller than I " which, because of the localized nature of initial collapse, is due to the receding walls in the central half of the shell. By contrast, I + is from the signal measured at midspan resulting from contact of the walls first at mid-span but subsequently from a collapse front that is propagating outwards. Because of the length of the shell, the signal received at mid-span is somewhat attenuated due to the distance it has to travel. The positive part of the pressure signal at sensor 5 in Fig. 11b has a slightly lower pressure peak 198 psi (13.7 bar) at ms as it is not facing the main area of collapse. The undulations that follow it are similar to those of sensor 1. A short plateau develops between points and followed by a decaying signal past point. A smaller pressure peak with a maximum of 41 psi (2.83 bar) develops at essentially the same time as for sensor 1. Impulse I + listed in Table 3 is somewhat smaller than that of sensor 1. The positive pressure signals of sensors 7 and 8 illustrate the attenuation of the pressure pulse with distance. Both sense the development of the major pulse at mid-span, but the maximum pressure recorded by 8 is 69 psi (4.76 bar) at ms, and recorded by sensor 7 is only 78 psi (5.38 bar) at ms. Furthermore, in image at ms the pressure signal has not arrived at sensor 7 and is just arriving at sensor 8 whereas for the central sensors the main pressure spike has developed and the pressure is starting to descend. The duration of this 10
13 pressure spike is also much shorter. Between times ms (image ) and (image ) the collapse is spreading and the sensor 8 pressure hovers between 15 and 25 psi ( bar) and 8 to 16 psi ( bar) for sensor 7. Both sensors record the pressure pulse that emanates from the compression waves that develop when collapse is finally arrested at the two end plugs. The signal at sensor 7 is a bit stronger than that of sensor 8 and arrives slightly earlier, again because sensor 7 is located closer to end-plug on the RHS (Fig. 9). Note that for both of these sensors the two end plug pulses are responsible for the maximum pressures ( P max ) listed in Table 3. Needless to say that the impulses at these two locations listed in Table 3 are much smaller than those of the central sensors. 3. COMPUTATIONAL STUDY As highlighted in the experimental study described above, the implosion of a submerged, gas-filled structure is a transient, high-speed, fluid-structure interaction problem characterized by ultrahigh compressions, shock waves, large structural displacements and deformations, and selfcontact. Hence, the development of a computational approach for this problem is a formidable challenge. It requires incorporating in the computations material failure models, capturing the precise effects on the pressure peaks of many factors such as the rate of structural collapse, and accounting for the various interactions between the external fluid, the nonlinear structure, and the internal gas. Recently, a coupled fluid-structure computational framework that carefully addresses these challenges was presented in Farhat et al. [2012] and Wang et al. [2011, 2012]. This framework is adopted in this work and consequently is outlined in this section. 3.1 Computational Fluid Model 3.1a Equations of State The underwater implosion process involves two fluids: water and air. It generates strong shock and expansion waves that propagate through both air and the surrounding water. This calls for modeling both media as compressible fluids. Air typically behaves as a perfect gas. Therefore, it is represented here by the Equation of State (EOS) P = (" #1)$e, where P, ρ and e denote pressure, density and internal energy per unit mass, respectively, and γ denotes the ratio of specific heats. 11
14 Water can be assimilated with a stiffened gas whose EOS is P = (" s #1)$e # " s P s, where " s is an empirical constant, and P s is a dimensional constant representing molecular attraction. For water and the system of imperial units, these two constants are experimentally determined to be " s = 4.4 and P s = 87,000 psi (600 MPa). Neglecting viscous effects, the dynamics of both air and water are modeled by the Euler equations. 3.1b Governing Equations of Dynamic Equilibrium Let " F # $ 3 denote the fluid domain of interest, that is, the union of the domains of water and air. The governing Euler equations can be written in vector and conservation form as "W "t where t denotes here time, W = (","v x,"v y,"v z, E) T, " = # #x, # #y, # T $ ' & ) % #z( + # $ F(W) = 0 in " F, (1), and F(W) = ( F x (W),F y (W),F z (W)) T, (2) # "v x ' # "v y ' # "v z ' % 2 % % % % % P + "v % x % "v x v y % "v x v y 2 % % % F x = $ "v x v y (, F y = $ P + "v y (, F z = $ "v y v z (, (3) % "v x v % % z "v y v % % 2 % % z % % P + "v z % &% v x (E + P) )% &% v y (E + P) )% &% v z (E + P) )% " denotes the fluid density, and E is its total energy per unit volume, P denotes the fluid pressure, and v = (v x,v y,v z ) T is its velocity vector. 3.1c Non Body-Fitted Semi-Discretization The large structural motions and deformations that characterize implosive collapse challenge the efficiency, if not robustness,of the mesh motion schemes (Farhat et al. [1998b], Degand and Farhat [2002]) needed for implementing an Arbitrary Lagrangian-Eulerian computational framework for fluid-structure interaction (Farhat et al. [1995, 2001], Lesoinne and Farhat [1998]). For this reason, the governing fluid Eq. (1) is kept here in its Eulerian setting and semidiscretized by the FIVER method (Finite Volume method with Exact two-phase Riemann 12
15 problems) described in Farhat et al. [2012a] on a non body-fitted grid. This allows handling large structural motions and deformations, contact, and even cracking, in a robust manner. The basic steps of FIVER are outlined below. Let D h denote a non body-fitted discretization of the fluid domain of interest " F, where the subscript h designates the maximal length of the edges of this discretization. For every vertex V i D h, i =1,!,N V a cell of control volume C i is constructed. For example if D h consists of tetrahedral, C i is defined as the union of the volumes resulting from subdividing each tetrahedron D h having V i as a vertex by the quadrangular surfaces containing a mid-point of an edge of the tetrahedron, the centroid of this tetrahedron, and two of the face centroids (see Fig. 13). The boundary surface of C i is denoted here by, C i and the unit outward normal to C i is denoted by n i = (n ix,n iy,n iz ) T. The union of all of the control volumes defines a dual discretization of D h. Using the standard characteristic function associated with a control volume C i, a standard variational approach, and integration by parts, Eq. (1) can be transformed into its weaker form!w " h d! + $ F(W h )!t " % n ij d! + F(W h )% n E!Cij " d! + " F(W h )% n ' d! = 0 C i j#k(i)!c i &! E!C i &! ' < 1 > < 2 > < 3 > (4) where W h denotes the semi-discrete state vector, K(i) denotes the set of neighboring vertices of V i, "C ij # "C i $ "C j, n ij is the unit outward normal to "C ij, " E is the discrete approximation of the wet surface of the structure and therefore the fluid-structure interface that is embedded in D h, n E is the unit outward normal to " E,!! denotes the far-field boundary of the flow, and n! is its unit outward normal. This weaker form reveals that in practice, the flow computations are performed in a one-dimensional manner, essentially by evaluating fluxes along normal directions to boundaries of the control volumes. For this purpose, C i is split in the control volume boundary facets C ij connecting the centroids of the tetrahedra having V i and V j as common vertices. Then, term < 1 > in (4) is approximated by 13
16 ) j(k(i) $ F(W h ) " n ij d% & )' Roe (W i,w j,eos,n ij ), #C ij j(k (i) (5) where " Roe is a numerical flux function associated with the second-order extension of the Roe flux [1981] based on the MUSCL (Monotonic Upwind Scheme Conservation Law) (van Leer [1979]), and W i and W j denote the average values of W h in cells C i and C j, respectively. Term < 3 > in (4) is approximated by a far field boundary technique (Steger and Warming [1981], Ghidaglia and Pascal [2005]).The computation of term < 2 > involves a transmission condition that is introduced in Section 3.3a. This computation is discussed in Section 3.3b. Furthermore, in order to restore the correct asymptotic behavior of the pressure when the Mach number goes to zero in the regions of low-speed flow, the Roe flux is also equipped with local preconditioning (Turkel [1987]). The ordinary differential equation resulting from the semi-discretization can be expressed in a compact form as: dw dt + F(W) = 0, (6) where W and F denote the cell-averaged state vector and the numerical flux function for the entire mesh. 3.2 Computational Structural Model 3.2a Constitutive models To properly account for geometric and material nonlinearities, the computational structural model is based on Green s second-order strain tensor and two different yield functions for modeling an elastic-plastic material: (i) J 2 flow theory with isotropic hardening represented by # 3J 2 (s) = % 3 $ 2 s " s & 1/2 ( = ) ' e (7) where s is the deviator of the second Piola-Kirchhoff stress tensor. (ii) Barlat et al. [2003, 2004] anisotropic yield function represented by 14
17 8 S 1 " # S 2 " + 2 S 1 " 8 + S 2 " + S 1 " S 2 " = 8 2$e, (8) where ( S 1 ", S 2 " ) and ( S 1 ", S 2 " ) are the principal values of the linearly transformed stress tensors S " and S ", respectively. These tensors are obtained from the stress deviator s and the stress tensor " as follows: S " = C " s = C " T# = L "# and S " = C " s = C " T# = L " # where C ", C ",T, L " and L " are appropriate transformation tensors that allow introduction of the anisotropy (see Eqs. (4) of Korkolis and Kyriakides [2008], and Korkolis et al. [2010]). 3.2b Governing Equations of Motion The Lagrangian equations of motion of the nonlinear flexible structure " S can be written in compact form as # 2 u j " S #t 2 = # % #u j ' $ ij + $ im #x i & #x m ( * + b j in " S, j =1,2,3, (9) ) where the subscripts designate the coordinate system (x,y,z), u is the displacement vector field of the structure, " is the second Piola-Kirchhoff stress tensor, and b the vector of body forces acting in " S. 3.2c Semi-Discretization The nonlinear structural equations of motion (9) are typically semi-discretized by the Lagrangian finite element (FE) method. This leads to the discrete equations M!2 u!t 2 + f int (u,!u!t ) = f F (w)+ f ext, (10) where M denotes the symmetric positive definite mass matrix, u denotes the vector of discrete structural displacements, and f int, f ext, and f F denote the vectors of internal, external, and flow-induced discrete forces, respectively. 15
18 3.3 Fluid-Structure Interaction with Large Structural Deformations 3.3a Transmission Conditions At the continuum level, the interaction between the fluid and structure subsystems represented by Eq. (1) and Eq. (9), respectively, is driven by two transmission conditions: the kinematic, non-penetration condition $ v " #u ' & )* n % #t ( w = 0 on " w, (11) and the equilibrium condition % #u j ( '" ij + " im + P$ ij * n & #x m ) wi + T j = 0 on " w (12) where " w denotes the physical fluid-structure interface whose FE discritization is Σ E, n w is the unit outward normal to " w, and T j denotes the tractions due to external forces whose origin is not due to the flow. 3.3b Embedded Computational Method for Fluid-Structure Interaction The interface transmission conditions (11,12) are semi-discretized using the embedded boundary method for CFD (Computational Fluid Dynamics) described in (Wang et al. [2011,2012]) and consistent with FIVER. More specifically, the embedded discrete fluidstructure interface Σ E is represented within D h by the surrogate interface " E defined as " E =! &C ij (13) (i, j) /V i V j #" E $% and constructed using either algorithm described in Wang et al. [2012]. Then, the interface condition (11) is enforced in two steps as follows: (i) for each edge V i V j of the fluid mesh that intersects the embedded discrete interface " E that is, for each V i V j " # E $ % (see Fig. 14), a one-dimensional fluid-structure Riemann problem between each vertex of this edge (V i or V j ) and " E, is constructed and solved using the structure velocity at the intersection point. 16
19 (ii) for each edge V i V j of the fluid mesh that intersects the embedded discrete interface Σ E, a contribution to term < 2 > in Eq. (4) is evaluated by computing the numerical flux on each side of the fluid-structure interface as follows: & F(W h ) " n E d% ' & F(W h ) " n ij d% #C i $% E #C i $ % E (i) = F(W h ) " (i) % nij d# &' $C Roe (W i,w M,EOS (i),nij ) (14) ij and ( j) & F(W h ) " n E d% ' & F(W h ) " n ji d% = & F(W h ) " n ji d% #C j $% E #C j $ % E #C ij "# Roe (W j,w M ( j),eos ( j),n ji ), (15) (i) ( j) where W M (WM ) is the solution of the one-dimensional fluid-structure Riemann problem between V i (V j ) and " E. It is notable that the velocity components of W M (i) ( j) and W M verify the interface condition (11). As for the interface condition (12), it is enforced using the conservative load transfer algorithm proposed in Wang et al. [2011] and based on work initially presented in Farhat et al. [1998a]. Briefly, this algorithm can be summarized as follows: (i) transform the pressure (i) components of W M and ( j) WM into local force loads f F (i) (PM ) and f F (i) (PM ) and (ii) distribute these loads onto the wetted surface of the FE structural model as external forces. 3.3c Coupled Implicit-Explicit Time-Discetization Finally, the semi-discrete fluid and structure subsystems are time-integrated by an Eulerian version of the second-order implicit-explicit staggered time-integrator described in Farhat et al. [2010]. In this coupled time-discretization algorithm, the semi-discrete fluid subsystem is time-integrated using the second-order three-point implicit backward difference formula and the semi-discrete structural subsystem is time-integrated using the second-order central difference scheme. This state-of-the-art loosely-coupled time-integrator was proved to deliver second-order time-accuracy and shown to possess excellent numerical stability properties thanks to its carefully designed coupling mechanisms. 17
20 4. SIMULATION RESULTS The computational framework summarized above was implemented in the massively parallel AERO Suite of Codes (Farhat et al. [2003], Geuzaine et al. [2003]). It was also verified and validated for several large-scale, highly nonlinear applications associated with marine and aerospace engineering (e.g., see Wang et al. [2011, 2012]). It is applied here to simulate the two implosion experiments described in Section Simulation Methodology In both cases, the origin of the Cartesian system adopted is at the geometric center of the specimen (see Figs. 15 and 20). For convenience, symmetry is assumed about the y " z plane. The shells are discretized using the Belytschko-Tsay four-node quadrilateral shell element (Belytschko et al. [1984]). Symmetry boundary conditions are applied to the nodes on the midspan cross section. The ends of the shell are restrained radially, but are allowed to slide axially. Small initial geometric imperfections that correspond to the respective buckling modes are introduced to the shells via their mid-surface radii as follows: R(") = R o (1# acosn"), (16) thus n = 2 for IMP88 and n = 4 for IMP69. For both experiments, the computational fluid domain is chosen to be an axis-aligned rectangular box with symmetry boundary at x = 0 and far-field boundaries on the other five faces. The non-reflecting far-field boundary conditions are enforced using the normal flux method (Ghidaglia and Pascal [2005]), which is particularly well suited for the EOS of water used in this work. This computational domain is discretized by an unstructured non-body-fitted tetrahedral mesh. Near the fluid-structure interface, the characteristic element size is of the order of the thickness of the shells. At time T = 0, the initial density, pressure, and velocity for air 0 inside the specimen are set to " a = 3.613#10 $5 lb/in 3 (1 kg/m 3 0 ), P a = 14.5 psi (1 bar), and 0 "a 0 = 0. The initial density and velocity of water outside the specimen are set to " w = lb/in 3 (10 3 kg/m 3 0 ) and " w = 0. To imitate the pressure ramp-up process of the experiment, the water 18
21 0 pressure is initially set at P w = 0 PCO + P a "10 psi and increased statically and linearly to 0 P CO + P a, whereas the air pressure inside the specimen is maintained at 0 Pa. Only when the collapse pressure is reached, the time-integration of the fluid subsystem is started. The duration 0 of the pressure increase process, "T inc, is chosen such that when P CO + P a is reached, the structural model has just started collapsing. The time-step is chosen to be the same for both semi-discrete fluid and structural subsystems to avoid sub-cycling and maximize time-accuracy. This time-step is maintained constant (65 ns for IMP69 and 40 ns for IMP88) through the entire simulation. In each case, it corresponds to a large fluid CFL (Courant Friedrichs Lewy) number, which maximizes computational efficiency. The simulation is terminated after the specimen has fully collapsed and the pressure disturbance in water gets close to zero. 4.2 L/D = 2.0 (IMP69) A schematic drawing of the structure and non-body-fitted fluid mesh (truncated view) is shown in Fig. 15. The structure consists of the shell and the solid plug. The shell is discretized with 53 elements along the half-length and 136 elements around the circumference. The steel plug including its rounded end is discretized using 38,920 four-node elastic tetrahedral elements. The plug and the shell share the same nodes along the circumference at point A. The shell material is modeled as a bilinear elastic-plastic solid with an elastic modulus of 10.1 Msi (69.6 GPa), yield stress of 42.4 ksi (292 MPa), post-yield modulus of 97.8 ksi (674 MPa), Poisson ratio equal to 0.3 and density " s = 0.10 lb/in 3 (2779 kg/m 3 ). The computational fluid domain is chosen to be " = {x, y,z # $ 3 : 0 % x %12 in, "10 # y,z #10 in}. This domain is discretized with 4,908,508 nodes and 29,298,618 tetrahedra. The element size near the fluid-structure interface is ~0.03 in (0.76 mm) and progressively coarsens to about 3 in (76 mm) at the outer boundaries (not shown in Fig. 15). The simulation is started with a pressure increase process that has a duration of T inc = ms, and is terminated at T final = 1.65 ms. The shell buckles and collapses dynamically in mode 4, mimicking the experiment. Figure 16 shows eight images of the shell at different levels of deformation (for visualization purposes the half shell model is reflected about the plane of symmetry). The pressure time-histories predicted at two sensor locations are shown in Fig. 17, 19
22 together with the corresponding experimental signals. (Note that sensor locations are mapped onto the computational domain by replicating the orientation of the collapse mode.) In order to facilitate comparison between the computed and measured results, the time origin is shifted so that the highest pressure peak at sensor 1 is aligned with that of the experiment. Marked on the calculated response with numbered bullets are the locations that correspond to the images in Fig. 16. Color 3D rendering of the pressure fields around the collapsing shell at six instances that again correspond to the labeled points on the response appear in Fig. 18. The reader can observe that the main features of the experimental signals are captured quite well by the simulation. These include the initial relatively gradual pressure drop, followed by a sharp pressure pulse with multiple spikes, and ending by a shallow pressure drop. Image [1] is taken at the beginning of the simulation (T = ms) when the pressurization step starts. At this time the structure is intact and the fluid is at rest. The flow solver is activated at ms and leads to the small pressure oscillations seen in the signals of the two sensors in Fig. 17. At this time the structure has slightly deformed. Its wetted surface has a non-zero velocity, whereas the fluids (both water and air) still have zero velocity everywhere. Around T = ms, the shell starts to deform dynamically in mode 4. Deformation localizes around mid-span as illustrated in image [2] at ms in Fig. 16. Simultaneously, the calculated pressure drops because of the receding walls of the shell. Sens. No Table 4 Characteristics of calculated pressure pulses for IMP69 P min psi (bar) -130 (-8.97) -115 (-7.93) -126 (-8.69) -132 (-9.10) "T # ms I " psi-ms (bar-ms) (2.84) (2.48) (2.75) (2.85) P max psi (bar) 409 (28.2) 360 (24.8) 339 (23.4) 357 (24.6) "T + ms I + psi-ms (bar-ms) (2.10) (1.75) (1.97) (2.08) In image [3] at ms, the four developing troughs have grown while the pressure reaches its lowest value. Listed in Table 4 are the minimum values recorded at the locations of four of the sensors. Although they do not exactly match the experimental values in Table 2, on average they are within 12.5% of these values. In image [4] at T = ms, the inward deformation has 20
23 grown further and the walls are close to first contact. The pressure starts to rise and turns positive at approximately T = ms. As in the experiment, this time is defined as the end of the negative pulse. The duration and impulse of this negative pulse are listed in Table 4 for sensors 1, 3, 5 and 6, and compared with the experimental data shown in Table 2. The agreement for I " is good with an average difference of 8.75%. Comparison of the duration is somewhat inappropriate due to the way the dynamic calculation is commenced. Figure 19 shows the shell at first contact, which occurs at T = ms. Contact is limited to the plane of symmetry where the deepest parts of the cross-shaped intrados are located (note that the figure shows the shell mid-surface whereas contact occurs at the inner surface of the shell; in other words, the gap represents one wall thickness). Interestingly, just before first contact, the shell wall velocity is somewhat above 3000 in/s (76 m/s). Furthermore, at first contact the water pressure on the surface of the shell is 8,444 psi (582 bar). This in fact is the highest pressure recorded in the entire calculation. After first contact, the contact region expands rapidly in the axial direction accompanied by significant flattening. Simultaneously, a strong positive pressure pulse emanates and propagates outward in the water as illustrated in image [5] of Fig. 18 at T = ms. The signal is strongest on the surface of the shell and decays as it radiates outwards. By this time, roughly one-half of the shell length has flattened while the two sensors are recording a sharp rise in pressure. As in the experiment, sensor 1 records the highest pressure of 409 psi (28.2 bar) at T = ms, which is 13% lower than the measured value. It is interesting to confirm that this maximum corresponds to first contact; in other words, the time delay is related to the time of travel of the shock from the surface of the shell to the location of the sensor (see Fig. 3). The maximum pressures at four of the sensor locations are reported in Table 4. For sensors 1, 3 and 5, the values are in good agreement with their experimental counterparts shown in Table 2, with differences ranging from 3% to 22%. By contrast, at sensor 6 the maximum pressure is about 43% lower than in the experiment. In view of the assumed symmetry about the mid-span and that the wall eccentricity was not included in the model these comparisons are deemed to be quite favorable. Following the pressure maximum, the water pressure starts to decrease as the first wave of shocks moves past the sensors. However, around the time of image [6] (T = ms), the collapse has reached the solid end-plugs, and the shell bends over its rounded shape. This 21
24 abruptly stops the forward motion of the collapse and generates a compressive shock wave that can be seen in image [6] in Fig. 18. This shock is also recorded by the two sensors in Fig. 17 as secondary spikes. The maximum value of this spike is found to be 289 psi (19.9 bar) at sensor 1 and 255 psi (17.6 bar) at sensor 3. After the second spike, the pressure drops sharply as the shell has collapsed completely. In image [7] at ms, the water pressure near the shell has turned negative. Correspondingly, the pressure at sensors 1 and 3 reaches zero at ms and continues to drop. The duration and impulse of the positive pressure pulse are reported in Table 4. Overall the values of I + are somewhat lower than those in the experiment. In the analysis, a small negative pressure pulse is recorded at all sensor locations between images [7] and [8] at ms. Although several of the sensors in the experiment exhibited a pressure drop at about the same time, the drops are shallower with smaller impulse. We suspect that, once more, small differences in the deformation of the shell at this time frame, caused by asymmetries in the experimental shell are responsible for this difference. The pressure at all sensors positions returns to zero at T = 0.25 ms and hovers about the zero level afterwards. The simulation was terminated shortly after image [8] at ms. 4.3 L/D = 8.0 (IMP88) The geometric parameters of this specimen are listed in Table 1. Symmetry about midspan is again assumed, thereby reducing the solid and fluid meshes to those shown in Fig. 20 (the view of the water domain is truncated). The shell is discretized with 140 elements along the halflength and 100 elements around the circumference. The steel plug is represented by 50 four-node rigid elements with the correct total mass. The shell material is modeled as an elastic-plastic solid with the non-quadratic anisotropic yield function used in Korkolis and Kyriakides [2008] and calibrated for this material in Korkolis et al. [2010]. A piecewise linear fit of the measured tensile stress-strain response is adopted. Its elastic modulus, Poisson ratio, and density are respectively set to 10.3 Msi (70.8 GPa), 0.3, and 0.10 lb/in 3 (2779 kg/m 3 ). The computational fluid domain is chosen as " = {x, y,z # $ 3 : 0 % x %100 in, "75 # y,z # 75 in}. It is discretized with 3,377,863 nodes and 20,128,823 tetrahedra. The element size near the fluid-structure interface is ~0.03 in (0.76 mm) and progressively coarsens to about 10 in (254 mm) at the outer boundaries (not shown in Fig. 20). 22
25 The simulation began with static pressure increase for a duration of T inc = 0.3 ms, and was terminated at T final = 5.5 ms. As expected, the shell collapses dynamically in mode 2, mimicking the experiment. Figure 21 shows six images of the shell at different levels of deformation. Again, reflection is applied to obtain the results for the full specimen. The pressuretime-histories predicted at three sensor locations (including one off the symmetry plane) are plotted in Fig. 22 together with the corresponding measured responses. As in the case of IMP69, the time origin of the simulation results is shifted to match the main events of the experiment. The six images in Fig. 21 correspond to the points marked on the calculated response with numbered solid bullets. Three-dimensional renderings of the pressure field in the neighborhood of the shell at the same six instances are shown in Fig. 23. Comparing the calculated results in this set of figures with the experimental results shown in Figs , it is clear that the simulation captures the main features of this implosion event quite faithfully. In the simulation, the shell wall begins to recede slowly near the end of the pressurization step. The dynamic fluid solver is activated at T = ms. Due to the discontinuity of the velocity across the fluid-structure interface, a small oscillation develops in the fluid pressure field at this time, as in the simulation of IMP69. This oscillation dies out rapidly and at T = -1.5 ms when the pressure plots in Fig. 22 start it is no longer noticeable. At this time, the inward motion of the shell walls accelerates and from T = -1.4 ms onwards this causes the dynamic pressure to start dropping at all three sensor locations shown. Image [1] in Fig. 21 at ms, shows the shell deformed in mode 2, and the deformation localized in the central half of the model. The pressure at sensors 1 and 5, on the symmetry plane, has reached the minimum, whereas at sensor 8, about 2.4D away, it continues to drop. The descending parts of the three responses match the corresponding experimental ones very well. The minimum pressure at five sensor locations listed in Table 5 are seen to be close to the corresponding experimental values (Table 3) with an average difference of only 5.0%. The collapsing walls of the shell model at mid-span come into first contact at approximately T = ms. The local cross section has deformed to the characteristic 8 shape shown in Fig. 24a. Because of the axial localization of the collapse, contact is along a line formed by the intrados of the deformed cross section along a short axial length of about ~0.5D note once again that Fig. 24 shows the mid-surface of the shell whereas contact occurs on the inner surface at the half wall thickness. The contact points, which had an inward velocity of
26 in/s (22.1 m/s), abruptly come to a stop generating a wave of outgoing shocks in the surrounding water. This wave is responsible for the first narrow pressure spike recorded at sensor positions 1 and 5 (see Fig. 22a and 22b). Because contact is limited to a narrow axial zone, the pressure returns quickly to negative values. Sens. No Table 5 Characteristics of calculated pressure pulses for IMP88 P min psi (bar) -54 (3.72) -61 (4.21) -63 (4.34) -45 (3.10) -48 (3.31) "T # ms I " psi-ms (bar-ms) (2.86) (2.91) (3.01) (1.65) (2.29) P max psi (bar) 183 (12.62) 180 (12.41) 188 (12.97) 83 (5.72) 79 (5.45) "T + ms I + psi-ms (bar-ms) (2.90) (3.00) (3.07) (1.78) (2.29) The mid-span cross section continues to collapse, and contact quickly expands both transversely and axially as shown in Fig. 24b. This corresponds to the time of a second narrow pressure spike of higher amplitude at about 0.03 ms. By the time it is over, approximately a contact length of 0.4D has developed across the most deformed cross section, and the axial length has grown to 1.25D. Soon thereafter, the mid-span cross section is essentially flattened, and contact has spread axially to about 2D as illustrated in image Fig. 24c at ms. This corresponds to the main spike recorded by the sensors. The mid-span sensors record their highest values at ms. By configuration at ms, the pressure is dropping at the central sensor locations even though, as shown in Fig. 21 only the central 1/3 of the shell has come into self-contact. This supports the experimental observation that because collapse localizes, the pressure spike of main concern is due to first contact when the local velocity of the collapsing shell is the highest (consistent with results in Turner and Ambrico [2013]). The pressure maxima are listed under P max in Table 5. Comparing them with those of the corresponding experimental sensors listed in Table 3, they can be declared to be in reasonable agreement (average difference ~16%). Interestingly, as in the experiment, sensor 8 24
27 1D away records both the first short spike as well as the second longer one with some delay and at reduced amplitudes. Pressure at all sensor locations starts to decrease after the major spike moves past these sensors. Images [4] at T = ms and [5] at T = ms are taken while collapse and contact spread axially towards the steel plugs. The full pressure fields corresponding to these two images (Fig. 23) show a local pressure pulse emanating from the propagating collapse front. Concurrently, the pressure at sensors 1 and 3 continues to drop as the collapse front moves away from them. By contrast, the pressure at sensor 8 gradually increases. At approximately the time of image [6] (T = ms), the collapse front has reached the end-plug and is abruptly stopped. This generates a relatively strong wave of shocks, captured at all the sensor locations as a relatively long pressure pulse, as in the experimental records. In fact, this last pressure pulse is responsible for the highest pressure recorded at sensor 8 (Table 5), which matches well the experimental result (Table 2). After this last wave of shocks, the pressure decreases at all sensor locations. It turns negative at about T = 1.2 ms, and hovers around the zero level afterwards. The shell is completely collapsed. Figure 25, shows contours of equivalent plastic strain superimposed on the final collapsed configuration of the shell. The highest levels of strain occur at the interface with the solid plug where often such shells failed in the experiments. 5. SUMMARY AND CONCLUSIONS The implosion of an underwater structure is a dynamic event caused by the ambient constant pressure environment. Initially, the surrounding water follows the dynamically receding walls of the collapsing structure but comes suddenly to a stop when the walls of the structure come into contact. This produces a short duration pressure pulse that radiates outwards. Such a pressure pulse can have sufficient amplitude and impulse to cause damage to a neighboring vessel and must the understood. The aim of this study was to first use experiments to quantify the signature of such pressure pulses and understand the factors that govern them; second to develop a modeling framework capable of capturing the complex fluid-structure interaction associated with such implosion events; and third to evaluate the performance of the models developed and use the results to understand the factors that govern the signatures of such pressure pulses. This paper summarized the results of these efforts. 25
28 The experimental study involved the development of a custom testing facility that allows for the dynamic collapse of small-scale shells under conditions that simulate the constant pressure underwater environment. The dynamic implosion process, which has a time scale of the order of one millisecond, is monitored with high-speed digital photography. The emanating pressure pulse is measured with dynamic pressure sensors that surround the specimen and recorded on a high-speed data acquisition system. A unique feature of the testing facility is the synchronization of the high-speed images with the recorded pressure pulses that allows temporal and spatial resolution of the events and the pressure pulses. The paper presented representative results from two implosion experiments on aluminum cylindrical shells with a D/t of about 54: one with an L/D = 2 that collapsed in mode 4 and a second with an L/D = 8 that did so in mode 2. In both cases the structures buckled elastically at the expected pressure levels and subsequently collapsed dynamically due to additional loss of stiffness resulting from inelastic action. The synchronized photographic image and pressure sensor records showed that during the initial inward motion of the shell walls, the local pressure drops below the ambient level. A sharp short duration spike was recorded during first contact of the shell walls followed by a longer and much higher amplitude pressure pulse that developed when a more significant part of the shell came into contact. In the case of the shorter shell, the pressure pulse was influenced by the deformation of the whole structure. Furthermore, the impulse of the initial drop in pressure was approximately equal to that of the shorter but higher amplitude compression signal that followed. In the case of the longer shell, collapse localized in a length of about 4D and this was responsible for the main part of the compression pressure pulse. Collapse subsequently propagated to the ends of the shell but this yielded rather lower amplitude pressure signals. In both cases the structures did not fracture in any significant manner. The duration and signature of the outgoing pulse is influenced by the mode of collapse with mode 4 producing a higher amplitude but shorter duration pressure pulse than mode 2. A comprehensive computational framework developed in the course of this study for the solution of highly nonlinear fluid-structure interaction problems characterized by shocks, large deformations, and self-contact reported elsewhere has been outlined. It features an Eulerian embedded boundary method for Computational Fluid Dynamics capable of achieving secondorder spatial accuracy including at the fluid-structure interface, an explicit structural analyzer with nonlinear geometric, material, and contact capabilities, and a state-of-the-art loosely- 26
29 coupled implicit-explicit fluid-structure time-integrator with provable second-order timeaccuracy and excellent numerical stability properties. The performance of the numerical simulation technology developed was evaluated by direct comparison of simulation results with the two experiments described in Section 2. It was found that it always delivered clean and stable time-histories. The initial pressure drops arising from the implosion process were reproduced quite well and the pressure spikes that follow reasonably well. In the case of IMP69, deviations from the experimental results are believed to be due to the wall eccentricity present in the shell tested but not accounted for in the models. Indeed, the computed results agree better with their experimental counterparts for experiment IMP88 where geometric imperfections in the cylindrical shell played a lesser role. It was also found that in both cases, the numerical tool reproduces very well the time instances at which the pressure peaks and drops occur, and the pressure impulse. Furthermore, visual comparisons of the structural deformations including the extent and evolution of contact, and the local curvatures of the collapsed shells showed the computed collapsed shapes to agree well with their experimental counterparts. The numerical tool provided additional insight into the events associated with the two implosions. It was confirmed that the highest pressure occurs at the instant of first contact and that the local inward velocity of the through formed by localized collapse is the highest just before contact. Furthermore, first contact is limited to a very short section of the collapsing walls. By contrast, the major pressure spike comes a short time later when a somewhat larger section of the shell walls come into contact. This is more prominently displayed in the case of the longer shell where the main pressure spike occurs when only a relatively short section of the shell has collapsed. This is because collapse is localized and only a short section develops the high velocity responsible for high compression shock after it comes to a stop by contact. In the subsequent propagation of the front, the velocities at contact are lower and thus the emanating pressure signals are much lower. In view of these events, in both cases the high pressure signals propagated nearly in a spherical manner and their amplitude decays as r 2 at distances beyond one radius from the shell surface. The study included a significant number of experiments in which the problem parameters such as the shell D/t, L/D, material, and boundary conditions were varied. Results and 27
30 observations on the effect on these on the emanating pressure pulses will follow in future publications. ACKNOWLEDGMENTS The authors acknowledge with thanks financial support from the Office of Naval Research through the MURI project N They thank Steve Turner of NAVSEA for his help during the initial stages of the experimental part of the project and Philip Avery for his assistance in the computational study. REFERENCES Barlat, F., Brem, J.C., Yoon, J.W., Chung, K., Dick, R.E., Lege, D.J., Pourboghrat, F., Choi, S.- H. and Chu, E., Plane stress yield function for aluminum alloy sheets-part I: Theory. Int l J. Plasticity 19, Belytschko, T., Lin J., Tsay, C., Explicit algorithms for the nonlinear dynamics of shells. Comp. Meth. Appl. Mech. Eng. 42, Brush, D.O and Almroth, B.O., Buckling of Bars, Plates and Shells. McGraw-Hill. Cartlidge, E., Accident grounds nutrino lab. Physicsworld.com, Nov. 15, Degand, C., Farhat, C., A three-dimensional torsional spring analogy method for unstructured dynamic meshes. Comput. Struct. 80, Dyau, J.Y. and Kyriakides, S., On the localization and collapse in cylindrical shells under external pressure. Int'l J. Solids Struct. 30, , Farhat, C., Lesoinne, M. and Maman, N., Mixed explicit/implicit time integration of coupled aeroelastic problems: Three-field formulation, geometric conservation and distributed solution. Int l J. Num. Meth. Fluids 21, Farhat, C., Lesoinne, M. and LeTallec, P., 1998a. Load and motion transfer algorithms for fluid/structure interaction problems with non-matching discrete interfaces: momentum and energy conservation, optimal discretization and application to aeroelasticity, Comp. Meth. Appl. Mech. Eng. 157, Farhat, C., Degand, C., Koobus, B., Lesoinne, M., 1998b. Torsional springs for two-dimensional dynamic unstructured fluid meshes. Comp. Meth. Appl. Mech. Eng. 163,
31 Farhat, C., Geuzaine, P., Brown G., Application of a three-field nonlinear fluid-structure formulation to the prediction of the aeroelastic parameters of an F-16 fighter. Comput. Fluids 32, Farhat, C., Geuzaine, P., Grandmont, C., The discrete geometric conservation law and the nonlinear stability of ALE schemes for the solution of flow problems on moving grids. J. Comput. Physics 174, Farhat, C., Rallu, A., Wang, K., and Belytschko, T., Robust and provably second-order explicit-explicit and implicit-explicit staggered time-integrators for highly non-linear compressible fluid-structure interaction problems. Int l J. Num. Methods Eng. 84, Farhat, C., Gerbeau, J.-F., Rallu, A., FIVER: A finite volume method based on exact twophase Riemann problems and sparse grids for multi-material flows with large density jumps. J. Comput. Physics 231, Geuzaine, P., Brown, G., Harris, C. and Farhat, C., Aeroelastic dynamic analysis of a full F-16 configuration for various flight conditions. AIAA J. 41, Ghidaglia, J.-M. and Pascal, F., The normal flux boundary method at the boundary for multidimensional finite volume approximations in CFD. Europ. J. Mech. - B/Fluids 24,1 17. Harben, P. and Boro, C., Implosion source development and Diego Garcia reflections. 23rd Seismic Research Review: Worldwide Monitoring of Nuclear Explosions, Oct. 2-5, pp., Korkolis, Y.P. and Kyriakides, S., Inflation and burst of anisotropic aluminum tubes Part II: An advanced yield function including deformation-induced anisotropy. Int l J. Plasticity 24, pp Korkolis, Y.P., Kyriakides, S., Giamouris, T., Lee, L.-H., Constitutive modeling and rupture predictions of AL-6061-T6 tubes under biaxial loads. ASME J. Appl. Mech. 77, Kyriakides, S. and Babcock, C.D., On the dynamics and the arrest of the propagating buckle in offshore pipelines. Proc. Offshore Technology Conference, Houston TX, OTC Paper 3479, Vol. II, pp Kyriakides, S. and Netto, T.A., 2000a. On the dynamics of propagating buckles in pipelines. Int l J. Solids Struct. 37, Lesoinne, M. and Farhat, C., A higher-order subiteration free staggered algorithm for nonlinear transient aeroelastic problems. AIAA J. 36, Netto, T.A. and Kyriakides, S., 2000a. Dynamic performance of integral buckle arrestors for offshore pipelines. Part I experiments. Int'l J. Mech. Sci. 42,
32 Netto, T.A. and Kyriakides, S., 2000b. Dynamic performance of integral buckle arrestors for offshore pipelines. Part II analysis. Int'l J. Mech. Sci. 42, Netto, T.A., Kyriakides, S. and Ouyang, X., On the initiation and propagation of buckles on a beam on a nonlinear foundation. ASME J. Applied Mechanics 66, Orr, M., Schoenberg, M., Acoustic signatures from deep water implosions of spherical cavities. J. Acoustical Soc. America 59, Roe, P.L., Approximate Riemann solvers, parameters vectors and difference schemes. J. Comput. Physics, 43, Singer, J., Arbocz, J., Weller, T., Buckling Experiments: Experimental Methods in Buckling of Thin-Walled Structures, Vol. 2, John Wiley & Sons, New York. Song, H.-W., Tassoulas, J.L., Finite element analysis of propagating buckles. Int l J. Num. Meth. Eng. 36, Steger, J.L., Warming, R.F., Flux vector splitting of the inviscid gas dynamic equations with application to finite-difference methods. J. Comput. Physics 40, Timoshenko, S.P. and Gere, J.M., Theory of Elastic Stability 2 nd Edition. McGraw-Hill. Turner, S.E., Ambrico, J.M., Underwater implosion of cylindrical metal tubes. ASME J. Appl. Mech. 80, Turner, S.E., Underwater implosion of glass spheres. J. Acoustical Soc. Amer. 121, Turkel, E., Preconditioned methods for solving the incompressible and low-speed compressible equations. J. Comput. Physics 72, Van Leer, B., Towards the ultimate conservative difference scheme V: a second-order sequel to Godonov s method. J. Comput. Physics 32, Wang, K., Rallu, A., Gerbeau J.-F., Farhat C., Algorithms for interface treatment and load computation in embedded boundary methods for fluid and fluid-structure interaction problems. Int l J. Num. Methods Fluids 67, Wang, K., Gretarsson, J., Main, A., and Farhat, C., Computational algorithms for tracking dynamic fluid-structure interfaces in embedded boundary methods. Int l J. Num. Methods Fluids 70,
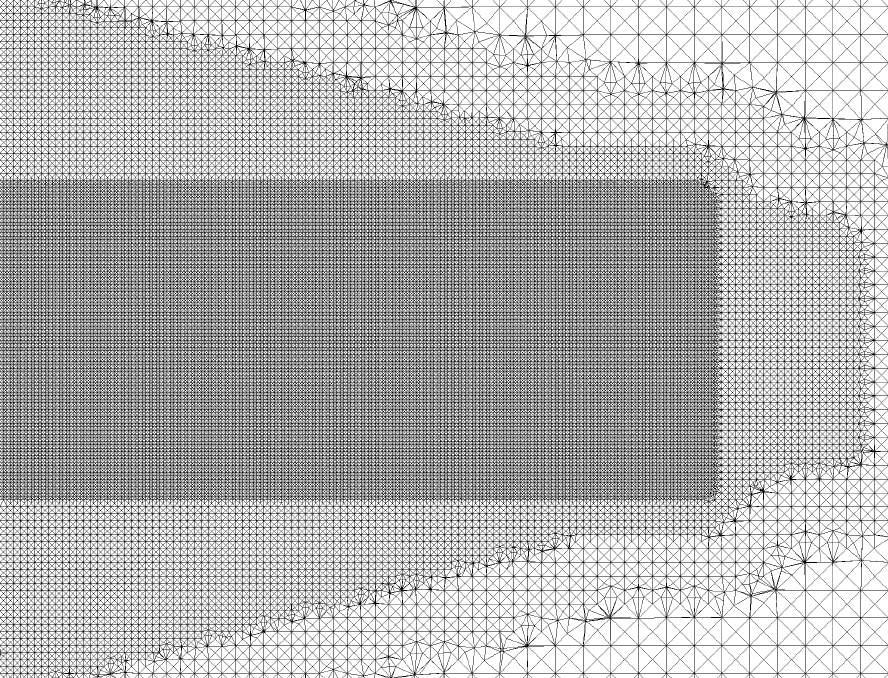
33 Yoon, J.W., Barlat, F., Dick, R.E., Chung, K., Kang, T.J., Plane stress function for Aluminum alloy sheets Part II: FE formulation and its implementation. Int l J. Plasticity 20, Figure Legends Fig. 1 Custom pressure testing facility used to conduct implosion experiments. (a) Photograph and (b) scaled schematic. Fig. 2 Cross section of pressure testing facility showing the illumination system, the high-speed video cameras, the pressure sensors and the data acquisition system. Fig. 3 (a) Schematic of shell specimen geometry for IMP69. (b) Positions of mid-span pressure sensors. Fig. 4 Schematic of the specimen and sensor support structure. Fig. 5 Sequence of high speed images that show the dynamic collapse of IMP69 (images taken at 0.16 ms intervals). Fig. 6 Signals recorded by four pressure sensors at mid-span of IMP69 illustrating the emanating pressure pulse. Numbered bullets correspond to images in Fig. 5. Fig. 7 Photographs showing the mode 4 collapse of IM69. (a) Side view and (b) end view. Fig. 8 Definitions of pressure signal characteristics. Fig. 9 (a) Positions of (a) mid-span and (b) off center pressure sensors. Fig. 10 Sequence of high speed images that show the dynamic collapse of IMP88. Fig. 11 Signals recorded by two pressure sensors at mid-span (a) and (b) and by two off-center sensors (c) and (d) for IMP88 illustrating the emanating pressure pulse. Numbered bullets correspond to images in Fig. 10. Fig. 12 Photographs showing the mode 2 collapse of IM88. Fig. 13 Control volume C i (lighter lines) associated with vertex V i of a tetrahedral mesh (heavier lines). Fig. 14 Surrogate fluid-structure interface in the vicinity of edge V i V j. Fig. 15 Truncated views of fluid CFD meshes for IMP69. 31
34 Fig. 16 Calculated set of deformed configurations for IMP69 with color contours representing the radial displacement. Fig. 17 Comparison of measured and calculated pressure signals at two sensor locations for IMP69. Numbered bullets correspond to deformed configurations in Fig. 17. Fig. 18 Three-dimensional renderings of the calculated pressure fields around the collapsing shell for IMP69. Numbers correspond to times marked by bullets on the responses in Fig. 18. Fig. 19 Calculated collapsed configuration of shell of IMP69 at the time of first contact ( T " xxx ms) Fig. 20 Truncated views of fluid CFD meshes for IMP88. Fig. 21 Calulated set of deformed configurations for IMP88 with color contours representing the radial displacement. Fig. 22 Comparison of measured and calculated pressure signals at three sensor locations for IMP88. Numbered bullets correspond to deformed configurations in Fig. 22. Fig. 23 Three-dimensional renderings of the calculated pressure fields around the collapsing shell for IMP88. Numbers correspond to times marked by bullets on the responses in Fig. 23. Fig. 24 Calculated deformed configurations of shell of IMP88 at early stages of contact between the cell walls at mid-span. Fig. 25 Calculated final collapsed configuration of IMP88 with superimposed color contours of plastic equivalent strain. 32

35 (a) (b) F1
36 F2
37 (a) (b) F3
38 F4

39 F5
40 P (psi) P (psi) D = in D = 53.6 t L D = 2 P CO = 676 psi T (ms) D = in D = 53.6 t L D = 2 P CO = 676 psi Ch. 1 P 40 (bar) T (ms) 2 3 (a) 4 (b) F6 6 7 Ch P 40 (bar)
41 P (psi) P (psi) D = in D = 53.6 t L D = 2 P CO = 676 psi T (ms) D = in D = 53.6 t L D = 2 P CO = 676 psi 1 4 (c) Ch. 5 P 40 (bar) T (ms) (d) F Ch P 40 (bar)


42 (a) (b) F7
43 P (psi) P max P (bar) I + ΔT - I - ΔT + P min T (ms) F8
44 (a) (b) F9

45 F10
46 P 200 (psi) D = in D = 53.6 t L D = 8 5 Ch P (bar) P CO = 197 psi T (ms) P 200 (psi) D = in D = 53.6 t L D = 8 P CO = 197 psi T (ms) (a) 4 (b) F Ch (bar) P
47 P 200 (psi) D = in D = 53.6 t L D = 8 P CO = 197 psi T (ms) P 200 (psi) D = in D = 53.6 t L D = 8 P CO = 197 psi Ch T (ms) (c) 3 4 (d) F Ch (bar) P P 12(bar)


48 (a) (b) F12

49 F13 F14
50 F15


51 F16
52 P (psi) P (psi) D = in D = 53.6 t L D = 2 P CO = 676 psi 1 Anal. 5 4 Ch T (ms) D = in D = 53.6 t L D = 2 P CO = 676 psi 1 Anal. 2 (a) Exp. 8 Ch. 3 P 40 (bar) T (ms) 4 (b) F Exp P 40 (bar)


53 F18

54 F19

55 Shell A z y z x F20


56 F21
57 P 200 (psi) D = in D = 53.6 t L D = 8 P CO = 197 psi Anal. 2 3 Ch. 1 Exp P 12(bar) P (psi) T (ms) D = in D = 53.6 t L D = 8 P CO = 197 psi Anal T (ms) (a) 2 (b) 3 F22 4 Exp. 5 6 Ch P 12 (bar)
58 P 200 (psi) D = in D = 53.6 t L D = 8 P CO = 197 psi Exp. Anal Ch P 12(bar) T (ms) (c) -4 F22


59
 F24")
60 (a) (b) (c) F24

61 F25
NUMERICAL SIMULATION OF FLUID-STRUCTURE INTERACTION PROBLEMS WITH DYNAMIC FRACTURE
 NUMERICAL SIMULATION OF FLUID-STRUCTURE INTERACTION PROBLEMS WITH DYNAMIC FRACTURE Kevin G. Wang (1), Patrick Lea (2), and Charbel Farhat (3) (1) Department of Aerospace, California Institute of Technology
PREDICTIVE SIMULATION OF UNDERWATER IMPLOSION: Coupling Multi-Material Compressible Fluids with Cracking Structures
 PREDICTIVE SIMULATION OF UNDERWATER IMPLOSION: Coupling Multi-Material Compressible Fluids with Cracking Structures Kevin G. Wang Virginia Tech Patrick Lea, Alex Main, Charbel Farhat Stanford University
AE3610 Experiments in Fluid and Solid Mechanics TRANSIENT MEASUREMENTS OF HOOP STRESSES FOR A THIN-WALL PRESSURE VESSEL
 Objective AE3610 Experiments in Fluid and Solid Mechanics TRANSIENT MEASUREMENTS OF OOP STRESSES FOR A TIN-WA PRESSURE VESSE This experiment will allow you to investigate hoop and axial stress/strain relations
5. STRESS CONCENTRATIONS. and strains in shafts apply only to solid and hollow circular shafts while they are in the
 5. STRESS CONCENTRATIONS So far in this thesis, most of the formulas we have seen to calculate the stresses and strains in shafts apply only to solid and hollow circular shafts while they are in the elastic
Tuesday, February 11, Chapter 3. Load and Stress Analysis. Dr. Mohammad Suliman Abuhaiba, PE
 1 Chapter 3 Load and Stress Analysis 2 Chapter Outline Equilibrium & Free-Body Diagrams Shear Force and Bending Moments in Beams Singularity Functions Stress Cartesian Stress Components Mohr s Circle for
SIZE EFFECTS IN THE COMPRESSIVE CRUSHING OF HONEYCOMBS
 43rd AIAA/ASME/ASCE/AHS/ASC Structures, Structural Dynamics, and Materials Con 22-25 April 2002, Denver, Colorado SIZE EFFECTS IN THE COMPRESSIVE CRUSHING OF HONEYCOMBS Erik C. Mellquistand Anthony M.
Dynamic Response Of Laminated Composite Shells Subjected To Impulsive Loads
 IOSR Journal of Mechanical and Civil Engineering (IOSR-JMCE) e-issn: 2278-1684,p-ISSN: 2320-334X, Volume 14, Issue 3 Ver. I (May. - June. 2017), PP 108-123 www.iosrjournals.org Dynamic Response Of Laminated
Supporting Online Material for
 www.sciencemag.org/cgi/content/full/313/5794/1765/dc1 Supporting Online Material for Self-Healing Pulse-Like Shear Ruptures in the Laboratory George Lykotrafitis, Ares J. Rosakis,* Guruswami Ravichandran
On the study of elastic wave scattering and Rayleigh wave velocity measurement of concrete with steel bar
 NDT&E International 33 (2000) 401 407 www.elsevier.com/locate/ndteint On the study of elastic wave scattering and Rayleigh wave velocity measurement of concrete with steel bar T.-T. Wu*, J.-H. Sun, J.-H.
Chapter 3. Experimentation and Data Acquisition
 48 Chapter 3 Experimentation and Data Acquisition In order to achieve the objectives set by the present investigation as mentioned in the Section 2.5, an experimental set-up has been fabricated by mounting
Expansion of circular tubes by rigid tubes as impact energy absorbers: experimental and theoretical investigation
 Expansion of circular tubes by rigid tubes as impact energy absorbers: experimental and theoretical investigation M Shakeri, S Salehghaffari and R. Mirzaeifar Department of Mechanical Engineering, Amirkabir
Size Effects In the Crushing of Honeycomb Structures
 45th AIAA/ASME/ASCE/AHS/ASC Structures, Structural Dynamics & Materials Conference 19-22 April 2004, Palm Springs, California AIAA 2004-1640 Size Effects In the Crushing of Honeycomb Structures Erik C.
Lecture #2: Split Hopkinson Bar Systems
 Lecture #2: Split Hopkinson Bar Systems by Dirk Mohr ETH Zurich, Department of Mechanical and Process Engineering, Chair of Computational Modeling of Materials in Manufacturing 2015 1 1 1 Uniaxial Compression
Chapter 3. Load and Stress Analysis. Lecture Slides
 Lecture Slides Chapter 3 Load and Stress Analysis 2015 by McGraw Hill Education. This is proprietary material solely for authorized instructor use. Not authorized for sale or distribution in any manner.
Mechanics of Materials II. Chapter III. A review of the fundamental formulation of stress, strain, and deflection
 Mechanics of Materials II Chapter III A review of the fundamental formulation of stress, strain, and deflection Outline Introduction Assumtions and limitations Axial loading Torsion of circular shafts
Unit 18 Other Issues In Buckling/Structural Instability
 Unit 18 Other Issues In Buckling/Structural Instability Readings: Rivello Timoshenko Jones 14.3, 14.5, 14.6, 14.7 (read these at least, others at your leisure ) Ch. 15, Ch. 16 Theory of Elastic Stability
Stresses Analysis of Petroleum Pipe Finite Element under Internal Pressure
 ISSN : 48-96, Vol. 6, Issue 8, ( Part -4 August 06, pp.3-38 RESEARCH ARTICLE Stresses Analysis of Petroleum Pipe Finite Element under Internal Pressure Dr.Ragbe.M.Abdusslam Eng. Khaled.S.Bagar ABSTRACT
Longitudinal buckling of slender pressurised tubes
 Fluid Structure Interaction VII 133 Longitudinal buckling of slender pressurised tubes S. Syngellakis Wesse Institute of Technology, UK Abstract This paper is concerned with Euler buckling of long slender
Exercise: concepts from chapter 8
 Reading: Fundamentals of Structural Geology, Ch 8 1) The following exercises explore elementary concepts associated with a linear elastic material that is isotropic and homogeneous with respect to elastic
INTERNATIONAL JOURNAL OF APPLIED ENGINEERING RESEARCH, DINDIGUL Volume 2, No 1, 2011
 Interlaminar failure analysis of FRP cross ply laminate with elliptical cutout Venkateswara Rao.S 1, Sd. Abdul Kalam 1, Srilakshmi.S 1, Bala Krishna Murthy.V 2 1 Mechanical Engineering Department, P. V.
The Ultimate Load-Carrying Capacity of a Thin-Walled Shuttle Cylinder Structure with Cracks under Eccentric Compressive Force
 The Ultimate Load-Carrying Capacity of a Thin-Walled Shuttle Cylinder Structure with Cracks under Eccentric Compressive Force Cai-qin Cao *, Kan Liu, Jun-zhe Dong School of Science, Xi an University of
Compressive Residual Stress Optimization in Laser Peening of a Curved Geometry
 Compressive Residual Stress Optimization in Laser Peening of a Curved Geometry Anoop Vasu and Ramana V. Grandhi Department of Mechanical and Materials Engineering, Wright State University, Dayton, OH,
Simulation of unsteady muzzle flow of a small-caliber gun
 Advances in Fluid Mechanics VI 165 Simulation of unsteady muzzle flow of a small-caliber gun Y. Dayan & D. Touati Department of Computational Mechanics & Ballistics, IMI, Ammunition Group, Israel Abstract
Using Thermal Boundary Conditions in SOLIDWORKS Simulation to Simulate a Press Fit Connection
 Using Thermal Boundary Conditions in SOLIDWORKS Simulation to Simulate a Press Fit Connection Simulating a press fit condition in SOLIDWORKS Simulation can be very challenging when there is a large amount
Chapter 7. Highlights:
 Chapter 7 Highlights: 1. Understand the basic concepts of engineering stress and strain, yield strength, tensile strength, Young's(elastic) modulus, ductility, toughness, resilience, true stress and true
ANSYS Explicit Dynamics Update. Mai Doan
 ANSYS Explicit Dynamics Update Mai Doan Mai.Doan@ansys.com +1 512 687 9523 1/32 ANSYS Explicit Dynamics Update Outline Introduction Solve Problems that were Difficult or Impossible in the Past Structural
Optimization of blank dimensions to reduce springback in the flexforming process
 Journal of Materials Processing Technology 146 (2004) 28 34 Optimization of blank dimensions to reduce springback in the flexforming process Hariharasudhan Palaniswamy, Gracious Ngaile, Taylan Altan ERC
FLEXIBILITY METHOD FOR INDETERMINATE FRAMES
 UNIT - I FLEXIBILITY METHOD FOR INDETERMINATE FRAMES 1. What is meant by indeterminate structures? Structures that do not satisfy the conditions of equilibrium are called indeterminate structure. These
Strain Measurement. Prof. Yu Qiao. Department of Structural Engineering, UCSD. Strain Measurement
 Strain Measurement Prof. Yu Qiao Department of Structural Engineering, UCSD Strain Measurement The design of load-carrying components for machines and structures requires information about the distribution
Task 1 - Material Testing of Bionax Pipe and Joints
 Task 1 - Material Testing of Bionax Pipe and Joints Submitted to: Jeff Phillips Western Regional Engineer IPEX Management, Inc. 20460 Duncan Way Langley, BC, Canada V3A 7A3 Ph: 604-534-8631 Fax: 604-534-7616
Validation of LS-DYNA MMALE with Blast Experiments
 12 th International LS-DYNA Users Conference Blast/Impact(3) Validation of LS-DYNA MMALE with Blast Experiments Yuli Huang and Michael R. Willford Arup, San Francisco, CA 94116 Leonard E. Schwer Schwer
Some Aspects Of Dynamic Buckling of Plates Under In Plane Pulse Loading
 Mechanics and Mechanical Engineering Vol. 12, No. 2 (2008) 135 146 c Technical University of Lodz Some Aspects Of Dynamic Buckling of Plates Under In Plane Pulse Loading Katarzyna Kowal Michalska, Rados
SHOCK FOCUSING IN WATER IN A CONVERGENT CARBON FIBER COMPOSITE STRUCTURE
 THE 19 TH INTERNATIONAL CONFERENCE ON COMPOSITE MATERIALS SHOCK FOCUSING IN WATER IN A CONVERGENT CARBON FIBER COMPOSITE STRUCTURE C. Wang 1, V. Eliasson 2 * 1 Department of Physics, University of Southern
Finite Element Modeling of Ultrasonic Transducers for Polymer Characterization
 Excerpt from the Proceedings of the COMSOL Conference 2009 Milan Finite Element Modeling of Ultrasonic Transducers for Polymer Characterization Serena De Paolis *, Francesca Lionetto and Alfonso Maffezzoli
IMPACT PROPERTY AND POST IMPACT VIBRATION BETWEEN TWO IDENTICAL SPHERES
 ICSV4 Cairns Australia 9- July, 7 IMPACT PROPERTY AND POST IMPACT VIBRATION BETWEEN TWO IDENTICAL SPHERES Hirofumi MINAMOTO, Keisuke SAITOH and Shozo KAWAMURA Toyohashi University of Technology Dept. of
Numerical Modelling of Dynamic Earth Force Transmission to Underground Structures
 Numerical Modelling of Dynamic Earth Force Transmission to Underground Structures N. Kodama Waseda Institute for Advanced Study, Waseda University, Japan K. Komiya Chiba Institute of Technology, Japan
Module 5: Failure Criteria of Rock and Rock masses. Contents Hydrostatic compression Deviatoric compression
 FAILURE CRITERIA OF ROCK AND ROCK MASSES Contents 5.1 Failure in rocks 5.1.1 Hydrostatic compression 5.1.2 Deviatoric compression 5.1.3 Effect of confining pressure 5.2 Failure modes in rocks 5.3 Complete
AE Source Orientation by Plate Wave Analysis * Michael R. Gorman Aeronautics and Astronautics Naval Postgraduate School Monterey, CA 93943
 AE Source Orientation by Plate Wave Analysis * Michael R. Gorman Aeronautics and Astronautics Naval Postgraduate School Monterey, CA 93943 William H. Prosser NASA Langley Research Center Hampton, VA 23665
NUMERICAL AND EXPERIMENTAL STUDY OF FAILURE IN STEEL BEAMS UNDER IMPACT CONDITIONS
 Blucher Mechanical Engineering Proceedings May 2014, vol. 1, num. 1 www.proceedings.blucher.com.br/evento/10wccm NUMERICAL AND EXPERIMENTAL STUDY OF FAILURE IN STEEL BEAMS UNDER IMPACT CONDITIONS E. D.
7. Hierarchical modeling examples
 7. Hierarchical modeling examples The objective of this chapter is to apply the hierarchical modeling approach discussed in Chapter 1 to three selected problems using the mathematical models studied in
The effect of plasticity in crumpling of thin sheets: Supplementary Information
 The effect of plasticity in crumpling of thin sheets: Supplementary Information T. Tallinen, J. A. Åström and J. Timonen Video S1. The video shows crumpling of an elastic sheet with a width to thickness
PEAT SEISMOLOGY Lecture 9: Anisotropy, attenuation and anelasticity
 PEAT8002 - SEISMOLOGY Lecture 9: Anisotropy, attenuation and anelasticity Nick Rawlinson Research School of Earth Sciences Australian National University Anisotropy Introduction Most of the theoretical
NUMERICAL SIMULATION OF HYDROGEN EXPLOSION TESTS WITH A BARRIER WALL FOR BLAST MITIGATION
 NUMERICAL SIMULATION OF HYDROGEN EXPLOSION TESTS WITH A BARRIER WALL FOR BLAST MITIGATION NOZU, T. 1, TANAKA, R., OGAWA, T. 3, HIBI, K. 1 and SAKAI, Y. 4 1 Institute of Technology, Shimizu Corporation,
Load Cell Design Using COMSOL Multiphysics
 Load Cell Design Using COMSOL Multiphysics Andrei Marchidan, Tarah N. Sullivan and Joseph L. Palladino Department of Engineering, Trinity College, Hartford, CT 06106, USA joseph.palladino@trincoll.edu
93. Study on the vibration characteristics of structural of hydrocyclone based on fluid structure interaction
 93. Study on the vibration characteristics of structural of hydrocyclone based on fluid structure interaction Sen Li 1, Chunhong Dong 2, Zunce Wang 3, Yan Xu 4, Yuejuan Yan 5, Daoli Zhai 6 College of Mechanical
Brittle Deformation. Earth Structure (2 nd Edition), 2004 W.W. Norton & Co, New York Slide show by Ben van der Pluijm
, 2004 W.W. Norton & Co, New York Slide show by Ben van der Pluijm") Lecture 6 Brittle Deformation Earth Structure (2 nd Edition), 2004 W.W. Norton & Co, New York Slide show by Ben van der Pluijm WW Norton, unless noted otherwise Brittle deformation EarthStructure (2 nd
Lecture 6 Brittle Deformation Earth Structure (2 nd Edition), 2004 W.W. Norton & Co, New York Slide show by Ben van der Pluijm WW Norton, unless noted otherwise Brittle deformation EarthStructure (2 nd
Figure 1 Lifting Lug Geometry with Weld
 Should you Perform Nonlinear Stress Analysis? Many of our clients inquire whether nonlinearity should be considered in their analyses. The answer to that question is not simple. Sometimes, as in certain
Influence of residual stresses in the structural behavior of. tubular columns and arches. Nuno Rocha Cima Gomes
 October 2014 Influence of residual stresses in the structural behavior of Abstract tubular columns and arches Nuno Rocha Cima Gomes Instituto Superior Técnico, Universidade de Lisboa, Portugal Contact:
Laboratory 4 Topic: Buckling
 Laboratory 4 Topic: Buckling Objectives: To record the load-deflection response of a clamped-clamped column. To identify, from the recorded response, the collapse load of the column. Introduction: Buckling
CHAPTER 4: BENDING OF BEAMS
 (74) CHAPTER 4: BENDING OF BEAMS This chapter will be devoted to the analysis of prismatic members subjected to equal and opposite couples M and M' acting in the same longitudinal plane. Such members are
MITOCW MITRES2_002S10nonlinear_lec15_300k-mp4
 MITOCW MITRES2_002S10nonlinear_lec15_300k-mp4 The following content is provided under a Creative Commons license. Your support will help MIT OpenCourseWare continue to offer high quality educational resources
EQUIVALENT FRACTURE ENERGY CONCEPT FOR DYNAMIC RESPONSE ANALYSIS OF PROTOTYPE RC GIRDERS
 EQUIVALENT FRACTURE ENERGY CONCEPT FOR DYNAMIC RESPONSE ANALYSIS OF PROTOTYPE RC GIRDERS Abdul Qadir Bhatti 1, Norimitsu Kishi 2 and Khaliq U Rehman Shad 3 1 Assistant Professor, Dept. of Structural Engineering,
A RESEARCH ON NONLINEAR STABILITY AND FAILURE OF THIN- WALLED COMPOSITE COLUMNS WITH OPEN CROSS-SECTION
 A RESEARCH ON NONLINEAR STABILITY AND FAILURE OF THIN- WALLED COMPOSITE COLUMNS WITH OPEN CROSS-SECTION H. Debski a*, J. Bienias b, P. Jakubczak b a Faculty of Mechanical Engineering, Department of Machine
[5] Stress and Strain
![[5] Stress and Strain](/thumbs/95/123344550.jpg "[5] Stress and Strain") [5] Stress and Strain Page 1 of 34 [5] Stress and Strain [5.1] Internal Stress of Solids [5.2] Design of Simple Connections (will not be covered in class) [5.3] Deformation and Strain [5.4] Hooke s Law
[5] Stress and Strain Page 1 of 34 [5] Stress and Strain [5.1] Internal Stress of Solids [5.2] Design of Simple Connections (will not be covered in class) [5.3] Deformation and Strain [5.4] Hooke s Law
Improving Safety Provisions of Structural Design of Containment Against External Explosion
 IAEA-CN-164-3P09 Improving Safety Provisions of Structural Design of Containment Against External Explosion Javed Iqbal Pakistan Atomic Energy Commission Saeed Ahmad University of Engineering & Technology,
MECHANICAL FAILURE OF A COMPOSITE HELICOPTER STRUCTURE UNDER STATIC LOADING
 MECHANICAL FAILURE OF A COMPOSITE HELICOPTER STRUCTURE UNDER STATIC LOADING Steven Roy, Larry Lessard Dept. of Mechanical Engineering, McGill University, Montreal, Québec, Canada ABSTRACT The design and
Shock factor investigation in a 3-D finite element model under shock loading
 10(2013) 941 952 Shock factor investigation in a 3-D finite element model under shock loading Abstract In this paper, a scaled 3D ship under shock loading is modeled and analyzed by finite element method.
Model tests and FE-modelling of dynamic soil-structure interaction
 Shock and Vibration 19 (2012) 1061 1069 1061 DOI 10.3233/SAV-2012-0712 IOS Press Model tests and FE-modelling of dynamic soil-structure interaction N. Kodama a, * and K. Komiya b a Waseda Institute for
6 th Pipeline Technology Conference 2011
 6 th Pipeline Technology Conference 2011 Mechanical behavior of metal loss in heat affected zone of welded joints in low carbon steel pipes. M. J. Fernández C. 1, J. L. González V. 2, G. Jarvio C. 3, J.
Modeling seismic wave propagation during fluid injection in a fractured network: Effects of pore fluid pressure on time-lapse seismic signatures
 Modeling seismic wave propagation during fluid injection in a fractured network: Effects of pore fluid pressure on time-lapse seismic signatures ENRU LIU, SERAFEIM VLASTOS, and XIANG-YANG LI, Edinburgh
Dynamic analysis. 1. Force and stress
 Dynamic analysis 1. Force and stress Dynamics is the part of structural geology that involves energy, force, stress, and strength. It's very important to distinguish dynamic concepts from kinematic ones.
STRESS STRAIN AND DEFORMATION OF SOLIDS, STATES OF STRESS
 1 UNIT I STRESS STRAIN AND DEFORMATION OF SOLIDS, STATES OF STRESS 1. Define: Stress When an external force acts on a body, it undergoes deformation. At the same time the body resists deformation. The
7.2.1 Seismic waves. Waves in a mass- spring system
 7..1 Seismic waves Waves in a mass- spring system Acoustic waves in a liquid or gas Seismic waves in a solid Surface waves Wavefronts, rays and geometrical attenuation Amplitude and energy Waves in a mass-
Mechanical Shock Testing for LIGA Materials Characterization
 Mechanical Shock Testing for LIGA Materials Characterization Vesta I. Bateman Alfredo M. Morales Principal Member of Technical Staff Sandia National Laboratories* P.O. Box 58, MS553 Albuquerque, NM 87185-553
Strain Measurement Techniques for Composite Coupon Testing
 Strain Measurement Techniques for Composite Coupon Testing Introduction Characterization of the properties of anisotropic and inhomogeneous composite materials for use in demanding structural applications
End forming of thin-walled tubes
 Journal of Materials Processing Technology 177 (2006) 183 187 End forming of thin-walled tubes M.L. Alves a, B.P.P. Almeida b, P.A.R. Rosa b, P.A.F. Martins b, a Escola Superior de Tecnologia e Gestão
A Higher-Order Generalized Ghost Fluid Method for the Poor for the Three-Dimensional Two-Phase Flow Computation of Underwater Implosions
 A Higher-Order Generalized Ghost Fluid Method for the Poor for the Three-Dimensional Two-Phase Flow Computation of Underwater Implosions Charbel Farhat, Arthur Rallu, Sriram Shankaran Department of Mechanical
CENG 501 Examination Problem: Estimation of Viscosity with a Falling - Cylinder Viscometer
 CENG 501 Examination Problem: Estimation of Viscosity with a Falling - Cylinder Viscometer You are assigned to design a fallingcylinder viscometer to measure the viscosity of Newtonian liquids. A schematic
Exp. #1-1 : Measurement of the Characteristics of the Centripetal Force by Using Springs and a Computer Interface
 PAGE 1/13 Exp. #1-1 : Measurement of the Characteristics of the Centripetal Force by Using Springs and a Computer Interface Student ID Major Name Team No. Experiment Lecturer Student's Mentioned Items
Abstract. 1 Introduction
 Contact analysis for the modelling of anchors in concrete structures H. Walter*, L. Baillet** & M. Brunet* *Laboratoire de Mecanique des Solides **Laboratoire de Mecanique des Contacts-CNRS UMR 5514 Institut
Mechanical Properties of Materials
 Mechanical Properties of Materials Strains Material Model Stresses Learning objectives Understand the qualitative and quantitative description of mechanical properties of materials. Learn the logic of
STRAIN GAUGES YEDITEPE UNIVERSITY DEPARTMENT OF MECHANICAL ENGINEERING
 STRAIN GAUGES YEDITEPE UNIVERSITY DEPARTMENT OF MECHANICAL ENGINEERING 1 YEDITEPE UNIVERSITY ENGINEERING FACULTY MECHANICAL ENGINEERING LABORATORY 1. Objective: Strain Gauges Know how the change in resistance
Esben Byskov. Elementary Continuum. Mechanics for Everyone. With Applications to Structural Mechanics. Springer
 Esben Byskov Elementary Continuum Mechanics for Everyone With Applications to Structural Mechanics Springer Contents Preface v Contents ix Introduction What Is Continuum Mechanics? "I Need Continuum Mechanics
Lecture #10: Anisotropic plasticity Crashworthiness Basics of shell elements
 Lecture #10: 151-0735: Dynamic behavior of materials and structures Anisotropic plasticity Crashworthiness Basics of shell elements by Dirk Mohr ETH Zurich, Department of Mechanical and Process Engineering,
LECTURE NO. 4-5 INTRODUCTION ULTRASONIC * PULSE VELOCITY METHODS
 LECTURE NO. 4-5 ULTRASONIC * PULSE VELOCITY METHODS Objectives: To introduce the UPV methods To briefly explain the theory of pulse propagation through concrete To explain equipments, procedures, calibrations,
Computational Analysis for Composites
 Computational Analysis for Composites Professor Johann Sienz and Dr. Tony Murmu Swansea University July, 011 The topics covered include: OUTLINE Overview of composites and their applications Micromechanics
FATIGUE DAMAGE PROGRESSION IN PLASTICS DURING CYCLIC BALL INDENTATION
 FATIGUE DAMAGE PROGRESSION IN PLASTICS DURING CYCLIC BALL INDENTATION AKIO YONEZU, TAKAYASU HIRAKAWA, TAKESHI OGAWA and MIKIO TAKEMOTO Department of Mechanical Engineering, College of Science and Engineering,
Lecture 19. Measurement of Solid-Mechanical Quantities (Chapter 8) Measuring Strain Measuring Displacement Measuring Linear Velocity
 Measuring Strain Measuring Displacement Measuring Linear Velocity") MECH 373 Instrumentation and Measurements Lecture 19 Measurement of Solid-Mechanical Quantities (Chapter 8) Measuring Strain Measuring Displacement Measuring Linear Velocity Measuring Accepleration and
MECH 373 Instrumentation and Measurements Lecture 19 Measurement of Solid-Mechanical Quantities (Chapter 8) Measuring Strain Measuring Displacement Measuring Linear Velocity Measuring Accepleration and
7.6 Stress in symmetrical elastic beam transmitting both shear force and bending moment
 7.6 Stress in symmetrical elastic beam transmitting both shear force and bending moment à It is more difficult to obtain an exact solution to this problem since the presence of the shear force means that
LINEAR AND NONLINEAR BUCKLING ANALYSIS OF STIFFENED CYLINDRICAL SUBMARINE HULL
 LINEAR AND NONLINEAR BUCKLING ANALYSIS OF STIFFENED CYLINDRICAL SUBMARINE HULL SREELATHA P.R * M.Tech. Student, Computer Aided Structural Engineering, M A College of Engineering, Kothamangalam 686 666,
2. FLUID-FLOW EQUATIONS SPRING 2019
 2. FLUID-FLOW EQUATIONS SPRING 2019 2.1 Introduction 2.2 Conservative differential equations 2.3 Non-conservative differential equations 2.4 Non-dimensionalisation Summary Examples 2.1 Introduction Fluid
Dynamic Analysis for Needle Roller Bearings Under Planetary Motion
 NTN TECHNICAL REVIEW No.75 2007 Technical Paper Dynamic Analysis for Needle Roller Bearings Under Planetary Motion Tomoya SAKAGUCHI A dynamic analysis tool for needle roller bearings in planetary gear
PHYSICS 111 SPRING EXAM 3: April 12, 2016; 8:15pm - 9:45pm
 PHYSICS 111 SPRING 2016 EXAM 3: April 12, 2016; 8:15pm - 9:45pm Name (printed): Recitation Instructor: Section # INSTRUCTIONS: This exam contains 20 multiple-choice questions plus 1 extra credit question,
CONCRETE TECHNOLOGY LABORATORY
 CONCRETE TECHNOLOGY LABORATORY DEPARTMENT OF CIVIL ENGINEERING CHULALONGKORN UNIVERSITY Tested by... ID No.... Date... Graded by... TEST No. C-7 NON-DESTRUCTIVE TEST OF HARDENED CONCRETE Part A Pulse Velocity
Game Physics. Game and Media Technology Master Program - Utrecht University. Dr. Nicolas Pronost
 Game and Media Technology Master Program - Utrecht University Dr. Nicolas Pronost Soft body physics Soft bodies In reality, objects are not purely rigid for some it is a good approximation but if you hit
Numerical simulation of the coil spring and investigation the impact of tension and compression to the spring natural frequencies
 Numerical simulation of the coil spring and investigation the impact of tension and compression to the spring natural frequencies F. D. Sorokin 1, Zhou Su 2 Bauman Moscow State Technical University, Moscow,
March 24, Chapter 4. Deflection and Stiffness. Dr. Mohammad Suliman Abuhaiba, PE
 Chapter 4 Deflection and Stiffness 1 2 Chapter Outline Spring Rates Tension, Compression, and Torsion Deflection Due to Bending Beam Deflection Methods Beam Deflections by Superposition Strain Energy Castigliano
Kuo-Long LEE, Wen-Fung PAN and Chien-Min HSU
 212 Experimental and Theoretical Evaluations of the Effect between Diameter-to-Thickness Ratio and Curvature-Rate on the Stability of Circular Tubes under Cyclic Bending Kuo-Long LEE, Wen-Fung PAN and
Force analysis of underwater object with supercavitation evolution
 Indian Journal of Geo-Marine Sciences Vol. 42(8), December 2013, pp. 957-963 Force analysis of underwater object with supercavitation evolution B C Khoo 1,2,3* & J G Zheng 1,3 1 Department of Mechanical
The Dynamical Loading of the WWER440/V213 Reactor Pressure Vessel Internals during LOCA Accident in Hot and Cold Leg of the Primary Circuit
 The Dynamical Loading of the WWER440/V213 Reactor Pressure Vessel Internals during LOCA Accident in Hot and Cold Leg of the Primary Circuit ABSTRACT Peter Hermansky, Marian Krajčovič VUJE, Inc. Okružná
Cherenkov Detector. Cosmic Rays Cherenkov Detector. Lodovico Lappetito. CherenkovDetector_ENG - 28/04/2016 Pag. 1
 Cherenkov Detector Cosmic Rays Cherenkov Detector Lodovico Lappetito CherenkovDetector_ENG - 28/04/2016 Pag. 1 Table of Contents Introduction on Cherenkov Effect... 4 Super - Kamiokande... 6 Construction
Chapter 3. Load and Stress Analysis
 Chapter 3 Load and Stress Analysis 2 Shear Force and Bending Moments in Beams Internal shear force V & bending moment M must ensure equilibrium Fig. 3 2 Sign Conventions for Bending and Shear Fig. 3 3
Discrete Element Modelling of a Reinforced Concrete Structure
 Discrete Element Modelling of a Reinforced Concrete Structure S. Hentz, L. Daudeville, F.-V. Donzé Laboratoire Sols, Solides, Structures, Domaine Universitaire, BP 38041 Grenoble Cedex 9 France sebastian.hentz@inpg.fr
ME 475 Modal Analysis of a Tapered Beam
 ME 475 Modal Analysis of a Tapered Beam Objectives: 1. To find the natural frequencies and mode shapes of a tapered beam using FEA.. To compare the FE solution to analytical solutions of the vibratory
Lecture 20. Measuring Pressure and Temperature (Chapter 9) Measuring Pressure Measuring Temperature MECH 373. Instrumentation and Measurements
 Measuring Pressure Measuring Temperature MECH 373. Instrumentation and Measurements") MECH 373 Instrumentation and Measurements Lecture 20 Measuring Pressure and Temperature (Chapter 9) Measuring Pressure Measuring Temperature 1 Measuring Acceleration and Vibration Accelerometers using
MECH 373 Instrumentation and Measurements Lecture 20 Measuring Pressure and Temperature (Chapter 9) Measuring Pressure Measuring Temperature 1 Measuring Acceleration and Vibration Accelerometers using
FREE VIBRATION ANALYSIS OF THIN CYLINDRICAL SHELLS SUBJECTED TO INTERNAL PRESSURE AND FINITE ELEMENT ANALYSIS
 FREE VIBRATION ANALYSIS OF THIN CYLINDRICAL SHELLS SUBJECTED TO INTERNAL PRESSURE AND FINITE ELEMENT ANALYSIS J. Kandasamy 1, M. Madhavi 2, N. Haritha 3 1 Corresponding author Department of Mechanical
Samantha Ramirez, MSE. Stress. The intensity of the internal force acting on a specific plane (area) passing through a point. F 2
 passing through a point. F 2") Samantha Ramirez, MSE Stress The intensity of the internal force acting on a specific plane (area) passing through a point. Δ ΔA Δ z Δ 1 2 ΔA Δ x Δ y ΔA is an infinitesimal size area with a uniform force
Samantha Ramirez, MSE Stress The intensity of the internal force acting on a specific plane (area) passing through a point. Δ ΔA Δ z Δ 1 2 ΔA Δ x Δ y ΔA is an infinitesimal size area with a uniform force
The Simulation of Dropped Objects on the Offshore Structure Liping SUN 1,a, Gang MA 1,b, Chunyong NIE 2,c, Zihan WANG 1,d
 Advanced Materials Research Online: 2011-09-02 ISSN: 1662-8985, Vol. 339, pp 553-556 doi:10.4028/www.scientific.net/amr.339.553 2011 Trans Tech Publications, Switzerland The Simulation of Dropped Objects
Numerical Simulation of Impacts involving a Collapsible Nonlinear Multilayer Structure
 Numerical Simulation of Impacts involving a Collapsible Nonlinear Multilayer Structure Michael A. Sek Abstract A numerical model for the simulation of dynamic compression of a nonlinear multilayer structure
ME Final Exam. PROBLEM NO. 4 Part A (2 points max.) M (x) y. z (neutral axis) beam cross-sec+on. 20 kip ft. 0.2 ft. 10 ft. 0.1 ft.
 M (x) y. z (neutral axis) beam cross-sec+on. 20 kip ft. 0.2 ft. 10 ft. 0.1 ft.") ME 323 - Final Exam Name December 15, 2015 Instructor (circle) PROEM NO. 4 Part A (2 points max.) Krousgrill 11:30AM-12:20PM Ghosh 2:30-3:20PM Gonzalez 12:30-1:20PM Zhao 4:30-5:20PM M (x) y 20 kip ft 0.2
ME 323 - Final Exam Name December 15, 2015 Instructor (circle) PROEM NO. 4 Part A (2 points max.) Krousgrill 11:30AM-12:20PM Ghosh 2:30-3:20PM Gonzalez 12:30-1:20PM Zhao 4:30-5:20PM M (x) y 20 kip ft 0.2