THE BEHAVIOUR OF THREE-F iase SQUIRREL CAGE INDUCTION MOTORS WITH UNBALANCE IN THE ROTOR IMPEDANCE; IN PARTICULAR TWO POLE MOTORS
|
|
|
- Gordon Whitehead
- 6 years ago
- Views:
Transcription

1 THE BEHAVIOUR OF THREE-F iase SQUIRREL CAGE INDUCTION MOTORS WITH UNBALANCE IN THE ROTOR IMPEDANCE; IN PARTICULAR TWO POLE MOTORS Itzhak Kerszenbaum A thesis submitted to the Faculty of Engineering, University of the Witwatersrand, Johannesburg for the degree of Doctor of Philosophy Johannesburg, 1983

2 DECLARATION I hereby declare that this thesis is my own work and that no part or substance of it has previously been submitted for a degree at any University I. KERSZENBAUM
3 my wife and children Jacqueline Livnat and Yigal


4 FOREWORD it is well known, that in squi *rel cage induction motors haying non -insu1a ted or partially insulated cages, relatively small inter -bar currents exist. It has been shown15,30 that these small currents significantly affect the torque-speed characteristic of the motor and also give rise to additional losses. The existing theories, dealing with inter-bar currents, are all restricted to machines with healthy cages, ie with squirrel cages having no broken bars and/or endrings. It is surprising that despite the understanding that has been developed of inter-tar currents and their effects in healthy cage motors, to the best of the author s knowledge no such theory has been oroposed for the case of the faulty cage. The author became aware of certain characteristics in the behaviour of induction motors with faulty cages while working with these machines in industry. This behaviour indicated the possibility that large inter-bar currents were present, because burnt laminations were found, and also large axial and current dependent vibrations were measured. The existing theories do not offer satisfactory explanations of the phenomena observed. Therefore, it was decided that this aspect of the effects of broken rotor-bars and/or endrings, and the associated production of inter-bar currents should be thoroughly investigated. This forms the basis of the research outlined in this thesis.


5 PAGE 11 Pests were conducted on a number of large industrial squirrel cage nduction motors having outputs in the range half to one and a half megawatts. Initially these machines were specially constructed with broken cages and a series of measurements were taken. Subsequently the rotors were renewed with complete cages and the measurements were repeated. In this way, complete comparisons of the behaviours were obtained for the machines having both healthy and broken rotor-bars. in addition, laboratory tests were conducted on a number of small motors; in particular on an inverted experimental squirrel cage motor. The evaluation ot the inter-bar impedance is of prime importance to the understanding of the process of the production of inter-bar currents. The equations describing this inter-bar impedance are developed in Chapter 2, as well a^ in appendices B and :. Chapter 3 describes the methods and techniques used in the experimental measurements carried out on the industrial motors. Also the aims?nd objectives of these tests are fully disscused. The detailed results of the tests described in Chapter 3 are given in appendices A and D, wr.ile Appendix E gives a description of the industrial and the experimental motors. The equations describing the magnitude and distribution of the inter-bar currents are developed in Chapter 4, where the relevant background is also presented. Chapter S describes the effects that these inter-bar currents have on the vibration patterns produced by the motors. A new technique for detecting unbalance in the secondary impedance is presented in Chapter 6. It is
6 PAGE ill interesting to note that simultaneously the same technique was proposed by other researchers in the United Kingdom7. This approach for fault detection was shown to be viable by both the author and the others, neither having any prior knowledge of the others work. The basis of the theory regarding the inter-bar currents developed in this work has been accepted for publication by the South African Institute of Electrical Engineers. A later, and more comprehensive paper has been accepted for publication by the American IEEE (Power Apparatus and Systems).

7 a c k n o w l e d g m e n t s The Author extends his sincere thanks and appreciation to the following people and institutions who in a variety of ways have contributed to the fulfilment of this investigation; Professor C.F. Landy of the Department of Electrical Engineering, University of the Witwatersrand, thw project supervisor. The advice, guidance, assistance and friendship offered by him throughout the duration of this research project has been invaluable. - Mr. A.S. Meyer, Technical Director. GEC Machines SA, whose personal involvement and never failing interest made it possible for this oroject to be undertaken. - GEC Machines (Pty) Ltd. SA., for building the core of the inverted experimental motor, for allowing the Author to specially modify industrial motor A for the purposes of this research, and for allowing the Author to carry out tests on several other motors. - The Council for Scientific and Industrial Research, SA (CSIr) for the substantial financial assistance provided. Without this support this project could not have been undertaken. - tv -
8 PAGE v - Mr. v. Franzsen, for his invaluable assistance in carrying out the vibration tests on both industrial machines. technical aspects related to the design and testing of both industrial machines. - Mr. K. Gray and the workshop staff of the Department of Electrical engineering of the University of the.vitwatersrand, for their help rendered during the course of this project. FinalIv I wou;j.ike to thank my wife, Jacqueline, for her never failing encourag, ment and support during the course of this project. V *
 - drive-end side of motor - direct-on-line - electric field (vector) - frequency in Hz unless otherwise specified - frequency of the fundamental - frequency of negative sequence components")
9 LIST or PRINCIPAL SYMBOLS Ac - effective conducting area in rotor-bar due to the depth of penetration1 effect B CACA BE DOL E f fq fn fp fsr - flux density - cooler-a ir/cooler-a ir (type of motor enclosure) - drive-end side of motor - direct-on-line - electric field (vector) - frequency in Hz unless otherwise specified - frequency of the fundamental - frequency of negative sequence components - frequency of positive sequence components - frequency of pulsation arising from the interaction between a stator produced space harmonic and a rotor asymmetry ftr - frequency of currents induced in the rotor FLT g H I II - ful1-load-torque - radial airgap length - magnetic field (vector) - rotor rotational inertia - primary current per-phase 12 - secondary referred current per-phase 2.1b (x) - actual rotor-bar current flowing in the 'broken1 bar at a distance x of the 'healthy1 endring Ibb - actual current flowing into the 'broken1 bar from the 'healthy' endring


10 PAGE vii In It 2 Ale (x)- <5Ic (x) J kd ko actual average current flowing i tha 3quirrel cage actual total current flowing in the System comprising the broken' bar and the two adjacent bars actual current flowing from the broken- bar into the core at a distance x from the healthy- endring function of the distribution along the core of the inter-bar current current density winding distribution factor coil pitch factor kws - S h a t-r-1r U W stator winding factor» kd.kp kwr km - rotor v inding factor - -measurement constant-, equal to the tangent of the H n e passing through the points of rotor-bar currents drawn against the primary current for each toroid i V gross length of core - effective length of core inter-bar inductance mmf " magneto-motive-force 1,1 ' number of 3t3t«urn, in series oer-ohase NDE nuh-drive end side of motor 0D overall diameter number of pairs of poles POT - pull-out-torgue - order of secondary produced space harmonic - rotor bar-to-core resistance per unit of core V---
 1) Pcbr - contact resistance between rotor-bar and")
 1 rpm - revolutions per minute n.")
11 PAGE /111 length R RL R2 Rb - equivalent radius of ro^.or-bar - primary resistance per-phase - referred secondary resistance oer-phase - rotor-bar resistance Rc - inter-bar resistance (Rc» Ry-j(ru ) 1) Pcbr - contact resistance between rotor-bar and endring R(», ) - resistance of the iron between two points in the periphery of the rotor core (per unit of core length) R N N ( '» 1 - tctai resistance per unit of core length between two bars with an angle»0 in between them IRm n ( V * r0 + R( t ) 1 rpm - revolutions per minute n.rpm - n 1 mult in'as of the actual rotor speed s st - slip of the mo or - slip of the s oace harmonic of order 't ' 51 - number of stator slots 52 - number of rotor slots (single cage) ST t - starting torque - order of primary produced space harmonic field Tnett - nett available torque at shaft Tm Tfr Tw - electromagnetic torque (airgap torque) - friction torque - windage torque Tfw - combined friction and windage torque (Tfw Tfr + Tw) U1 - primary phase voltage

12 PAGE ix UMP D.V, VC Vis - unbalanced magnetic pull ultra violet (foe torque-speed measurements) velocity O) the mmf waves existing in the airg p peripheral velocity of rotor w.r.t. the stator velocity of the fundamental field produced by the stator VI r - velocity of the fundamental field produced by the rotor Vts velocity of the t'th space harmonic field produced by the stator Vqr velocity of the 'q'th space harmonic field produced by the rotor XI X2 Xm Xb primary leakage reactance per-phase - referred secondary leakage reactance per-phase - magnetizing reactance - second:ry slot leakage reactance - inter-bar reactance - rotor-bar impedance - inter-bar impedance Zring - endring impedance - angle between two given rotor-bars - conductivity (o» l/p) a - permeability { ## = relative permeability of the material inter-bar current distribution factor ( 1? V 3 1Zb/RcI ) - wavelength of the fundamental field
13 PAGE x wavelength of the space harmonic field of order 't 1 angular angular angular speed in rad ians/sec speed of rotor speed of the stator produced space harmonic field of order 't 1 angular speed of the fundamental field permittivity ( *,«0 ) relative rermittivity permittivity of free space (=8,854,10"" F/m)


14 CONTENTS Page FOREWORD... 1 ACKNOWLEDGMENTS... LIST OF PRINCIPAL SYMBOLS.... CONTENTS... x, CHAPTER 1 - INTRODUCTION CHAPTER 2 - ROTOR-BAR IMPEDANCE AND FLUX DISTRIBUTION IN THE SHAFT...2-l Inter-bar impedance Assessment of the contact resistance ^r0 ******** The effect of frequency on the interbar impedance The effect of flux penetration into the shaft CHAPTER 3 - MEASUREMENTS PERFORMED ON THE INDUSTRIAL MACHINES Tests on industrial motor A Measurement of the locked-rotor rotor -ba r currents

15 PAGE xii Effect of temperature on the rotorbar resistance Locked-rotor torque measurement Vibration measurements No-load vibration measurement (motor uncoupled) Vibration measurements on load Measurement of the torque-speed characteristics Friction and windage effects on the tor cue-speed measurements Tests on industrial motor B CHAPTER -* 4.1 THE PRODUCTION OF INTER-BAR CURRENTS Calculation of tne current flowing into the broken' bar Experimental verification of the ratio IIbb/Rc! (eauation [4.6]) Axial distribution of the current entering the core from the 'broken' bar Experimental verification of equation [4.7] The inverted experimental motor Effect of the inter-bar currents on the starting torque and pul 1-out-torque...4-3% CHAPTER 5 VIBRATIONS DUE TO UNBALANCE IN THE ROTOR IMPEDANCE...5-1

![1 - Current harmonic spectrum...5-2 6.2 - Experimental verification of equations [6.5] and [6.6 ]...6-6 CHAPTER 7 - CONCLUSIONS.... APPENDIX A - CALIBRATION OF THE TOROIDAL COILS.](/docs-images/71/65413009/images/16-2.jpg "..A-l APPENDIX B - CALCULATION OF INTER-BAR RESISTANCE FOR A CIRCULAR CORE WITH INNER DIAMETER EQUAL TO ZERO.... APPENDIX C - CALCULATION OF THE INTER-BAR INDUCTANCE.")
16 PAGE xiii Vibration due to rotor asymmetry and airgap eccentricity. Change in the normal UMP Vibration due to interaction between rotor asymmetry and space harmonic fields Vibrations due to tangential inter-bar currents CHAPTER 6 - CHANGES IN THE HARMONIC SPECTRUM OF THE PRIMARY CURRENT DUE TO BROKEN CAGE-BARS AND/OR ENDRINGS Current harmonic spectrum Experimental verification of equations [6.5] and [6.6 ] CHAPTER 7 - CONCLUSIONS.... APPENDIX A - CALIBRATION OF THE TOROIDAL COILS...A-l APPENDIX B - CALCULATION OF INTER-BAR RESISTANCE FOR A CIRCULAR CORE WITH INNER DIAMETER EQUAL TO ZERO.... APPENDIX C - CALCULATION OF THE INTER-BAR INDUCTANCE...C-l APPENDIX D - RESULTS OF MEASUREMENTS TAKEN ON THE INDUSTRIAL MOTORS...D-l D.l - Tests on industrial motor A... D-l D Measurement of the locked-rotor
... 0-20 0.1.3b- Comparison of vibration patterns taxen at rated and reducej voltage.")
...E-l E.2 - Industrial motor B (Figure E.")
17 PAGE XiV rotor -bar currents... o-l D.l.la- Comparison between measured and calculated rotor-bar currents D.l.lb- Harmonic content of the rotor-bar currents measured during the lockedrotor test... D-17 D Locked-rotor torque measurement... u-19 D Vibration measurements a- No-load vibration measurements ( broken1 bar condition only) b- Comparison of vibration patterns taxen at rated and reducej voltage c- Vibration measurements on load... D Measurement of the torque-speed characteristics Tests on industrial motor E Measurement of impedance unbalance # under locked-rotor Measurement of vibrations on load V APPENDIX E - TECHNICAL DATA OF THE INDUSTRIAL AND EXPERIMENTAL MOTORS... E-l E.l - Induatrial motor A (Figure E.1)...E-l E.2 - Industrial motor B (Figure E.6 )... e-5 E.3 - Inverted-geometry experimental motor...e-7 REFERENCES R-l

18 CHAPTER 1 INTRODUCTION The earliest record of serious consideration being given to the effects of unbalance in the impedance of the secondary of an induction motor (almost ilways the rotating member) was in 1896, which is approximately ten years after Tesla and Ferraris invented this machine. This was observed by 2 Gorge the so called Gorges phenomenon, where the induction motor runs at half the normal speed when one phase of the secondary circuit is left ooen. Since then, much has been written on ttv behaviour or induction machines having unbalanced secondary impedances? the overwhelming majority dealing with wound rotors*"'* '. Until fairly recently little interest was shown in the electromagnetic unbalance effects present in squirrel cage tears. The main reason for this lack of interest was iue to the fact that the earlier squirrel cage motors were over-designed, by todays standards (the output per frame size is approximately ten times greater today). Therefore, many vibration problems did not rear the.r heads due to the lower fields strength used, and also due to the mechanical robustness of the overall structure. Most of the research carried out on the effects of unba inced secondary impedance of squirrel cage motors, in those times, was confined to the search for some special characteristic (eg We ichsel1s ' work on split endrings to achieve an increase in starting torque).


19 PAGE 1-2 Nowdays, induction machines have become the prime source of electromechanical energy conversion in modern society, from miniature drives to the large industrial motors well megawatt region. Of more recent times synchronous machines are also being used for variable speed drives, previously reserved for DC machines. This has been made possible by modern electronic technology, which i conjunction with the AC machine provides a drive having similar characteristics to these of the DC systems, at very competitive prices. This is particulary true in the case of squirrel cage motors which also offer higher reliability lower maintenance. and -wing to the higher reliability and lower maintenance requirements, squirrel cage motors form the vast majority of induction machines manufactured. This, coupled to the ever increasing demand for more efficient, less noisy and less expensive (more kw output per kg mass, machines, has created che necessity to look for improvements in places that Heretofore have received little attention. The higher, and still growing outputs, obtained from smaller frames has created the situation where the main factors limiting any further increase in the ratio output/mass are mechanical in nature (shaft diameter, bearings, etc, and not electrically related (insulation, current density, etc.,. vibration, Which has a direct detrimental effect on material fatigue, has became the subject of intensive study by many researchers. The same can be said about the related noise emission from electrical machines which is coming more and


20 PAGE 1-2 Nowdays, induction machines have becom. the prime source of electromechanical energy conversion in modern society; from miniature drives to the large industrial motors well into the megawatt region. Of more recent times synchronous machine.! also be ing used for variable speed drives, previously reserved for DC machines. This has been made possible by modern electronic technology, which in conjunction with the AC machine provides a drive having similar characteristics to these of the DC systems, at very competitive prices. This is particulary true in the case of squirrel cage motors which also offer higher reliability and lower maintenance. Dwing to the higher reliability and lower maintenance requirements, squirrel cage motors form the vast majority of induction machines manufactured. This, coupled to the ever increasing lemand for more efficient, less noisy and less expensive (more kw output per kg mass) machines, has created the necessity to look for improvements in places that heretofore have received little attention. The higher, and still growing outputs, obtained from smaller frames has created the situation where the main factors limiting any further increase in the ratio output/mass are mechanical in nature (shaft diameter, bearings, etc), and not electrically related insulation, current density, etc.). Vibration, which has a direct detrimental effect on material fatigue, has became the subject of intensive study by many researchers. The same can be said about the related noise emission from electrical machines which is coming more and

21 PAGE 1-3 more under the whip of industrial regulations. Vibration becomes a problem of acute dimension in the case of two pole machines. It is becoming common practice for customers to demand machines with levels of vibration far more stringent that those quoted in the relevant international specifications. All these factors have now made it important to analyse impedance unbalance effects in squirrel cage rotors. The first authors to investigate this problem only considered faults that are symmetrically distributed around the rotor4, \ As a result of this simolification, the mathematical models developed were incomolete in that they do not take account of many phenomena which are likely to occur in reality. The more recent work by Williamson and Smith6 proposes what is probably the most versatile model published todate. It allows for the current distribution in the rotor-bars to be solved for any kind of cage fault, by means of an impedance matrix in which each of the rotor bars is represented as well as each portion of the endring between the bars. The assumption that is common in all the studies so far undertaken on squirrel cage impedance unbalance effects, as described in the literature surveyed, is that there are negligible inter-bar currents present. This means that the cages have been assumed to be Insulated. Obviously this assumption greatly reduces the complex i y of the proolem, but the question arises as to whether this assumption is still valid in the case of modern squirrel cage machines where


22 PAGE 1-4 there is no insulation. The squirrel cages of these machines may be roughly divided into two categories. Firstly the die-cast aluminium rotors used in the smaller machines, where in some cases partial insulation is achieved vie oxidation of the aluminium. This orocess has its own associated problems m that the oxidation is not uniform and this gives large variations in the magnitude of the insulation achieved for different points in the same rotor. Secondly, in the large machines the rotor-bars are tightly fitted into the slots without any insulation in between the bars and the iron, and, as is Shown further on, the resulting inter-bar impedance is of similar orier to that of the normal rotor-bar impedance. This research is concerned with these machines where the rotor-bars are tightly fitted in the core. It is shown further on, both analytically and expor.mentally, that this low ratio of inter-bar to rotor-bar impedance is the cause of large inter-bar currents flowing in non-insulated cages having broken bars and/or endrings. The experimental verification of the existence of these inter-bar currents was achieved by actually measuring the currents flowing in the rotor of a large industrial motor in which a fault was introduced into the cage. Measurements were also taken on an experimental inverted induction motor? and also the damage found in a large motor that had failed due to broken bars was examined. As is shown, the results of these measurements and observations confirms the presence of large inter-bar currents, and also proves the validity of the mathematical model proposed.


23 PAGE 1-5 Two different approaches could be taken to establish the mathematical model mentioned above that is used to determine the magnitude and distribution of the currents flowing in a faulty cage. The first is to modify that proposed by Williamson and Smith" to take account of the fact that the cage is not insulated. This will lead to a very general and elaborate model. The second approach is to concentrate on the currents in the region of the fault. In this oroject the second approach was followed because, as is shown further on, in the large induction machines the current distribution in the cage away from the fault is no different, for all practical purposes, than that found in a healthy cage. It is in fact only the currents in the few bars adjacent to the fault that are affected. There are other factors beside cage faults that can give rise to secondary impedance unbalance, namely: non-homogeneous lamination material, poor inter-laminar insulation, shaft keyways, number of 'spider ' ribs, loose core,etc. The effects oroduced by these peculiarities are accentuated by the high flux densities existing in the modern induction motors, in oarticular two pole machines. Obviously it is not easy to implement these anomalies experimentaly, but since the effects they produce are similar to those p. Viced by a faulty cage, only this type of fault was investigated. It is shown in this project that the presence of large inter-bar currents, which flow tangentially, give rise to several phenomena which can be observed but cannot be


 having a broken bar, that there was no noticable reduction in the starting torque, but the pull-out torque was")
24 PAGE 1-6 These currents give rise to axial imfs in the machine which produce abnormally large axial vibrations, which are load dependent. This has been demonstrated bv a comorehensive set of vibration measurements taken on a number of large induction motors having faulty cages. Also these inter-bar currents indirectly affect the starting and pull-out torques of the motor. This is so because as a result of the presence of the inter-bar currer' rent must flow into the broken bar. Consequently, the r, uuction in starting torque is not as large as would normally be expected. It was found by measurements taken on a 476 kw motor (motor A in this work) having a broken bar, that there was no noticable reduction in the starting torque, but the pull-out torque was substantially reduced. This is due to tr change in the The increasing volume of work done on the behaviour of squirrel cage induction motors with unbalance in the secondary imoedance h>s been accompanied by an increasing amount of research into develooing techniques for detecting rotor faults. The emphasis has been on the detection of faults that are developing, thereby avoiding the excessive damage t-hat usually occurs when the motor finally fails. The usual techniques used for monitoring whether such aults are present are: (i) to monitor speed 1luctuations and torque or current pulsations'' % (ii) to monitor Q 1"I electromagnetic no is- emission ', and (iii), to monitor the axial flux ' '. A new technique was develooed.
 to be identified, thereby allowing the source of the")

25 PAGE 1-7 during the course of this investigation, which entails analysing the spectrum of the primary current, to assess whether there is a cage fault. A simple expression is developed which allows the additional prima y harmonics, which appear when the fault occurs (primary <r secondary) to be identified, thereby allowing the source of the unbalance to be pinpointed as being either in the primary or the secondary. The main feature of this technique is that it is independent of any effects that may be introduced by the driven load. Also it is simple to carry out in an industrial environment. It is interesting to note that other researchers in England '' proposed the same technique just two mor. 1..S atter" this was tstal.si I is viable in this sfcudv. Their research also showed that this method of detection has practiv-a^ aop;i ca t ion, but they did not go as far as to actually identify the origin oi the respective harmonic components (see Table 6.1 and equations 6.5 and 6.6, page 6.6)


26 CHAPTER 2 ROTOR INTER-BAR IMPEDANCE AND FLUX DISTRIBUTION I_N THE SHAFT Two basic phenomena associated vith the presence of broken bars and/or endrings in the souirrel cage rotor are the production of axial flexes and inter-bar currents, ie currents flowing between bars through the core laminations. In induction machines, in particular two pole motors, impedance unbalance may arise from the presence of keyways in the shaft or other mechanical asymmetries. This is due to the relatively high flux densities used in modern machines. Hence a pre-reguisit for the understanding of these phenomena 15 t0 analyse the inter-bar impedances and the flux distribution in the shaft and core. 2*1 - Inter-bar impedance All authors of previous work related to the performance of induction machines having broken rotor-bars and/or endrings disregarded the presence of inter-bar currents in unskewed rotors. Results of measurements done in this project show that this assumption does not hold for motors with non-insulated rotor-bars. This is also relevant to machines having die-cast aluminium squirrel cages, because imperfections commonly occur during the casting process. These result in an odd distribution in the bar-iron contact

27 PAGE 2-2 resistance around the machine. In particular these machines were studied by Vas4. Weichsel3 developed the theory of a squirrel cage induction motor having symmetrically split endrings. He uses this theory to calculate the new resultant torque developed. Again in this theory the distribution of the rotor-bar and endring currents is evaluated without taking into account any possible inter-bar currents that may flow in the core and thereby bypass the split in the ring. Figure Cross-sectional view of a squirrel cage laminated core with two bars shown as M and N. The equivalent circuit for current flow between M and N is also shown. r0,/2 * bar-core resistance per bar oer unit of length R (, ) resistance of core between M and N p< metre of effective core length


28 PAGE 2-3 One simple representation of a squirrel cage rotor core is that of an annular shape or ring of magnetic iron with the conductors distributed around the periphery (see Figure 2.1). An accurate calculation of the inter-bar impedance will have to take into account the bar and slot dimensions and the influence of all other rotor elements, such as keyways, ribs, etc.. This may be accomplished by using one of the several finite element analysis techniques available. However, in this work a genera analytical method is developed which yields a first approximation for the actual inter-bar impedance. The contact resistance is of non-linear nature15 and depends on the voltage developed across the area of contact (or equally, on the inter-bar current flowing through the area of contact). As is shown by Christofides15, relatively large inter-bar currents will have to flow before the resistance becomes non-linear. Usually such large inter-bar currents will only flow under run-up conditions in unskewed rotors having a faulty cage. Therefore the contact resistance may be assumed to be linear when the motor is running at rated speed. The inter-bar imoedance is found to be largely resistive for frequencies within the normal ooerating range of the motor, ie from no load to full load. This was demonstrated by Chr istof ides1 and also in this project, were similar tests were performed on rotors of relatively large machines (several hundreds of kilowatts).

 and '-he core resistance R (t.")
29 PAGE plane w olane t plane H" A" M"!Cm N E y w =* Ln z and w = / I : <k<l J i Figure Conformal mapping transformations used to determine the electric field configuration and hence current density distribution in the core between rotor-bars M and N. As shown in Figure 2.1 the resistance between any two rotor-bars may be divided into the two resistances r /2 (ie V between one bar and the core) and '-he core resistance R (t.) between the two bars. (In this analysis R (*0 ) has been taken as purely resistive. In certain snecial cases -eg when higher than normal frequencies are involved- R (>0 ) will have

 present in the core.")
30 < PAGE 2-5 a reactive component as well. This is discussed further on in this chaoter as well as in Appendix C). N 2 oo.e case multioole case Figure Schematic diagrams of current density distributions within the rotor core for 2 pole and multioole machines. An exact analytical solution for determining the core resistance R (»0 ) may be found by using double conformal mapping transformations (Figure 2.2). This allows the electric field configuration within the laminations to be found and hence also the current density distribution (J = n E) present in the core. This method entails using "elliptic" functions whose solutions are given in tabulated
")

 is given by (per metre)..[2.")
31 PAGE 2-6 form. This method proved to be cumbersome and thus a more practical approach vas devised by dividing the analysis into two cases as follows: (i) For two pole machines: The rotor cross-sectional area is taken as that of a full circle because the area occcupied by the shaft is small when compared with that of the full area (ie the diameter of the shaft is significantly smaller than the overall outside diameter of the lamination -see Figure 2.3-). As shown in Appendix B, page B.4, based on this assumotion the core resistance R(*0 ) is given by (per metre)..[2.1] where r< radius of equivalent conductor representing the rotor-bar a «1/ />«conductivity of the lamination material Hence the total inter-bar resistance is given by RM N (ro) - 2(r0/2) + R(»0 ) e rg R(n0 ) [2.2 ] where R(-»0 ) is as given in equation [2.1]

 increases with the number of poles. Calculations done for several rotors having different number of poles, show that both methods yield similar results.")
32 PAGE 2-7 (ii) For machines with four or more poles: For these machines the ratio a/b (rotor core outer radius/inner radius) tends to unity as the number of increases. Associated with this is the fact that tne current density distribution then follows more closely the circumferential paths as shown in Figure 2.3. Because of this, the total core resistance Ri*0 ) between the bars M and N can be given oy the parallel combination of tne resistances the two paths between M and N (see Figure 2.3)..he accuracy of this approximation for R{«*0 ) increases with the number of poles. Calculations done for several rotors having different number of poles, show that both methods yield similar results. From inspection of Figure 2.4 the following expression may be written: n... a» b. o. -f ~ ' " *0 *0 (per metre).. f2.3] ihere fore the total inter-bar resistance is given by fr0 1 * r0 + R <V... (2.4) where R (>0 ) is as given by equation (2.3).
 All the parameters in the above expressions for Rm n ( V are known for any particular rotor with exception of r0, the bar-core contact resistance.")
33 PAGE ssment of the contact res istance (r g) All the parameters in the above expressions for Rm n ( V are known for any particular rotor with exception of r0, the bar-core contact resistance. This may be found by comparing the calculated value for R (»0 ) and the measured value of the total inter-bar resistance R.,.,. MN Figure Schematic diagram showing the annular shape of the rotor core for machines having four or more poles. In order to facilitate the evaluation of r H measurements of R ^ ( '0 ) were taken on a number of rotors. The resistance was measured at zero frequency on the rotors


34 PAGE 2-9 during manufacture and prior to the fitting of the endrings. It was found that even though the construction of the rotors differed considerably, the resistance value obtained differed very little from rotor to rotor. To illustrate this the results obtained on a two pole rotor and six pole rotor are given below. In both cases the rotor laminations were made from 2% Si steel giving a resistivity of 35 x IS-0 u m. The core stacking factor was taken as 0,95. ROTOR ;two cole motor ; gross core length (I) * 0,355 m effective core length (I')» 0,337 m P» 0,35 x 10 ^. m a «0,151 m ; a/b (outer radius/inner radius) * 2 radius of equivalent conductor (R) * 0,017 m number of rotor slots (52) * 46 angle between adjacent bars = 7,826 degrees
 in degrees u li u 12 u 12 7,826 50 50 52 47 45 49 0,0 15,652 46 58 55 55 50 50 52 0,2")
 and the calculated values of R fxq) for six different angles (using equation.'2.1]).")
35 PAGE 2-10 Table ROTOR A Measured and calculated values of f mn ) and R(x0 ). Angle Measured values of rmi. (0<31 Average Calculated be tween for six different pairs of IW V value of bars M,N bars chosen at random * «* ) in degrees u li u 12 u 12 7, ,0 15, ,2 23, ,3 31, ,3 39, ,4 180, ,8 car-shaft Table 2.1 shows the measured values of R ^ ' ^ ) and the calculated values of R fxq) for six different angles (using equation.'2.1]). It can be seen from this table that the core resistance is much less than the bar-core contact resistance and therefore it forms a very small portion of the total bar-bar resistance. The average values of obtained show some scatter, as expected, but the values of P (Xq ) are so small that they are in effect swamped by this scatter. Clearly then, to a good approximation, the bar-bar resistance RM N (Xq) k rg. Bearing in mind that the total
 0 * 49 x 0,337 * 16,5 w u m per metre of eff. core length 17 «u m...(2.")
![5 ] JTOR B (six pole motor) gross core length (/) * 0,720 m effective core length (/') «0,524 m f> - 0,35 x 10 6 um :2 «OD/2 - depth of bar - bridge «0, 239 m» 0,191 m; a/b = 1,45](/docs-images/71/65413009/images/36-2.jpg "number of rotor slots (S2 ) - 58 slots a n g n between adjacent bars» 6,207 degrees Note : The resistance value of R (<VQ ) for this machine was calculated using equation (2.")
36 PAGE 2-11 bat-bar resistance is the parallel summation of the bar-bar resistance per elemental core length, gives the bar-bar resistance per unit length as: per metre of RM N (av i' eff. core length or»,826 degrees (adjacent bars) 0 * 49 x 0,337 * 16,5 w u m per metre of eff. core length 17 «u m...(2.5 ] JTOR B (six pole motor) gross core length (/) * 0,720 m effective core length (/') «0,524 m f> - 0,35 x 10 6 um :2 «OD/2 - depth of bar - bridge «0, 239 m» 0,191 m; a/b = 1,45 number of rotor slots (S2 ) - 58 slots a n g n between adjacent bars» 6,207 degrees Note : The resistance value of R (<VQ ) for this machine was calculated using equation (2.3] since it was a six motor, rn this case the rotor was constructed
![with a 'spider' giving the roto: core thickness as 0,277-0,19] = 0,086 m. When the angle o<. is large (bars far apart) the current path in the iron will be in the section below the slots.](/docs-images/71/65413009/images/37-1.jpg "Therefore when performing calculations the effective outside radius has been taken as the radius at the bottom of the slots.")

37 with a 'spider' giving the roto: core thickness as 0,277-0,19] = 0,086 m. When the angle o<. is large (bars far apart) the current path in the iron will be in the section below the slots. Therefore when performing calculations the effective outside radius has been taken as the radius at the bottom of the slots. Clearly this assumption breaks down when two adjacent bars are considered because here the current will mainly flow from bar side to bf side. The value for the core resistance in this instance w i V be less than that when ^ is 1,-rge and since th ore resistance is almost negligible, the error introduced by the above assumption is very small indeed. Table 2.2 shows measured values of and the calculated values of 8 ( ^ 1 (us.ng equation (2.3]). As before for *6,207 degrees, r0 * 18 ul'w per met-e of [2.6] eff. core length
 Average Calculated be tween for six different pairs of value of bars M,N bars chosen at random in degrees uu uq m i 6,207 30 30 28 35 40 41 34 0,0 12,414 35 35 34 35 36 35 35 3,6 18,621 41 35 34 32")

38 PAGE 2-13 Table 2.2 -ROTOR B Measured and calculated values of and R (<Xq ). Angle Measured values of R. ) Average Calculated be tween for six different pairs of value of bars M,N bars chosen at random in degrees uu uq m i 6, ,0 12, ,6 18, ,0 180, ,0 bar-shaft Obviously will differ from rotor to rotor even for identical design? due to the following factors; fit between bars and core, change in the silicon content of the laminations, staggering of the laminations, etc.. Nevertheless, the previous examples show that even with the two rotors which have different cons ructions, the value of the inter-bar resistance was consistent. Therefore this value of can be taken as reoresentative of the inter-bar resistance, at zero frequency, for large industrial squirrel cage induction motors. The resistance was measured at normal ambient temperatures. (^20 C) A reduction in th< value of i., and u


39 PAGE 2-14 therefore (l^ 0 'i may be expected with an increase of temperature due to the higher coeficient of thermal expansion of the copper (or aluminium) oars than the core. This resu1ts in an increase in the contact pressure. - the inter-har imp< Results of measurements published by Christofides15 show that the value of the inter-bar impedance is almost independent of frequency for frequencies up to several hundreds of hertz. This implies that the reactive component of the inter-bar imoedance is small when compared with the resistive component. This is true for machines with aluminium cages, such as those studied by Christofides, because of the oxidation build up on the bar surfaces giving rise to higher bar/core contact resistances. In the case of the large machines, as in this work, the reactive component of the inter-bar impedance may be, in certain cases, of similar magnitude to that of the resistive component and thus may not be neglected. in view of the fact that the reactive component of the inter-bar impedance may not always be neglected, it became necessary to develop an expression describing this parameter, this was done by considering two rotor-bars of width a and length b being parallel to each other and spaced h aoart. Clearly the two bars are surrounded by laminated ferromagnetic material of permeability n, This leads to the following expression for the inductance between the two

40 PAGE 2-15 bars: L S ; ^,,OTaw- ^, - 1( The detailed derivation of this expression is given in Appendix C together with the approximations necessary when round bars are considered, such as those of the experimental inverted motor. Also the experimental verification of this expression is given in Appendix C, page C.5. Generally the inter-bar inductance is a function of frequency due to the skinning effects of inter-bar currents in the iron laminations. For frequencies up to 50 Hz the penetration depth in the iron is approximately equal to 0,7 mm. Therefore for frequencies in this range and for laminations of thickness not more than 0,7 mm, the inductance will not vary with frequency. For higher frequencies and for thicker laminations, the value of the inductance will decrease due to the skin effect. The normal working range for the machines considered, and the usual lamination thicknesses used, lie within the fifty hertz and 0,7 mm bounds. Therefore, the exoression in equation [2.7] has been simplified by neglecting the frequency deoendence. The actual influence of the inter-bar reactance on the inter-bar impedance must be assessed for each case, especially when higher frequencies are considered (as was the case in the inverted experimental motor). However, it was found from the measurements taken on the large machines, that the magnitude of the inter-bar impedance did not differ


, introduce restrictions in the")
41 PAGE 2-16 significantly from the inter-bar resistance measured at zero frequency. Therefore, for most practical cases, for frequencies up to fifty hertz the measured value of the inter-bar resistance can be taken to be that of the inter-bar impedance, Ahen designing two pole induction motors, designers show a tendency to use the shaft to increase the effective area at the back-of-the-core for the magnetic flux. This is as a result of the lack of space in the back-of-the-core in rotors of c"o po-l motors, due to the high curvacure present in these 2 7 machines. This would not reoresent a problem on its own, but the presence of keyways in the shaft (for attaching the core to the snaft), introduce restrictions in the path of the flux. These restrictions, which are distributed around the machine, may give rise to a net circumferential flux, see Figure?.5, which is the source of vibrations, torque fluctuations, shaft voltages, etc..


42 I PAGE 2-17 reference plane B A. NET FLUX UP B. NET FLUX ZERO keyway restriction NET FLUX DOWN D. NET FLUX ZERO Figure Flux patterns for single restriction i rotating core and shaft, drawn for successive Positions of rotation of a two-pole D.c. machine. (After Stringer)
 If the numerator of the ratio n/p (p * pairs of poles) reduced to its lowest")
 If the numerator is odd, net circumferential flux is generated having a frequency equal to that of the fundamental flux multiplied by this reduced numerator and the slip of the motor.")
43 PAGE 2-18 Stringer1^ showed schematically how keyways and "spiders" produce a net circumferential flux. It is shown that in the case of 'n 1 multiple restrictions equally spaced around the shaft/core the following applies: (i) If the numerator of the ratio n/p (p * pairs of poles) reduced to its lowest term is even, then no net circumferential flux is generated. (i i) If the numerator is odd, net circumferential flux is generated having a frequency equal to that of the fundamental flux multiplied by this reduced numerator and the slip of the motor. (iii) When n/p * 1 the generated circumferential flux is a maximum (other things being equal) and its frequency is that of the fundamental flux times the slip of the motor. In the case of the large industrial two oole motors tested having only one keyway each in the shaft the equation gives: n/p * 1/1 i 1 This corresponds to the worst case for the generation of net circumferential flux with a frequency equal to the fundamental times the slip of the motor. Another effect of the presence of net circumferential

44 PAGE 2-19 flux is the uneven saturation of the iron. This gives rise to an unbalance in the secondary impedance, due to the leakage reactances being different around the machine. The degree of this unbalance is negligible when compared with the unbalance produced by a faulty cage, as it is shown in Chapter 5. Nevertheless, this unbalance is the source of undesirable phenomena, in particular in two pole machines running with relatively high slip and high flux densities.


45 CHAPTER 3 MEASUREMENTS PERFORMED ON THE INDUSTRIAL MACHINES trie cests and measurements carried oul on the industrial motors, as well as an account of the aims and objectives of each of the tests is given in this chapter. The actual results obtained from the tests are given in Appendix D, and these are fully discussed in the following chapters. The tests carried out oh the industrial motors were adapted to the particular constructional characteristics of eacn motor. Also the tests were tailored to fit in with the normal manufacturing schedule. The essence of the present research (to study the behaviour of induction machines with unbalance in the rotor impedance), required that the test machines be almost perfectly balanced electromagnetically and mechanically, besides the asymmetries intentionally introduced for the purpose of this study. The motors chosen for the tests had symmetrical stator windings the particulars of which are Hiven in Appendix E. These consist of pre-moulded "diamond" type coils wound in an integral slot/pole/phase (s/p/p, arrangement. The winding is double layer with a narrow phase belt distribution. The stator bore was carefully machined to ensure that the airgap was concentric to the geometric centre the laminations. This ensured that the tooth-lip dimension was kept constant around the stator. The rotor was


46 PAGE 3-2 also carefully machined and balanced and special care was taken during all stages of manufacture and assembly to ensure symmetry. The motors were supplied from a synchronous generator via a step-down transformer loaded only with the motor under test. In this way it was possible to ensure that the supply to the test motors was balanced and was free from mains borne disturbances Test.s on industrial motor A One bar of the cage of this motor «.is cut short from one of the endrings to introduce a oken' bar and with it secondary impedance unbalance, see gures 3.2 and E.5 pages 3.5 and E.5 respectively. Subsequently the endring was removed, all the bars were machined to the normal length and the endring replaced. This then allowed measurements to be taken on a healthy cage. The bar that was actually cut was chosen to be that bar which lined up with the keyway in the shaft extension thereby allowing its position to be readily identified " tor rotor-bar currents This test was carried out to measure the actual currents flof ing in the healthy' rotor-bars at various peripheral positions from the broken' bar. Also the current flowing into the broken' bar from the 'healthy' side, ie the side


47 PAGE 3-3 brazed to one of the endrings, was measured. it i3 very difficult to measure the squirrel cage currents when the rotor is rotating. Therefore direct measurement of 'the rotor-bar currents in the industrial motor was done only with the rotor at stand-still. However the actual cage currents were measured with the motor operating in the inverted-geometry experimental motor as explained in Chapter stator winding stator core rotor-bar rotor core zy toroidal coll figure Location of the toroidal coils on the rotor-bars for the measurement of the rotor-bar currents at stand-still. The secondary bar currents were measured by using

48 PAGE 3-4 «jgowsxy transducer coils. Toroidal coils navi approximately 300 uniformly wound turns were constructed or tiexible pi/c sleeving and then secured around the bar with the ends butting together. Care was taken to thread the return w re back down the ce-tre of the PVC tube because only one layer was wound. The coil outputs were led to an negrator giving an accurate reproduction of the current given by various authors 19'20-:1-22 and has been used very successfully20. Landy20 and Sllison21 show by different techniques that the toroidal coils are largely.sensitive to currents other than those flowing in the conductor around which the toroid is wrapped. Also the coils» insensitive to currents flowing in conductors that are n : para lei to the conductor of concern. Ellison21 found a maximum interference of less than 0,03» at an angle of 120 decree. his interference can be expected to be even less than the 0,03 3 when the return wire is brought back through t centre of the tube as was done in the course of the present measurements. from the above it can be safely assumed that the toroidal coils were free from interference *U 'enl :lowing in conductors other than their own 'actor and also from currents flowing in the adjacent short circuit endring. :l:il of the flve manufactured toroidal coils was b 1 1 t ally wrapping it around a similar bar to 056 USed ln the motoc- Subsequently known sinusoidal ienis were passed through the bar and the output of the


49 PAGE 3-5 integrating circuit was monitored. The details of the measuring systems are given in Appendix A together with the calibration constants obtained for all the coils used. Figures 3.1 and 3.2 show the typical constructic and positioning of the coils on the rotor and on the different bars. 'broken' bar 1 NDE o 1 «4 ----n J3.. sndrings Figure 3.2 IH.1U3trial motor A - The toroidal coils were fitted on five different bars, positioned as shown, next to the core on the NDE side of the motor. The unbrazed side of the 'broken' bar is on the DE side next to the endring. Th' 0UCput of the amplifier/integrator was fed into an oscilloscope, a spectrum analyser and a voltmeter. Both the oscilloscope and the spectrum analyser have the facility of M


50 PAGE 3-6 storing the traces so thrt photographic records of the actual current waves shapes and spectra could be taken. Typical examples of these records are shown in Appendices A and D, pages D.16 and D rt-. em^grature on the rotcr-bar resistance The measurements of the currents in the five rotor-bars having toroids were taken consecutively. Clearly there was a time lapse between measurements and consequently the bar temperatures must have been different for each of the measurements. As all these current magnitudes were to be compared it was important to establish how the temperature differences affected these magnitudes. The following analysis verifies that in fact this introduced a negligible error. curing the locked rotor test the Impedance seen by the supply is mainly inductive. The change in the resistance of the stator winding is m,hgible as the rise in temperature of the stator copper is well below that of the rotor-bars. To assess the -koected temperature rise of the rotor-bars the ',r ' 1 nre!! tfo ploted which Show the adiabatic temoerature rise of the conductors when the rotor is looked, the equation describing the behaviour of these curves takes into account the skin effect in the bars and assumes that the whole section of the bar absorbs the heat generated, it does not take into account any heat dissipation to the surrounding environment and as such it gives a pessimistic


51 PAGE 3-7 result. Tne time tot each measurement was approximately 30 seconds and the current in each bar was measured six times, twice at 25 Amps Primary current, twice at 50 Amps and twice at 75 AmPSl Takin9 int0 acc unt the time elapsed between each measurement and in particular between measurements taken on different bars, the estimated maximum temperature rise was 50 degrees Celsius. rise The increase in resistance for a 10 degrees temperature of copper is approximately 12 % for an ambient temperature of 20 degrees Celsius. Figure 3.4 shows the elementary equivalent circuit for stand-still conditions for industrial motor A. The values used for the resistances and reactances were obtained from computer calculations for this machine and were supplied by the manufacturer. From Figure l" " 3een a 1 increase in the secondary tee,stance causes the current to change by approximately 0,4 *' The Values ( the reactances used in the circuit of Fl9Ure 3,4 336 f r 3at«o t e d conditions at rated voltage. The tests were performed at reduced voltage where saturation 18 ne9u9 l 6 1 e - Theref3re the a = ^ a l values of the reactances - 3 t have been larger than those used and as such tne change in tne current was smaller than the 0,4 * calculated above.


52 ' 0 J S 1 3 D S 3 3 % D 3 a \ m


53 PAGE 3-9 HI XI R2 X2 j0,lia pu Uln = 1 pu I(i 70"C - I(» 201) Change In I x 100 * 0,36 % 1(4 2 0 * 0 Figure Simplified equivalent circuit for standstill conditions for industrial motor A. The change in ill for a 50 C rise in temperature is approximately 0,4 % Locked-rotor torque measurement The objective of the locked-rotor torque measurement was to assess the influence of the rotor imoedance unbalance on the magnitude of the starting torque. These results were also used to calibrate the measured torque-speed characteristic of the machine. Thete are hwo methods of determining the starting torque and both were used and the results compared.
 The indirect method: The starting torque is calculated from the input oower measured during the test after the stator cooper and other losses have been subtracted.")
54 PAGE 3-10 (i - T h e d^irect method: The starting torque is measured by means of a torque-arm and a scale. (ii) The indirect method: The starting torque is calculated from the input oower measured during the test after the stator cooper and other losses have been subtracted. In the indirect method the assumption is made that the total power transferred to the rotor is the input power minus the stator losses and this is responsible for the production the torque. This method does not take into account the stray losses. Nevertheless an emoirical factor for stray losses is introduced (see Aopenoix D, page D.19). This factor, which is based on experience from measurements taken on a large number of motors is found to improve the predictions m d gives good correlation with the values obtained from the direct method. When taking measurements using the d.rect method, in the case of motors having anti-fr let ion bearings (as is the case with industrial motor A) t.,e static friction force may be safely disregarded. This ^ 10 ase with motors having sleeve bearings (as with motor 8). In this case the stiction may become appreciable when compared with the starting torque, a fact which may introduce significant differences between the calculated torque value and the measured value. This is particularly acute when the locked rotor test is done at 1 very reduced voltage, as was done with industrial motor B.

55 PAGE 3-11 The use of reduced vol.age for the measurement of the starting torque was necessary because of practical limitations, eg over-heating, torque-arm and scale limitations, etc.. The values measured were then related to full voltage by the square of the ratio Vrated/Vtest This does not take account of saturation effects, but as all torque measurements, including the torque-speed characteristic, were done at reduced voltage, the conditions of saturation were similar to all of them. These tests were performed twice, once with the 'broken' bar and then again when the cage had all the bars perfectly brazed to the endrings. The actual results obtained from the measurements are gxven in Appe.. lix D As with the locked rotor tests, all vibration tests wen also done twice, once with the 'broken' bar and once with th< normal cage. The equipment used foi the vibratior measurements consisted of a velocity magnetic contact probe (Pick-up), a vibration meter, an x-y recorder, and a stroboscope. Basically the sources of vibration in electrical rotating machines can be subdivided into two categories, namely, those produced mechanically and those produced electrically. In most cases the sources of vibration are interrelated and it is difficult to determine the origin as being either electrical or mechanical. However, vibrations
.")

56 PAGE 3-12 due to impedance unbalance can certainly be classified as electrical in origin. A typical example of vibration being both electrical and mechanical in origin is that produced due to Unbalanced Magnetic Pull (UMP). This is so because when no excitation is applied even if the airgap is eccentric, no vibration occurs. Bearing misalignment or mechanical unbalance on the rotor will give rise to vibratioi. when the rotor rotates even if the machine is not excited and as such these vibrations are mechanical in origin. Clearly the magnitudes of the vibrations due to the various sources are dependent on certain parameters, such as voltage, current, speed, temperature, etc.. Therefore to identify the different origins, where possible, measurements were taken with several of the parameters changed, eg different voltages, different loads, etc.; see results in Appendix D. F igure I.1: shows the locations on the industrial machines where the vibrations were measu red. As shown, measurements were taken in the vertical (V), horizontal (H) and axial (A) directions on both the NDE and DE sides.


57 V PAGE 3-13 NDE V - Vertical K - Horizontal A - Axial F.gure ros it ion of vibration measurements used for both industrial motors. Notej, Industrial motor A had a locating "ball bearing on the NDE side and a "roller" bearing on the DE side. industrial notor B had non-locating "sleeve" bearings or both sides. load vibration measurements (motor uncoupled) The objectives of the vibrations test were: (i) to identify those vibrations of mechanical origin and (ii) to identify those vibrations as a result of


58 PAGE 3-14 UMP. Vibrations of mechanical origin are largely due to the Physical unbalance of the rotor, bearing misalignment and induced vibration from the outside enviroment. During the no-load test the motor was uncoupled from the load and therefore induced vibrations through the shaft were not present. Induced vibrations through the foundations were negligible and thus only internal ly produced vibrations were present. The internal vibrations of mechanical origin are, b/ and lar9e ' only dependent on the running speed of the motor. The UMP dependent vibrations are basically sensitive to changes in voltage. Generally when the voltage varies the speed of the induction motor does not change significantly 'especially when the motor is running uncoupled). Therefore vibrations that are of mechanical origin will not be dependent on voltage. However, large changes in UMP induced Vibrations will result by changing the voltage. Therefore when the motor is run uncoupled and the voltage is varied, it is possible to separate tne vibrations due to UMP from those of mechanical origin. As U is shown further on, vibrations produced by having a broken bar or endring in the cage are only dependent on the actual rotor-bar currents. Also it is shown that these Vibrations increase dramatically with increased bar currents. However, when the machine is run uncoupled, the bar currents very small and remain so even if the voltage is varied (except when the voltage is very low which was not tie case


59 PAG during toe course of these measurements). Hence, when the motor was run under these conditions, the vibrations produced by the broken, bar were negligible, so that no-load vibration measurements were only done once, te when -he machine was tested with the 'broken' bar. it is worthy to note that no-load tests were carried out on identical motors that obviously had 'healthy- squirrel cages. The results of these tests confirmed that the 'broken' bar has practically no effect on the vibration pattern of the machine at no-load As previously discussed, when a rotor-oar is broken and the roror current is large (machine on load,, the vibrations produced likewise are large. Therefore to assess this Phenomenon the motor was coupled to a load which could be induced vibrations were essentially keot constant because the voltage applied to the motor was kept constant. Also, as the motor speed changed very little with changes in load (motor only partially loaded because the vibrations were already excessive, see vibration recordings. Aopend 0 ) the charges in mechanically induced vibrations were very small. Measurements were taken of the vibration levels present in the gearbox which was used to couple the motor to the load. It was found that these vibration levels were far lower than those measured on the motor (see figures 0.28 and D '29' Pa9SS D '59 and D 'M respectively) and therefore the


60 PAGE 3-16 driven machinery had very ttle effect on the vibrations measured on the motor under test. MAIN NETWORK // ' > DC GENERATOR MOTOR UNDER TEST figure Schematic layout of the test system used to do the load tesvk". The large arrows show the active p e e r to and from the motor under test. The small arrows show the active powe supplied by the main network which is only tl,at required to overcome the losses in the system. The driven equipment consisted on a DC generator coupled


61 PAGE 3-17 the motor under test via a gearbox. The load on the motor was changed by changing the field of the DC generator. The test system used forms a closed loop, see Figure 3.6, where the motor under test drives a DC generator via the gearbox. The output of the DC generator is feed back to the DC busbar so the power drawn from the main supply is only that required to overcome the loeses. 3.1., - of the torque-speed characteristics The circuit used for the measurement of the torque-speed cnaracter istics was developed and successfully used by Landy 1 lt was adaoted from the system originally developed by Metropolitan Vickers Electr. Corp.23. The method is based on the fact that if an electrical motor &.celerates slowly, ie the acceleration time is much smaller than the electrical time constants of the motor, then for all practical purposes the currents and fluxes are always in the sinusoidal steady state and the torque produced at every speed is the steady state torque. To achieve long acceleration times the tests were done at reduced voltage and the To.or was ill owed to decelerate and accelerate against its own rotor inertia. The measuring circuit used is shown m Figure 3.7 and the frequency response of the circuit in


62 0,066pF 33k 560 k 10k 10k 10k tocho -J- 6 nf 10k 10k speed xgur^ 3.'T uircuit diagram of unit developed for measurement 3* soead and. acceleration of large practical motor. (After Lardy1 ) , ,0 10,0 Figure 3,8 FREQUENCY Frequency response of acceleration system taken with the input signal applied to the TACH0 input terminals. he bandlimited differentiator properties are clearly shown, (After Lardy' ) Hz

.")
63 PAGE 3-19 The system basically comprises a tachometer which is coupled to the shaft of the motor under test. The output is ftitered for high frequency noise and differentiated. The low-pass filter output gives a direct measure of the speed and the output from the differentiator gives the acceleration. Both speed and acceleration are recorded on an Ultra Violet (U.V., recorder from which the torgue-speed curve is reproduced. An assessment of the whole circuit is given by bandy-'. Using this apparatus torgue-speed Characteristics were taken both with one 'broken' bar and with all the bars normally brazed. (the actual measured traces obtained are given in Appendix D, page D.63) Friction and windage effects on the torgue-speed measurements Tee mathematical expression describing the motion of the rotor with the machine running light (uncoupled) is given by: and where _ d <i> m e t t = Tm - Tfr - Tw = I for 0 < s < 1 (motoring region)...[3.1] _ d < > Tnett " Tm + Tfr + Tw» I ^ at..[3.2] for 1 < * < 2 (braking region) Tnett = nett accelerating torque Tm Tw electromagnetic torque (airgap torque)» windage torque
 1 rotor rotational inertia s slip of")


64 Tfr f r ic t l0 " torque (approximately constant all s 4 i ) 1 rotor rotational inertia s slip of the motor to where Tnett * Tm + T fw, j for 0 < s c 2 [3.3J Tfw «Tfr + Tw and Sl,n f Tf ^ positive for 1 < s < 2 negative for 0 < s < j f r i o t l o n ^ Z u V I" t0rque " and the The S p e M signal and ZZLTZT:

.k 2 The torque obtained from the measurements (Tnett) includes the friction and windage effects.")
65 - «' PAGE 3-21 Tnett < dt Figure r/pical accelecat ion-speed characteristic obtained trom the measurements recorded o the UV recorder Aa explained above the test is done at reduced voltage. The electromagnetic torque varies as the square of the applied voltage, and therefc-e to obtain the torque produced at full (rated) voltage the following scaling mun- be done: Tm irated voltage test voltage :... [3.4] * Tm(test voltage).k 2 The torque obtained from the measurements (Tnett) includes the friction and windage effects. Therefore when the measured curves are scaled to full voltage values, the friction and windage torques (which are independent of voltage) are also scaled. To avoid this, the friction and


66 PAGE 3-22 windage torques must be added or subtracted (depending on the value of s) before any scaling is done. in this way a true picture of the developed torque at full voltage is obtained. In two or four pole, CACA type machines having externally mounted fans, the friction and windage torques may become a significant part of the measured torque at high speeds and reduced voltage. As industrial motor A falls into this category, these effects were carefully assessed and accounted for as shown in Appendix D. ^'2 * Tests on industrial motor B The rotor asymmetry introduced into the squirrel cage of industrial motor B was different to that introduced into the rotor of industrial motor A. In rotor B a bar was cut at both ends adjacent to the endrings, while in rotor A a bar was cut only at one end. This was done to allow the effects of any inter-bar currents that may be present to be assessed. (These could only occur in motor A). Therefore differences between the results of the measurements obtained on the two motors must oe expected. All the on-load vibration meaour me, taken on motor A were repeated on motor B with motor B coupled to the gearbox in the same position as was motor A. These measurements show ud the differences in the vibration pattern produced when a rotor-bar is completely isolated from both endrings or when it can carry current from one endring, as it is shown in Chapter 5.


67 CHAPTER 4 t h e p r o d u c t i o n o f i n t e r -b a r c u r r e n t s GOr9e Was Che first t0 Udy the operation of a three-phase induction motor having an asymmetrical roto Circuit. Since then, many investigators have studied th, effects of rotor asymmetries in slip-ring induction motors however few papers deal with rotor asymmetries in three-phasr squirrel case induction motors. Analysis of machines having broken endrings was done by Hishkin36 and for machines " having symmetrically split endrings by Weichsel3. Different aproaches for the calculation of the current distribution in a squirrel cage having broken bars are presented by Shuisky3, Hiller38, D'Alessandro and Pagono, vas4'3\ a n d Williamson and Smith6, mall these works the authors assumed that there were no mter-bar currents Present in the rotor. However, as it is shown in Chapt9r' assumption does not hold for most modern squirrel cage industrial machines in which the bar-to-bar impedances are relatively small, it is interesting to note in the literature surveyed, it has been shown that in ter-oar currents exist in healthy squirrel cages (even in unskewed cages,3-36. However, no theory is put forward c n b i n g the consequence, of having a faulty cage where, as is Shown here, the inter-bar currents may become large. a-vmmetrical rotor winding may be represented by a three symmetrical component impedances, in the case


68 PAGE 4-2 of squit re 1 cage motors, the assumption that currents can flow only in the rotor-bars implies that no zero-phase sequence currents can exist. These zero-phase sequence currents are in phase in all the bars and as such will return via the laminations and the shaft. These currents do not produce any average torque but certainly produce additional losses. In this work no expression for the zero-phase sequence currents is oresented because this investigation concentrated on the asymmetry present only in the region of the nroken1 bar. The analysis including zero-phase sequence currents follows a completely different aocoach which is outside the objectives of this work. However, it is felt that Williamson and Smiths model can form a good basis for such an analysis and in fact further work in this direction has already been initiated. 4,1 " Calculation of the current flowing into the 'broken 1 bar This analysis is restricted to a particular type of fault and to the effects that occur in the region of this fault. This fault, namely that of a bar broken next to one of the endrings, is the most common fault that occurs in squirrel cages. Although the mathematical expressions derived are not strictly applicable to other types of cage faults, it is felt that the general conclusions reached are also representative of most other types of faults. Figure 4.1 shows the simple model used for the
 V * ) b broken 1 bar end ring end ring 40 - ) - I, (xj Figure 4.")
 Tho inter-bar laminar currents flow only between")
69 PAGE 4-3 calculation of the current distribution in the bars and the iron in the region near the 'broken1 bar. - L (x) V * ) b broken 1 bar end ring end ring 40 - ) - I, (xj Figure Current flowing in the region of the 'broken 1 bar. In this analysis the following assumptions have been made: (a) Tho inter-bar laminar currents flow only between the broken bar and the two adjacent bars. (Actually the currents flow between the 'broken' bar A»
 'broken' bar I, (X) I (x.i end ring (cj -* ) end r nq < lie ) r \" Ih (x) Figure 4.")
 The inter-bar laminar currents flow only between the")
70 PAGE 4-3 calculation of the current distrioution in the bars and the iron in the region near the 'broken' bar. I. (x) 'broken' bar I, (X) I (x.i end ring (cj -* ) end r nq < lie ) r " Ih (x) Figure Current flowing in the region of the broken 1 bar. In this analysis the following assumotions have been made: (a) The inter-bar laminar currents flow only between the broken bar and the two adjacent bars. (Actually the currents flow between the 'broken' bar

. (b) The voltages induced in the three bars are equal in magnitude anc.")
71 PAGE 4-4 and several adjacent bars, the number of which is a function of the relationship between the endrinq impedance (Zrinq) and the total secondary impedance6. Nevertheless, as is shown, the assumotion still holds because in large machines the endrinq impedance is a small portion of the total secondary imoedance. Therefore the total current of all '-he bars, which tarry current compensating for that of the broken- bar, divided by this number of bars (including the 'broken- bar) gives an average a.je ter, close to in, ie to the average bar current that would flow in a healthy cage under the same slip and voltage conditions). (b) The voltages induced in the three bars are equal in magnitude anc. are in phase with one other. (This is valid when the number of rotor slots oer pole is..j1 1 FP1 y high, as is the case in most two pole X mouoca. if the slot angle is large enough to be included the effect will he that the magnitude of the current flowing from the 'broken' bar to either of the adjacent bars will fluctuate with the slip; 19 at: sorne time more current will flow from the broken' bar to, say, adjacent bar A and less will flow to adjacent bar B while at a short time later the roles reverse). * (c) The inter-bar impedance is mostly resistive at

.")
72 tno frequencies dealt with. (This fact has been verified by measurement, see Chapter 2, page 2.14). (d) The endring impedance between the bars is negligible. (See assumption 'a'). The value of the endring impedance of large machines is typically about 3,2 pu of the secondary impedance at full speed. The magnitude of this impedance does affect tne small inter-bar currents present in squirrel cage motors as discussed by Weepier30 when dealing with 'healthy' cage motors. However, in the case of a broken bar, the main parameter affecting the inter-bar currents is the ratio between the bar impedance and the distributed inter-bar impedance -contact and core impedance). This holds true particularly in the case of normal machines where the endring 0,2 pu. impedance is low, ie approximately equal to (e) The portion of the bars between the endring and the core is disregarded. Assumption (b) implies that the current distribution in tne three bars and the core in between them depends only on tte impedance configurations and not on any voltage listribution. From inspection of Figure 4.1 and taking into account the current and voltage directions, the differential voltage irops along bars A and B are given by:
![PAGE 4-6 dvg (x) = - 2 lb(x).zb.dx dv^(x) = - [(It/2) - lb(x)].zb.dx where It is the total current flowing in the system composed of the currents in the broken' bar and the two i.](/docs-images/71/65413009/images/73-1.jpg "imediatf- adjacent bars, and 2Ib(x) is the current flowing through the 'broken' bar at a distance x from the healthy' side endring. Therefore: [(It/2) Ib(x)).Zb.dx [4.1] 21b (x).zb.dx [4.2] where V.")
» [VQ A (x)/rc].dx [4.3] It is important to note that in equation [4.")
73 PAGE 4-6 dvg (x) = - 2 lb(x).zb.dx dv^(x) = - [(It/2) - lb(x)].zb.dx where It is the total current flowing in the system composed of the currents in the broken' bar and the two i.imediatf- adjacent bars, and 2Ib(x) is the current flowing through the 'broken' bar at a distance x from the healthy' side endring. Therefore: [(It/2) Ib(x)).Zb.dx [4.1] 21b (x).zb.dx [4.2] where V. (x) and V ;j(x) are the voltage drops along the bars between the 'healthy' side endring and points A and B respectively. The current flowing into the portion dx of the core from the 'broken' bar at a distance x is given by dlc(x)» [VQ A (x)/rc].dx [4.3] It is important to note that in equation [4.3] the resistance of the portion of the core and the contact between bar and core for the length dx through which the current dlc(x) flows has a resistance given by Rcdx * Rc/dx. This is so because Rc is the total value for one metre of effective core length and is inversely proportional to the axial length. The applicable boundary conditions are as follows:
 and (ii) given above as follows: From equations [4.1] and [4.")
![2] it can be written VA B (X) VA IX> - V X) * Zb.(It/2).x > 3Zb Ib(x).dx and dlc(x) = - [V,B (x)/rc].dx = [dlb(x)/dx].dx Therefore dlb (x)/dx + (It.Zb/Rc).](/docs-images/71/65413009/images/74-2.jpg "x - (3Zb/Rc) / Ib(x).dx» 0 0 J -»»> lb (x)'1 - (3Zb/Rc).Ib(x) * - It.Zb/2Rc The general solution for this equation is Ib (x)» C l.exp{ 1 x } + C2.")
74 PAGE 4-7 (i) l b (x=l) = 0 (ie no current flows out at the end of the 'broken 1 bar) (ii) * 0 *a> die(x*0) * 0 (assumption (d)) The solution for lb (x) is ob lined from equations [4.1], [4.2] and [4.3] together with the boundary conditions (i) and (ii) given above as follows: From equations [4.1] and [4.2] it can be written VA B (X) VA IX> - V X) * Zb.(It/2).x > 3Zb Ib(x).dx and dlc(x) = - [V,B (x)/rc].dx = [dlb(x)/dx].dx Therefore dlb (x)/dx + (It.Zb/Rc).x - (3Zb/Rc) / Ib(x).dx» 0 0 J -»»> lb (x)'1 - (3Zb/Rc).Ib(x) * - It.Zb/2Rc The general solution for this equation is Ib (x)» C l.exp{ 1 x } + C2.exn{- 1 x } + C3 The constants Cl, C2 and C3 are found using the boundary
![PACE 4-8 conditions (i) and (ii). The resulting expression for Ib(x) is then: Ib(x) = (It/6 ).[1 - (cosh tx/cosha^)]...[4.](/docs-images/71/65413009/images/75-1.jpg "4] where 1 ^ 3 1Zb/RcI The change in the airgap mmf distribution in the radial direction in the region of the 'broken' bar will be compensated for by the increased currents flowing in the adjacent")
![bars, such that the total ampere-turns produced by the three bars will remain almost constant. That is the total current will be It = 3In. Therefore from equation [4.4] Ib(x) = In/2.](/docs-images/71/65413009/images/75-2.jpg "[1-(cosh \x/cosh A /)1...[4.")
75 PACE 4-8 conditions (i) and (ii). The resulting expression for Ib(x) is then: Ib(x) = (It/6 ).[1 - (cosh tx/cosha^)]...[4.4] where 1 ^ 3 1Zb/RcI The change in the airgap mmf distribution in the radial direction in the region of the 'broken' bar will be compensated for by the increased currents flowing in the adjacent bars, such that the total ampere-turns produced by the three bars will remain almost constant. That is the total current will be It = 3In. Therefore from equation [4.4] Ib(x) = In/2.[1-(cosh \x/cosh A /)1...[4.5] The current entering the oroken' bar at x» 0 is 2Ib(x*0) * Ibb Hence from equation [4.5] Ibb/In 1-1/cosh A /...[4.6] This variation of the current flowing into the broken' bar, taken as a percentage of the current that would flow into a 'healthy' bar under identical voltage and slip conditions
 is plotted against the ratio Zb/RcI in Figure 4.2.")

76 PAGE 4-9 (equation [4.6]) is plotted against the ratio Zb/RcI in Figure 4.2. ltc In % n 101 :b/r': Figure Plot of llbb/inl as a function of IZb/RcI as per equation [4.6] - (equation [4.6]) The actual rotor-bar currents were measured on
.")

77 PAGE 4-10 industrial motor A under locked rotor conditions as described ln ChaPter 3' 3ecti0n The results o these measurements are given in Appendix D, section D.1.1, page D.12, Where it is shown that the magnitude of the current entering the broken' bar is Practically the same as that of the currents flowing into the 'healthy adjacent bars (8,e Frgure 4.4 ). This somewhat surprising result can be predicted from equation by first evaluating the ratio Of izb/rcl, as follows: ta) Calculation of Rb:-, rr. penetration depth 25,:. rrr. V 4jUt:e 4 j - Cross section ('j industrial motor A -he depth of penetration at 50 H, for lag, conductivity is equal to 9,37 mm. Therefore the effective conducting area Ac at 50 Ha. ie under locked rotor conditions is (see Figure 4.3): ««
 = 246 11U (b) Calculation of Xb:- Xb (at 53 Hz) * 2-rf. (length of core).4-r,10~9,.")
 = 2?. 50. 45. 1,622.An.")
78 PAGE 4-11 Ac = 3, , 91. 0, 37 * 31,73 m m 2 Hence, the bar resistance under this condition is Rb (at 50 Hz) = 1, (1/0,3173) = U (b) Calculation of Xb:- Xb (at 53 Hz) * 2-rf. (length of core).4-r,10~9,.(slot oermeance at 50 Hz) ohms bridge permeance = 3/3,7» 3,8108 slot permeance = 9/(3 x 3,7) 0,8108 total slot permeance = 0, ,8108 = 1,622 Therefore X b (at 50 Hz) = 2? ,622.An = 288"U Therefore the bar impedance is 2b * Rb + j Xb * j298 ie Zb\» 379"^ (c) Calculation of Rc:- The total inter-bar resistance is Re = 19,5/(0,45. 0,95) = 46 uu «
. Hence izb/rci = 379/46» 8,24 «8 By inspection of Figure 4.")

79 PAGE 4-12 In this calculation (3,4=. 0,95) represents the effective core length and 19,5"u has been taken as the inter-bar resistance per metre of effective core length. (This value of 19,5 uu was the value measured for this rotor, cf 18 " il page 2.12). Hence izb/rci = 379/46» 8,24 «8 By inspection of Figure 4.2 it is seen that for this value of IZb/RcI the ratio of IIbb/InI is approximately equal to 100%, ie the current enter ing the 'broken 1 bar is almost equal in magnitude to the currents th at would exist in all the bars were the cage complete. This means that in this machine, and for this slip, the current distribution pattern around the machine is hardly affected by having a broken bar. The measurements taken of the actual bar currents bear this out, see Figure 4.4, where it is seen that the current entering bar A, the broken1 bar, is of comparable magnitude to the current entering any other bar.
 vjoajno")
80 PAGE ti-13 vreq tid^ouq. around the ntic hown. (Figure also n is D.S In Appt ullx D) vjoajno


81 PAGE 4-14 The actual differences between the values of the currents in the various rotor-bars shown in Figure 4.4 can be attributed to the change in the permeability of the airgap around the machine due to the variation of the relative position of the stator and the rotor slots. (The detailed assessment of this aspect is given in Apoendix D, page D.13). Also, as is shown further on, the fact that the current in the broken' oar is slightly larger than the currents in the other bars can partly be attributed to the small finite endring impedance that exists. However, this impedance is small enough to have been taken as zero in the calculations. - from the 'broken 1 bar The distribution of the current magnitude in the 'broken* bar expressed as a function of the axial position along the bar is given by equation [4.5]. This is plotted in Figure 4.5 where clearly as x->l (1 * normalized bar length) the magnitude of the current Ih(x) tends to zero. Note: In Figure 4.5 the current plotted is 2Io(x) which is the total bar current at position x. As shown in figure 4.1 Ib(x) represents half the bar current as the system has botn symmetrically divided. From the above it can be seen that the magnitude of the inter-bar current in the rotor core at some position x can
/dx Therefore the magnitude of the distribution of the current flowing in the core is given by Ale (X) i * Idle")
 This distribution of the magnitude of the inter-bar current in the core IAIc(x)I is also plotted in Figure 4.5.")
82 PAGE 4-15 be expressed as: ~ilc (x)» lb (x) - lb (x > jx) > Jlc(x)/ ix * (lb(x) - ib(x + \x))/ ax As ax > 0 die(x)/dx - - dlb(x)/dx Therefore the magnitude of the distribution of the current flowing in the core is given by Ale (X) i * Idle (x)/dx «ldlb(x)/dx (In. 1/2) (sinh lx/cosh.\ ) 4./) This distribution of the magnitude of the inter-bar current in the core IAIc(x)I is also plotted in Figure 4.5. This shows that the core currents are largest at the end of the core adjacent to the fault.

83 0 axial distance from 'healthy'side -1 Fig. 4 Current distribution al^ng the rotor in the region of the 'broken' baz. Curves A E> c show the distribution of the current magnitude in the 'broken' bar for g different values of X as a function of position along the bar. Curves ), 7 show the distribution of the magnitude of the current flowing from the 'broken' bar into the core for 3 values of X, as a function of position along the bar/core.
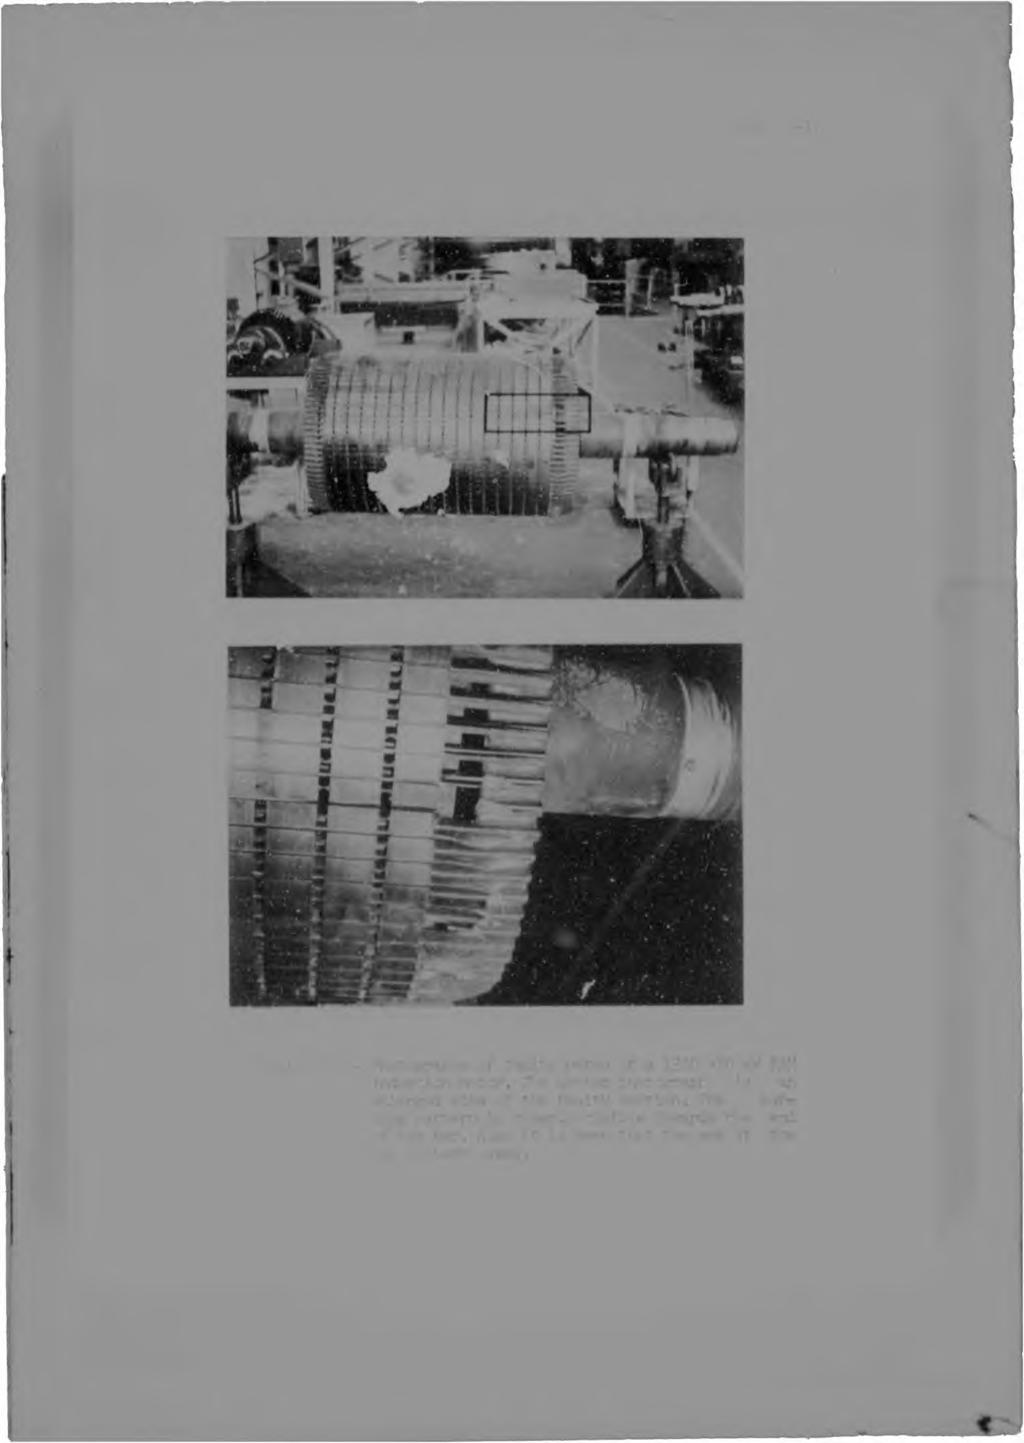

84 - u e n *
![PAGE 4-18 4.2.1 - Experimental ve rif ica t ion of equation [4.7] Figure 4.](/docs-images/71/65413009/images/85-1.jpg "6 shows photographs of a rotor 1300/400 kw, 4/6 pole, 6600 Volts induction motor having cage fault similar to that described above.")
.")
85 PAGE Experimental ve rif ica t ion of equation [4.7] Figure 4.6 shows photographs of a rotor 1300/400 kw, 4/6 pole, 6600 Volts induction motor having cage fault similar to that described above. The rotor of this motor has 58 slots which house a single cage winding of 'T shaped bars made of 100% conductivity copper. This motor was subjected to severe starting conditions (relatively short periods between DOL starting with a load having a large inertia). As a consequence most of the inter-bar current effects must have occurred at low speeds, ie with rotor frequencies close to 50 Hz. Therefore in doing predictions A has been calculated for 50 Hz. Also for this machine: Rc "* 33 U (taking 20"U per metre of effecti core length) Rb 194 U Xb = C b! = 634 on Hence A * ^ 312b/RcI * 7,6 From inspection of Figure 4.5, curves C and F, it can oe seen that for A * 7,6 the current flowing from the 'broken1 bar into the core will be largely concentrated at the end of the core next to the fault. This io totally in accordance with the severe burning of the core laminations and the web of the bar as can be seen in the photographs of the damaged rotor in Figure 4.6.

 n the rotating member, being fed via three sliprings from the supply. The inverted squirrel cage induction motor used for this purpose is described in Appendix E, section E.3.")
86 PAGE The inverted experimental motor The direct measurement of rotor-bar currents on conventional machines for slips other than unity is ' difficult task. This requires soohisticated transmissio, equipment so that the information can be transmitted from th«rotating member to the stationary outside e n v i r o n m e n t. This difficulty can be overcome by performing measurements on an inverted machine where the sguirrel cage is housed on the ani t1e conventional three phase winding 't0e?rimac") n the rotating member, being fed via three sliprings from the supply. The inverted squirrel cage induction motor used for this purpose is described in Appendix E, section E.3. By controlling the slio of the motor and the frequency of 3UP?ly' 3 SerleS f rotor-bar current measurements were tshen on the inverted machine for frequencies varying up to 4,0 HZ The C - s were also done by using Bogowsry. type toroid. coils.,s the measurements were taken for frequencies well in excess of 50 Hr the assumotion inter-oar impedance remains almost purely resistive no longer holds. Consequently the measurements of this impedance were done using the same methods as described by Christofides for various frequencies in the range ' The magnitude of the measured inter-bar impedance varied k-on.iderably from bar to bar, and for each frequency the average value of a large number of measurements taken between number of pairs of rotor-bars was determined and these


87 PAGE 4-20 resalts are plotted in Figure 4.7. The calculated values of the rotor-bar impedances zb and the ratio izb/zcl are also plotted in Figure 4.7 as functions of the frequency. Approximately one third of all the rotor-bar currents were measured by placing Rogowsky coils at both ends of the bars close to the endrings. The side of the cage having all the bars connected to one endring is called the 'healthy' side while the side where one bar is left unconnected is called the faulty' side. Figures 4.8 to 4.12 show the results of the rotor-bar current measurements taken at frequencies of 25, 50, 225, 320 and 400 Hz respectively. In each of these figures the currents measured at the healthy' (curve b) and 'faulty' (curve a) sides are shown. The current flowing into the 'broken' bar from the 'healthy' side is also shown. The scattering of the points is due to the large deviation that exists in the value of Zc for different pairs of bars around tne rotor, as well as to the difference in the values of the endring/rotor-bar resistance for different bars. Nevertheless, the trends are clearly visible, *e that the currents in the 'healthy' bars adjacent to the 'broken' bar are far larger than the currents in the 'healthy' bars further away from the 'broken' bar. in the region away from the fault not many transducer coils were placed around bars, and consequently smooth curves have been drawn through these few points (eg from bars 36 to 9 to 13 and bars 20 to 27 to 36). Clearly this averages out the exoected deviations in these regions. Also the averagj rotor-bar current In is
 to the average current (In) plotted against frequency. The measured values (obtained from figures 4.8 to 4.")
![12) are shown in curve a. Curve b is the theoretical characteristic of this ratio derived directly from equation [4.6], ie assuming the endrings have zero impedance.](/docs-images/71/65413009/images/88-2.jpg "It is seen that the measured curve is shifted upward in relation to the calculated characteristic.")
88 PAGE 4-21 shown; this being determined graphically from the respective curves. Figure 4.13 shows the magnitude of the ratio of the current in the broken' bar (Ibb) to the average current (In) plotted against frequency. The measured values (obtained from figures 4.8 to 4.12) are shown in curve a. Curve b is the theoretical characteristic of this ratio derived directly from equation [4.6], ie assuming the endrings have zero impedance. It is seen that the measured curve is shifted upward in relation to the calculated characteristic. This is due to the fact that the endring impedance of this machine is relatively large, which means that the assumption of zero endring impedance no longer holds. Landy2^ has snown that the endring-tc-bar contact resistance (Rcbr) for this machine is approximately: Rcbr m u for < 106 Hz... [4.8] Rcbr ^f/106 for > 106 Hz This means that the endring/bar contact resistance approximately equals the rctor-bar impedance 2b at 50 Hz. Also the actual endring (made of brass) iroedance must still be added to this endring/bar contact resistance. The effect of this large endring impedance is to emphasize the asymmetry in the distribution of the rotor-bar currents around the rotor, thereby raising the magnitude of the bar currents in the region of the broken ' bar as shown in Figure 4.14.

89 ariation of the measured inter-bar impedance IZc I. A. o the calculat'd variations -f IZbl and Zb/Zc I with frequency are shown.

 Curve 'a, - Currents ieacure<i at the 'faulty'")

90 PAGE U no- ;do h * 38 Anps RCflUH-UAR CUMtQir AM't W-.S Itt «-2,5 Arps X 3B - 'Broken' car (Ear rur-ber -8) Curve 'a, - Currents ieacure<i at the 'faulty' side Curve (b) - Currents measured at the 'healthy' tide rzr-"af. ~ Figure 4.8- Inverted Geometry Motor. Measurement of rotor-bar currents for 25 Hz. M nt «

91 PAGE 4-24 :oo 13<> -> WWM-IVW CIJiaUM* AW'Ufi.. x. * "XOP.-.AR.,
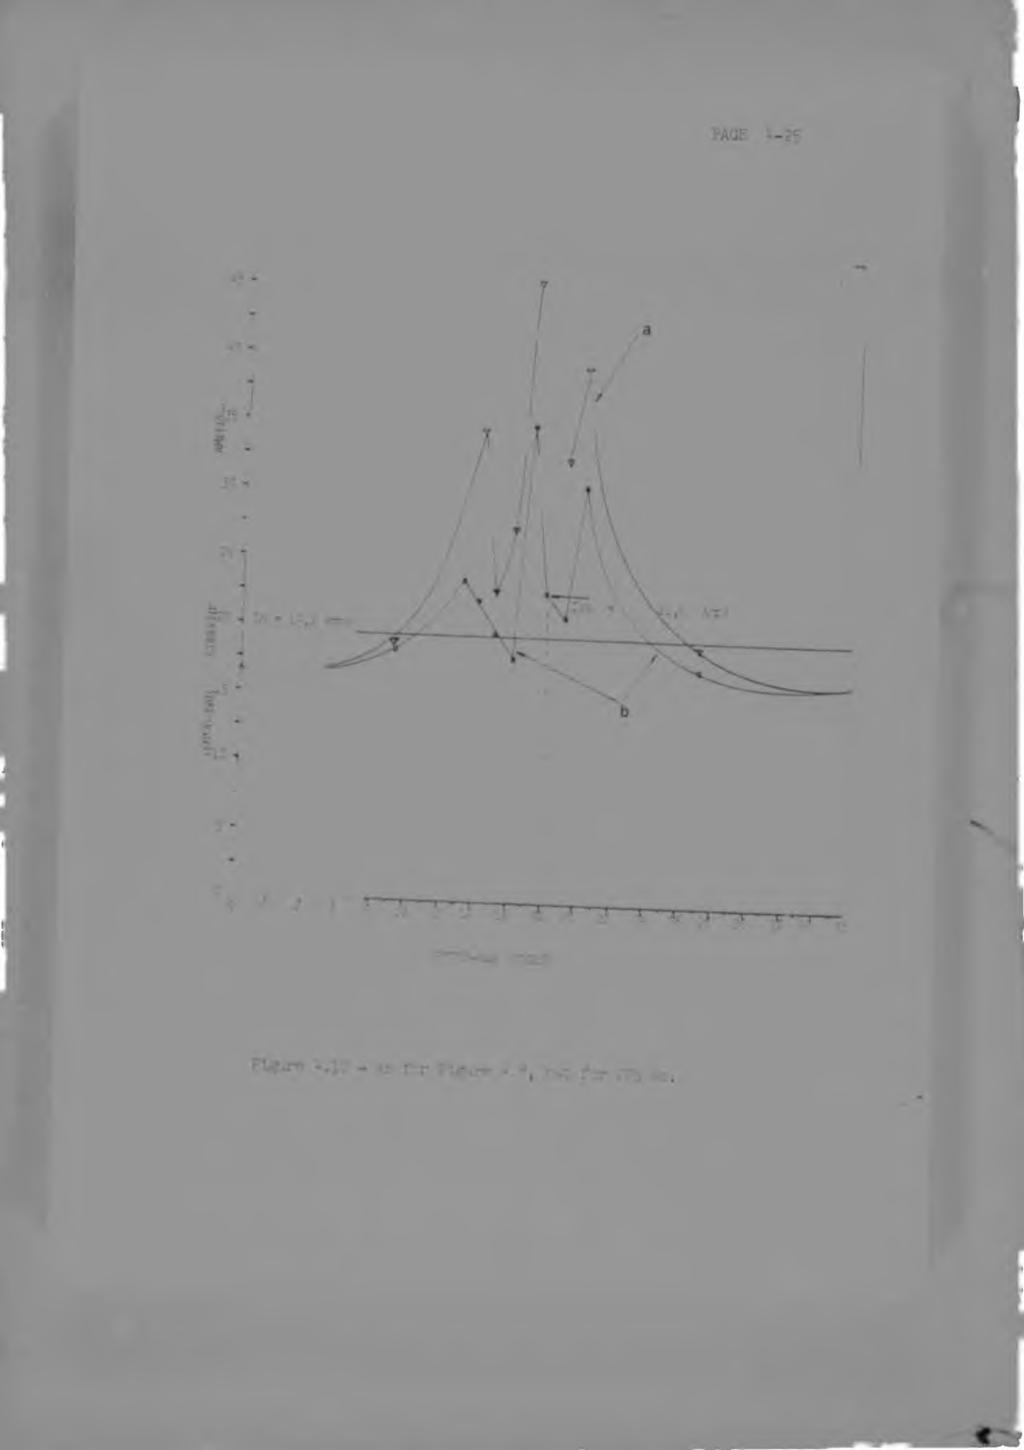
92
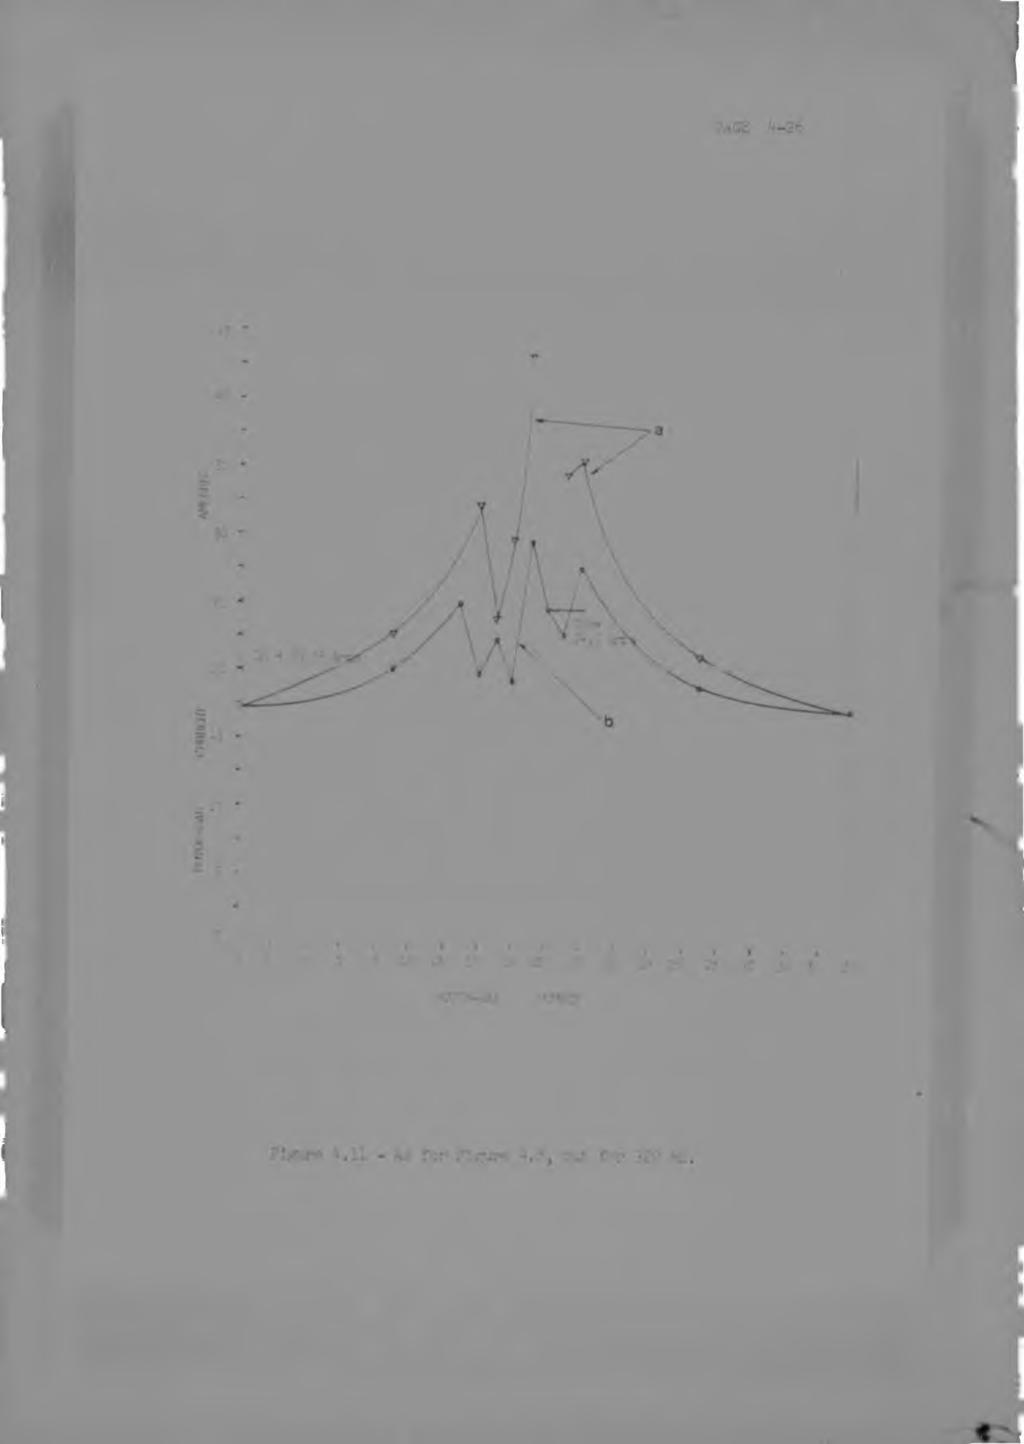

93


94 PAGE -.27 I K #

95 _s PAGE 4 ^b-x 2^. Arrs.,


96 PAGE ROTOR FREQUENCY Hz - : - -re.: i -i va.'. ;es f lbb/ln for the :U"; (a - eaaured characteristic r - 2ula ad ':ara:teristic assunning Zrinc*Q '«rvt ; - re.ilcted characteristic after correction 'or large Zring
 Zero i-moedance (note: distribution very close to In) (ii) large endring impedance Clearly, as previously explained, when the endring impedance is small the currents in the bars away from the")
97 i?age 4- '.ir ker 1 bar Figure Illustration of typical rotor-bar current distribution around the rotor for different ondring impedances. (i) Zero i-moedance (note: distribution very close to In) (ii) large endring impedance Clearly, as previously explained, when the endring impedance is small the currents in the bars away from the -brohen' bar all equ*. In (for all practical purposes,. it is only the currents entering the 'broken bar and the adjacent bars that differ from In and, as shown in equations
![PAGE 4-30 [4.4] and [4.5], It - 3In. Whe he ring impede.](/docs-images/71/65413009/images/98-1.jpg "«ce is large it is clear that the currents in the bars away from the broken1 bar are less than In, and therefore the sum of the currents entering the 'broken1 oar and the two adjacent bars, ie It,")
 and the corrected predicted characteristic is shown as curve c in Figure 4.13.")
98 PAGE 4-30 [4.4] and [4.5], It - 3In. Whe he ring impede.«ce is large it is clear that the currents in the bars away from the broken1 bar are less than In, and therefore the sum of the currents entering the 'broken1 oar and the two adjacent bars, ie It, must now be greater than 3In. The amount by which It exceeds 3In is equal to the sum of the difference between In and the actual bar current for all bars having currents less than In. This correction has been evaluated from all the measured values (figures 4.8 to 4.12) and the corrected predicted characteristic is shown as curve c in Figure The agreement achieved is quite acceotable, especially when it is realized that the values of the magnitude izb/zcl give points on the steeo portion of the characteristic shown in F igure 4.. Also it is seen that as the frequency tends to zero the difference between curves a and b becomes less. This is as exoected because the endring impedance -in particular Rcbr- has been shown to be a function of frequency (see equation [4.8]). The emphasis of this research is on V the effects that occur in large machines when, almost always, Zring (the ring impedance) is a small portion of the secondary imoedance. Consequently the correction referred to above is usually unnecessary. The foregoing discussion clearly points to the interesting fact, that given a relative1y high end r i ng impedance the current flowing into the healthy side of a broken bar of a squirrel cage induction motor may be.
 and pul1-out-torque (POT) can be expect d to occur in a")

99 PAGE Effect of the in ter-bar currents on the starting torque and pull-out-torgue It is well known that a reduction of the starting torque (ST) and pul1-out-torque (POT) can be expect d to occur in a squirrel cage induction motor with a faulty cage. This is mainly due to the torque oroduced by the negative sequence stator and rotor currents which themselves are a oroduct of the unbalance in the secondary impedance. Another result of having a large concentrated asymmetry in the rotor is that the starting torque will now be largely deoendent on the relative angle existing between stator and rotor. This is so because of the asymmetry in the distribution of the airgap fields and the large changes that occur in the field, in the region of the asymmetry,with changes in the relative position between stator and rotor teeth. (I to 3 ', oresents a good illustration of the measured airgap flux around a motor with a broken bar). In Figure 4.15 the various curves show the x. measured values of starting toroue and their variation as a result of changes in the relative angle between stator and rotor of a 8 pole, 13 BMP, 223 Volt squirrel cage motor with an insulated cage. These measurements were taken with the cage being complete, ie without any faults and then repeated when the cage had one, two and three adjacent bars broken (all bars being isolated from the same endring). The figure also shows the mean value of the starting torque for each of the above conditions. \s expected the average starting torque decreased when the amount of asymmetry introduced into
 for the above mentioned motor plotted as a")

100 PAGE 4-32 the rotor was increased. Also it is shown that the dependence of the starting torque on the angle between stator and rotor is a function of the amount of the rotor asymmetry. Figure - M 6 shows the average of the measured values of the starting torque and the pul 1-out-torque (in pu of the valets measured with the cage complete) for the above mentioned motor plotted as a function of the number of adjacent broken bars. It is interesting to note that the Characteristics for the ST and POT follow a similar trend(in the case of the cage being insulated). It is evident from the figure that very large reductions in the starting torque and pull-out-torgue may be expected in motors having a faulty cage. In the case of an uninsulated cage where inter-bar currents can flow, the changes in the starting torcue and pull-out-torgue will be different from those that would occur were the cage insulated. as follows: This can be illustrated 5e9n t o igure 4,2 that the percentage of current flowing into the broken' bar llbb/inl is a function Of the ratio Izb/Rcl. For any particular core length Rc is practically constant and does not vary with frequency in the motoring region. Rc will however be different for other core lengths. 2b, the bar impedance, will vary with frequency and therefore for any particular machine IZb/Rcl will vary with frequency. Hence, for any given rotor length and bar dimension, the region around which IZb/Rcl varies with the frequency will be net by Rc, see Figure 4.17.
 o y")


101 _r_. 00 Q T (V) o y c;o o* I II 3fldHCXL OVOI T ifu JO fid


102 POT and ST in per-unit of nonnai. torque NL MBER OP AOJACENT.2ARS SRCKZK. torque is a function of the number of adjacent bars '.colated fr m same endrlng. :4easnr*!r.ent.s r*'-rf rr»*i n a 4 pole, 10 BHP squirrel :age induction m : having.an Insulated cage).


103 PAGE 4-35 jibb/inj 50 Hz 10 Hz Izt/Rcl Figure Variation of IIbb/InI as a function of!zb/rcl (as per Fig. 4.2). For one motor IZb/Rc I may vary with x- frequency over region 'a' whereas for another motor IZb/RcI may vary ovtr region 'b'. Clearly it is seen that in some cases IIbb/InI may not vary much with the slip whereas in others the variation will be large. For examole consider industrial motor A. It has already been shown on page 4.10 that at starting the current flowing into the 'broken' bar was practically the same as the current flowing intc the 'healthy bars. As a


104 PAGE 4-36 consequence it can be expected that the reduction in the btarting torque due to the fault would be small and that the starting torque would not vary with the angle between the stator and rotor. Chapter D, section D.1.2, page D.19 shows results of starting torque measurements done on industrial motor A under both healthy1 and 'faulty1 conditions. The results obtained from both methods of measurement show no difference at all between the measured starting torque under both conditions. This is in contrast to the measured 5# torque reduction obtained for the 8 pole motor with the insulated cage and having one broken bar, see Figure In the case of the pull-out-torque the ratio (Zb/Rcl must be calculated for low slip. The recordings of the torque-speed characteristics for industrial motor A (see Figure D.30, page D.63) show that the slip in the region of the POT was approximately equal to 125 rpm, ie the rotor frequency was approximately equal to 2 Hertz. For this frequency the bar resistance Rb is Rb (at 2 Hz) = 1, ** /2,28 a 3 4,1 w i; wher. 2, c8 2 in cm. t.ie total cross section.!] area of the rotor-bar The slot leakage reactance Xb is Xb (at 2 Hz) - 2* ,51. 4?. IG-9


105 PAGE 4-3? = 24,9 «i> where 3,51 is the value of the bridge and slot permeance at this frequency. Hence IZb I -* 42,22 uu Rc is again taken as approximately equal to 46 «ij Therefore izb/rcl» 0,92 From Figure 4.2 it is s^en that for IZb/Rcl = 0,92 the magnitude of Ibb/In will be approximately equal to 60%. In the region of the POT the rotor currents are relatively high and the fact that Ibb is only 60% of In means that the unbalance will be significant and will give rise to substantial negative sequence currents. These negative sequence currents produce negative torques which result in a large reduction in the value of the POT (See Figure 4.18). This is confirmed by the measured torque speed characteristics of industrial motor A (figures D.31 and D.32, pages D.64 and D.6 5 respectively) taken under 'healthy1 and faulty conditions. It is seen from the figures that a reduction of 26% in the POT occured. The observed characteristics of industrial motor A, namely no change in starting torque but a large reduction in pull-out-torque, can only be attributed to the oresence of the inter-bar currents. The agreement achived between the theory

 Fundamental positive sequence torque (b) Fundamental")
106 craue (a) Sit (b) Figure 4,18 - Illustration of the effect of the negative sequence current on the torque of an induction motor. (a) Fundamental positive sequence torque (b) Fundamental negative sequence torque (c) Resultant torque
107 PAGE 4-39 and the observations lends weight to the validity of this argument. Clearly i. is seen that in other machines, there may not be any significant -eduction in POT because as the frequency varies IIbb/In I not change significantly.

108 CHAPTER 5 VIBRATIONS DUE TO UNBALANCE IN THE ROTOR IMPEDANCE The topics related to the study of vibration patterns in induction motors are probably the most complex to analyse of all topics concerned with this type of machine. The trend to increase the output from ever smaller frame sizes is giving rise to the situation where the limits in the motor design are becoming more and more mechanical in nature. Therefore vibration (and the associated noise), which is the main cause of mechanical failure due to fatigue of the material, is r.ow^ays a main source of concern for motor designers. This problem is further accentuated when induction motors supplied from thyristor controlled inverters run at speeds higher than 3000 rpm (or 3600 rpm with 60 Hz supply). The study of vibrations produced in induction machines is highly complex due to the interaction between electromagnetic and mechanical sources. A comprehensive study of the vibration and noise patterns produced entails analysing all the magnetic fields existing in the airgap, which include the slot ripple harmonics, primary and secondary produced space harmonics, harmonics due to saturation of the iron, homopolar fluxes, etc., as well as all the relevant mechanical characteristics of the machine. Many authors have studied these phenomena resulting in a large amount of literature being published. In this project the investigation of vibration has been confined exclusively


109 PAGE 5-2 to those vibrations which are a direct consequence of unbalance in the impedance of the secondary (normally the rotor). In particular two pole machines have been consid< r*- as these are more prone to suffer from these effects. It has been pointed out in Chapter 2 how rotor asymmetry gives rise to an asymmetric flux distribution in and arornd the rotor. The effects on vibration, noise, and speed fluctuations produced by rotor imoedance asymr.etry are qualitatively similar, irrespective of the exact origin of the unbalance. Hence the results of the investigation done for the unbalance due to broken bars in the rotor cage are, to some extent, applicable to any other type of secondary impedance asymmetry. Broken bars and/or endrings are the most common cause of unbalance in the rotor impedance and are the simplest of all to study experimentally. Therefore this approach was followed in this proje eccentricity. Chancy i_n the normal UMP The more mportant magnetic forces that are sources of vibration and noise in electrical machines are due to the flux existing in the airgap of the machine. The force of attraction that exists between two infinitely permeable media, which are separated by,1 vacuum, has the same direction as the magnetic flux and its magnitude oer unit of area is given by
![PAGE 5-3 F = B V 2 «O [5.1] where B is the flex density and the permeability of free space.](/docs-images/71/65413009/images/110-2.jpg "For all practical purposes related to this work, the core of an induction motor may he considered to be of infinite permeability.")
110 PAGE 5-3 F = B V 2 «O [5.1] where B is the flex density and the permeability of free space. For all practical purposes related to this work, the core of an induction motor may he considered to be of infinite permeability. This avoids the complication of dealing with the tangential components of the force of attraction which are of secondary importance. The rotor and the stator are both assumed to have smooth surfaces which eliminates the effects introduced by the slots in the airgap flux distribution. Under the above mentioned conditions, and with the rotor being totally concentric with the stator and Of perfect circumferential perimeter, the flu* shows a pure sinusoidal distribution. if the rotor is slightly off-centered UMP will arise. This exists in differing degrees in every motor, mainly due to the bending of the Shaft and the displacement in the vertical direction inside the hearings as a result of the weight of the rotor. Every time a pole of the airgap flu, wave passes through the vertical position a physical displacement of the rotor occurs giving rise to vibration having a frequency equal to two times the line frequency. Summers31 shows that all stator produced space harmonics will give rise to vibrations at twice line frequency worsening this particular type of vibration. It has been shown by various authors31'32'33, that broken bars create an asymmetry in the airgap flu, distribution which Is stationary with respect to the rotor,


111 PAGE t ;r; " -- *

 Combined unbalance: vibration at all orevious modes In a recent paper, Ito,")

112 PAGE 5-5 they exist separately within the motor and when they exist together. airgar rrmf :ar Figure Conditions for vibrations arising from normal UMP interacting with an asymmetry in the airgap due to a broken bar. (a) Stationary airgap asymmetry: vibration at 2x line frequency (b) Rotating asymmetry: vibration at IxRPM and 2xRPM and modulation av 2x slip frequency (c) Combined unbalance: vibration at all orevious modes In a recent paper, Ito, Fujimoto, Okuda, Takahishi and Watahiki3^ develop a method for the derivation of a quantitative expression for the change in the UMP ct squirrel cage induction motors due to broken bars. The method is based on a 'finite element analysis' which is used to solve

113 PAGE 5-6 the fundamental equations of electromagnetism when applied to the airgap of the machine. One of the most interesting results of their research, which is relevant to this work, is an analytical and experimental demonstration of an almost linear relation between the maximum value of UMP and the number of broken bars. From the comprehensive set of vibration measurements carried out in this project on industrial motors A and B (see figures 5.2 and 5.3 in this Chanter and figures D.ll to D.29, pp.d.23-d.60 and figures D. 14 to D.36, pp.d,69-d.71 in Appendix D) experimental confirmation of the items discussed above can be shown. Figures 5.2 and 5.3 show the axial vibration recordings taken on industrial motor A at the non-drive end for two different load conditions. Figure 5.2 is for the case of the 'faulty' cage while Figure 5.3 is for the 'healthy* cage. Comparing the vibration patterns of figures 5.2 and 5.3, shows the increase in the IxRPM frequency vibration due to the rotating asymmetry created by the broken rotor-bar in he squirrel cage. In Figure 5.2 (the record taken with the faulty" cage) a very large increase in the IxRPM frequency vibration is observed when the load is increased, ie when the slip increases. This is due to the increase in the rotor currents giving a larger degree of unbalance. In the case of the 'healthy1 cage. Figure 5.3, when the load is increased the vibration at IxRPM decreases. This is the normal pattern for large machines due to the forced seating of the rotor in the bearings when the load increases (more prevalent in machines having sleeve
 due to the increased saturation.")
.")
114 PAGE 5-7 beatings, although also oresent in machines with anti-friction bearings, as is the case with industrial motor A). The increased load currents also slightly reduce the UMP (at 2xRPM frequency) due to the increased saturation. The same phenomenon can be seen on all the other pairs of recordings taken at different locations on the same motor. On indu- rial motor 3 records were taken only for the broken' bar condition (see figures D.34-D.36, pp.d.69-d.71). These all show an increase in the IxRPM frequency vibrations due to the increase of the rotor currents with load. It must be pointed out that parallel connections of the primary winding which help to reduce the normal UMP are equally effective in reducing the vibrations produced by a faulty cage. ^ ~ Vibration du» to interaction betwe-. n rotor asymmetry and space harmonic fields The previous analysis concerned itself with vibrations produced due to the rotating main field and also due to an asymmetry in the rotor that rotates with the rotor interacting with the stationary airgap eccentricity. There is, however, another interaction which gives rise to vibration. This is the interaction between the rotating rotor asymmetry (due to the broken' bar) and the higher harmonics of the airgap field. These are generally small due uo the low magnitudes of the space harmonic fields.


115 PAGE 5-8 1: r: - -f- - i ; : f... l i f t - : j : T ::F. i:f '* to. I 1 -,"Wy 0'9S/alli o «m COo - * a- rvi Q. (Xh r- M. MOIiVHaiA io AiLlJOT-U : $'1 -Jo a.
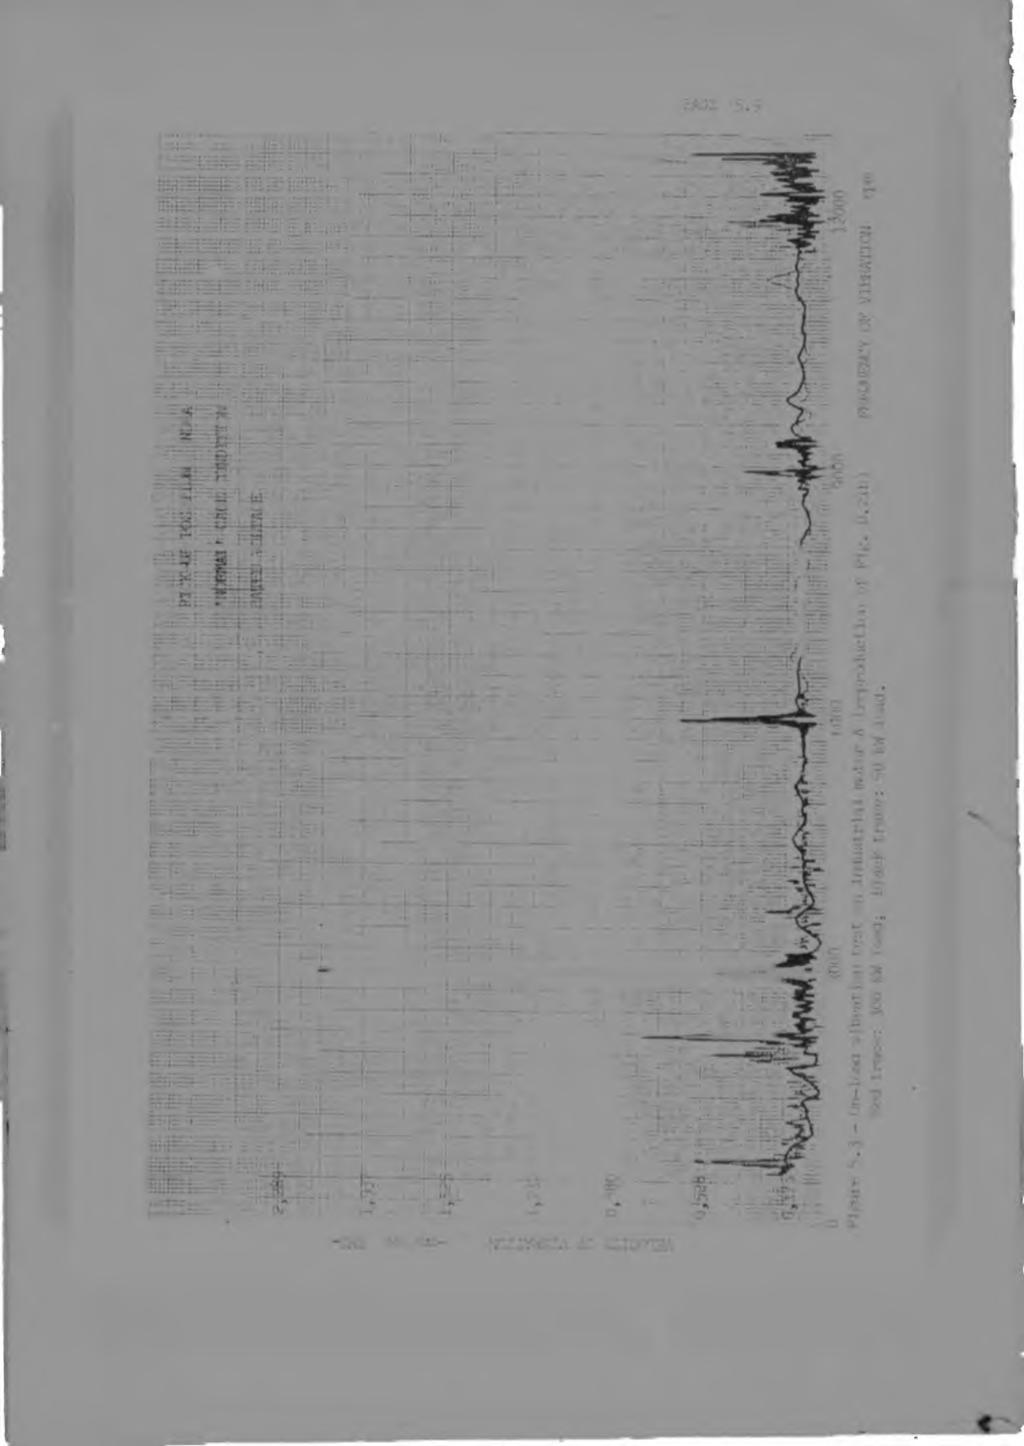

116


117 PAGE 5-10 The frequency of the vibration due to any one space harmonic field is clearly related to the harmonic order and to the speed of the motor. These vibrations are usually insignificant but they do add their share to the overall stress experienced by the faulty machine. This is emphasized if the frequency of one of these vibrations coincides with a mechanical natural frequency of the stator structure. W ROTOR STATOR Figure Interaction between stator produced space harmonic of order "t" and tne rotating asymmetry "A"..i»r : angular speed of motor ' > : angular speed of the stator oroduced "t"th space harmonic m^and <Z>r : angles swept by the "t"th space harmonic and the rotor in a given time. a m.

118 PAGE 5-11 The frequency of vibration due to a Particular harmonic field will be equal to the number of times the rotating asymmetry (indicated as 'A' in Figure 5,4) passes a pole' of the harmonic field in one second. If the angular velocity of the rotor is ^ and that of the "t"th harmonic field is then the angle covered by each of them in one second will be: 0 r (angle covered by the rotor) - w.1 3t ( n9)e covered by the "t"th space harmonic field) ust.1 Therefore the relative change in the angle between them in one second will be U i % I - <z> - I - " ' I st * 1 r st* radians and 'r (1-s). w. where.. 1 : >-ne angular speed of the fundamental field and s is the motor slip. Therefore Id*)» (l-8 ). % /t I - Vt (t (1-s)-1] rad. The angle between two consecutive poles of the "t"th space harmonic field is V t, so the number of pulsations per
 - 1 Hz [5.")
![2] From these results it is clear that the interaction between the stator space harmonic fields and t:ne rotating asymmetry, for motors running close to synchronous speed, will yield vibrations](/docs-images/71/65413009/images/119-2.jpg "having frequencies high enough to be of practical importance. For example consider the following space harmonic fields: 1; -5? 7; -11; 13.")
119 PAGE 5-12 second resulting from the interaction of this field and the rotor asymmetry will be: fsr I3 <d / *r/t = 11 (1-s) - 1 Hz ror a two pole motor 'e* 2 7 fe, where fe is the frequency of the fundamental field Therefore fsr» 2f.,'t (1-s) - 1 Hz [5.2] From these results it is clear that the interaction between the stator space harmonic fields and t:ne rotating asymmetry, for motors running close to synchronous speed, will yield vibrations having frequencies high enough to be of practical importance. For example consider the following space harmonic fields: 1; -5? 7; -11; 13. (In two pole motors some of the higher harmonic fields may be large due to v the excessive chording of the stator winding). Equation [5.2] gives the frequencies of the vibrations produced by these fields and the values tabulated in Table 5.1 are for those at full speed (ie s w (?). The values tabulated in Table 5.1 show that for this phenomenon the frequencies of vibration are relatively high for machines supplied from 50 or 60 Hz networks (and running in the region of rated speed). In he table only one value of frequency appears for each oair of harmonics.


120 PAGE 5-13 Table Frequencies of vibration for a two pole motor running at synchronous soeed resulting from the interaction of the stator created space harmonic fields and the rotating asymmetry due to a broken bar. harmonic order w N fsr (for 50 Hz supply) Hz fsr rpm 1 (fundamental) r This is so because in the calculations the slip was taken to be equal to zero. When uhe machine is running at full speed for each pair of harmonic, two values of frequency will be produced, but because the slip is small these frequencies will remain cl- > to the values tabulated ir Table 5.1. As already stated these vibrations art small in magnitude, but they may coincide with one of the natural freauencies of the core, in which case resonant occurs resulting in relatively large amplitudes of vibration. It is interesting to note that in their series of papers, Verma and rirgis^4 give theoretical, and experimental results for the natural frequencies of stators of electrical machines, and some of


121 PAGE 5-14 the frequencies quoted are of the same order as those in Table 5.1. Some of these vibrations can oe onn,ir? as their frequencies fall well within the audio range Vibrations due to the tangential inter-bar currents The only mechanical causes of axial vibration in a motor coupled to a load on a test-bed are misalignment of the couplings, misalignment of anti-friction bearings, certain types of rotor unbalance (eg fan mounted skew), and misalignment of friction ^sleeve) bearings combined with physical unbalance in the rotor, see Figure 5.5. These result in vibrations having a frequency at one times running sp d (IxRPMj and, if the misalignment is severe, at 2xRPM and in some cases at 3xRPM. Vibrations produced by misalignment are exclusively deoendent on the actual speed of the motor and will remain practically constant as long as the soeed is only slightly changed. As changes in the load of induction motors cause small changes in the speed of the motor, the magnitude of the axial vibration from mechanical sources will remain practically constant once the motor reaches the normal working speed region. The vibration measurements taken on industrial motor H (Figure 5.2) show that an extremely large axial vibration was present at 4xRPM in the case of the 'faulty' cage. The magnitude of this component was totally dependent on the slip of the machine, ie on the magnitude of the rotor-bar

 angular offset in axial offset of coupling coupling Figure 5.")
122 PAGE 5-15 currents. This phenomenon occured only when the motor was tested with the 'faulty1 cage fie having one bar open circuited on one side). The vibration oatterns in figures 5.2 and D.26 should be compared with those in figures 5.3 and D.27 (figures D.26 and D.27 are in Append ix D, cages D.57 and D.58) which are for the 'healthy1 cage condition. The relative changes with load observed in the vibration levels in these figures are tabulated in Table D.27, cage D.61, Misalignment of antifriction bearing Unbalance in rotor "overhang" (eg fan) angular offset in axial offset of coupling coupling Figure Some of the mechanical sources of axial vibration

.")
123 PAGE 5-16 As previously stated, mechanical sources cannot give rise to the large magnitude of vibration measured at 4xRPM, Also this cannot be the cause of the vibration being current deoendent. Clearly then, the origin of this vibration must be electromagnetic and is closely related to the 'broken1 bar. A 4xRPM frequency vibration can also be created by a combination of two other vibrations, one at two times line frequency (caused by normal UMP) and the other at 2xRPM (caused b; t..e lotating asymmetry from the 'broken1 bar). However, the amplitude of the vibration measured at 4xRPM is far larger than the direct summation of these two components and therefore cannot, in any way, account for the large magnitude measured. Furthermore, vibration recordings taken on industrial motor 3 under 'faulty1 cage conditions (Figure D.35, page D,70) show that the machine was free from this 4x.vPv vibration. There is, however, a very significant difference between these two motors. Motor A had very large inter-bar currents flowing, but because the broken bar in motor 3 was isolated from both endrings no inter-bar currents could flow. Therefore, it may be concluded, that the large axial vibrations oresent at 4xRPM in motor A are due to the presence of the large inter-bar currents in the rotor. These currents, which flow tangentially, produce axial fluxes similar to the homopolar fluxes oroduced by other asymmetries in the motor, but the magnitude is far larger. These fluxes due to the inter-bar currents are totally dependent on the motor slip because the magnitude of the inter-bar currents is dependent on the slip. This exolains the strong correlation


124 PAGE 5-17 measured between the 4xRPM axial vibration and the motor load. To date several papers1''''11'12'1'3 have been written on the production of homopolar fluxes in induction machines. Some of these examine how rotor-stator eccentricity affects the creation of homopolar flux13, and others propose methods to detect machine unbalance through the analysis of the homopolar axial flux11'12. However, in the literature surveyed, there is no mention of inter-bar currents being a source of axial flux and consequently of axial vibration. This is hardly surprising as the presence of large inter-bar currents in faulty cages has previously not been accounted for. In Chapter 4, an expression for the current flowing into the 'broken' bar was developed, namely: Ib(x) = (In/2)[1 - (cosh 1x/cosh.1^ )] and the distribution of the magnitude of the current flowing from the broken1 bar into the core was given as: IAle (x)i = Idlb (x)/dxi - ( l In/2).(sinh \ x/cosh \ / ) I From Amperes law ( / H.dl = / (Jc + dd/dt).ds) it can be shown that if J(x) is taken as a two dimensional sheet of current density flowing from bar-to-bar, and if a point x = a 1 choosen such as 0 ^ a ^ /, then it can be shown that the intensity of the magnetic field at x = a produced by an element of inter-bar current of magnitude Mc(x).dx flowing
![PAGE 5-18 into the core at a point x is given by dh(x-a) = f.sic (x).dx/2 7 (a-x) ] for any x between zero and "i", and dh (x=a) = [ Alc(x).dx/2 t (X-a)] for any x between "a" and "I*.](/docs-images/71/65413009/images/125-1.jpg "Therefore the value of the flux density 3(x-a) due to the total inter-bar current flowing along the entire core is given by B(x-a) - AIc(x)/2 7 (a-x) ].dx - u die (X) '2 7 (a-x) ].dx i 5.")
![3 ] It is evident from equation [5.](/docs-images/71/65413009/images/125-2.jpg "3] that the flux distribution created by the inter-bar currents varies axially along the motor 'as a result of the function AIc(x) being asymmetric along the machine).")
125 PAGE 5-18 into the core at a point x is given by dh(x-a) = f.sic (x).dx/2 7 (a-x) ] for any x between zero and "i", and dh (x=a) = [ Alc(x).dx/2 t (X-a)] for any x between "a" and "I*. Therefore the value of the flux density 3(x-a) due to the total inter-bar current flowing along the entire core is given by B(x-a) - AIc(x)/2 7 (a-x) ].dx - u die (X) '2 7 (a-x) ].dx i 5. 3 ] It is evident from equation [5.3] that the flux distribution created by the inter-bar currents varies axially along the motor 'as a result of the function AIc(x) being asymmetric along the machine). This gives rise to axial asvmmetrv in dlal distribution which cannot be compensated for by the primary winding current, see Figure 5.6. This phenomenon gives rise to the axial vibrations present. A most interesting feature arising from this axial distribution of the flux is that the axis of the so produced axial field is not parallel to the axis of the machine, see Figure 5.7.
.")
 Figure 5.")

126 DAGE 5-19 " = Luc currents N - V / l. C J. I opposite directions, four poles of sxiel flu, are produced which are not evenly distributed around the circumference of the machine (see Figure 5.7). These four poles which rotate at full speed are the cause of the axial vibrations having their largest magnitude at 4xRPM frequency. resultant axial flux me Trie list ribut ion of the radial flux brtken' - i ie :f the 'broker. bar ) Figure Schematic diagram showing how the non-linear distribution of the inter-bar currents gives rl t0 an asymmetric distribution of the tadia I flux density, The frequency of the rotor currents is slip frequency, hence the vibration at 4,r p.m is modulated at twice slip frequency, see Figure D.26, page As a result of this axial flux hein, asymmetrically distributed around the circumference, large harmonic and subharmonic vibrations can be expected < - e Figure 0.73a, page 0.54). These vibrations appear only
. These four poles which rotate at full speed are the cause of the axial vibrations having their largest magnitude at 4xRPM frequency.")

127 PAGE 5-19 As the currents flow from the 'broken' bar into the core in opposite directions, four poles of "ixial flux are produced which are not evenly distributed around the circumference of the machine (see Figure 5.7). These four poles which rotate at full speed are the cause of the axial vibrations having their largest magnitude at 4xRPM frequency. resultant axial flix asymmetric distribution of he radial f.ax inter-bar currents Figure Schematic diagram showing how the non-linear distribution of the inter-bar currents gives rise to an asymmetric distribution of the radial flux density. The frequency of the rotor currents is slio frequency, hence the vibration at 4xRFM is modulated at twice slip frequency, see Figure D.26, page D.57. As a result of this axial flux being asymmetrically distributed around the circumference, large harmonic m d subharmonic vibrations can be expected (see Figure D.23a, oage 0.54). These vibrations appear only
.")

128 PAGE 5-20 in the axial direction which tends to confirm the above theory. It. must be realized that the frequency of 4xRPM is a direct result of having only one bar broken (or a group of adjacent bars broken). Other configurations of faults in the cage will probably produce axial vibrations having frequencies equal to different multiples of the running speed. developed view of the rotor - inter-bar currents Figure Developed view of the rotor showing the axial fluxes oroduced by the inter-bar currents flowing from the 'broken' bar into the core.
129 PAGE 5-21 Therefore the strongest indication of a faulty cage is not the actual frequency of the axial vibrations, but the fact that they will always be largely dependent on the magnitude of the rotor current (or the slip of the machine;.
.")
130 CHAPTER 6 CHANGES IN THE HARMONIC SPECTRUM OF THE PRIMARY CURRENT DUE TO BROKEN CnGE-BARS AND/OR ENDRINGS A great deal of work has been done during recent years to develop reliable techniques which alxow faults in the squirrel cige of induction motors to be detected, particularly in large industrial motors working under harsh conditions (eg many DOL startings per hour, high inertia loads, etc.). The aim is to achieve early detection of develooing faults to avoid extensive and expensive overall damage to the motor. The existing oractica1 aoproaches to the solution of the problem fall into three main categories; soeed fluctuation 7 8 monitoring ', vibration and noise monitoring (including electromagnetic noise! and axial flu ^ non i tor ing "v '1". The first two techniques are based on monitoring the mechanical effects oroduced by the rotor unbalance while the last one monitors the electromagnetic source itself. During the early oart of this investigation the Author proposed a new technique, as described further on, for detecting develooing and/or existing rotor cage faults. A little later Hargis, Gaydon and Kamash and Steele, Ashen and Knight1", oroposed the same technique. It is interesting to note that research workers so far removed from each other, and without any knowledge of each other's work, showed that this method of rotor cage fault detection is


131 PAGE 6-2 viable and practical. However the ether researchers7'13 do not give any indication of which additional harmonic components can be expected to appear in the stator current and how these shift in the spectrum with changes in speed. This new method is based in the fact that electromagnetic asymmetries existing in an induction machine g w e r ise to additional time harmonics in the spectrum of the orimary current. This spectrum can be monitored periodically o- continuously allowing developing faults to be detected. Th- analysis oresented here only exolains the origin of the additional current time harmonics that aopear in the primary current spectrum, ie it allows the frequencies and frequency shifts due to changes in the slip of the motor to be predicted. It does not oredict the amplitudes of these harmonics. It is the author's opinion that it is practically impossible to accurately predict the harmonic magnitudes, given the large number cf unknown parameters involved. Hargis, etc.7 give an expression for the value of the magnitude of the (l-2s)f0 component that appears as a function of the number of broken bars. However, the values predicted by using this expression were found to be totally inconsistent with the measured values obtained from the experiments carried out in this project. " The approach followed here for the development of the equations describing the current spectrum is similar to that


132 PAGE 6-3 taken by Penman, HaJwick and Stronach11'12; the main diflerence being that the production of space harmonics due to the secondary asymmetry is also included. Therefore in this work the emphasis is on the negative sequence rotor induced currents and the space harmonic fields produced by them. If the fundamental mmf space wave oroduced by the primary has a velocity with respect to the stator of Vis and i wavelength A 1, then the velocity of the "t"th space harmonic field with respect to the stator is: Vts * Vls/t and the wavelength is \t * \l/t The rotor moves with velocity Vr, with respect to the stator, and hence the relative velocity of the stator produced "t"th harmonic fields with respect to the rotor will be Vtr - (Vls/t) - Vr ihese stator fields will induce emf's and hence currents in the rotor circuit having frequencies given by ftr = Vtr/ At


133 PAGE 6-4 However, these rotor currents will not form a balanced three phaoe set as long as there is some unbalance in the rotor cage. Consequently the unbalanced rotor currents can be split into positive and negative sequence comoonenets ' Each of these component currents will give rise to a family o 1 harmonic fields in the airgap, tne positive sequence of order "t" giving rise to one set of harmonic fields and the negative sequence harmonic currents of order "t" giving rise to a second set of harmonic fields rotating in the opposite direction. It should be noted that the positive sequence rotor currents produce some fields that rotate forward and some that rotate backwards. Likewise the negative seouence rotor currents oroduce fields of the same harmonic order but each of these rotates in the opposite direction to that of its positive sequence current produced counterpart. rotor are given by The velocities of these fields relative to the Vqr =" ± Vtr/q «t ((Vls/t) - Vr]/q...[6.1] where Vqr is the velocity of the "q"th space harmonic field produced by the rotor, "q" is the rotor harmonic order, the +/- signs take account of the respective directions of rotation of the fields due to the oositive and negative sequence rotor currents.
 by these fields are given by fp = (lt / Al).")
![(Vr + f(vls/t) - VrJ/q} for the fields due to the positive sequence rotor currents and fn * d t l / h ).{Vr - [(Vls/t) - Vr ]/g} for the fields due to the negative sequence rotor currents.](/docs-images/71/65413009/images/134-2.jpg "Substituting Vr-(l-s)Vls in the above expression gives: fp * d t l / Al).ft(q-l) (1-s) + 1J/ (t.q) [6.3] fn - (It!/ A1).[t(q + l) (l-a) - 1]/(t.g)...[6.4] where s is the slio of the motor.")
134 PAGE 6-5 Phe velocity of these space harmonic fields with the stator is given bv: resoect to V - Vr ± Vgr * Vr ± [(Vls/t) - VrJ/q [6.2 ] and the frequencies of the currents induced back into the primary (and hence into the supply) by these fields are given by fp = (lt / Al).(Vr + f(vls/t) - VrJ/q} for the fields due to the positive sequence rotor currents and fn * d t l / h ).{Vr - [(Vls/t) - Vr ]/g} for the fields due to the negative sequence rotor currents. Substituting Vr-(l-s)Vls in the above expression gives: fp * d t l / Al).ft(q-l) (1-s) + 1J/ (t.q) [6.3] fn - (It!/ A1).[t(q + l) (l-a) - 1]/(t.g)...[6.4] where s is the slio of the motor. Clearly the rotor unbalance emphasizes the negative sequence currents, and hence, their associated fields. Therefore the frequencies of the prim..i< induced currents due to the rotor unbalance will be identified as in equation [6.4). Also


135 PAGE 6-6 equations (6.3, and,6.4, may be combined to yield a general expression for the harmonic currents induced in the primary. - M t q - ± H/ql...(6.5, Equations,6.3,.,6.4, and/or,6.5, are general, but it Should be realized that not all the values of - f and 111 exist for every motor due to the different winding factors, type of connections, etc. applicable to the respective motors. The values of t and -g- applicable for each case may be assessed by using the guidelines laid down by Landy. It is interesting to note that the rate of change of the frequencies of the stator time harmonic currents with the Slip, are different. This is easily seen by differentiating equation (6.5, with respeot to the slip, ie, Mf/ds «f0 lt(g - 1)/q [o o J It can be ueen from equation,6.6, that for high primary space harmonic orders, f large, and low secondary space harmonic orders,-g- small, the frequency change (shift, with Slip, of the time harmonic primary currents, will be large. 6.2 and [6.6] lieerimental verification of equations (6.5,
![PAGE 6-6 equations [6.3] and [6.4] may be combined to yield a general expression for the harmonic currents induced in the primary, f = f0 [t(q % 1) (1-s) + l]/ql [6.5] Equations [6.3], [5.](/docs-images/71/65413009/images/136-1.jpg "4] and/or [6.5] are general, but it should be realized that not all the values of \"t\" and \"g\" will exist for every motor due to the different winding factors, type of connections, etc.")

136 PAGE 6-6 equations [6.3] and [6.4] may be combined to yield a general expression for the harmonic currents induced in the primary, f = f0 [t(q % 1) (1-s) + l]/ql [6.5] Equations [6.3], [5.4] and/or [6.5] are general, but it should be realized that not all the values of "t" and "g" will exist for every motor due to the different winding factors, type of connections, etc. aoolicable to the respective motors. The values of "t" and "q" applicable for each case may be assessed by using the guidelines laid down 20 by Landy It is interesting to note that the rate of change of the frequencies of the stator time harmonic currents with the slip, are different. This is easily seen by differentiating equation [6.5] with respect to the slip, ie: Idf/dsl - f0 lt(q ; 1) Zq i [6.6 ] It can be seen from equation [6.6] that for high orimary space harmonic orders ("t" large) and low secondary space harmonic orders ("q" small) the frequency change (shift) with slip, of the time harmonic primary currents, will be large. 6.2 Exper imenta1 ver ification of equations [6.5] and [6.61
![PAGE 6-7 In order to verify the frequencies and frequency shifts given by equations (6.5] and [6.](/docs-images/71/65413009/images/137-1.jpg "6] tests were performed on a 8 pole, 220 Volt, star-connected, 10 BHP squirrel caqe induction motor having 72 stator slots housing a single layer full pitched concentric winding.")

137 PAGE 6-7 In order to verify the frequencies and frequency shifts given by equations (6.5] and [6.6] tests were performed on a 8 pole, 220 Volt, star-connected, 10 BHP squirrel caqe induction motor having 72 stator slots housing a single layer full pitched concentric winding. The squirrel cage is made up of a single layer of 47 bars butt-brazed to two endrings. The measurements were taken with no bars broken in the cage and then subsequently repeated with one, two and three adjacent bars broken at the same end. Table 6.1 shows the calculated value. of the frequencies of the harmonic currents as indicated oy equation [6.5] together with the shift in frequency (as.er equation [6.6]) for an assumed change in slip of 2% ie d&=0,02 (or 15 rom for the eight pole motor tested).fo* e :ch combination of "t" and "q" the table gives two harm<nic frequencies and next to each one the shift value is given in brackets? the upper values being for the fields induced by the positive sequence rotor currents (equation [6.3]) and the lower values being for the fields induced by the negative sequence rotor currents (equation [6.4]). The harmonic orders "t" and "q" are consistent with the complete machine being taken as 'o' times the fundamental wavelength. In Table 6.1 only the lower order time harmonics of the stator current have been considered since the amplitudes of the these induced stator currents are inversely proportional to their harmonic order. Also, besides this, all harmonic amplitudes are dependent on their respective winding factors and the type of connection used (parallel or series).


138 PAGE 6-8 When the motor was supplied at reduced voltage it ran at approximately 700 rom, ie with a slip of 6,7%. Therefore this value of slip was chosen when evaluating the frequency values given in Table 6.1. (All values h a v r- been rounded to the nearest integer except for exact half values which have been left). In the table t=l and q=l correspond to the stator and rotor electrical fundamental respectively. Figures 6.1, 6.2, 6.3 and 6.4 show the orimary current snectrum of the test motor. All oictures were taken for similar voltage and slip conditions, namely 30 volt (line) with the motor running on no-load. Figure 6.1 is for the case when no broken bars were oresent in the squirrel cage. Figures 6.2, ' 3 and 6.4 are for one, two and three adjacent bars broken respectively. It is clear from these stator current spectra that new time harmonics appear and that their magnitudes are related to the degree of unbalance introduced into the rotor (eg a 43 Hz comoone t appears). It should be noted that not.ill the harmonics shown in the spectra are significant and need be caken into account because their magnitudes are very small (the vertical scale logarithmic). In Figure 6.3, for example, the 20 Hz harmonic has an amplitude of only 0,126% of that of the fundamental while that of the 43 Hz harmonic is 10% of the fundamental. The larger harmonics are from the lower values of the "t" and "q" series so that they may easily be identified in Table 6.1. The validity of the harmonic freauencies given in Table 6.1 is clearly established in Figure 6.3. ^or example for

139 PAGE 6-9 "t" and "q " both equal t0 ne, the electrical fundamental fields, the frequency due to the positive sequence rotor current is, as expected, 50 Hz, while that due to the negative sequence rotor current is 43 Hz. (The agreement between the measured and predicted values is well within the frequency tolerance expected due to the assumed 2% difference in the slip between the actual measured soeed and that used in the calculations). The other harmonics that apoear in Figure 6.3 can be related to corresponding values in the table, but it is the author's opinion that the harmonic stator current due to the negative sequence fundamental rotor current should be used as the basis for analysing and identifying secondary machine unbalance. This is so because this is the largest harmonic present in the stator current spectrum that results from this form of unbalance. Figure 6.5 shows the current spectrum for the motor under test with two adjacent broken bars (as was the case for Figure 6.3 but in this case the rotor current and motor slip were larger as the voltage was further reduced). Figure 6.6 is also for two broken bars, but here the voltage was increased, giving a corresponding reduction in the rotor current and slip. If the spectra in figures 6.3, 6.5 and 6.6 are compared, it is clearly seen that the harmonics shift in frequency, as expected, due to the change in slip. gome harmonics shift to the left of the spectrum and some to the right in accordance with the direction in which their constituent soace harmonics rotate in the airgap of the machine.

 80J (15) 50 (0) 517 (10) 92 l2'5) 139 (3) 162,5(4) 177 (4) 375 (17,51 328 (6) 304 (6) I 290 (6) '2 I 193 (2) 50")
 j 48 (1) 47, 5 (1) 47 (1) 45 U,5) I 46 d) 46 (1) 46 (1) 1/2 77(0,5) 50 (0) 3 0 (1,5) 3 (1) 37 (e0) 32(30) 30 (*0)J 2 9 (3 0 ) 10 (1) 1 (1) 17")
140 PAGE M e Table of frequencies,i *> of stator current time Harmonics due to both positive (upper values, and negative (lower values, sequence rotor currents for the 8 P M e, 10BHP motor. - Slip: 6,71; ds / (5) 80J (15) 50 (0) 517 (10) 92 l2'5) 139 (3) 162,5(4) 177 (4) 375 (17, (6) 304 (6) I 290 (6) '2 I 193 (2) 50 (0) 380 (6) 1236 (4) 22 m 46 (1; 57,5(1) 65 (2) 165 (3)I 141 (2) 129(1,5)I 122 (3) 1 ' 53 (Dj 50 (0 ) 40 (31 43 (2) 4 3 (,?,5) j 48 (1) 47, 5 (1) 47 (1) 45 U,5) I 46 d) 46 (1) 46 (1) 1/2 77(0,5) 50 (0) 3 0 (1,5) 3 (1) 37 (e0) 32(30) 30 (*0)J 2 9 (3 0 ) 10 (1) 1 (1) 17 (1)1 18 (1) 1/4 I 88 (-0) 50 (0) 65 (1) 27(0 5) 31 (*0)I 24(30, 21 (30, 19 30, 7,5(30)1 1(S0) 2 (30) 2(30) 87 (4) (12) ) (4) 118,2) 141 (2) 152,5(3) 159 (3, (5, J221 (5, J 214 (5) (7) 50 (3 ) 880 (21) 603 (14) 188 (3,5) 234 ( ) 465 (10) 419 ( ) I
141 PAGE 6-11 The results clearly demonstrate that this technique of examining the stater (primary) current spectrum is quite feasible for detecting asymmetry in the cage of a squirrel cage induction motor. The method of examining the axial flux Produced has been used to determine stator faults only11,12, but axial fluxes are produced by both stator and rotor asymmetries. Clearly it is not always possible to predict tne magnitude of the current harmonics in the stator because of the uncertainty in the nature of the fault, eg broken bars or broken rings or any combination of these. However, this method lends itself to a comoavison technique where previous and recent spectra can be comcared to evaluate the state of the rotor cage and hence assess whether any fault is oresent or developing. «S--
 NOTE; in all spectra shown the trace is shifted approximately 2 Hz to the left 4) Figure 6. - ONE BROKEN BAR - Scales as for Figure 6.1 _» x-.")
142 PAGE 6-12 db scaie... Figure 6.1 Primary current soectrum - NO BROKEN BARS VERTICAL: logarithmic scale HORIZONTAL: linear scale (10 Hz per Div.) NOTE; in all spectra shown the trace is shifted approximately 2 Hz to the left 4) Figure 6. - ONE BROKEN BAR - Scales as for Figure 6.1 _» x-.

143 Figure TWO ADJACENT BROKEN BARS - Scales as for Figure 6.1 dti scale Figure THREE ADJACENT BROKEN BARS - Scales as for Figure 6.1.i

144 PAGE 6-14 a> f 4.ti Figure TWO ADJACENT BROKEN BARS, voltage slightly lower than in Figure 6.3 Scales as for Figure 6.1 a. i 4 '.TJ Figure TWO ADJACENT BROKEN BARS, voltage slightly higher than in Figure 6.3 Scales as for Figure 6.1 t vm <

145 CHAPTER 7 CONCLUSIONS The main objective of this project was to investigate the effects produced in a squirrel cage induction motor having unbalance in the secondary winding imoedance. In surveving the literature it soon became evident that the models proposed by the previous researchers to exolain the phenomena observed were inadequate because they neglected the presence of inter-bar currents in the iron. As the initial measurements taken showed that substantial inter-bar currents were present, it became clear that in order to adequately explain the consequences of having such unbalance in the rotor cage (usually a broken bar or endring), these currents had to be taken into account. The aoproach followed in this project and the model presented take account of these inter-bar currents and thereby provide full explanations for many of the ohenomena observed, the cresence of which were previously not predictable. The excellent agreement achieved in every case between the measured results and. those predicted using the proposed techniques clearly demonstrates that the main objective of tnis oroject has been realised. Also, once the observed effects of having a Lroken bar and/or endring could be adequately exola ined, it became possible to propose a method to diagnose the presence of such a fault in a motor. The existence of inter -bar currents when analysing


146 PAGE 7-2 oquirrel ca-.e mo tors having faulty cages has been neglected by the previous researchers. In this investigation it has been shown tnat in most cases this assumption is erroneous, particularly in large industrial machines. The effects of having inter-bar currents present are that there is no significant reduction in tbe starting torque, there may be a substantial reduction in the pull-out torque, substantial axial vibrations are produced which are load dependent and the rotor laminations in the region adjacent to the fault 'f.ouli be burnt..n order to be able to fully assess these effects it is imperative to predict, with reasonable accuracy, the magnitude of these inter-bar currents and their distribution along the axial length of the rotor core. The theory and equations developed in this work enable these currents and their distribution along the core to be predicted. in this respect it is interesting to note in Figure 4.5, page 4.1^, that the bulk of the inter-bar current exists in the core at the end closest to the fault. It is shown that the concentrate j the inter-bar current at the end closest to the fault jgoverned by the rotor geometrical and electrical parameters. Also it is shown that this non-uniform current distribution in the axial direction gives rise to a corresponding non-uniform axial distribution of the radial airgap flux. That is, the airgap radial flux density varies along the machine in the axial direction and must give rioe to resultant axial fluxes which are the source of additional axial vibrations. This aspect has not been recognised by the previous researchers.


147 PAGE 7-3 The understanding gained by investigating and analyzing the inter-bar currents present in a rotor having a cage fault led to the development of the diagnostic procedure for detecting such faults. It has been shown in this project and 7 13 almost simultaneously by the other researchers ' that when such faults occur additional stator current harmonics appear. However, if substantial inter-bar currents exist implying that current flows in the broken bar, these induced stator harmonic currents may not be emphasized. This implies that this method of detecting cage faults is not singularly conclusive. When these inter-bar currents are present then, as has been shown in Chaoter 5, substantial axial vibrations are produced. Therefore the diagnostic procedure recommended in this project is to measure both the axial vibration and the spectrum of the stator current. In this way no anomaly occurs as when the inter-bar currents are large, the axial vibrations will be large while the induced stator harmonic currents will he small and vice versa when the inter-bar currents are small. The current distributions described by equations [4.5] and [4.7] hold for the case where tv ' bar is broken adjacent to one endring (which is the more common of such faults). For other types of cage faults (eg a broken bar midway along the core) the current distribution will be different. However it is the author's belief that significant inter-bar currents and theii associated effects will still occur. This aspect forms the basis for further research which is at present being undertaken. There is no doubt that there are considerable financial
148 PAGE 7-4 benefits to be gained if such faults can be detected before the T.otor finally fails. Therefore the author sincerely hopes that the results presented in this project will be beneficial to the manufacturers and users of large induction motors. <


149 APPENDIX A CALIBRATION OF THE TOROIDAL COILS The amplifier-integrator circuit of Figure A.1 was 2 r* previously developed and succesfully used by Landy. In the present investigation a gain of 100 for the amplifier and a gain of 100 for the integrator circuit was used during the 2 PI tests carried out on industrial motor A. Landy tested the toroidal coil calibration and the measuring circuit for frequencies of up to 5 khz and showed that the currents could be measured with an accuracy of 0,5%. The calibration constant of each toroidal coil was obtained by passing known sinusoidal currents through a segment of bar, identical to that of the rotor-bars, and on which the toroidal coils were wrapped. The output of the toroidal coils was first amplified and then integrated. Tables A.I to A.4 show the measured calibration values for the sinusoidal current of 50 Hz. These measured values were used to plot the calibration curves given in figures A.2 and A.3. It is seen from these curves that the response of this current measuring system is linear. The resultant calioration constants are tabulated in Table A.5. Figure A.4 shows the circuit used for the calibration of the toroidal coils. The waveform obtained from the integrator circuit was compared with the actual waveform as displayed on an oscilloscope via a shunt in the circuit. The difference in the calibration constants obtained for the toroidal coils are


150 PAGE A-2 due to the different number of turns and mean length of each of the coils. A typical current waveform and soectrum obtained by using this method are shown in figures D. 7 and D.9, pages D.16 and D.18 respectively. Table A.1 - Results of calibration of toroid B Table A.2 - Results of calibration of toroids A and C Bar current Integrator o/p Bar current Integrator o/p A mv A mv ============= **»**# a a,... = = = = = = ================ Table A.3 - Results of fable A.4 - Re;suits of calibration of toroid D calibration of toroid E Bar current Integrator o/o Bar current Integrator o/p A mv A mv ============= ================
151 PAGE A- 3 Table A.5 - Average calibration constant obtained from the curves in figures A.2 and A.3 Toroidal coil Average calibration constant A/mV s ts a s s s a ta a E s s a is s ra B s : B 1,74 A and C 1,92 D 1,87 F 1,98 X I Hi


152 Jts PAGE A-4 o W W jl1 o X Z3 u. o 4- T3 01 o v V V V u 3U tj in c 3 o c 3 U o o in afl QJ X Q m U Ui o o kāo m o 3 u n -i c U 10 tj d < m u M H IL 10 m n m Os/ oo o


153 PAGE W 55a rn; : : :...._ ~ m uf ",1/0 L-iL :


154 f.... PAGE A-c -. 4: : :.F:E rr- :.... it ; 5r a I : a:.)c. Jil1 f -. J - - ri-t:: d / 0 T O j E n d H V / ' a Q L r t i i :j ;:l i Jl

155 5 kva r 2d Hz o to to 220 V - o >o 50 Hz o -JU. o o< to 100/5 0-5 Air.'S Hz Oscilloscope toroidal coil segment similar to rctor-bar Amplifier Integrator Spectrum analyser Figure A.4 - Circuit used for the calibration of the toroidal coils


156 PAGE A-7 5 kva 0-5 Anps ^5-65 Hz e Hz CT: 100/5 Oscilloscope 220 V «50 Hz o oo o o # imi memmanams, toroidal coil se@nent similar to rotcr-bar Amplifier Integrator Figure A. 4 - Circuit used for the calibration of the toroidal coils JL \--^
 were discussed. One of the methods, developed below, assumes that in two pole motors the inner diameter of the laminations can be taken as zero.")
, assuming zero inner diameter, is negligible for all practical purposes.")
157 APPENDIX B CALCULATION OF INTER-BAR RESISTANCE FOP A CIRCULAR CORE WITH INNER DIAMETER EQUAL TO ZERO In Chapter 2, two different methods for : calculation of the cere resistance between two rotor-bars R('*o) were discussed. One of the methods, developed below, assumes that in two pole motors the inner diameter of the laminations can be taken as zero. This assumption is valid due to the relatively high curvature of these motors, which results in the ratio -outer di: 'r/inner diameter- being fairly large. Therefore, the e ror introduced in calculating R (a0 ), assuming zero inner diameter, is negligible for all practical purposes. H e m " (*,>) is determined as follows: Due to symmetry the electric field pattern will be described by arcs of circles, with centers on the y axis and passing through M and N (see Figure B.l). Assume two infinitely long charged lines (in the 'z direction. passing through M and N and having a charge per unit of length of 0+ on M and Q_ on N. Then the Electric field intensity E(x,y) at any point T on the x axis is given by E (X, (?)» E (x,(?) + E (x,<?) T 0+ QL = (U/2i t ) (l/(d+x) + l/(d-x)] [B.l]
![PAGE B-2 K1 [B.2 ] Figure 3.](/docs-images/71/65413009/images/158-0.jpg "1 - Schematic cross sectional view showing the rotor core and two bars M and N.")

158 PAGE B-2 K1 [B.2 ] Figure Schematic cross sectional view showing the rotor core and two bars M and N. The inner diameter is assumed to be zero, a: radius of lamination R: equivalent radius of conductor "i conductivity of lamination material ' : permittivity of lamination material ("S' V potential that will exist between M and N is
 ti-r + I dx/ (d-x)] -d+r K1.[In (d4x) - In (d-x)]i Kl. [21n(2d-x) - 21nR] 2.Kl.ln[(2d-R)/R]...[0.3] Substituting for Kl from equation [3.3] into [3.2] gives Q * T. f.vmn/ln[(2d-r)/r] and substituting into [r.")
159 PAGE B-3 I for any path of length 1 in the lamination between M and N Therefore for the particular oath on the x axis I'd Z*d-R - R VMN * /k t (x,0).dx -d+r' K1.[y*dx/ (d+x) ti-r + I dx/ (d-x)] -d+r K1.[In (d4x) - In (d-x)]i Kl. [21n(2d-x) - 21nR] 2.Kl.ln[(2d-R)/R]...[0.3] Substituting for Kl from equation [3.3] into [3.2] gives Q * T. f.vmn/ln[(2d-r)/r] and substituting into [r.1] gives E(*,0)» {VMN/21n [(2d-R)/R] }.(1/(d+x)+1/(d-x)] Now let E2 2 VMN/21n[(2d-R)/R] and for any point P on the y axis the electric field /\ intensity in the x direction ic E(0,y) - 2.K2. (1/KP).(d/MP)» 2.K2.d/(d2+y2) >.w- *
![PAGE B-4 The current density J at any point along the y axis is J = E (0, y ).a r y»2a-h y=2a-h giving I = / 2.K2. 2. 1 <7. (d/(d2>y2)].dy v v= h -h 2a h 2.](/docs-images/71/65413009/images/160-1.jpg "K2.</.d.[(1/d).arctan (y/d)] 2.K2. 7,d.(arctan[ (2a-h)/d] arctan (h/d)).. [B.")
![4] Therefore the equivalent resistance between M and N is R( '*) = vmn/i But *ln [(2d-R) /R )/r/.](/docs-images/71/65413009/images/160-2.jpg "{arctan [(2a-h)/d ]+arctan (h/d)} per unit length of core d * a.sin(* /2) h * a. [1-cos (*0/2) ) 2a-h * a.")
160 PAGE B-4 The current density J at any point along the y axis is J = E (0, y ).a r y»2a-h y=2a-h giving I = / 2.K <7. (d/(d2>y2)].dy v v= h -h 2a h 2.K2.</.d.[(1/d).arctan (y/d)] 2.K2. 7,d.(arctan[ (2a-h)/d] arctan (h/d)).. [B.4] Therefore the equivalent resistance between M and N is R( '*) = vmn/i But *ln [(2d-R) /R )/r/.{arctan [(2a-h)/d ]+arctan (h/d)} per unit length of core d * a.sin(* /2) h * a. [1-cos (*0/2) ) 2a-h * a. (1+cos ( t /2) ] and arctan {[1+cos ( \,/2) )/sin ( i,/2) + + arctan {[1-cos (t0/2) ]/sin (>0/2) )»7/2 Therefore R('»<») *( 2/t f/)in {[2a.sin (< <,/2) - R]/R}....[B. 5] per unit length of core

161 APPENDIX C CALCULATION OF THE INTER-BAR INDUCTANCE )5 As shown by Chr istof ides and also from measurements done by the author in this project, the inter-bar impedance includes a frequency dependent element. A simplified model is developed in this Appendix for the calculation of the inductance existing between two adjacent rotor-bars. The geometric configuration used in the model consists of two parallel rectangular sheets, representing the two bars, separated by a magnetic medium which represents the core (see Figure C.l). This configuration was choosen for the model because it is simple to solve and any other configuration may be approximated to i.t, eg round bars. The calculation of the magnetic field distribution was done assuming a magnetostatic situation, ie a direct current exists which is uniformly distributed in the conducting medium between the two sheets. An alternating current will have a different distribution due to the 'depth of penetration' effect resulting in a reduction of the inductance L 1. Nonetheless, as long as the value of the depth of penetration,s -(<*,0 /4 ) is larger than the thickness of the rotor laminations the error in the value of L calculated using the D.C. approximation will be small. Seeing that at normal working speed the frequency of the rotor currents is low, the model will give reliable results.


162 PAGE C-2 A Z «)>/ a Figura C.l - Geometric configuration of two rectangular conducting sheets of infinite conductivity seoarated by a ferromagnetic medium. Using Maxwell's field equations for the magnetostatic situation gives curl H = J end div H» 0 [C.l] [C.2] Therefore from [C.l] d Hy/^x - dhx/,3y J(x,y) = constant...,[c.3a] and from [C.2] <
![iyi PAGE _-3 dhx/dx + dhy/^y «0...[C.4a] Using the 'separation of variables' method gives Hx(x,y) = Xx.Yx Hy(x,y) = Xy.Yy Hence [C.3a] and [C.](/docs-images/71/65413009/images/163-1.jpg "4a] may be written as Xy'.Yy - Xx.Yx' - J Xx'.Yx - Xy.Yy' «0 [C.3b]...[.4b] Differentiating [C.3b] w.r.t. x and [C.4b] w.r.t. y and rearranging gives: Xy\".")
 Hx(x=0)» Hx(x=a) * Hy(y«0)» Hy(y-b) = 0 (ii) Hy (a/2,y)»")
163 iyi PAGE _-3 dhx/dx + dhy/^y «0...[C.4a] Using the 'separation of variables' method gives Hx(x,y) = Xx.Yx Hy(x,y) = Xy.Yy Hence [C.3a] and [C.4a] may be written as Xy'.Yy - Xx.Yx' - J Xx'.Yx - Xy.Yy' «0 [C.3b]...[.4b] Differentiating [C.3b] w.r.t. x and [C.4b] w.r.t. y and rearranging gives: Xy".Yy + Xy.Yy"» 0 Hence Xy'VXy = - Yy'VYy The boundary conditions aoplicable in this case are: (i) Hx(x=0)» Hx(x=a) * Hy(y«0)» Hy(y-b) = 0 (ii) Hy (a/2,y)» Hx(x,b/2) - 0 Incorporating these conditions gives the solution for the magnetic field intensity as Hyn(x,y) = bn.sin (my/b).sinh [(n t/b) (x-0,5a)]...[c.5]
![PAGE C-4 Hxn (x,y) = an.sin (ntx/b).ssinh [(n T/a) (y-0, 5b) ]....[C.6] Since «>>,vethe magnetic fieli form will follow the contour of the rectangular iron. Therefore as j^h.](/docs-images/71/65413009/images/164-2.jpg "dl = lenclosed, H(around the perimeter)» J.a.b. From this value of H, the values of bn and an can be found.")
164 PAGE C-4 Hxn (x,y) = an.sin (ntx/b).ssinh [(n T/a) (y-0, 5b) ]....[C.6] Since «>>,vethe magnetic fieli form will follow the contour of the rectangular iron. Therefore as j^h.dl = lenclosed, H(around the perimeter)» J.a.b. From this value of H, the values of bn and an can be found. Given the fact that for most practical purposes b (the length of the bar) is many times greater than a (the width of the bar), the end effects along the axial (y) direction may be neglected. This means that Hx is practically constant along y. For the calculation of the flux in the core it is sufficient to take Hy at any point where the component in the x direction is equal to zero. Such a point occurs when y 1 b/2. rrom the above it is seen that Hyn(x*a,y«b/2) = J.a.b which gives: bn = J.a.b / sinh (n-ra/2b) and thus for any x,y Hyn(x,y) - [J.a.b/sinh (ma/2b) ].sinh ((n-r/b) (x-0,5a)).. (C. 7] To calculate the total magnetic flux present in the core, the flux density B is integrated along the x direction from x = a/2 to x» a in the plane y * b/2 dff>y = h.hy.darea -.Hy.h.dx
![PAGE C-5 H * e EL t) (Dtotal = ------------- --I / slnh[~(x-a/2)]. slnhcr-^c dx slnhi m a/](/docs-images/71/65413009/images/165-0.jpg "2b) J a/")
 - Ij slnh(rvra/2b) n t It is clear that as l >0 (ie the series converges) and as a first approximation for the value of L it is")
![sufficient to take n = 1 which yields: L. h. b / 7 sinh (Ta/2b) ]. [cosh (<ra/2b) - 1]....[C. 9] Ver if ication of expression [C.9) Figure C.](/docs-images/71/65413009/images/165-2.jpg "2 shows the actual geometric configuration of two adjacent round bars of the rotor of the experimental inver ted-geometry motor.")
165 PAGE C-5 H * e EL t) (Dtotal = I / slnh[~(x-a/2)]. slnhcr-^c dx slnhi m a/2b) J a/o n. h.j. a. b b * * LCosh(ma/2b) - Ij slnh(rvra/2b) n t It is clear that as l >0 (ie the series converges) and as a first approximation for the value of L it is sufficient to take n = 1 which yields: L. h. b / 7 sinh (Ta/2b) ]. [cosh (<ra/2b) - 1]....[C. 9] Ver if ication of expression [C.9) Figure C.2 shows the actual geometric configuration of two adjacent round bars of the rotor of the experimental inver ted-geometry motor. Super imposed is the aooroximated geometric configuration having rectangular bars that allows expression [C.9] to be used for calculating the inter-bar inductance. From the magnetization curve of the material used in the laminations of the rotor core it is found that for low values of the flux density (as was the case during the measurements) the value of the permeability is " ",. Therefore: L x47xl0~x8xl0'"j( 136x10 x (1,061-1)/ 7X0,353 =416xl0"9 H


166 PAGE C-6 The actual average value measured at 50 Hz between two adjacent bars was 442xl0~9 H. This is sufficiently close to the predicted value and lends weight to the validity of the assumptions made. actual conductor. equivalent conductc; <.. - depth of core a * 30 Figure C.2 - Actual and equivalent geometric configurations between two adjacent rotor-bars of the inverted experimental motor. All dimentions are in millimeters. «
 \"o present the results in such a way that the whole picture of the experimental procedure is brought out and, (ii) as some of the results")
167 APPENDIX D RESULTS OF MEASUREMENTS TAKEN ON THE INDUSTRIAL MOTORS The L.,o reasons for presenting all the results of the tests conducted on b.th industrial motors A and B in one appendix are: (i) "o present the results in such a way that the whole picture of the experimental procedure is brought out and, (ii) as some of the results obtained are not directly relevant to the main tonics covered in this work, they would otherwise be lost. In this way they are, at least, record' 3 and may be a source of information for subsequent researchers in this field. D.1 - Tests on industrial motor A D Measurement of the locked-rotor rotor-bar currents As already stated in section 3.1.1, in this test the fol1owing were measured and recorded: 1- Primary (stator) current 2- Amplifier/integrator outout 3- Photographs of the rotor-bar current waveforms 4- Photographs of the harmonic content of the rotor-bar current waveforms

168 PAGE D-2 Tables 0.1 to D.5 contain the measured values of the primary current and the output from the integrator together with the calculated secondary current using the calibration constants found in Appendix A. During the test all the three phases of the primary current were measured, but due to the fact that no measurable differences were found, only one value common for all three ohases appears in the tables. The positions of the toroidal coils placed on the various rotor-hars are shown in Figure 3.2, page 3.5. The measured rotor-bar currents (obtained from tables D.1-D.5) are olotted against the primary currents in figures D.1-D.3. In this way a "measurement constant" (km) was found for each toroidal coil relating bar current to primary current. This averages out the measurement scatter. The average value is necessary because when the actual measured values were compared they were normalized to the same primary current of 100 A. Table D.l - Rotor-bar currents measured via toroidal X coil A ousitioned on the 'broken' bar. 1 Primary current Integrator o/p Rotor-bar current I 1 Amps. mv Amps. jseaaestmhtassaeaaatasraeea , I


169 PAGE D-j Table D.2 - Rotor-bar currents measured via toroidal coil B positioned one bar away from the 'broken 1 bar Primary current Integrator o/p Rotor-bar current Amps. mv Amps. asassaasasaasaaaa aaaaaaaassaaasas *»»***«** «*»»***ass 25, , , Table D,3 - Rotor-bar currents measured via toroida coil C positioned one bar away from 'broken1 bar (opposite side to B) the v- 1 Primary current Integrator o/p Rotor-bar current 1 Amps. mv Amps. atsarsaasa jssssaeasasaia as* a a a*aaaaaaaaaa aaaaaaaaaassaaaaasa 1 25, i 50, t- Jl V -N Tnr**1-


170 PAGE D-4 Table D.4 - Rotor-bar currents measured via toroidal coil D oositioned diametrically opposite the 'broken1 bar 1 Primary current Integrator o/p Rotor-har current 1 Amps mv Amps. saaasssessrztsatssstaae snsscasaassssasssrassasb 1 24, , ,4 i ii i» ii 0 1 in -r t 1I i ii 856 Table D.5 - Rotor-bar current measurement via toroidal coil E positioned two bars away from the 'broken 1 bar Pri-ary current Integrator o/p Rotor-bar current I Amps. mv Amps I ,


171 PAGE D-5 i * r - j-t Figure D.l - Locked-rotor bar current measui-ements on Industrial motor A for colls A arid B rr ^ saaawv ID HW-y(XLL'i, ft "


172 J/CTtiHr.v rv'i-ri(*i,.vi


173 4, PAGE D-7 Figure D.3 - Locked-rotor bar current measurement on industrial motor A for coil E.! I
 S S X S = S 3 S 3 S Z 4 S S : S : 3 ^ : :.")


174 FACE D-8 Table D.5 - Values of the "measurement constants" (km) from figures D.1-D.3 Toroidal coil "measurement constant" (km) S S X S = S 3 S 3 S Z 4 S S : S : 3 ^ : : ,29 10,66 12,00 11,46 11,32 The ratio of the "measurement constants" between two different toroids should be ileiitica1 to the ratio of their "calibration constants". Any difference is due to the errors in the measurement process. The "measurement constants", km, are tabula ed in Table D.5, and in Table D.7 the percentage error of the ratio of km divided by the corresponding "calibration constant" ratio for all the X toroidal coils is given. Table D.7 shows that the average error in the rotor-bar current measurement was 4,4% (the maximum error being appr ximately 7%). The magnitude of this error is quite acceptable in the context of this research as large current differences are investigated.

175 PAGE D-9 Table D.7 - Percentage error between the ratio of km values and corresponding ratio of calibration constants for all combinations of toroidal coils Km or toroid x km of toroid y calibration const, of toroid x calibration const, of toroid y of toroids -x/y »*** 8/C 1 1,98 8/A 1 3,58 8/D 1 0,O3 B/E 7,16 A/C 1,67 A/D,00 X A/E 4,97 C/D 1,99 C/E 9,32 D/E 7, IS), currents


176 PAGE D-10» R1 XI R2 X2 R1 = 0,0083 XI - 0,1180 R2» 0,0203 X2 «0,0580 Gm * 3,0 220 Bm «0,2503 Figure D.4 - Fundamental per-phase ecu ivalent industrial motor A with the rotor at stand-still. All resistances and reactances are given in per-unit (Ip.u. - 19,6 ohm) As an extra check on the validity of the measured values of the rotor currents obtained via the toroidal coils, the magnitudes were predicted using the equivalent circuit of Figure D.4. The values of the circuit parameters were obtained from the design data as supplied by the manufacturer. These values are for stand-still conditions, ie they take into account the "oenetration deoth" effects within the squirrel cage bars. The oarameter values were calculated for the condition where the leakage flux paths are saturated. In the actual machine, because smaller currents were used, the machine was not so saturated and this accounts for the slight differences recorded between the measured and _v..»

177 PAGE D-ll the calculated values. The actual primary current values used during the tests were approximately 25, 50 and 75 Amperes and the equivalent circuit value of II was normalized to 75 Amps. The solution of the equivalent circuit for the case of II * 75 A gives: VI II = 585,6/^3-75 e"]81 V2 1 «154/^3 e"1 12' * 73,86 e'^80,6 The current 12' is the referred current and the actual secondary current flowing in the rotor-bars is (Say, Chapter 8, page 261) : loar 12'.(6.kws.N1/S2)...(D.l) = 73,86 x 10, Amperes where kws: stator winding factor («kd.kp» 0,866 x 0,955) Ml : number of stator turns in series per phase (*99) 52 : number of rotor slots (*46) This predicted value (739 Amps.) is in fair agreement with the measured values of approximately 800 A (tables D.1-D.5) and therefore shows that the measurements are meaningful. Similarly the equivalent secondary phase voltage is^^
![PAGE D-12 V2 - V2'.S2/kws.Nl...[0.2] = 154/(^3 x 10,679) = 8,3 Volts From the graphs in figures D.1-D.3 values of rotor-bar currents for any oarticular value of orimary current may be obtained.](/docs-images/71/65413009/images/178-1.jpg "The values of the secondary currents thus obtained were normalized with the broken1 bar current taken as the base value for normalization. These are shown in Table D.8 and are also plotted in Fig D.5.")

178 PAGE D-12 V2 - V2'.S2/kws.Nl...[0.2] = 154/(^3 x 10,679) = 8,3 Volts From the graphs in figures D.1-D.3 values of rotor-bar currents for any oarticular value of orimary current may be obtained. The values of the secondary currents thus obtained were normalized with the broken1 bar current taken as the base value for normalization. These are shown in Table D.8 and are also plotted in Fig D.5. Teble D.8 - Normalized values of the measured rotor-bar currents under locked-rotor conditions. The current entering the 'broken1 bar is taken as 100. All other currents are normalized with this as base value. ror oid/ba r jcurrent through toroid/bar f ^Current through 'broken1 bar* x 100 A 9 C D E 100, ,6 93,3 It is seen from Table D.8 that all the values of the bar currents are within ten percent of each other. Figure D.6

179 PAGE D-13 shows the relative position between the Ftator and the rotor teeth. The relative position between the stator and the rotor remained unchanged for the rotor-bar current measurements taken on bars B, C, D and E. A change in the relative position between stator and rotor teeth produces a local change in the permeance thereby affecting the magnitude of the current in the bars. A treatment of this subject is given in Alger" ' (Chapter 9, page 336). if it is assumed that the relative s-ator/rotor oosition during the experiment was as shown in Figure D.6, then the variation in the bar current magnitudes as shown in Figure 1.5 is as expected. Unfortunately, during the course of these measurements the toroidal coil around the 'broken1 bar was damaged and had to be reclaced. When the motor had been re-assemoled it was not known whether the stator/rotor relative position was as before. Therefore the high magnitude of current obtained for the broken1 bar (toroidal A) with relation to the rest of the measured bar currents, cannot be attributed with certainty to he relative stator/rotor position. At worst the d o c 11ion could have been similar to that of B (see Figure D.6) whence the magnitude would be less ( %85 A). However, there is no doubt whatsoever that the current flowing into the broken1 bar is substantial and is comparable with the current entering the 'healthy1 oars. Figures D.7 and D.8 show the waveforms of the current entering the broken' bar and 'healthy' bar D taken at stand-still with II % 75 A.


180 JBq iuao-a-.j quo. rjn.


181 PAGE D-x-t Jisq ua^o-iq, q q i jo q u a o - u a d a ;.uo^mo \


182 PAGE D-15 STATOR ROTOR broker, bar ROTOR STATOR Figure D.6 - Relative position between stator and rotor teeth In Ind ustrial motor A during the bar current measurements.

183 PAGE D-16 I muaamt mm -$%mmm z m m m m Figure D.7 - Waveform of the current flowing into the 'broken' bar as measured during the locked-rotor test using the circuit described in Figure A.4. The primary current was %= 75 Amperes. l in1 * 1«iimii1 mi 1 1 E l li * * * * * * * Figure D.8 - Waveform of current in 'healthy' bar D measured at stand-still (II s 75 A).

. Table D.9 shows that the harmonic content of the measured bar currents is small. Table D.n - C omparxson of rotor-bar harmonic content in per cent of the fundamental as measured on industrial motor A during the locked-rotor test.")

184 PAGE 0-17 D.l.lb Harmonic content of the rotor-bar currents measured during the locked-rotor test Figures D.9 and D.10 show the spectrum of the currents in the broken' bar and bar D taken at stand-still with II 75 A. These figures show that a 3th harmonic comoonent is Present, but it must be realised that its magnitude is small when compared with that of the fundamental (40 db less, labl D.9). Table D.9 shows that the harmonic content of the measured bar currents is small. Table D.n - C omparxson of rotor-bar harmonic content in per cent of the fundamental as measured on industrial motor A during the locked-rotor test. Aoprox. primary Harmonic content in % of the fundamental Bar current in Amps 3 th 5th 7th 11th 13th 17th 19th as a ass a a sa as a mm* mm aaasa xasaa sasaz sasas A 75 0,04 0,915 0,061 0,019 0,012 0,010? B 50 0,04 1,807 0,081 0,052 0,028 0,013 0,010 C 50 0,179 1,789 0,085 0,053 0,028 0,013? D 75 0,069 0,921 0,062 0,018 0,012 0,011? E 50 0,065 1,813 0,073 0,058 0,024 0,015 0,012 L «<


185 PAGE D-18 Figure D.9 - Picture of the rotor-bar current harmonic content measured during the locked-rotor test on industrial motor A. The current is the one flowing into the broken1 bar. <v St 5 Figure D.10 - As for Figure D.9 but for rotor-bar D. <

186 PAGE D-13 Figure D.9 - Picture of the rotor-bar current harmonic content measured during the locked-ro ;or test on industrial motor A. The current is the one flowing into the *broken' bar. Figure D.10 - As for Figure D.9 but for rotor-bar D
 Direct method (using a")
 x 0,9 x 2 x (rated voltage/test voltage) /(rated kw) Where the 0,9 is an empirical factor allowing for the stray losses and ST is the starting torque in per unit of full load torque (FLT).")
187 PAGE D-19 D Locked-rotor torque measurer..ent As already discussed in section two diff ent methods were used to determine the starting torque of industrial motor A: (i) Direct method (using a torgue-arm and a scale) ST = (measured torque) x (rated voltage/test voltage)2/ / (rated kw) (5 i) Indirect method (using the measured input kw's) ST * (input kw's - 3.II:.Rl/1000) x 0,9 x 2 x (rated voltage/test voltage) /(rated kw) Where the 0,9 is an empirical factor allowing for the stray losses and ST is the starting torque in per unit of full load torque (FLT). The values of the starting torque obtained for the faulty and the normal cages are shown in Table D.10. From the values of the starting torque tabulated in Table D.10 it is clear that no difference exist between the starting torque produced with one bar broken and that produced with a normal cage. As explained in Chaoter 4 section 4.4, this is in accordance with the fact that the current flowing into the 'broken1 bar is practically equal to the current flowing into the healthy bars.


188 PAGE D-20 Table D.10 - Stavting torque in p.u. cf FLT measured on industrial motor A by two different methods. The voltage during the test was: 1200 Volts - 'broken1 bar 900 Volts - 'normal1 cage ST at rated voltage in p.u. of FLT 1 'broken 1 bar 1 'normal1 cage 1 i 1 Direct method 0,87 I 0, Indirect method 0,94 I 0, Average 0,905 I 0, D Vibration measurements D.1.3a - No-load v ib r a t ion measurements (broken' bar cond ition only) The methods and the ims of these tests were explained in section As indicate 3, the no-load vibration test was carried out on industrial motor A, only under the 'broken1 bar condition. Figure D.ll shows the vibration at the actual running speed plotted against the speed of the rotor as the motor coasts down from full speed to stand-still against its own inertia after the auooly has been switched off. The maximum of the curve at 2338 rpm gives the first critical speed of


189 PACK 1V21 the rotor. This is close to the full speed of the machine and therefore large changes in load, which are accompanied by relatively large changes in slip, will obviously have some detrimental effect on ^he motor. In this project the loading of the motor was such that the slip never went beyond 13 to 15 rpm. Therefore the effects arising from this first critical speed being close to the full load speed could safely be neglected. D.1.3b - Comoar ison of vibration pat terns taken at rated and reduced voltage The motor was tested uncoupled and the positions of the vibration pick-ups were as indicated in Figure 3.5, oage The actual recordings are shown in figures D.12a-D.13b. The figures with subscript 'a' are those recorded at rated voltage while those with subscript 'b 1 were all recorded at the same reduced voltage. The ratios of the amplitudes of the vibrations at rated and reduced voltage are summarised in tables D.11-D.16. The tables were compiled for all the measuring positions and only include the more conspicuous amplitudes. In these tables the frequencies of the vibrations are given in rom or in multiples or submultiples of the actual motor speed (eg IxRPM * 2980 rpm, 2xRPM * 5975 rpm, etc.). This vibration amplitude ratio is defined for each frequency as: Amplitude of vibration at reduced voltage Amplitude of vibration at rated voltage
xRPM IxRPM 2xRPM of vibration =980rpm =2980rom =5975rpm 9 280rpm 3 3 3 3 3 3 3 3 3 3 3 3 3 3 3 SS 3 3 3 3 3 3 3 3 3 3 3 ms 3 S 3 3 3 3 3 Amplitude ratio 0,758 0,878 0,199 0,911 Table D.")

190 PAGE D-22 Table D.ll - Results of no-load vibration test on industrial motor A having a 'broken1 bar, Pick-up position: DEV Approx. frequency (1/3)xRPM IxRPM 2xRPM of vibration =980rpm =2980rom =5975rpm 9 280rpm SS ms 3 S Amplitude ratio 0,758 0,878 0,199 0,911 Table D.12 - As for Table ID.ll Pick (-up oosit Lon: DEA Approx. frequency of vibration 2980rpm 5965rpm X S a S S S S X S X S B S X S S S S Z S S : Amplitude ratio 1,8 0,288 Table D.13 - As for Table [ D.ll Pick.-up posit:.on: DEM Approx. frequency 1000rpm 2980rpm 5965rpm 9280rpm of vibration x s a s x s x s x a a x s a a s s s x Z 3» * :S S IS Amplitude ratio 1,44 0,634 0,262 0,966


191 UJ ;,i gg - p. * : V CO r? rj A -

192 m


193 :: w :.c' A


194

195

196


197

198


199 PAGE D-31 & ' %.
200 ;
201


202

203
204 > I

205 A :)A, U f / m A


206 "AGE D-38 1 Table D.14 - As for Table D.ll Pick-up position*. NDEV Approx. frequency 130Drpm 3000rpm 6000rpm 9280rpm of vibration -B 3! 36 = 3 3S S S S ' : Amplitude ratio 9,867 0,875 0, 374? Table As for Table D.ll Pick-up position: NDEA Approx. frequency ^ of vibration rpm rpm rpm rpm rpm rpm Amplitude ratio 0,854 1,247 0,932 0,178 0,365 1,502 Table As foi able D.ll Pick-up position: NOEH Approx. frequency 1000rpm 2975rpm 6000rpm 9280rpm of vibration S Amplitude ratio 0,713 0,898 0,221 1,745? The question mark (?) appearing in the tables indicates -*» * --


207 -V PAGE D-39 unclear readings. Table D.17 was comoiled from figures D.17a and 0.17b which are recordings taken with the pick-up in the same position as for Figure D.11a and Figure D.llb. In this case the range of frequencies recorded was extended to rpm to assess whether any changes in the higher frequency vibrations were significant. Table D.17 shows that this was not the case. Table D.17 - Results of no-load vibration test on industrial motor A having a 'broken1 bar. (Extended frequency range). Pick-up position: DEV Approx. frequency 960rpm 2890rpm 5900rpm 9155rpm of vibration * : T 3 * * I Amplitude ratio 0,969 0,419 0,15: 0,972 -* 1700rpm 15840rpm i9190rpm rom? * * * rr * ,566 0,977 0,878 0,660


208 PAGE D-40 Tables D.ll to 0,17 indicate the degree of change on the vibration amplitudes for a particular frequency due to the change in the terminal voltage. To develop further insight into the phenomena involved, tables D.18-D.24 were compiled where the amplitude of vibration at certain frequencies is compared with the amplitude of vibration at IxRPM (for the same voltage). This was done for rated voltage and for reduced voltage. In this way it becomes clear which of the vibrations change in magnitude relative to the IxRPM vibration with a change in the supply voltage. Table D.18 - Comparison of vibrations at other frequencies relative to that at IxRPM. No-load vibration test on industrial motor A with a 'broken 1 bar condition. Pick-up position: DEA Approx. vibration freq.(rpm) a s 3T 3 2: Rated (Amplitude at frequency.... 1,000 3,1:6 voltage 'Ampl. at IxRPM (=0, 333mm/see)) Reduced voltage (Amplitude at frequency...j 1,000 0,500 Ampl. at 1xRPM(*0,600mm/sec)'
i Reduced (Amplitude at frequency...i 0,791 V f 1,000 1,209 2,670 voltage lampl.")
 1000 2980 5965 9270 SBS 3 3 3 3 33 3 33335 33335 Rated Amplitude at frequency... 0,145 1,000 4,662 0,387 voltage (Ampl.")
209 * PAGE D-41 Tible D.19 - As for Table D.18 Pick-uo position: DEV Approx. vibration freq.(com) Rated (Amplitude at frequency ,916 1,000 5,336 2,573 * i voltage fa.pi at IxRPM (= 0,13 Imm/sec )i Reduced (Amplitude at frequency...i 0,791 V f 1,000 1,209 2,670 voltage lampl. at IxRPM (=0,115mm/sec)i Table D.20 - As for Table D.18 Pick-up oosition: DEH Approx. vibration freq.(rpm) SBS Rated Amplitude at frequency... 0,145 1,000 4,662 0,387 voltage (Ampl. at IxRPM(=0,9 22mm/sec) Reduced voltage ^Amplitude at frequency... (Ampl. at IxRPM (= 0, 58 Smm/sec) 0,330 1,000 1,928 0,590
 1000 2950 5990 9280 X S S S 3 3 3 S S S 3 a S 3 e 2 X ^ a S S 3 3 3 S S 3 3 & S 2 3 3 3 2 3 3 33333 33333 Rated Amplitude at frequency, 0,116 1,000 0,786 0,080 voltage -\mpl.")
 1000 2975 6000 9280 I 3 3 3 3 3 3 3 3 3 2 2 3 3 3 ' S 2 2 2 33232 323 2 3 33333 3 3 3 3 3 Rated voltage mplitude at frequency Ampl.")
210 PAGE D-4 Table D.21 - As for Table D.18 Pick-up position: NDEV Approx. vibration freq.(rpm) X S S S S S S 3 a S 3 e 2 X ^ a S S S S 3 3 & S Rated Amplitude at frequency, 0,116 1,000 0,786 0,080 voltage -\mpl. at IxRPM(=1,0 3 4mm/sec) Reduced voltage molitude at frequency mpl. at IxRPM(*0,905mm/sec) 0,115 1,000 0,336? Table D.22 - As for Table D.18 Pick-up position: NDEH Aoprox. vibration freq. (com) I ' S Rated voltage mplitude at frequency Ampl. at IxRPM(= 1,262mm/sec) 0,102 1,000 1,518 0,148?? Reduced voltage mplitude at frequency, mpl. at IxRPM (*1,133mm/sec) 0,081 1,000 0,373 0,283
> Reduced ^Amplitude at frequency....) 0,051 0,119 1,000 0,051 voltage Ampl.")

211 PAGE D-4 3 Table D.23 - As for Table D.18 Pick-up position: NDEA Approx. vibration freq.(rom) Ra ted ^Amplitude at frequency....\ 0,056 0,039 1,000 0,267 voltage tamp I. at IxRPM (=0,86flmm/sec )> Reduced ^Amplitude at frequency....) 0,051 0,119 1,000 0,051 voltage Ampl. at IxRPM (=3,80 0mm/sec)' / as asaes ass s s 0,228 0,30 5 0,090 0,491 D.1.3c - Vibration measurements on load The procedure used in these tests was as explained in section Figures D.19a-D.22b show the vibration recordings taken on industrial motor A at the different positions. In the J D l

 and 'broken' bar (subscriot a) conditions. The main features of the recordings are summarised in tables D.24-D.27.")
212 PAGE D-44 original recordings the different traces are in different colours making it easy to distinguish between the two. In the copies shown in the toxt one of the traces, namely those for a load of 300 kw, has been overdrawn in red for clarity. Each set of recordings was repeated for two different load conditions, 300 kw (red trace) and 50 kw (black trace). Also these measurements were taken for t^e 'healthy' cage (figures with subscript b) and 'broken' bar (subscriot a) conditions. The main features of the recordings are summarised in tables D.24-D.27. Figures D.25-D.27 show recordings of the vibration amplitudes at various frequencies plotted against time for both load conditions and for the 'broken* bar and 'normal1 cage conditions. Mo meaning can be attached to the phase shift between the traces because they were recorded sequentially and not simultaneously. Note: It is important, when comparing the magnitudes of X the vibrations for the different load conditions to be aware of any significant periodic changes in the vibration amplitudes. This is so because the recording at any particular frequency is almost an instantaneous indication of the vibration amplitude at that particular instant and is not an average value.
 3000 6000 9000 12000 xssasass 3= r-s 3C 353 3: 33 3 3 3 3=5 3 3 S Change in the amplitude with increase in load 'broken 1 bar 0,829 3,154 7,75 from 50 kw")
 3000 6000 9000 12000 33353323=3=3 3333333*3 33 35325533 33335 333*3 *5*35 *3**3 Change in the amplitude 'broken 1 1,000 1,054-6,545 with increase in load")
213 PAGE D-45 Table D.24 - Change in amplitude of vibration with load from results of on-load vibration tests on industrial motor A. Pick-up position: DEH Approx. freq. of vibration (rom) xssasass 3= r-s 3C 353 3: =5 3 3 S Change in the amplitude with increase in load 'broken 1 bar 0,829 3,154 7,75 from 50 kw to 300 kw 'normal1 0,680 1,224-2,846 cage Table D.25 - As for Table 0.24 Pick-up position: NDEV Approx. freq. of vibration (rpm) =3= * *3 *5*35 *3**3 Change in the amplitude 'broken 1 1,000 1,054-6,545 with increase in load bar from 50 kw to 300 kw 'normal1 0,40 3 1,551 2,953 cage M H I -----
214

215

216


217

218


219
220

221


222


223 AC!. HR**' m m m '.U. \


224
225
226
227
228


229 PAGE D-61 Table As for Table 0.24, bat In this case tne loading on the motor when tested with tne 'broken' bar was different that when tested with the 'normal1 cage. Pick-up position: NDEH Approx. freg. of vibrati on (rpm) ,= = = *= ====i = =i = a:* a,=,!s = = "s = Change in amplitude for 'broken 1 arssss 2,089 xssaa-s 1, = ,250 load change:50 to 150kW bar Change in amplitude for load change:50 to 300kW 'normal1 cage 0,560 1,444 * 1,22 * Table D.27 - As for Table D.24 Pick-up position: NDEA Approx. freq. of vibration (rpm) \ 3333=3== *5 3 Change in the amplitude 'broken 1 2,857 8,800 with increase in load bar * 3,500 from 50 kw to 300 kw 'normal1 3,385 0,208 cage * 1,286 I


230 PAGE D B == = = = issrssat* I* 6,250 * * * 3,5+ * 1,864 * * 1,471 The symbol * indicates a large change in amolitede but in absolute terms the magnitude is small when combated with the more conspicuous magnitudes. Figures D.28 and D.29 ihow vibration spectra measured on the gearbox surface facing the motor under test. These show that no meaningful vibrations were transmitted into the motor from the gearbox. rement of the toroue-speed characteristics Measu The procedure used for measuring the torgue-speed curves of the industrial motor A has been explained in section This gave O.V. recordings similar to that shown in Figure 0.30, vhere the torque and the speed are recorded against the same time axis. From th se recordings the torgue-speed characteristics were extracted. Figured D.31 and 0.32 show the torgue-speed characteristics of industrial motor A for the 'broken' bar and 'normal' cage conditions respectively. I..*».


231 PAGE D-63 Figure D.30 - Cony of U.v. Recorder trace of speed and acceleration measurement* taken on the industrial motor A. SUPPLY VOLTAGE FULLY ADJUSTED It) TEST VOLTAGE -- TOl -- REGION ( Jk- y ltlr,,


232 i ::: ct ct rt I I UJ

233 I


234 ) PAGE D-64 r.r:::::: 1. «.... -:r. - : I ; : : ;. :. 1 ' :L..till;: i «


235 PAGE D-65 1 E!7v!Tv^-"T*Hr -U - A : : ;-.rtr::t:- : : - T.irr. in-:-.. i -...». «


236 PAGE 0-66 Table D.28 _ Table of Harmonic Content for industrial motor A. 3-phase, 2 pole, 54 stator slots, 46 rotor slots, 18/27 pitch. ms and mr are the stator and rotor produced space harmonics respectively. K5 and K6 define which space harmonics will»20 exist The dashed numbers are the stator and rotor slot harmonics. K6--> K5 ms mr * 46 K6 + ms rt a * a = 3 a * 2S * = 3 = asr s 3 X =a s a a a a a a a * ~ _ _ : The vertical axis is calibrated in per-unit of full l ij torque (FLT) and the horizontal axis represents the rotor speed in torn. Both plots are for rated voltage and the friction and windage effects have been included, as per


237 PAGE 0-67 section Table D.28 is the Table of harmonic Content of motor A. (The procedure and theory behind the construction of this table is given by Landy20). From the analysis of the table and the winding factors for this machine, relatively large dips in the torque-speed curve are expected due to the -5th and +7th space harmonic fields. These are evident in the measured curves. The main features of the torque-speed characteristics for industrial motor A are that under both conditions, ie with one bar broken and with all the bars normally brazed, the starting torque is the same, but there is a reduction of approximately 26% in the pull-out-torque (POT) for the 'broken 1 bar condition lests on industrial motor Measurement of impedance unbalance under locked-rotor In this motor one rotor-bar was isolated from both endrings and it was suspected that a relatively large regional asymmetry in the field would appear in the airgap. This asymmetry became noticeable in the measurement of the input impedance taken when the rotor was locked at different angles, namely every 30 degrees.


238 PAGE -68 suiqo ( riv2) 3CNV03dNI I > W
239

240


241 J/Iti OdS/tuu M0IIVH91A io JJIOCTBA

242 PAGE D-72 The machine is a two pole motor having the primary windings chorded by approximately 55% with the result that at any one time more than one stator phase is influenced by the rotor asymmetry. Hence the impedance measurements were carried out with only two phases excited. The test was carried out with the primary voltage kept constant and the rotor rotated at intervals of 30 degrees. Figure D.33 shows the plot of the impedances measured for each of the angular positions in which the rotor was locked. This shows the imoedance varied by the relatively large margin of 2,2%. 0.2,2 - Measurement of vibrations on load The positions at which the vibrations were measured are as shown in Figure 3.5 page This motor had one rotor-bar totally electrically isolated from both endrings by actually cutting it next to each of the endrings. The X mesurements were taken for two different loads, namely 100 and 400 kw. Figures D.34-D.36 show the vibration recordings, and the more important features are tabulated in tables D.29-D.31.


243 PAGE D-73 Table D.29 - Results of vibration test on industrial motor B having one isolated bar. In the table the change in amplitude of vibration as a result of the increase in the motor load is shown. Rated voltage. Pick-uo oosition: DEH Approx. vibration freq.(rpm) S53 2SS2S 35355C253» sssss = = = = = Change in amplitude with 2,391 1,33 - change in load: 100 to 400kW Table D.30 - As for Table Pick-up posi D.29 tion: DEA Approx. vibration freq.(rpm) = s assess as s s s = = = = rj Change in amplitude with 1,000 0,478 0, ' change in load: 100 to 400kW a as s a as a s a assaa esass 1,000 3,756?? <
 1000 3 = 25=23 1500 3000 25 = 33 5250 3=33 = Change in amplitude with 1,667 3,360 0,740 0,630 change in load: 100 to 400kW 6000 9000 12000 15000 18000")
244 PAGE D-74 Table D.31 - As or Table D.29 Pick-up oosition: DEV AppLOX. vibracion freq.(rpm) = 25= = =33 = Change in amplitude with 1,667 3,360 0,740 0,630 change in load: 100 to 400kW Us = 333 aa a = a saesa aaaaa 6,000 2,429 *??

245 in Figure E.l - Photograph of industrial motor A. Gener a 1 data: Rated Voltage : Rated output: Volts 4/3 kw Number of poles: 2 Rated speed: Gross core length: OD of rotor : ID of rotor: com 450 mm 3(12,8 mm 34" mm The rotor was shrunk and keyed onto the solid shaft.
 is of the diamond type, double layer and narrow spread. It has an integral number a. slots per pole oer phase. The coils are short-chorded by 18/27 ie of span 1 to 19.")
246 PAGE E-2 Figure E.2 - Photograph of industrial motor A showing the diamond type coils forming the primary winding. Stator winding: The stator winding (Figure E.2) is of the diamond type, double layer and narrow spread. It has an integral number a. slots per pole oer phase. The coils are short-chorded by 18/27 ie of span 1 to 19. A schematic diagram of the winding arrangement is shown in Figure E. 3. Rotor wi no ing: The rotor winding consists on a non-insulated squirrel cage formed by 46 "L" type copper bars of 100% conductivity noused in a single layer of 46 slots, and butt-brazed to two


.")
247 PAGE E-3 endr irgs. Figure E.4 shows the actual rotor c o n s t r u c t i o n. 3VJ1 W1 U1,U2 incomming leads VI,V2 i Wl,W2 to the two parallel circuits SUl,SU2 star connected sv:,sv2 sw;,sw2 ends 5W2 W2 _ r u i ^ ir uf i n i n n Figure E.3 - Schematic diagram or owe? arrangement of industrial motor A. For this research project the cage was built with the length of the bat s on the drive end side approximately eight millimeters longer than on the non-drive end side. However one bar was Kept short and thus was left unbrazed from the Dh side endring giving a physical clearance of a few millimeters, see Figure E.5. This produced a similar effect to that when a bar is broken adjacent to one endring (one of the more common cage faults). After the tests performed with the 'broken* bar were completed, the drive-end-side endring was removed and all the bars on this side were machined back to the normal length and a new endring fitted. Calculations were carried out with aid of a computer program to assess whether the additional 8 mm bar length

 is of")

248 PAGE E-4 af.jcted the motor performance significantly (the 'broken' bar being ignored). No noticeable effect was found. Bear ings: The bearings are of the anti-friction type. The NDE bearing is a "ball" type. The DE bearing is a "roller" type. The fact that the motor had one axial locating bearing (the "ball" type bearing) is of importance because it gave precise measurements of the axial vibrations produced in the motor. This was very suitable for this project in which the axial vibrations were important. Figure E.4 - Cage of industrial motor A.,_ Jh,
_ General data: Rated voltage: 330f vrolts Rated output: 1257 kw Number of poles: 2 Rated speed: Gross core length: OD of rotor: 2968 rpm 820 mm 44 2,9 mm The rotor was shrunk and keyed onto the")
249 0 Shortened rotcv-bar. 'to cor.*:act w. -tr.dz*... Figure E.5 - View of the rotor of industrial motor A showing the broken1 bar. X. E.2 - Industr il l motor B (F igure E.6)_ General data: Rated voltage: 330f vrolts Rated output: 1257 kw Number of poles: 2 Rated speed: Gross core length: OD of rotor: 2968 rpm 820 mm 44 2,9 mm The rotor was shrunk and keyed onto the solid shaft. 3 a to r winding:


250 PAGE E-6 The stator winding is of the diamond type, double layer and narrow spread. It has an integral number of slots per pole per phase and has two parallel star connected section?. The coils are short chorded by 15/24. Figure E.6 - Photograph of industrial motor B, Rotor winding: It is a non-insulated single layer squirrel cage of 38 "T" shaped copper bars of 100% conductivity with their end butt-brazed to the two endrings. For the purposes of the present research one rotor-bar was isolated from both endrings by cutting the bar next to each of the endrings. The slot/bar clearances are similar to those of industrial motor A resulting in similar values of inter-bar impedances. <


251 PAGE E-7 Bearings: Both bearings are of the friction (sleeve) type without having an axial locating point. E,3 - Inver tei-geometry exoer imental motor This machine, designed by Cormack1'0, has a rotating primary housed in twenty four slots and is supplied via three sliprings. The squirrel cage is constructed from thirty six round copper bars and two endrings bolted onto the bars. It is housed in thirty six single layer slots on the stationary member. The stationary member housing the squire: cage is mounted on an inner frame which is itself attached to tie fixed outer frame via three spring-steel plates. The relative rotation possible between the two frames allows the developed torque to be measured by means of the position transducer, see Figure E.7. The mechanical system is damped by two electromagnetic dampers. A detailed description of the machine layout as well as its operation is given by Landy2^. The stationary member housing the squirrel cage can be easily changed. For the present research the core built and fitted into the machine had slot dimensions and lamination material similar to those used in the construction of large squirrel cage induction motors. The copper bars were choosen to have the same slot/bar clearances as in large motors. These small clearances together with the natural staggering of the laminations results in the bars having a positive


252 PAGE E-8 interference fit, ie the bars are held very tight in tne slots giving a contact resistance per unit length practically the same as in the large motors, for this project one bar was shortened by a millimeter and left unbolted from one endring giving an effect similar to that introduced into industrial motor A. Figure E.8 shows the construction of the secondary member. The inter-bar impedance was measured by using a method similar to that described by Christofides1" and Weppler30. This was done for various pairs of adjacent bars. The measurements were done for three different frequencies, viz. DC, 50 Hz and 400 Hz. The average of the results obtained gave a DC inter-bar resistance per unit of effective core length of 26,9*0 and an inter-bar inductance per unit of effective core length of 39,1 nh. It must be realised that the value of the inter-bar inductance changes with frequency; as has been explained in Appendix C. For a frequency of 400 Hz the value of L will be lower than at lower frequencies (due to the "skin" effect).


253 4 < PAGE S-9 in u u n >. (0 H 4ō C o *-> u E 4-1 -n c au <n <o n n 4-1!u t*. c H L a n ax H ai a BO c1* to c 8-6 u n 1 noe <0 T3 <0 4-1 o c H 03 *J E 6 U 03 'id tn to d <c <4- Ql u 3 BO

254 PAGE E > VO on U) (L > S3 CO K 3 So 01 *JI a Ij -U eo 8 <y 5 5 i oo W M


255 REFERENCES 1. GORGE, H.: 'Uber Dcehstrommotoren mit Verminderter Tourenzahl1, Elektrotechnische Zeitung, 1896, 17, p GABARINO, H.L., and GROSS, E.T.: 'The Gorges Phenomena - Induction Motors with Unbalanced Rotor Impedances', Trans. AIEE, 1950, 69, p WEICHSEL, H.: 'Squirrel Cage Motors with Split Resistance Rings', Journal of the AIEE, August ^928, pp VAS, P.: 'Performance of three-phase squirrel-cage induction motors with rotor asymmetries'. Period. Polytech. Electr. Eng., 1975, 19, pp POLOUJADOFF, M.: 'General rotating mmf theory of squirrel cage induction machines with non-uniform airgaps and several non-sinusoidally distributed windings', IEEE Ind. Applies. Soc. Anual Meeting, Ohio, USA, Sep-Oct. 1980, Pt. II, pp WILLIAMSON, S., and SMITH, A.: 'Steady-state analysis of three-phase cage motors with rotor-bar and endring faults', Proc. IEE, 129, May 1982, pp


256 PAGE R-2 7. HARGIS, C., GAYDON, B.C., ard KAMASH, K.: 'The detection of rotor defects in induction motors', Conference of the Proc. of the I EE, London, July 1982, p GAYDON, B.C.: 'An instrument to detect induction motor rotor circuit defects by speed fluctuation measurements', Electronic Test and Measurement Instrumentation, Testamax 79 Conference Papers, 1979, pp POZANSKI, A.: 'Acoustic measurement of three-phase asynchronous motors with a broken bar in the cage rotor, Zesz. Navk. Politech. Lodz. Elektr., 1977, 60, pp BINNS, K.J., and BARNARD, W.R.: 'Some aspects of tne use of Flux and Vibration Spectra in electrical machines', Conference on Applications of Time-Series Analysis, University of Southampton, Sept. 1977, pp PENMAN, J., HADWICK, J.G., and BARKER, B.: Detection of faults in electrical machines by examination of axially directed fluxes', Third Int. Conf. on Electr. Machines, Brussels, PENMAN, J., HADWICK, J.G., and STRONACH, A.F.: 'Protection strategy against the occurrence of faults in electrical machines', IEE Conf. Publ. 185, 1980, pp


257 PAGE R STEELE, M.E., ASHEN, R.A., and KNIGHT, L.G.: An electrical of the Proc. method for condition monitoring of motors', Conf. of the I EE, July 1982, London. 14. VAS P., and VAS J. : 'Transient and Steady-State Operation of Induction Motors', Archiv fur Elektrotechnik, 59, 1977, pp CHRI5TOFIDES, N.: 'Origins of load losses in induction motors with cast aluminium.utors1, Proc. IEE, vol. 112, 12, 1965, pp STRINGER, L.S.: 'Unbalanced magnetic pull and shaft voltages in electromagnetic rotating machines', Enginner, April 1968, p. 6"* DE JONG, H.C.J.: 'AC motor design - with conventional and converter supplies', Oxford University Press, 1976, p. 63, book. 18. GILTAY, J., and DE JONG, J.: 'The influence of the pole number on the axial flux tendency in radial-gap rotating machines', Holectechniek, 3, 19/3, pp LANDY, C.F.: 'Analysis of rotor-bar currents as a mean of evaluating torque oroduced in a squirrel-cage induction motor 1,.roc. IEE, 1977, 124, [II], p

![I EE, 19/5, 122, [10], p. 1066. 23. DANNAT, C., and REDFEARN, S.W.: A new form of rotational accelerometer', Met. Vick. Gazette, 1932, 13. 24. SAY, M.G.s 'Alterna ing current machines', Pitman, 1978, book.](/docs-images/71/65413009/images/258-2.jpg ". 25. ALGER, P.L.: 'Induction machines', Gordon and Breach, 1969, book. 26. CORMACK, w.: 'The measurement of tne torque slip curves of induction motors', Trans, s.african IRC, 1955, 46, 151, p. 127.")
258 PAGE R LANDY, C.F.: 'An investigation of an induction motor with a view to leakage effects and developed torque*, Ph.D. Thesis, University of the Witwatersrand, ELLISON, D.H., EXON, J.L.T. and WARD, D.A.: 'Protection ' s of slipring induction motors', North Eastern Region, SSD of the CEGB, IEEE, 1980, p. 49. I 22. STOLL, R.L.i 'Method of measuring alternating currents without disturbing the conducting circuit, Proc. I EE, 19/5, 122, [10], p DANNAT, C., and REDFEARN, S.W.: A new form of rotational accelerometer', Met. Vick. Gazette, 1932, SAY, M.G.s 'Alterna ing current machines', Pitman, 1978, book ALGER, P.L.: 'Induction machines', Gordon and Breach, 1969, book. 26. CORMACK, w.: 'The measurement of tne torque slip curves of induction motors', Trans, s.african IRC, 1955, 46, 151, p BARTON, T.H., and DOXEY, B.C.: The operation of three-phase induction motors with unsymmetrical impedance in the secondary circuit1, Proc. I EE, 1955, 102A, op
. 30. WEPPLER, R.: 'Influence of Inter-bar Rotor Currents on the Performance of Singl.-phase and Polyphase Induction Motors', Siemmens Porsch.")

259 PAGE R ELGERD, 0.: 'Non-uniform torque In induction motors used by unbalanced rotor impedances', AIEE, December 1954, ca p VICKERS, H.s 'The Induction Motor 1, Pitman, London, book, (p. 340). 30. WEPPLER, R.: 'Influence of Inter-bar Rotor Currents on the Performance of Singl.-phase and Polyphase Induction Motors', Siemmens Porsch. -u. Entwickl.- Bet. Bd- 4 (1975) Nr SUMMERS, E.W.: 'Vibration in two-pole induction motors related to slip frequency', Trans. AIEE, 74, Part III, 1955, pp MAXWELL, J.H.: 'Diagnosing induction motor vibration', Hydrocarbon Processing, January 1981, pp ITO, M., FUJIMOTO, N., OKUDA, M., TAKAHASHI, N., and WATAHIKI, S.: 'Effect of Broken Bars on Unbalanced Magnetic Pull and Torque of Induction Motors', Electrical Engineering in Japan, Vol. 180, Nr. 1, 1980, PP VERMA, S.P., and GIRGIS, RlS': Experimental verification of resonant frequencies and vibration behaviour of stators of electrical machines', (Part 1, 2, and 3), IEE Proc., Vol. 128, Nr. 1, January 1981.

260 PAGE R VAS, P.: 'Steady-state and transient performance of induction motors with rotor asymmetry1, Trans. IEEE, Vol. PAS-101, Nr. 9, 1982, up MISHKIN, E.: 'Disturbances in the induction machine due to broken sqirrel-cage rings, J.Franklin Inst., 195, 259, pp SCHUISKY, W.: 'Induktionmaschinen1, Springer-Verlag, Wien, 1957, book. 38. HILLER, U.M.: 'Einfluss fehlender Lauferstabe auf die elektrischen Eigenschaften van Kurzschlusslaufer-Motoren1, ETZ Arch., 1962, 83, pp D 1\LESSANDRO, U., and PAGONO, E.: 'Uber asynchronmotoren mit elektrisch unsymmetrischen KafIglaufer 1, ETZ Ar?9,
261

 for your")
262 Author Kerszenbau J Name of thesis The behaviour of three-phase Squirrel Cage induction motors with unbalance in the rotor impedance; in particular two pole motors 1983 PUBLISHER: University of the Witwatersrand, Johannesburg 2013 LEGAL NOTICES: Copyright Notice: All materials on the University of the Witwatersrand, Johannesburg Library website are protected by South African copyright law and may not be distributed, transmitted, displayed, or otherwise published in any format, without the prior written permission of the copyright owner. Disclaimer and Terms of Use: Provided that you maintain all copyright and other notices contained therein, you may download material (one machine readable copy and one print copy per page) for your personal and/or educational non-commercial use only. The University o f the W itw atersrand, Johannesburg, is not responsible for any errors or and all liability for any errors in or omissions from the information on the Library website. omissions and excludes any
CHAPTER 3 INFLUENCE OF STATOR SLOT-SHAPE ON THE ENERGY CONSERVATION ASSOCIATED WITH THE SUBMERSIBLE INDUCTION MOTORS
 38 CHAPTER 3 INFLUENCE OF STATOR SLOT-SHAPE ON THE ENERGY CONSERVATION ASSOCIATED WITH THE SUBMERSIBLE INDUCTION MOTORS 3.1 INTRODUCTION The electric submersible-pump unit consists of a pump, powered by
CHAPTER 3 ENERGY EFFICIENT DESIGN OF INDUCTION MOTOR USNG GA
 31 CHAPTER 3 ENERGY EFFICIENT DESIGN OF INDUCTION MOTOR USNG GA 3.1 INTRODUCTION Electric motors consume over half of the electrical energy produced by power stations, almost the three-quarters of the
Prince Sattam bin Abdulaziz University College of Engineering. Electrical Engineering Department EE 3360 Electrical Machines (II)
") Chapter # 4 Three-Phase Induction Machines 1- Introduction (General Principles) Generally, conversion of electrical power into mechanical power takes place in the rotating part of an electric motor. In
Chapter # 4 Three-Phase Induction Machines 1- Introduction (General Principles) Generally, conversion of electrical power into mechanical power takes place in the rotating part of an electric motor. In
UNIT I INTRODUCTION Part A- Two marks questions
 ROEVER COLLEGE OF ENGINEERING & TECHNOLOGY ELAMBALUR, PERAMBALUR-621220 DEPARTMENT OF ELECTRICAL AND ELECTRONICS ENGINEERING DESIGN OF ELECTRICAL MACHINES UNIT I INTRODUCTION 1. Define specific magnetic
ROEVER COLLEGE OF ENGINEERING & TECHNOLOGY ELAMBALUR, PERAMBALUR DEPARTMENT OF ELECTRICAL AND ELECTRONICS ENGINEERING ELECTRICAL MACHINES I
 ROEVER COLLEGE OF ENGINEERING & TECHNOLOGY ELAMBALUR, PERAMBALUR-621220 DEPARTMENT OF ELECTRICAL AND ELECTRONICS ENGINEERING ELECTRICAL MACHINES I Unit I Introduction 1. What are the three basic types
Introduction to Synchronous. Machines. Kevin Gaughan
 Introduction to Synchronous Machines Kevin Gaughan The Synchronous Machine An AC machine (generator or motor) with a stator winding (usually 3 phase) generating a rotating magnetic field and a rotor carrying
Electric Machines I Three Phase Induction Motor. Dr. Firas Obeidat
 Electric Machines I Three Phase Induction Motor Dr. Firas Obeidat 1 Table of contents 1 General Principles 2 Construction 3 Production of Rotating Field 4 Why Does the Rotor Rotate 5 The Slip and Rotor
Induction Motors. The single-phase induction motor is the most frequently used motor in the world
 Induction Motor The single-phase induction motor is the most frequently used motor in the world Most appliances, such as washing machines and refrigerators, use a single-phase induction machine Highly
Chapter 5 Three phase induction machine (1) Shengnan Li
 Shengnan Li") Chapter 5 Three phase induction machine (1) Shengnan Li Main content Structure of three phase induction motor Operating principle of three phase induction motor Rotating magnetic field Graphical representation
Chapter 5 Three phase induction machine (1) Shengnan Li Main content Structure of three phase induction motor Operating principle of three phase induction motor Rotating magnetic field Graphical representation
MULTI-SLICE FINITE ELEMENT MODELLING OF INDUCTION MOTORS CONSIDERING BROKEN BARS AND INTER-BAR CURRENTS
 MULTI-SLICE FINITE ELEMENT MODELLING OF INDUCTION MOTORS CONSIDERING BROKEN BARS AND INTER-BAR CURRENTS J. Gyselinck 1, J. Sprooten 1, L. Vandevelde 2 and X.M. López-Fernández 3 1 Department of Electrical
CHAPTER 5 SIMULATION AND TEST SETUP FOR FAULT ANALYSIS
 47 CHAPTER 5 SIMULATION AND TEST SETUP FOR FAULT ANALYSIS 5.1 INTRODUCTION This chapter describes the simulation model and experimental set up used for the fault analysis. For the simulation set up, the
Revision Guide for Chapter 15
 Revision Guide for Chapter 15 Contents tudent s Checklist Revision otes Transformer... 4 Electromagnetic induction... 4 Generator... 5 Electric motor... 6 Magnetic field... 8 Magnetic flux... 9 Force on
Massachusetts Institute of Technology Department of Electrical Engineering and Computer Science Electric Machines
 Massachusetts Institute of Technology Department of Electrical Engineering and Computer Science 6.685 Electric Machines Problem Set 10 Issued November 11, 2013 Due November 20, 2013 Problem 1: Permanent
How an Induction Motor Works by Equations (and Physics)
") How an Induction Motor Works by Equations (and Physics) The magnetic field in the air gap from the voltage applied to the stator: The stator has three sets of windings that are aligned at 10 degrees to
How an Induction Motor Works by Equations (and Physics) The magnetic field in the air gap from the voltage applied to the stator: The stator has three sets of windings that are aligned at 10 degrees to
Revision Guide for Chapter 15
 Revision Guide for Chapter 15 Contents Revision Checklist Revision otes Transformer...4 Electromagnetic induction...4 Lenz's law...5 Generator...6 Electric motor...7 Magnetic field...9 Magnetic flux...
Modelling and Simulating a Three-Phase Induction Motor
 MURDOCH UNIVERSITY SCHOOL OF ENGINEERING AND INFORMATION TECHNOLOGY Modelling and Simulating a Three-Phase Induction Motor ENG460 Engineering Thesis Benjamin Willoughby 3/3/2014 Executive Summary This
Noise and Vibration of Electrical Machines
 Noise and Vibration of Electrical Machines P. L. TIMÄR A. FAZEKAS J. KISS A. MIKLOS S. J. YANG Edited by P. L. Timär ш Akademiai Kiadö, Budapest 1989 CONTENTS Foreword xiii List of symbols xiv Introduction
DESIGN OF ELECTRICAL APPARATUS SOLVED PROBLEMS
 DESIGN OF ELECTRICAL APPARATUS SOLVED PROBLEMS 1. A 350 KW, 500V, 450rpm, 6-pole, dc generator is built with an armature diameter of 0.87m and core length of 0.32m. The lap wound armature has 660 conductors.
Power density improvement of three phase flux reversal machine with distributed winding
 Published in IET Electric Power Applications Received on 4th January 2009 Revised on 2nd April 2009 ISSN 1751-8660 Power density improvement of three phase flux reversal machine with distributed winding
Synchronous Machines
 Synchronous Machines Synchronous generators or alternators are used to convert mechanical power derived from steam, gas, or hydraulic-turbine to ac electric power Synchronous generators are the primary
STAR-CCM+ and SPEED for electric machine cooling analysis
 STAR-CCM+ and SPEED for electric machine cooling analysis Dr. Markus Anders, Dr. Stefan Holst, CD-adapco Abstract: This paper shows how two well established software programs can be used to determine the
An Introduction to Electrical Machines. P. Di Barba, University of Pavia, Italy
 An Introduction to Electrical Machines P. Di Barba, University of Pavia, Italy Academic year 0-0 Contents Transformer. An overview of the device. Principle of operation of a single-phase transformer 3.
JRE SCHOOL OF Engineering
 JRE SCHOOL OF Engineering Class Test-1 Examinations September 2014 Subject Name Electromechanical Energy Conversion-II Subject Code EEE -501 Roll No. of Student Max Marks 30 Marks Max Duration 1 hour Date
University of Jordan Faculty of Engineering & Technology Electric Power Engineering Department
 University of Jordan Faculty of Engineering & Technology Electric Power Engineering Department EE471: Electrical Machines-II Tutorial # 2: 3-ph Induction Motor/Generator Question #1 A 100 hp, 60-Hz, three-phase
Generators for wind power conversion
 Generators for wind power conversion B. G. Fernandes Department of Electrical Engineering Indian Institute of Technology, Bombay Email : bgf@ee.iitb.ac.in Outline of The Talk Introduction Constant speed
Doubly salient reluctance machine or, as it is also called, switched reluctance machine. [Pyrhönen et al 2008]
![Doubly salient reluctance machine or, as it is also called, switched reluctance machine. [Pyrhönen et al 2008]](/thumbs/86/93665357.jpg "Doubly salient reluctance machine or, as it is also called, switched reluctance machine. [Pyrhönen et al 2008]") Doubly salient reluctance machine or, as it is also called, switched reluctance machine [Pyrhönen et al 2008] Pros and contras of a switched reluctance machine Advantages Simple robust rotor with a small
Doubly salient reluctance machine or, as it is also called, switched reluctance machine [Pyrhönen et al 2008] Pros and contras of a switched reluctance machine Advantages Simple robust rotor with a small
Study and Characterization of the Limiting Thermal Phenomena in Low-Speed Permanent Magnet Synchronous Generators for Wind Energy
 1 Study and Characterization of the Limiting Thermal Phenomena in Low-Speed Permanent Magnet Synchronous Generators for Wind Energy Mariana Cavique, Student, DEEC/AC Energia, João F.P. Fernandes, LAETA/IDMEC,
Finite Element Analysis of Hybrid Excitation Axial Flux Machine for Electric Cars
 223 Finite Element Analysis of Hybrid Excitation Axial Flux Machine for Electric Cars Pelizari, A. ademir.pelizari@usp.br- University of Sao Paulo Chabu, I.E. ichabu@pea.usp.br - University of Sao Paulo
MODEL AND LABORATORY SIMULATION OF A INDUCTION MOTOR FOR DIAGNOSTIC PURPOSES
 Metrol. Meas. yst. Vol. XVI (29), No 4, pp. 67-618 METROLOGY AND MEAUREMENT YTEM Index 3393, IN 86-8229 www.metrology.pg.gda.pl MODEL AND LABORATORY IMULATION OF A INDUCTION MOTOR FOR DIAGNOTIC PURPOE
Introduction. Energy is needed in different forms: Light bulbs and heaters need electrical energy Fans and rolling miles need mechanical energy
 Introduction Energy is needed in different forms: Light bulbs and heaters need electrical energy Fans and rolling miles need mechanical energy What does AC and DC stand for? Electrical machines Motors
ANALYTICAL COMPUTATION OF RELUCTANCE SYN- CHRONOUS MACHINE INDUCTANCES UNDER DIF- FERENT ECCENTRICITY FAULTS
 Progress In Electromagnetics Research M, Vol. 24, 29 44, 2012 ANALYTICAL COMPUTATION OF RELUCTANCE SYN- CHRONOUS MACHINE INDUCTANCES UNDER DIF- FERENT ECCENTRICITY FAULTS H. Akbari * Department of Electrical
The initial magnetization curve shows the magnetic flux density that would result when an increasing magnetic field is applied to an initially
 MAGNETIC CIRCUITS The study of magnetic circuits is important in the study of energy systems since the operation of key components such as transformers and rotating machines (DC machines, induction machines,
INDUCTION MOTOR MODEL AND PARAMETERS
 APPENDIX C INDUCTION MOTOR MODEL AND PARAMETERS C.1 Dynamic Model of the Induction Motor in Stationary Reference Frame A three phase induction machine can be represented by an equivalent two phase machine
EDEXCEL NATIONAL CERTIFICATE/DIPLOMA UNIT 5 - ELECTRICAL AND ELECTRONIC PRINCIPLES NQF LEVEL 3. OUTCOME 3 - MAGNETISM and INDUCTION
 EDEXCEL NATIONAL CERTIFICATE/DIPLOMA UNIT 5 - ELECTRICAL AND ELECTRONIC PRINCIPLES NQF LEVEL 3 OUTCOME 3 - MAGNETISM and INDUCTION 3 Understand the principles and properties of magnetism Magnetic field:
3 d Calculate the product of the motor constant and the pole flux KΦ in this operating point. 2 e Calculate the torque.
 Exam Electrical Machines and Drives (ET4117) 11 November 011 from 14.00 to 17.00. This exam consists of 5 problems on 4 pages. Page 5 can be used to answer problem 4 question b. The number before a question
ELECTRIC MACHINE TORQUE PRODUCTION 101
 ELECTRIC MACHINE TORQUE PRODUCTION 101 Best Electric Machine, 014 INTRODUCTION: The following discussion will show that the symmetrical (or true dual-ported) transformer electric machine as only provided
Analytical and numerical computation of the no-load magnetic field in induction motors
 Analytical and numerical computation of the no-load induction motors Dan M. Ionel University of Glasgow, Glasgow, Scotland, UK and Mihai V. Cistelecan Research Institute for Electrical Machines, Bucharest
Design of Synchronous Machines
 Design of Synchronous Machines Introduction Synchronous machines are AC machines that have a field circuit supplied by an external DC source. Synchronous machines are having two major parts namely stationary
Measurements of a 37 kw induction motor. Rated values Voltage 400 V Current 72 A Frequency 50 Hz Power 37 kw Connection Star
 Measurements of a 37 kw induction motor Rated values Voltage 4 V Current 72 A Frequency 5 Hz Power 37 kw Connection Star Losses of a loaded machine Voltage, current and power P = P -w T loss in Torque
Keywords: Electric Machines, Rotating Machinery, Stator faults, Fault tolerant control, Field Weakening, Anisotropy, Dual rotor, 3D modeling
 Analysis of Electromagnetic Behavior of Permanent Magnetized Electrical Machines in Fault Modes M. U. Hassan 1, R. Nilssen 1, A. Røkke 2 1. Department of Electrical Power Engineering, Norwegian University
Design Optimization of Electric Motor Frame and Its Study for Thermal, Dynamic and Modal Stability
 Design Optimization of Electric Motor Frame and Its Study for Thermal, Dynamic and Modal Stability Pavankumar V Kulkarni 1, Dr. S. R. Basavaraddi 2 1Dept. of Mechanical Engineering, KLE Dr. M. S. S. College
CHAPTER 8 DC MACHINERY FUNDAMENTALS
 CHAPTER 8 DC MACHINERY FUNDAMENTALS Summary: 1. A Simple Rotating Loop between Curved Pole Faces - The Voltage Induced in a Rotating Loop - Getting DC voltage out of the Rotating Loop - The Induced Torque
CHAPTER 4 DESIGN OF GRID CONNECTED INDUCTION GENERATORS FOR CONSTANT SPEED WIND POWER GENERATION
 CHAPTER 4 DESIGN OF GRID CONNECTED INDUCTION GENERATORS FOR CONSTANT SPEED WIND POWER GENERATION 4.1 Introduction For constant shaft speed grid-connected wind energy conversion systems, the squirrel cage
Electrical Machines and Energy Systems: Operating Principles (Part 1) SYED A Rizvi
 SYED A Rizvi") Electrical Machines and Energy Systems: Operating Principles (Part 1) SYED A Rizvi AC Machines Operating Principles: Rotating Magnetic Field The key to the functioning of AC machines is the rotating magnetic
Electrical Machines and Energy Systems: Operating Principles (Part 1) SYED A Rizvi AC Machines Operating Principles: Rotating Magnetic Field The key to the functioning of AC machines is the rotating magnetic
Synchronous Machines
 Synchronous machine 1. Construction Generator Exciter View of a twopole round rotor generator and exciter. A Stator with laminated iron core C Slots with phase winding B A B Rotor with dc winding B N S
AN EFFICIENT APPROACH FOR ANALYSIS OF ISOLATED SELF EXCITED INDUCTION GENERATOR
 AN EFFICIENT APPROACH FOR ANALYSIS OF ISOLATED SELF EXCITED INDUCTION GENERATOR Deepika 1, Pankaj Mehara Assistant Professor, Dept. of EE, DCRUST, Murthal, India 1 PG Student, Dept. of EE, DCRUST, Murthal,
UJET VOL. 2, NO. 2, DEC Page 8
 UMUDIKE JOURNAL OF ENGINEERING AND TECHNOLOGY (UJET) VOL. 2, NO. 2, DEC 2016 PAGE 8-15 FINITE ELEMENT ANALYSIS OF A 7.5KW ASYNCHRONOUS MOTOR UNDER INTERMITTENT LOADING. Abunike, E. C. and Okoro, O. I.
ANALYSIS OF INDUCTION MOTOR WITH BROKEN BARS AND CONSTANT SPEED USING CIRCUIT-FIELD COUPLED METHOD
 Journal of Fundamental and Applied Sciences ISSN 1112-9867 Available online at http://www.jfas.info ANALYSIS OF INDUCTION MOTOR WITH BROKEN BARS AND CONSTANT SPEED USING CIRCUIT-FIELD COUPLED METHOD N.
Analysis of Idle Power and Iron Loss Reduction in an Interior PM Automotive Alternator
 Analysis of Idle Power and Iron Loss Reduction in an Interior PM Automotive Alternator by Vlatka Životić-Kukolj M.Eng.Sci. (Research) Electrical and Electronic Engineering, Adelaide University, 2001 B.Eng
DESIGN AND ANALYSIS OF AXIAL-FLUX CORELESS PERMANENT MAGNET DISK GENERATOR
 DESIGN AND ANALYSIS OF AXIAL-FLUX CORELESS PERMANENT MAGNET DISK GENERATOR Łukasz DR ZIKOWSKI Włodzimierz KOCZARA Institute of Control and Industrial Electronics Warsaw University of Technology, Warsaw,
Control of Wind Turbine Generators. James Cale Guest Lecturer EE 566, Fall Semester 2014 Colorado State University
 Control of Wind Turbine Generators James Cale Guest Lecturer EE 566, Fall Semester 2014 Colorado State University Review from Day 1 Review Last time, we started with basic concepts from physics such as
Title use of Bi-2223/Ag squirrel-cage rot IEEE TRANSACTIONS ON APPLIED SUPERCONDUCTIVITY (2006), 16(2): 14.
, 16(2): 14.") Title Fabrication and characteristics of use of Bi-2223/Ag squirrel-cage rot Author(s) Nakamura, T; Miyake, H; Ogama, Y; M Hoshino, T Citation IEEE TRANSACTIONS ON APPLIED SUPERCONDUCTIVITY (2006), 16(2):
Title Fabrication and characteristics of use of Bi-2223/Ag squirrel-cage rot Author(s) Nakamura, T; Miyake, H; Ogama, Y; M Hoshino, T Citation IEEE TRANSACTIONS ON APPLIED SUPERCONDUCTIVITY (2006), 16(2):
IEEE Transactions on Applied Superconductivity. Copyright IEEE.
 Title Loss analysis of permanent magnet hybrid brushless machines with and without HTS field windings Author(s) Liu, C; Chau, KT; Li, W Citation The 21st International Conference on Magnet Technology,
The synchronous machine (detailed model)
") ELEC0029 - Electric Power System Analysis The synchronous machine (detailed model) Thierry Van Cutsem t.vancutsem@ulg.ac.be www.montefiore.ulg.ac.be/~vct February 2018 1 / 6 Objectives The synchronous
ELEC0029 - Electric Power System Analysis The synchronous machine (detailed model) Thierry Van Cutsem t.vancutsem@ulg.ac.be www.montefiore.ulg.ac.be/~vct February 2018 1 / 6 Objectives The synchronous
AXIAL FLUX INTERIOR PERMANENT MAGNET SYNCHRONOUS MOTOR WITH SINUSOIDALLY SHAPED MAGNETS
 AXIAL FLUX INTERIOR PERMANENT MAGNET SYNCHRONOUS MOTOR WITH SINUSOIDALLY SHAPED MAGNETS A. Parviainen, J. Pyrhönen, M. Niemelä Lappeenranta University of Technology, Department of Electrical Engineering
COPPER FOR BUSBARS CHAPTER 4: SHORT-CIRCUIT EFFECTS
 European Copper Institute COPPER FOR BUSBARS CHAPTER 4: SHORT-CIRCUIT EFFECTS David Chapman August 2011 ECI Available from www.leonardo-energy.org Document Issue Control Sheet Document Title: Publication
TRANSIENT ANALYSIS OF SELF-EXCITED INDUCTION GENERATOR UNDER BALANCED AND UNBALANCED OPERATING CONDITIONS
 TRANSIENT ANALYSIS OF SELF-EXCITED INDUCTION GENERATOR UNDER BALANCED AND UNBALANCED OPERATING CONDITIONS G. HARI BABU Assistant Professor Department of EEE Gitam(Deemed to be University), Visakhapatnam
MAHARASHTRA STATE BOARD OF TECHNICAL EDUCATION
 Important Instructions to examiners: 1) The answers should be examined by key words and not as word-to-word as given in the model answer scheme. 2) The model answer and the answer written by candidate
Transformer Fundamentals
 Transformer Fundamentals 1 Introduction The physical basis of the transformer is mutual induction between two circuits linked by a common magnetic field. Transformer is required to pass electrical energy
Accurate Joule Loss Estimation for Rotating Machines: An Engineering Approach
 Accurate Joule Loss Estimation for Rotating Machines: An Engineering Approach Adeeb Ahmed Department of Electrical and Computer Engineering North Carolina State University Raleigh, NC, USA aahmed4@ncsu.edu
Eddy Current Heating in Large Salient Pole Generators
 Eddy Current Heating in Large Salient Pole Generators C.P.Riley and A.M. Michaelides Vector Fields Ltd., 24 Bankside, Kidlington, Oxford OX5 1JE, UK phone: (+44) 1865 370151, fax: (+44) 1865 370277 e-mail:
ECEN 667 Power System Stability Lecture 18: Voltage Stability, Load Models
 ECEN 667 Power System Stability Lecture 18: Voltage Stability, Load Models Prof. Tom Overbye Dept. of Electrical and Computer Engineering Texas A&M University, overbye@tamu.edu 1 Announcements Read Chapter
Analytical Model for Sizing the Magnets of Permanent Magnet Synchronous Machines
 Journal of Electrical Engineering 3 (2015) 134-141 doi: 10.17265/2328-2223/2015.03.004 D DAVID PUBLISHING Analytical Model for Sizing Magnets of Permanent Magnet Synchronous Machines George Todorov and
The Nottingham eprints service makes this work by researchers of the University of Nottingham available open access under the following conditions.
 Arumugam, Puvaneswaran and Dusek, Jiri and Mezani, Smail and Hamiti, Tahar and Gerada, C. (2015) Modeling and analysis of eddy current losses in permanent magnet machines with multi-stranded bundle conductors.
The Nottingham eprints service makes this work by researchers of the University of Nottingham available open access under the following conditions.
 Mezani, Smail and Hamiti, Tahar and Belguerras, Lamia and Lubin, Thierry and Gerada, Christopher (215) Computation of wound rotor induction machines based on coupled finite elements and circuit equation
ELECTRICALMACHINES-I QUESTUION BANK
 ELECTRICALMACHINES-I QUESTUION BANK UNIT-I INTRODUCTION OF MAGNETIC MATERIAL PART A 1. What are the three basic rotating Electric machines? 2. Name the three materials used in machine manufacture. 3. What
Texas A & M University Department of Mechanical Engineering MEEN 364 Dynamic Systems and Controls Dr. Alexander G. Parlos
 Texas A & M University Department of Mechanical Engineering MEEN 364 Dynamic Systems and Controls Dr. Alexander G. Parlos Lecture 6: Modeling of Electromechanical Systems Principles of Motor Operation
Chapter 4. Synchronous Generators. Basic Topology
 Basic Topology Chapter 4 ynchronous Generators In stator, a three-phase winding similar to the one described in chapter 4. ince the main voltage is induced in this winding, it is also called armature winding.
ELECTRICITY AND MAGNETISM, A. C. THEORY AND ELECTRONICS, ATOMIC AND NUCLEAR PHYSICS
 UNIT 2: ELECTRICITY AND MAGNETISM, A. C. THEORY AND ELECTRONICS, ATOMIC AND NUCLEAR PHYSICS MODULE 1: ELECTRICITY AND MAGNETISM GENERAL OBJECTIVES On completion of this Module, students should: 1. understand
Tutorial 1 (EMD) Rotary field winding
 Rotary field winding") Tutorial 1 (EMD) Rotary field winding The unchorded two-layer three-phase winding of a small synchronous fan drive for a computer has the following parameters: number of slots per pole and phase q = 1,
Tutorial 1 (EMD) Rotary field winding The unchorded two-layer three-phase winding of a small synchronous fan drive for a computer has the following parameters: number of slots per pole and phase q = 1,
TRACING OF MAXIMUM POWER DENSITY POINT FOR AXIAL FLUX TORUS TYPE MACHINES USING GENERAL PURPOSE SIZING EQUATIONS
 TRACING OF MAXIMUM POWER DENSITY POINT FOR AXIAL FLUX TORUS TYPE MACHINES USING GENERAL PURPOSE SIZING EQUATIONS M. Ramanjaneyulu Chowdary Dr.G.S Raju Mr.V.Rameshbabu M.Tech power electronics Former BHU
EE 410/510: Electromechanical Systems Chapter 4
 EE 410/510: Electromechanical Systems Chapter 4 Chapter 4. Direct Current Electric Machines and Motion Devices Permanent Magnet DC Electric Machines Radial Topology Simulation and Experimental Studies
Analytical Calculation of Air Gap Magnetic Field Distribution in Vernier Motor
 IEEE PEDS 017, Honolulu, USA 1-15 June 015 Analytical Calculation of Air Gap Magnetic Field Distribution in Vernier Motor Hyoseok Shi, Noboru Niguchi, and Katsuhiro Hirata Department of Adaptive Machine
Loss analysis of a 1 MW class HTS synchronous motor
 Journal of Physics: Conference Series Loss analysis of a 1 MW class HTS synchronous motor To cite this article: S K Baik et al 2009 J. Phys.: Conf. Ser. 153 012003 View the article online for updates and
Experimental Assessment of Unbalanced Magnetic Force according to Rotor Eccentricity in Permanent Magnet Machine
 Journal of Magnetics 23(1), 68-73 (218) ISSN (Print) 1226-175 ISSN (Online) 2233-6656 https://doi.org/1.4283/jmag.218.23.1.68 Experimental Assessment of Unbalanced Magnetic Force according to Rotor Eccentricity
Dynamic Modelling of Induction Motor Squirrel Cage for Different Shapes of Rotor Deep Bars with Estimation of the Skin Effect
 Progress In Electromagnetics Research M, Vol 59, 147 160, 2017 Dynamic Modelling of Induction Motor Squirrel Cage for Different Shapes of Rotor Deep Bars with Estimation of the Skin Effect Zakari Maddi
NEW SOUTH WALES DEPARTMENT OF EDUCATION AND TRAINING Manufacturing and Engineering ESD. Sample Examination EA605
 Name: NEW SOUTH WALES DEPARTMENT OF EDUCATION AND TRAINING Manufacturing and Engineering ESD Sample Examination EA605 EDDY CURRENT TESTING AS3998 LEVEL 2 GENERAL EXAMINATION 6161C * * * * * * * Time allowed
The University of Southern Queensland
 New Design Methodologies for Printed Circuit Axial Field Brushless DC Motors by Daniele Marco Gambetta, MPhil, B.Sc (Hons) Dissertation Submitted in Fulfillment of the Requirements for the Degree of Doctor
Reluctance Synchronous Machine with a Particular Cageless Segmental Rotor
 Reluctance Synchronous Machine with a Particular Cageless Segmental Rotor I.A. Viorel 1, I. Husain 2, Ioana Chişu 1, H.C. Hedeşiu 1, G. Madescu 3 and L. Szabó 1 1 Dept. of Electrical Machines, Technical
UNIT-I INTRODUCTION. 1. State the principle of electromechanical energy conversion.
 UNIT-I INTRODUCTION 1. State the principle of electromechanical energy conversion. The mechanical energy is converted in to electrical energy which takes place through either by magnetic field or electric
Lesson 17: Synchronous Machines
 Lesson 17: Synchronous Machines ET 332b Ac Motors, Generators and Power Systems Lesson 17_et332b.pptx 1 Learning Objectives After this presentation you will be able to: Explain how synchronous machines
Flux: Examples of Devices
 Flux: Examples of Devices xxx Philippe Wendling philippe.wendling@magsoft-flux.com Create, Design, Engineer! www.magsoft-flux.com www.cedrat.com Solenoid 2 1 The Domain Axisymmetry Open Boundary 3 Mesh
Optimization of 20kVA, 3-Phase Induction Motor using Genetic Algorithm
 2017 IJSRSET Volume 3 Issue 1 Print ISSN: 2395-1990 Online ISSN : 2394-4099 Themed Section: Engineering and Technology Optimization of 20kVA, 3-Phase Induction Motor using Genetic Algorithm Abdulraheem
Optimisation of Inner Diameter to Outer Diameter Ratio of Axial Flux Permanent Magnet Generator
 IOSR Journal of Electrical and Electronics Engineering (IOSR-JEEE) e-issn: 2278-1676,p-ISSN: 220-1, Volume 9, Issue 6 Ver. III (Nov Dec. 2014), PP 4-47 Optimisation of Inner Diameter to Outer Diameter
EFFECTS OF LOAD AND SPEED VARIATIONS IN A MODIFIED CLOSED LOOP V/F INDUCTION MOTOR DRIVE
 Nigerian Journal of Technology (NIJOTECH) Vol. 31, No. 3, November, 2012, pp. 365 369. Copyright 2012 Faculty of Engineering, University of Nigeria. ISSN 1115-8443 EFFECTS OF LOAD AND SPEED VARIATIONS
Tutorial Sheet Fig. Q1
 Tutorial Sheet - 04 1. The magnetic circuit shown in Fig. Q1 has dimensions A c = A g = 9 cm 2, g = 0.050 cm, l c = 30 cm, and N = 500 turns. Assume the value of the relative permeability,µ r = 70,000
Development and analysis of radial force waves in electrical rotating machines
 DOI: 10.24352/UB.OVGU-2017-098 TECHNISCHE MECHANIK, 37, 2-5, (2017), 218 225 submitted: June 20, 2017 Development and analysis of radial force waves in electrical rotating machines S. Haas, K. Ellermann
Mathematical MATLAB Model and Performance Analysis of Asynchronous Machine
 Mathematical MATLAB Model and Performance Analysis of Asynchronous Machine Bikram Dutta 1, Suman Ghosh 2 Assistant Professor, Dept. of EE, Guru Nanak Institute of Technology, Kolkata, West Bengal, India
MODELING AND HIGH-PERFORMANCE CONTROL OF ELECTRIC MACHINES
 MODELING AND HIGH-PERFORMANCE CONTROL OF ELECTRIC MACHINES JOHN CHIASSON IEEE PRESS ü t SERIES ON POWER ENGINEERING IEEE Press Series on Power Engineering Mohamed E. El-Hawary, Series Editor The Institute
Basic Electrical Engineering SYLLABUS. Total No. of Lecture Hrs. : 50 Exam Marks : 80
 SYLLABUS Subject Code: /25 No. of Lecture Hrs./ Week : 04 IA Marks : 20 Exam Hours : 03 Total No. of Lecture Hrs. : 50 Exam Marks : 80 Course objectives: Impart a basic knowledge of electrical quantities
Proceedings of the 6th WSEAS/IASME Int. Conf. on Electric Power Systems, High Voltages, Electric Machines, Tenerife, Spain, December 16-18,
 Proceedings of the 6th WSEAS/IASME Int. Conf. on Electric Power Systems, High Voltages, Electric Machines, Tenerife, Spain, December 16-18, 2006 196 A Method for the Modeling and Analysis of Permanent
Equivalent Circuits with Multiple Damper Windings (e.g. Round rotor Machines)
") Equivalent Circuits with Multiple Damper Windings (e.g. Round rotor Machines) d axis: L fd L F - M R fd F L 1d L D - M R 1d D R fd R F e fd e F R 1d R D Subscript Notations: ( ) fd ~ field winding quantities
Equivalent Circuits with Multiple Damper Windings (e.g. Round rotor Machines) d axis: L fd L F - M R fd F L 1d L D - M R 1d D R fd R F e fd e F R 1d R D Subscript Notations: ( ) fd ~ field winding quantities
ELECTROMAGNETIC OSCILLATIONS AND ALTERNATING CURRENT
 Chapter 31: ELECTROMAGNETIC OSCILLATIONS AND ALTERNATING CURRENT 1 A charged capacitor and an inductor are connected in series At time t = 0 the current is zero, but the capacitor is charged If T is the
Development of axial flux HTS induction motors
 Available online at www.sciencedirect.com Procedia Engineering 35 (01 ) 4 13 International Meeting of Electrical Engineering Research ENIINVIE-01 Development of axial flux HTS induction motors A. González-Parada
International Journal of Scientific & Engineering Research, Volume 5, Issue 4, April-2014 ISSN
 International Journal of Scientific & Engineering Research, Volume 5, Issue 4, April-2014 84 Electromagnetic and Thermal Analysis Of An Synchronous generator Olivia Ramya Chitranjan, V.Gowrisree Abstract
Analytical Solution of Magnetic Field in Permanent-Magnet Eddy-Current Couplings by Considering the Effects of Slots and Iron-Core Protrusions
 Journal of Magnetics 20(3), 273-283 (2015) ISSN (Print) 1226-1750 ISSN (Online) 2233-6656 http://dx.doi.org/10.4283/jmag.2015.20.3.273 Analytical Solution of Magnetic Field in Permanent-Magnet Eddy-Current
Induction Machine Stray Loss from Inter-bar Currents. Steven C. Englebretson
 Induction Machine Stray Loss from Inter-bar Currents by Steven C. Englebretson Submitted to the Department of Electrical Engineering and Computer Science in partial fulfillment of the requirements for
Loss Minimization Design Using Magnetic Equivalent Circuit for a Permanent Magnet Synchronous Motor
 Loss Minimization Design Using Magnetic Equivalent Circuit for a Permanent Magnet Synchronous Motor Daisuke Sato Department of Electrical Engineering Nagaoka University of Technology Nagaoka, Niigata,
Applications of Non-Contact Magnetising on Ring Shaped Components
 A Paper By George Downes Telephone +44 (0)1981 541122 Fax +44 (0)1981 541133 Email Sales@InsightNDT.com Web Site www.insightndt.com Insight NDT Equipment Ltd The Old Cider Mill Kings Thorn Herefordshire
Basic parts of an AC motor : rotor, stator, The stator and the rotor are electrical
 INDUCTION MOTO 1 CONSTUCTION Baic part of an AC motor : rotor, tator, encloure The tator and the rotor are electrical circuit that perform a electromagnet. CONSTUCTION (tator) The tator - tationary part