Distributed analysis in multi-center studies
|
|
|
- Mercy Bond
- 5 years ago
- Views:
Transcription
1 Distributed analysis in multi-center studies Sharing of individual-level data across health plans or healthcare delivery systems continues to be challenging due to concerns about loss of patient privacy, unauthorized uses of transferred data, inaccurate analysis or interpretation of data, or contractual or legal restrictions. Although these challenges can be addressed in part by proper governance and appropriate updates to existing regulations, newer privacy-protecting analytic and data-sharing methods offer another potential solution. This presentation will describe the use of privacy-protecting analytic methods that allow robust and flexible statistical analysis using aggregate-level information, without centralized pooling of individual-level datasets across data sources. We will present several comparative safety and effectiveness studies of medical treatments that employ these methods to generate actionable real-world evidence. 1. Toh S, Gagne JJ, Rassen JA, Fireman BH, Kulldorff M, Brown JS. Confounding adjustment in comparative effectiveness research conducted within distributed research networks. Med Care 2013:51(8 Suppl 3):S4-S10 2. Toh S, Hampp C, Reichman ME, Graham DJ, Balakrishnan S, Pucino F, Hamilton J, Lendle S, Iyer A, Rucker M, Pimentel M, Nathwani N, Griffin MR, Brown NJ, Fireman BH. Risk of hospitalized heart failure among new users of saxagliptin, sitagliptin, and other antihyperglycemic drugs: A retrospective cohort study. Ann Intern Med 2016;164(11): (PMC ) 3. Toh S, Reichman ME, Graham DJ, Hampp C, Zhang R, Butler MG, Iyer A, Rucker M, Pimentel M, Hamilton J, Lendle S, Fireman BH; for the Mini-Sentinel AMI-Saxagliptin Surveillance Writing Group. Prospective post-marketing surveillance of acute myocardial infarction in new users of saxagliptin: A population-based study. Diabetes Care 2018;41(1):39-48

2 Distributed analysis in multi center studies Darren Toh, ScD Department of Population Medicine Harvard Medical School & Harvard Pilgrim Health Care Institute Boston, MA November 18, 2018
3 Disclosures Research support Patient Centered Outcomes Research Institute (ME ) Office of the Assistant Secretary for Planning and Evaluation & Food and Drug Administration (HHSF I) National Institutes of Health (U01EB023683) Agency for Healthcare Research and Quality (R01HS026214) Board of Directors, International Society for Pharmacoepidemiology My spouse is an employee of Biogen 2
4 Overview Evolution of multi center studies Analytic methods in multi center studies Select examples Discussion 3
5 Overview Evolution of multi center studies Analytic methods in multi center studies Select examples Discussion 4


6 Multi center studies Many studies are now done in multi center settings 5
7 Why do multi center studies? Larger sample sizes Allow studies of rare treatments or rare outcomes Allow studies in specific subpopulations Allow studies to be done more quickly More diverse populations Allow more generalizable findings Allow assessment of treatment effect heterogeneity 6
8 Multi center studies v1.0 Analysis center 7


9 Multi center studies v1.0 Pooling study specific individual level datasets 8
10 Typical datasets shared in multi center studies v1.0 PatID Exposure Outcome Time Age Sex DM HTN CVD
11 Typical datasets shared in multi center studies v1.0 PatID Exposure Outcome Time Age Sex DM HTN CVD Each row represents an individual
12 Typical datasets shared in multi center studies v1.0 PatID Exposure Outcome Time Age Sex DM HTN CVD Each column represents a covariate
13 Typical datasets shared in multi center studies v1.0 Data Partner 1 PatID Exposure Outcome Time Age Sex DM HTN CVD Data Partner 2 PatID Exposure Outcome Time Age Sex DM HTN CVD Site PatID Exposure Outcome Time Age Sex DM HTN CVD
14 Multi center studies v2.0 Individual data partners Data standardization (common data model) Data accessible to research projects Site 1 Site 2 Site 3 Site 4 Site 1 Site 2 Site 3 Site 4 Research projects Programs written against common data model Data quality improvement feedback loop Adapted from: eb86 400e 8c74 2d42ac57fa4F/VDW.Infographic jpg 13

15 Data standardization Common data model 14
16 Distributed analysis in networks with common data model 1 Analysis Center Secure Network Portal 1. User creates and submits query Review & Run Query Data Partner 1 Review & Return Results Enrollment Demographics Utilization Pharmacy Etc Review & Run Query Data Partner 2 Review & Return Results Enrollment Demographics Utilization Pharmacy Etc 15
17 Distributed analysis in networks with common data model 1 Analysis Center Secure Network Portal 1. User creates and submits query 2. Data partners retrieve query 2 Review & Run Query Data Partner 1 Enrollment Demographics Utilization Pharmacy Etc Review & Return Results Review & Run Query Data Partner 2 Review & Return Results Enrollment Demographics Utilization Pharmacy Etc 16
18 Distributed analysis in networks with common data model 1 Analysis Center Secure Network Portal 1. User creates and submits query 2. Data partners retrieve query Review & Run Query 2 3 Data Partner 1 Enrollment Demographics Utilization Pharmacy Etc Review & Return Results 4 3. Data partners review and run query against their local data 4. Data partners review results Review & Run Query Data Partner 2 Review & Return Results 3 Enrollment Demographics Utilization Pharmacy Etc 4 17
19 Distributed analysis in networks with common data model 1 Analysis Center 6 1. User creates and submits query Secure Network Portal 2. Data partners retrieve query Review & Run Query 2 3 Data Partner 1 Enrollment Demographics Utilization Pharmacy Etc Review & Return Results Data partners review and run query against their local data 4. Data partners review results Review & Run Query Data Partner 2 Review & Return Results 5. Data partners return results via secure network 3 Enrollment Demographics Utilization Pharmacy Etc 4 6. Results are aggregated and reported 18
20 Typical datasets shared in multi center studies v2.0 Data Partner 1 PatID Exposure Outcome Time Age Sex DM HTN CVD Data Partner 2 PatID Exposure Outcome Time Age Sex DM HTN CVD Site PatID Exposure Outcome Time Age Sex DM HTN CVD
21 Concerns about data sharing in multi center studies v1 & v2 Loss of patient privacy Unauthorized uses of data Inaccurate analysis or interpretation of data Disclosures of sensitive institutional or corporate information Contractual restrictions 20

22 Data sharing A balancing act Analytic flexibility Granularity or identifiability of information 21
23 Multi center studies v3.0 Analysis Center 22


24 Multi center studies v3.0 Pooling study specific summary level datasets 23
25 Overview Evolution of multi center studies Analytic methods in multi center studies Select examples Discussion 24
26 Privacy protecting methods for multi center studies v3.0 Summary score based methods Meta analysis of database specific effect estimates Distributed regression 25

27 Summary scores Confounders PS DRS Treatment Outcome PS: Propensity scores DRS: Disease risk scores 26
28 Individual level dataset with individual covariates PatID Exposure Outcome Time Age Sex DM HTN CVD
29 Individual level dataset with summary scores PatID Exposure Outcome Time PS
30 Summary score based method #1 Matching PatID Exposure Outcome Time PS Persons in exposed Persons in unexposed Events in exposed Events in unexposed
31 Summary score based method #1 Matching Data Partner 1 Persons in exposed Persons in unexposed Events in exposed Events in unexposed Data Partner 2 Site Persons in exposed Persons in unexposed Events in exposed Events in unexposed Persons in exposed Persons in unexposed Events in exposed Events in unexposed
32 Summary score based method #2 Stratification PatID Exposure Outcome Time PS PS or DRS stratum Persons in exposed Persons in unexposed Events in exposed Events in unexposed
33 Summary score based method #3 Risk set analysis PatID Exposure Outcome Time PS Event Event time Event exposed Risk set exposed Risk set unexposed
34 Meta analysis of database specific effect estimates PatID Exposure Outcome Time Age Sex DM HTN CVD Hazard ratio Lower 95% CI Upper 95% CI
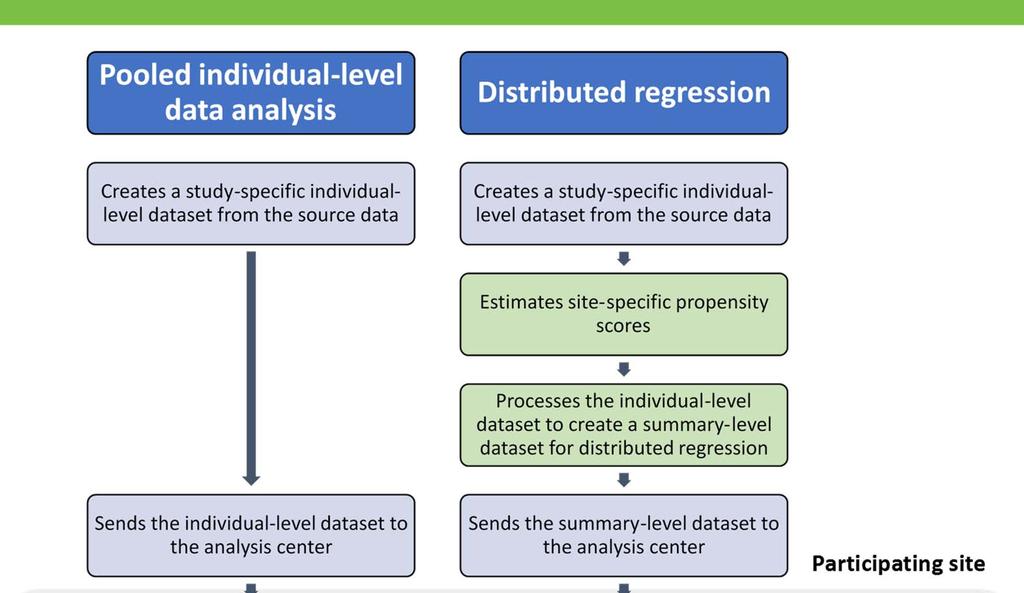
35 Distributed regression Type Name Intercept E X1 X2 Y ID E X1 X2 Y A A A A A A SSCP Intercept SSCP E SSCP X SSCP X SSCP Y MEAN STD N Variable Parameter estimate Standard error Intercept E X X Analyst inputs individual level dataset into statistical software Statistical software produces intermediate statistics as part of computing process Statistical software produces final results 34

36 Distributed regression Type Name Intercept E X1 X2 Y ID E X1 X2 Y A A A A A A SSCP Intercept SSCP E SSCP X SSCP X SSCP Y MEAN STD N Variable Parameter estimate Standard error Intercept E X X Regular regression shares this Analyst inputs individual level dataset into statistical software Statistical software produces intermediate statistics as part of computing process Statistical software produces final results 35
37 Distributed regression Type Name Intercept E X1 X2 Y ID E X1 X2 Y A A A A A A SSCP Intercept SSCP E SSCP X SSCP X SSCP Y MEAN Distributed regression shares this STD N Variable Parameter estimate Standard error Intercept E X X Analyst inputs individual level dataset into statistical software Statistical software produces intermediate statistics as part of computing process Statistical software produces final results 36
38 Overview Evolution of multi center studies Analytic methods in multi center studies Select examples Discussion 37


39 Example 1 stroenterology/laparoscopic_adjustable_gastric_banding_135,63/ erology/roux en y_gastric_bypass_weight loss_surgery_135,65/ 38
40 Study design 1/1/2005 Start of follow up (discharge date) 12/31/ days Time 21 years at time of bariatric surgery 1 BMI of 35kg/m 2 or greater Continuous enrollment w/ benefits No prior bariatric surgery No prior diagnosis of study outcome Re hospitalization Death Health plan disenrollment 12/31/ days of follow up Index bariatric hospitalization Contributing person times Toh et al, Med Care, 2014;52:
41 Confounders Age Sex Race/ethnicity Diabetes* Baseline BMI* Year of procedure Charlson comorbidity score* Atrial fibrillation* GERD* Hypertension* Sleep Apnea* Asthma* Deep vein thrombosis* Pulmonary embolism* Congestive heart failure* Hyperlipidemia* Coronary artery disease* Oxygen use* Assistive walking device* Smoking status* Blood pressure* Length of stay assoc. with procedure *Identified during the 365 day baseline period prior to the index bariatric hospitalization Toh et al, Med Care, 2014;52:
42 Statistical analysis Propensity score stratification Analysis Pooled patient level data analysis (benchmark) Risk set based analysis PS stratified analysis (by quintile) Meta analysis of site specific effect estimates Toh et al, Med Care, 2014;52:
43 Select baseline patient characteristics Characteristics Adjustable gastric band (n=1,550) Roux en y gastric bypass (n=5,792) N %* N %* Mean age (SD) Age > 65 years Female sex 1, , Race/ethnicity Black or African American White 1, , Hispanic Other Unknown Baseline BMI , , , Toh et al, Med Care, 2014;52:
44 Individual level data analysis, by site Site Adjusted HR 95% CI Site , 1.02 Site , 1.15 Site , 1.04 Site , 1.50 Site , 1.48 Site , 0.75 Site , 1.01 Toh et al, Med Care, 2014;52:

45 Results, by method Method Adjusted HR 95% CI Individual level , 0.84 Risk set , 0.84 PS stratification , 0.83 Meta analysis , 0.84 Toh et al, Med Care, 2014;52:
46 Example 2 Distributed regression Distributed Regression vs. Pooled Patient Level Regression LINEAR Covariates Distributed Regression Pooled Patient Level Differences in Differences in Parameter Estimates Standard Errors Parameter Estimates Standard Errors Parameter Estimates Standard Errors Intercept E E 14 Variable E E 16 Variable E E 15 Variable E E 15 Distributed Regression vs. Pooled Patient Level Regression LOGISTIC Covariates Distributed Regression Pooled Patient Level Differences in Differences in Parameter Estimates Standard Errors Parameter Estimates Standard Errors Parameter Estimates Standard Errors Intercept E E 16 Variable E E 14 Variable E E 16 Variable E E 16 Distributed Regression vs. Pooled Patient Level Regression COX Covariates Distributed Regression Pooled Patient Level Differences in Differences in Parameter Estimates Standard Errors Parameter Estimates Standard Errors Parameter Estimates Standard Errors Variable E E 17 Variable E E 17 Variable E E 17 45

47 Example 3 PCORnet Bariatric Study Use of bariatric surgery has expanded considerably Evidence on the comparative effectiveness and safety of these procedures is limited 46
48 Study design Comparisons Main analysis RYGB vs. SG RYGB vs. AGB AGB vs. SG Aggregate analysis RYGB vs. SG Outcomes Weight change 1, 3, and 5 yrs postsurgery Diabetes remission and relapse Major adverse events Weight change 1 yr post surgery Analysis One model that combines all data Additional data driven approaches to select covariates Site specific PS model Fixed set of covariates 47
49 48
50 49
51 Combining propensity scores with distributed regression Parameter estimate Standard error Variable Pooled individuallevel data analysis Pooled individuallevel data analysis RYGB vs. SG PS stratum 1 Reference Reference PS stratum PS stratum PS stratum PS stratum PS stratum PS stratum PS stratum PS stratum PS stratum
52 Combining propensity scores with distributed regression Parameter estimate Standard error Variable Pooled individuallevel data analysis Distributed regression Pooled individuallevel data analysis Distributed regression RYGB vs. SG PS stratum 1 Reference Reference Reference Reference PS stratum PS stratum PS stratum PS stratum PS stratum PS stratum PS stratum PS stratum PS stratum
53 Example 4: Prospective surveillance of saxagliptin Sentinel_AMI and Anti Diabetic Agents_Protocol_0.pdf 52 52
54


55 SAVOR TIMI 53 Trial 54 54
56 Prospective surveillance of saxagliptin Sentinel_AMI and Anti Diabetic Agents_Protocol_0.pdf 55 55
57 Saxagliptin vs. sitagliptin 56 56
58 Saxagliptin vs. pioglitazone 57 57
59 Saxagliptin vs. sulfonylureas 58 58
60 Saxagliptin vs. long acting insulin 59 59
61 Comparisons with SAVOR TIMI 53 trial Characteristics SAVOR TIMI 53 Trial Mini Sentinel surveillance* Comparator Placebo Select anti hyperglycemics No. saxagliptin users 8,280 82,264 No. comparator users 8, ,045 to 452,969 Interim results from the first 5 sequential analyses were No. AMI in saxagliptin to 171 made available to FDA prior to the publication of SAVOR No. AMI in comparator to 1,085 TIMI 53 findings Length of follow up 2.1 years (median) 4 to 8 months (mean) Statistical analysis Intention to treat As treated Hazard ratio for AMI 0.95 (95% CI: 0.80, 1.12) 0.54 to 1.17 * From end of surveillance analysis that included all patients 60 60
62 Overview Evolution of multi center studies Analytic methods in multi center studies Select examples Discussion 61

63 Analytical flexibility vs. granularity of information Analytic flexibility Individuallevel data with individual covariates Individuallevel data with summary scores Risk set data Summarytable data Intermediate statistics Effectestimate data Privacy protection 62
64 Analytic methods in multi center studies Covariate summarization technique Data sharing approach Covariate adjustment technique Outcome type Individual covariates* Individual level data Matching Continuous What to share? How to share? What can we do? What outcome? Propensity scores Summary table data Stratification Binary Disease risk scores Risk set data Restriction Count Summary scores + individual covariates Effect estimate data Weighting Survival A hybrid of above Intermediate statistics Modeling 63


65 Analytic methods in multi center studies Covariate summarization technique Data sharing approach Covariate adjustment technique Outcome type Individual covariates Individual level data Matching Continuous Propensity scores Summary table data Stratification Binary Disease risk scores Risk set data Restriction Count Summary scores + individual covariates Effect estimate data Weighting Survival A hybrid of above Intermediate statistics Modeling 64
66 Conclusion A suite of analytic methods are available for multi center studies There are often trade offs between analytic flexibility and identifiability of information shared Some newer methods offer excellent analytic flexibility and good privacy protection 65

67 @darrentoh_epi 66
On the Use of the Bross Formula for Prioritizing Covariates in the High-Dimensional Propensity Score Algorithm
 On the Use of the Bross Formula for Prioritizing Covariates in the High-Dimensional Propensity Score Algorithm Richard Wyss 1, Bruce Fireman 2, Jeremy A. Rassen 3, Sebastian Schneeweiss 1 Author Affiliations:
Targeted Maximum Likelihood Estimation in Safety Analysis
 Targeted Maximum Likelihood Estimation in Safety Analysis Sam Lendle 1 Bruce Fireman 2 Mark van der Laan 1 1 UC Berkeley 2 Kaiser Permanente ISPE Advanced Topics Session, Barcelona, August 2012 1 / 35
Division of Pharmacoepidemiology And Pharmacoeconomics Technical Report Series
 Division of Pharmacoepidemiology And Pharmacoeconomics Technical Report Series Year: 2013 #006 The Expected Value of Information in Prospective Drug Safety Monitoring Jessica M. Franklin a, Amanda R. Patrick
Optimal Treatment Regimes for Survival Endpoints from a Classification Perspective. Anastasios (Butch) Tsiatis and Xiaofei Bai
 Tsiatis and Xiaofei Bai") Optimal Treatment Regimes for Survival Endpoints from a Classification Perspective Anastasios (Butch) Tsiatis and Xiaofei Bai Department of Statistics North Carolina State University 1/35 Optimal Treatment
Optimal Treatment Regimes for Survival Endpoints from a Classification Perspective Anastasios (Butch) Tsiatis and Xiaofei Bai Department of Statistics North Carolina State University 1/35 Optimal Treatment
Causal Hazard Ratio Estimation By Instrumental Variables or Principal Stratification. Todd MacKenzie, PhD
 Causal Hazard Ratio Estimation By Instrumental Variables or Principal Stratification Todd MacKenzie, PhD Collaborators A. James O Malley Tor Tosteson Therese Stukel 2 Overview 1. Instrumental variable
Modular Program Report
 Modular Program Report Disclaimer The following report(s) provides findings from an FDA initiated query using Sentinel. While Sentinel queries may be undertaken to assess potential medical product safety
Online supplement. Absolute Value of Lung Function (FEV 1 or FVC) Explains the Sex Difference in. Breathlessness in the General Population
 Explains the Sex Difference in. Breathlessness in the General Population") Online supplement Absolute Value of Lung Function (FEV 1 or FVC) Explains the Sex Difference in Breathlessness in the General Population Table S1. Comparison between patients who were excluded or included
Online supplement Absolute Value of Lung Function (FEV 1 or FVC) Explains the Sex Difference in Breathlessness in the General Population Table S1. Comparison between patients who were excluded or included
BIOL 51A - Biostatistics 1 1. Lecture 1: Intro to Biostatistics. Smoking: hazardous? FEV (l) Smoke
 Smoke") BIOL 51A - Biostatistics 1 1 Lecture 1: Intro to Biostatistics Smoking: hazardous? FEV (l) 1 2 3 4 5 No Yes Smoke BIOL 51A - Biostatistics 1 2 Box Plot a.k.a box-and-whisker diagram or candlestick chart
BIOL 51A - Biostatistics 1 1 Lecture 1: Intro to Biostatistics Smoking: hazardous? FEV (l) 1 2 3 4 5 No Yes Smoke BIOL 51A - Biostatistics 1 2 Box Plot a.k.a box-and-whisker diagram or candlestick chart
Survival Analysis with Time- Dependent Covariates: A Practical Example. October 28, 2016 SAS Health Users Group Maria Eberg
 Survival Analysis with Time- Dependent Covariates: A Practical Example October 28, 2016 SAS Health Users Group Maria Eberg Outline Why use time-dependent covariates? Things to consider in definition of
Modular Program Report
 Modular Program Report The following report(s) provides findings from an FDA initiated query using its Mini Sentinel pilot. While Mini Sentinel queries may be undertaken to assess potential medical product
TECHNICAL APPENDIX WITH ADDITIONAL INFORMATION ON METHODS AND APPENDIX EXHIBITS. Ten health risks in this and the previous study were
 Goetzel RZ, Pei X, Tabrizi MJ, Henke RM, Kowlessar N, Nelson CF, Metz RD. Ten modifiable health risk factors are linked to more than one-fifth of employer-employee health care spending. Health Aff (Millwood).
A new strategy for meta-analysis of continuous covariates in observational studies with IPD. Willi Sauerbrei & Patrick Royston
 A new strategy for meta-analysis of continuous covariates in observational studies with IPD Willi Sauerbrei & Patrick Royston Overview Motivation Continuous variables functional form Fractional polynomials
Comparative effectiveness of dynamic treatment regimes
 Comparative effectiveness of dynamic treatment regimes An application of the parametric g- formula Miguel Hernán Departments of Epidemiology and Biostatistics Harvard School of Public Health www.hsph.harvard.edu/causal
Lecture 8 Stat D. Gillen
 Statistics 255 - Survival Analysis Presented February 23, 2016 Dan Gillen Department of Statistics University of California, Irvine 8.1 Example of two ways to stratify Suppose a confounder C has 3 levels
Federated analyses. technical, statistical and human challenges
 Federated analyses technical, statistical and human challenges Bénédicte Delcoigne, Statistician, PhD Department of Medicine (Solna), Unit of Clinical Epidemiology, Karolinska Institutet What is it? When
STAT 5500/6500 Conditional Logistic Regression for Matched Pairs
 STAT 5500/6500 Conditional Logistic Regression for Matched Pairs Motivating Example: The data we will be using comes from a subset of data taken from the Los Angeles Study of the Endometrial Cancer Data
A framework for developing, implementing and evaluating clinical prediction models in an individual participant data meta-analysis
 A framework for developing, implementing and evaluating clinical prediction models in an individual participant data meta-analysis Thomas Debray Moons KGM, Ahmed I, Koffijberg H, Riley RD Supported by
Low-Income African American Women's Perceptions of Primary Care Physician Weight Loss Counseling: A Positive Deviance Study
 Thomas Jefferson University Jefferson Digital Commons Master of Public Health Thesis and Capstone Presentations Jefferson College of Population Health 6-25-2015 Low-Income African American Women's Perceptions
Incorporating published univariable associations in diagnostic and prognostic modeling
 Incorporating published univariable associations in diagnostic and prognostic modeling Thomas Debray Julius Center for Health Sciences and Primary Care University Medical Center Utrecht The Netherlands
Lecture 7 Time-dependent Covariates in Cox Regression
 Lecture 7 Time-dependent Covariates in Cox Regression So far, we ve been considering the following Cox PH model: λ(t Z) = λ 0 (t) exp(β Z) = λ 0 (t) exp( β j Z j ) where β j is the parameter for the the
Power and Sample Size Calculations with the Additive Hazards Model
 Journal of Data Science 10(2012), 143-155 Power and Sample Size Calculations with the Additive Hazards Model Ling Chen, Chengjie Xiong, J. Philip Miller and Feng Gao Washington University School of Medicine
Individualized Treatment Effects with Censored Data via Nonparametric Accelerated Failure Time Models
 Individualized Treatment Effects with Censored Data via Nonparametric Accelerated Failure Time Models Nicholas C. Henderson Thomas A. Louis Gary Rosner Ravi Varadhan Johns Hopkins University July 31, 2018
Sample Size and Power I: Binary Outcomes. James Ware, PhD Harvard School of Public Health Boston, MA
 Sample Size and Power I: Binary Outcomes James Ware, PhD Harvard School of Public Health Boston, MA Sample Size and Power Principles: Sample size calculations are an essential part of study design Consider
Causal Modeling in Environmental Epidemiology. Joel Schwartz Harvard University
 Causal Modeling in Environmental Epidemiology Joel Schwartz Harvard University When I was Young What do I mean by Causal Modeling? What would have happened if the population had been exposed to a instead
11 November 2011 Department of Biostatistics, University of Copengen. 9:15 10:00 Recap of case-control studies. Frequency-matched studies.
 Matched and nested case-control studies Bendix Carstensen Steno Diabetes Center, Gentofte, Denmark http://staff.pubhealth.ku.dk/~bxc/ Department of Biostatistics, University of Copengen 11 November 2011
This report details analyses and methodologies used to examine and visualize the spatial and nonspatial
 Analysis Summary: Acute Myocardial Infarction and Social Determinants of Health Acute Myocardial Infarction Study Summary March 2014 Project Summary :: Purpose This report details analyses and methodologies
STA6938-Logistic Regression Model
 Dr. Ying Zhang STA6938-Logistic Regression Model Topic 6-Logistic Regression for Case-Control Studies Outlines: 1. Biomedical Designs 2. Logistic Regression Models for Case-Control Studies 3. Logistic
Standardization methods have been used in epidemiology. Marginal Structural Models as a Tool for Standardization ORIGINAL ARTICLE
 ORIGINAL ARTICLE Marginal Structural Models as a Tool for Standardization Tosiya Sato and Yutaka Matsuyama Abstract: In this article, we show the general relation between standardization methods and marginal
Measurement Error in Spatial Modeling of Environmental Exposures
 Measurement Error in Spatial Modeling of Environmental Exposures Chris Paciorek, Alexandros Gryparis, and Brent Coull August 9, 2005 Department of Biostatistics Harvard School of Public Health www.biostat.harvard.edu/~paciorek
Ph.D. course: Regression models. Introduction. 19 April 2012
 Ph.D. course: Regression models Introduction PKA & LTS Sect. 1.1, 1.2, 1.4 19 April 2012 www.biostat.ku.dk/~pka/regrmodels12 Per Kragh Andersen 1 Regression models The distribution of one outcome variable
Bayesian Nonparametric Accelerated Failure Time Models for Analyzing Heterogeneous Treatment Effects
 Bayesian Nonparametric Accelerated Failure Time Models for Analyzing Heterogeneous Treatment Effects Nicholas C. Henderson Thomas A. Louis Gary Rosner Ravi Varadhan Johns Hopkins University September 28,
Nemours Biomedical Research Statistics Course. Li Xie Nemours Biostatistics Core October 14, 2014
 Nemours Biomedical Research Statistics Course Li Xie Nemours Biostatistics Core October 14, 2014 Outline Recap Introduction to Logistic Regression Recap Descriptive statistics Variable type Example of
Philosophy and Features of the mstate package
 Introduction Mathematical theory Practice Discussion Philosophy and Features of the mstate package Liesbeth de Wreede, Hein Putter Department of Medical Statistics and Bioinformatics Leiden University
Hypothesis Testing, Power, Sample Size and Confidence Intervals (Part 2)
") Hypothesis Testing, Power, Sample Size and Confidence Intervals (Part 2) B.H. Robbins Scholars Series June 23, 2010 1 / 29 Outline Z-test χ 2 -test Confidence Interval Sample size and power Relative effect
Hypothesis Testing, Power, Sample Size and Confidence Intervals (Part 2) B.H. Robbins Scholars Series June 23, 2010 1 / 29 Outline Z-test χ 2 -test Confidence Interval Sample size and power Relative effect
Core Courses for Students Who Enrolled Prior to Fall 2018
 Biostatistics and Applied Data Analysis Students must take one of the following two sequences: Sequence 1 Biostatistics and Data Analysis I (PHP 2507) This course, the first in a year long, two-course
Marginal Structural Cox Model for Survival Data with Treatment-Confounder Feedback
 University of South Carolina Scholar Commons Theses and Dissertations 2017 Marginal Structural Cox Model for Survival Data with Treatment-Confounder Feedback Yanan Zhang University of South Carolina Follow
Supplementary Online Content
 Supplementary Online Content Sellers MM, Keele LJ, Sharoky CE, Wirtalla C, Bailey EA, Kelz RR. Association of surgical practice patterns and clinical outcomes with surgeon training in university- or nonuniversity-based
Ph.D. course: Regression models. Regression models. Explanatory variables. Example 1.1: Body mass index and vitamin D status
 Ph.D. course: Regression models Introduction PKA & LTS Sect. 1.1, 1.2, 1.4 25 April 2013 www.biostat.ku.dk/~pka/regrmodels13 Per Kragh Andersen Regression models The distribution of one outcome variable
Estimating the Mean Response of Treatment Duration Regimes in an Observational Study. Anastasios A. Tsiatis.
 Estimating the Mean Response of Treatment Duration Regimes in an Observational Study Anastasios A. Tsiatis http://www.stat.ncsu.edu/ tsiatis/ Introduction to Dynamic Treatment Regimes 1 Outline Description
An Introduction to Causal Analysis on Observational Data using Propensity Scores
 An Introduction to Causal Analysis on Observational Data using Propensity Scores Margie Rosenberg*, PhD, FSA Brian Hartman**, PhD, ASA Shannon Lane* *University of Wisconsin Madison **University of Connecticut
Part IV Statistics in Epidemiology
 Part IV Statistics in Epidemiology There are many good statistical textbooks on the market, and we refer readers to some of these textbooks when they need statistical techniques to analyze data or to interpret
Deep Temporal Generative Models of. Rahul Krishnan, Uri Shalit, David Sontag
 Deep Temporal Generative Models of Rahul Krishnan, Uri Shalit, David Sontag Patient timeline Jan 1 Feb 12 May 15 Blood pressure = 130 WBC count = 6*10 9 /L Temperature = 98 F A1c = 6.6% Precancerous cells
Data Mining in Pharmacovigilence. Aimin Feng, David Madigan, and Ivan Zorych
 Data Mining in Pharmacovigilence Aimin Feng, David Madigan, and Ivan Zorych dmadigan@rutgers.edu http://stat.rutgers.edu/~madigan 1 Overview Intro. to Post-marketing Surveillance SRS Databases Existing
Optimal Patient-specific Post-operative Surveillance for Vascular Surgeries
 Optimal Patient-specific Post-operative Surveillance for Vascular Surgeries Peter I. Frazier, Shanshan Zhang, Pranav Hanagal School of Operations Research & Information Engineering, Cornell University
Poisson Regression: Let me count the uses!
 Poisson Regression: Let me count the uses! Lisa Kaltenbach November 20, 2008 Poisson Reg may analyze 1. Count data (ex. no. of surgical site infections) 2. Binary data (ex. received vaccine(yes/no) as
Correlation and regression
 1 Correlation and regression Yongjua Laosiritaworn Introductory on Field Epidemiology 6 July 2015, Thailand Data 2 Illustrative data (Doll, 1955) 3 Scatter plot 4 Doll, 1955 5 6 Correlation coefficient,
Building a Prognostic Biomarker
 Building a Prognostic Biomarker Noah Simon and Richard Simon July 2016 1 / 44 Prognostic Biomarker for a Continuous Measure On each of n patients measure y i - single continuous outcome (eg. blood pressure,
Case-control studies
 Matched and nested case-control studies Bendix Carstensen Steno Diabetes Center, Gentofte, Denmark b@bxc.dk http://bendixcarstensen.com Department of Biostatistics, University of Copenhagen, 8 November
You know I m not goin diss you on the internet Cause my mama taught me better than that I m a survivor (What?) I m not goin give up (What?
 I m not goin give up (What?") You know I m not goin diss you on the internet Cause my mama taught me better than that I m a survivor (What?) I m not goin give up (What?) I m not goin stop (What?) I m goin work harder (What?) Sir David
You know I m not goin diss you on the internet Cause my mama taught me better than that I m a survivor (What?) I m not goin give up (What?) I m not goin stop (What?) I m goin work harder (What?) Sir David
A multi-state model for the prognosis of non-mild acute pancreatitis
 A multi-state model for the prognosis of non-mild acute pancreatitis Lore Zumeta Olaskoaga 1, Felix Zubia Olaskoaga 2, Guadalupe Gómez Melis 1 1 Universitat Politècnica de Catalunya 2 Intensive Care Unit,
Supplementary Appendix
 Supplementary Appendix This appendix has been provided by the authors to give readers additional information about their work. Supplement to: Lange P, Celli B, Agustí A, et al. Lung-function trajectories
6.873/HST.951 Medical Decision Support Spring 2004 Evaluation
 Harvard-MIT Division of Health Sciences and Technology HST.951J: Medical Decision Support, Fall 2005 Instructors: Professor Lucila Ohno-Machado and Professor Staal Vinterbo 6.873/HST.951 Medical Decision
GMM Logistic Regression with Time-Dependent Covariates and Feedback Processes in SAS TM
 Paper 1025-2017 GMM Logistic Regression with Time-Dependent Covariates and Feedback Processes in SAS TM Kyle M. Irimata, Arizona State University; Jeffrey R. Wilson, Arizona State University ABSTRACT The
Person-Time Data. Incidence. Cumulative Incidence: Example. Cumulative Incidence. Person-Time Data. Person-Time Data
 Person-Time Data CF Jeff Lin, MD., PhD. Incidence 1. Cumulative incidence (incidence proportion) 2. Incidence density (incidence rate) December 14, 2005 c Jeff Lin, MD., PhD. c Jeff Lin, MD., PhD. Person-Time
BIOS 2041: Introduction to Statistical Methods
 BIOS 2041: Introduction to Statistical Methods Abdus S Wahed* *Some of the materials in this chapter has been adapted from Dr. John Wilson s lecture notes for the same course. Chapter 0 2 Chapter 1 Introduction
Marginal versus conditional effects: does it make a difference? Mireille Schnitzer, PhD Université de Montréal
 Marginal versus conditional effects: does it make a difference? Mireille Schnitzer, PhD Université de Montréal Overview In observational and experimental studies, the goal may be to estimate the effect
Statistics in medicine
 Statistics in medicine Lecture 4: and multivariable regression Fatma Shebl, MD, MS, MPH, PhD Assistant Professor Chronic Disease Epidemiology Department Yale School of Public Health Fatma.shebl@yale.edu
ADVANCED STATISTICAL ANALYSIS OF EPIDEMIOLOGICAL STUDIES. Cox s regression analysis Time dependent explanatory variables
 ADVANCED STATISTICAL ANALYSIS OF EPIDEMIOLOGICAL STUDIES Cox s regression analysis Time dependent explanatory variables Henrik Ravn Bandim Health Project, Statens Serum Institut 4 November 2011 1 / 53
Assess Assumptions and Sensitivity Analysis. Fan Li March 26, 2014
 Assess Assumptions and Sensitivity Analysis Fan Li March 26, 2014 Two Key Assumptions 1. Overlap: 0
Section IX. Introduction to Logistic Regression for binary outcomes. Poisson regression
 Section IX Introduction to Logistic Regression for binary outcomes Poisson regression 0 Sec 9 - Logistic regression In linear regression, we studied models where Y is a continuous variable. What about
4 Data collection tables, worksheets, and checklists
 4 Data collection tables, worksheets, and checklists 1 2 Table 4.1 Contact and data collection schematic for ADAPT (ADAPTDC.Tab) 1 Type of visit/contact Eligibility Enrollment Cognitive assessment Followup
STAT 5500/6500 Conditional Logistic Regression for Matched Pairs
 STAT 5500/6500 Conditional Logistic Regression for Matched Pairs The data for the tutorial came from support.sas.com, The LOGISTIC Procedure: Conditional Logistic Regression for Matched Pairs Data :: SAS/STAT(R)
Instrumental variables estimation in the Cox Proportional Hazard regression model
 Instrumental variables estimation in the Cox Proportional Hazard regression model James O Malley, Ph.D. Department of Biomedical Data Science The Dartmouth Institute for Health Policy and Clinical Practice
Survival Analysis for Case-Cohort Studies
 Survival Analysis for ase-ohort Studies Petr Klášterecký Dept. of Probability and Mathematical Statistics, Faculty of Mathematics and Physics, harles University, Prague, zech Republic e-mail: petr.klasterecky@matfyz.cz
Support Vector Hazard Regression (SVHR) for Predicting Survival Outcomes. Donglin Zeng, Department of Biostatistics, University of North Carolina
 for Predicting Survival Outcomes. Donglin Zeng, Department of Biostatistics, University of North Carolina") Support Vector Hazard Regression (SVHR) for Predicting Survival Outcomes Introduction Method Theoretical Results Simulation Studies Application Conclusions Introduction Introduction For survival data,
Support Vector Hazard Regression (SVHR) for Predicting Survival Outcomes Introduction Method Theoretical Results Simulation Studies Application Conclusions Introduction Introduction For survival data,
Causal inference in biomedical sciences: causal models involving genotypes. Mendelian randomization genes as Instrumental Variables
 Causal inference in biomedical sciences: causal models involving genotypes Causal models for observational data Instrumental variables estimation and Mendelian randomization Krista Fischer Estonian Genome
Extending the results of clinical trials using data from a target population
 Extending the results of clinical trials using data from a target population Issa Dahabreh Center for Evidence-Based Medicine, Brown School of Public Health Disclaimer Partly supported through PCORI Methods
Author's response to reviews
 Author's response to reviews Title: Diverse risks of incident cardiovascular disease and all-cause mortality in men and women with low cash margins living alone: cohort data from 60-year-olds Authors:
Completions Survey materials can be downloaded using the following link: Survey Materials.
 Completions 0- Institution: Lord Fairfax Community College (575) User ID: P575 Completions Overview Welcome to the IPEDS Completions survey component. The Completions component is one of several IPEDS
Interrupted Time Series Analysis for Single Series and Comparative Designs: Using Administrative Data for Healthcare Impact Assessment
 Interrupted Time Series Analysis for Single Series and Comparative Designs: Using Administrative Data for Healthcare Impact Assessment Joseph M. Caswell, Ph.D. Lead Analyst Institute for Clinical Evaluative
Propensity Scores for Repeated Treatments
 C O R P O R A T I O N Propensity Scores for Repeated Treatments A Tutorial for the iptw Function in the TWANG Package Lane F. Burgette, Beth Ann Griffin, Daniel F. McCaffrey For more information on this
Growth Mixture Model
 Growth Mixture Model Latent Variable Modeling and Measurement Biostatistics Program Harvard Catalyst The Harvard Clinical & Translational Science Center Short course, October 28, 2016 Slides contributed
Lecture 11. Interval Censored and. Discrete-Time Data. Statistics Survival Analysis. Presented March 3, 2016
 Statistics 255 - Survival Analysis Presented March 3, 2016 Motivating Dan Gillen Department of Statistics University of California, Irvine 11.1 First question: Are the data truly discrete? : Number of
DO NOT CITE WITHOUT AUTHOR S PERMISSION:
 Study Context & Purpose Prior to the 2013-14 school year a Tennessee policy went into effect such that a teacher s level of effectiveness (LOE) and certification status determined their minimum number
Assessing covariate balance when using the generalized propensity score with quantitative or continuous exposures
 Article Assessing covariate balance when using the generalized propensity score with quantitative or continuous exposures Statistical Methods in Medical Research 0(0) 1 13! he Author(s) 2018 Reprints and
β j = coefficient of x j in the model; β = ( β1, β2,
 Regression Modeling of Survival Time Data Why regression models? Groups similar except for the treatment under study use the nonparametric methods discussed earlier. Groups differ in variables (covariates)
Overview of statistical methods used in analyses with your group between 2000 and 2013
 Department of Epidemiology and Public Health Unit of Biostatistics Overview of statistical methods used in analyses with your group between 2000 and 2013 January 21st, 2014 PD Dr C Schindler Swiss Tropical
A note on R 2 measures for Poisson and logistic regression models when both models are applicable
 Journal of Clinical Epidemiology 54 (001) 99 103 A note on R measures for oisson and logistic regression models when both models are applicable Martina Mittlböck, Harald Heinzl* Department of Medical Computer
Multi-state Models: An Overview
 Multi-state Models: An Overview Andrew Titman Lancaster University 14 April 2016 Overview Introduction to multi-state modelling Examples of applications Continuously observed processes Intermittently observed
Journal of Biostatistics and Epidemiology
 Journal of Biostatistics and Epidemiology Methodology Marginal versus conditional causal effects Kazem Mohammad 1, Seyed Saeed Hashemi-Nazari 2, Nasrin Mansournia 3, Mohammad Ali Mansournia 1* 1 Department
Using Geospatial Methods with Other Health and Environmental Data to Identify Populations
 Using Geospatial Methods with Other Health and Environmental Data to Identify Populations Ellen K. Cromley, PhD Consultant, Health Geographer ellen.cromley@gmail.com Purpose and Outline To illustrate the
DISCRETE PROBABILITY DISTRIBUTIONS
 DISCRETE PROBABILITY DISTRIBUTIONS REVIEW OF KEY CONCEPTS SECTION 41 Random Variable A random variable X is a numerically valued quantity that takes on specific values with different probabilities The
Lecture 5: Poisson and logistic regression
 Dankmar Böhning Southampton Statistical Sciences Research Institute University of Southampton, UK S 3 RI, 3-5 March 2014 introduction to Poisson regression application to the BELCAP study introduction
Effect Modification and Interaction
 By Sander Greenland Keywords: antagonism, causal coaction, effect-measure modification, effect modification, heterogeneity of effect, interaction, synergism Abstract: This article discusses definitions
Lecture 12. Multivariate Survival Data Statistics Survival Analysis. Presented March 8, 2016
 Statistics 255 - Survival Analysis Presented March 8, 2016 Dan Gillen Department of Statistics University of California, Irvine 12.1 Examples Clustered or correlated survival times Disease onset in family
PubH 7405: REGRESSION ANALYSIS INTRODUCTION TO LOGISTIC REGRESSION
 PubH 745: REGRESSION ANALYSIS INTRODUCTION TO LOGISTIC REGRESSION Let Y be the Dependent Variable Y taking on values and, and: π Pr(Y) Y is said to have the Bernouilli distribution (Binomial with n ).
Multiple imputation to account for measurement error in marginal structural models
 Multiple imputation to account for measurement error in marginal structural models Supplementary material A. Standard marginal structural model We estimate the parameters of the marginal structural model
Lecture 2: Poisson and logistic regression
 Dankmar Böhning Southampton Statistical Sciences Research Institute University of Southampton, UK S 3 RI, 11-12 December 2014 introduction to Poisson regression application to the BELCAP study introduction
Basic Medical Statistics Course
 Basic Medical Statistics Course S7 Logistic Regression November 2015 Wilma Heemsbergen w.heemsbergen@nki.nl Logistic Regression The concept of a relationship between the distribution of a dependent variable
Institution: CUNY Hostos Community College (190585) User ID: 36C0029 Completions Overview distance education All Completers unduplicated count
 User ID: 36C0029 Completions Overview distance education All Completers unduplicated count") Completions 204-5 Institution: CUNY Hostos Community College (90585) User ID: 36C0029 Completions Overview Welcome to the IPEDS Completions survey component. The Completions component is one of several
Completions 204-5 Institution: CUNY Hostos Community College (90585) User ID: 36C0029 Completions Overview Welcome to the IPEDS Completions survey component. The Completions component is one of several
ARIC Manuscript Proposal # PC Reviewed: _9/_25_/06 Status: A Priority: _2 SC Reviewed: _9/_25_/06 Status: A Priority: _2
 ARIC Manuscript Proposal # 1186 PC Reviewed: _9/_25_/06 Status: A Priority: _2 SC Reviewed: _9/_25_/06 Status: A Priority: _2 1.a. Full Title: Comparing Methods of Incorporating Spatial Correlation in
Institution: CUNY Bronx Community College (190530) User ID: 36C0029 Completions Overview distance education All Completers unduplicated count
 User ID: 36C0029 Completions Overview distance education All Completers unduplicated count") Completions 204-5 Institution: CUNY Bronx Community College (90530) User ID: 36C0029 Completions Overview Welcome to the IPEDS Completions survey component. The Completions component is one of several
Completions 204-5 Institution: CUNY Bronx Community College (90530) User ID: 36C0029 Completions Overview Welcome to the IPEDS Completions survey component. The Completions component is one of several
Compare Predicted Counts between Groups of Zero Truncated Poisson Regression Model based on Recycled Predictions Method
 Compare Predicted Counts between Groups of Zero Truncated Poisson Regression Model based on Recycled Predictions Method Yan Wang 1, Michael Ong 2, Honghu Liu 1,2,3 1 Department of Biostatistics, UCLA School
CHAPTER 3 HEART AND LUNG TRANSPLANTATION. Editors: Mr Mohamed Ezani Md. Taib Dato Dr David Chew Soon Ping Dr Ashari Yunus
 CHAPTER 3 HEART AND LUNG TRANSPLANTATION Editors: Mr Mohamed Ezani Md. Taib Dato Dr David Chew Soon Ping Dr Ashari Yunus Expert Panel: Mr Mohamed Ezani Md. Taib (Chairperson) Dr Abdul Rais Sanusi Datuk
BIAS OF MAXIMUM-LIKELIHOOD ESTIMATES IN LOGISTIC AND COX REGRESSION MODELS: A COMPARATIVE SIMULATION STUDY
 BIAS OF MAXIMUM-LIKELIHOOD ESTIMATES IN LOGISTIC AND COX REGRESSION MODELS: A COMPARATIVE SIMULATION STUDY Ingo Langner 1, Ralf Bender 2, Rebecca Lenz-Tönjes 1, Helmut Küchenhoff 2, Maria Blettner 2 1
Subgroup analysis using regression modeling multiple regression. Aeilko H Zwinderman
 Subgroup analysis using regression modeling multiple regression Aeilko H Zwinderman who has unusual large response? Is such occurrence associated with subgroups of patients? such question is hypothesis-generating:
PhD course: Statistical evaluation of diagnostic and predictive models
 PhD course: Statistical evaluation of diagnostic and predictive models Tianxi Cai (Harvard University, Boston) Paul Blanche (University of Copenhagen) Thomas Alexander Gerds (University of Copenhagen)
Estimation of Optimal Treatment Regimes Via Machine Learning. Marie Davidian
 Estimation of Optimal Treatment Regimes Via Machine Learning Marie Davidian Department of Statistics North Carolina State University Triangle Machine Learning Day April 3, 2018 1/28 Optimal DTRs Via ML
DETERMINATION OF THE SAMPLE SIZE AND THE NUMBER OF FOLLOW-UP TIMES BY USING LINEAR PROGRAMMING
 Journal of Statistics: Advances in Theory and Applications Volume 14, Number 1, 2015, Pages 27-35 Available at http://scientificadvances.co.in DOI: http://dx.doi.org/10.18642/jsata_7100121529 DETERMINATION
STA 4504/5503 Sample Exam 1 Spring 2011 Categorical Data Analysis. 1. Indicate whether each of the following is true (T) or false (F).
 or false (F).") STA 4504/5503 Sample Exam 1 Spring 2011 Categorical Data Analysis 1. Indicate whether each of the following is true (T) or false (F). (a) T In 2 2 tables, statistical independence is equivalent to a population
STA 4504/5503 Sample Exam 1 Spring 2011 Categorical Data Analysis 1. Indicate whether each of the following is true (T) or false (F). (a) T In 2 2 tables, statistical independence is equivalent to a population