Growth Mixture Model
|
|
|
- Olivia Lamb
- 5 years ago
- Views:
Transcription
1 Growth Mixture Model Latent Variable Modeling and Measurement Biostatistics Program Harvard Catalyst The Harvard Clinical & Translational Science Center Short course, October 28, 2016 Slides contributed by Jeannie-Marie Leoutsakos, Assistant Professor of Psychiatry & Mental Health, Johns Hopkins University
2 Well-used latent variable models Latent variable scale Observed variable scale Continuous Discrete Continuous Factor analysis LISREL Discrete FA IRT (item response) Discrete Latent profile Growth mixture Latent class analysis, regression
3 Outline Motivating Example: The ADAPT trial Two Options for Modeling Heterogeneity 1. Mixed Effects/Growth Curve Models 2. Growth Mixture Models Comparison of Options & Final Thoughts
4 AD and Inflammation AD characterized by β-amyloid plaques and neurofibrillary tangles AD is progressive, with a long preclinical period. Inflammatory processes have been linked to plaque and tangle formation Inflammatory processes also linked to clearance of β-amyloid.
5 AD and NSAIDs In observational studies, NSAID use associated with reduced risk of AD AD treatment trials show no effect of NSAIDs In an MCI prevention trial, NSAID increased risk.
6 The ADAPT Trial Multi-site prevention trial N=2528 Participants 70+, family history of AD 200 mg of celecoxib bid, 220 mg of naproxen sodium bid, or matching placebo (1:1:1.5) Enrollment began in 2001, halted December 2004 due to safety concerns. Study cohort is still being followed.
7 ADAPT 3MS Total
8 Option 1. LGCM i indexes individuals j indexes timepoints Each individual i has her own personal intercept η 0i and personal slope η 1i Y = η + η time + ε ij 0i 1i j ij η = γ + γ age + ζ 0i i η = γ + γ age + γ I( drug ) + γ I( drug ) + ζ 1i i 8
9 Option 1. Mixed Effects Model β 0 +b 0i β 1 t ij +β 5 nap t ij β 0 β 1 t ij + b 1i t ij 3MS β 1 t ij time β 1 t ij + β 3 cel t ij Y ij =γ 00 +ζ 0i + γ 10 t ij +ζ +b 1i t ij i + γ 12 cel t ij + γ 13 nap t ij +ε ij
10 SAS Syntax Random Intercept + Random Slope Model proc mixed data = adapt method=ml covtest; model h=time agec drug1 drug2 time*drug1 time*drug2 /s; random int time/ type = un sub = id; run; Model Random Effects 10
11 Mixed Effects with Quadratic Term β 0 +β 4 β 1 t ij +β 5 nap t ij + β 8 nap t 2 ij β 0 +b 0i β 1 t ij +b 1i t ij + β 6 t ij 2 β 0 β 0 +β 2 β 1 t ij + β 6 t ij 2 3MS time β 1 t ij + β 3 cel t ij + β 7 cel t ij 2 Y ij =β 0 +b 0i + β 1 t ij +b 1i t ij +β 2 cel+ β 3 cel t ij + β 4 nap+ β 5 nap t ij + β 6 t ij2 + β 7 cel t ij2 + β 8 nap t ij2 + ε ij
12 Parameter Estimates
13 Expected Change Over 4 Years
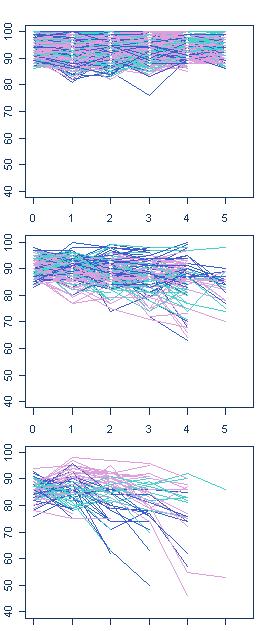
14 Observed and Predicted Trajectories Model I Placebo Celecoxib 3MS Total Naproxen Model II Placebo 3MS Total Celecoxib 3MS Total Naproxen

15 Rates of Decline in Pre-Clinical AD Prior to clinical dx, decline rate not constant Can consider trajectories as being in classes : no, slow, & fast decline.
16 The Timing Hypothesis Contradiction between observational and clinical trials due to differences in timing of exposure to NSAIDs Early/little or no decline: NSAIDs good Later/ substantial decline: NSAIDs bad Observational trials: most individuals in no/slow decline class when exposed Clinical trials: larger proportion of individuals in the fast decline class
17 Testing the Timing Hypothesis Ideal: Stratify individuals by decline class, fit mixed effects models with NSAID effects separately for each class. Problem: we don t know for sure how many classes there are, or who is in each class. Class is a latent variable.
18 Mixed Effects Models as Growth Models Term used in developmental research Growth getting taller, smarter, etc. Fixed effects (intercept, slope, quadratic) referred to as Growth Factors


19 Mixture Models Useful when you believe your population is actually a mixture of subpopulations. Mixture here has nothing to do with Mixed Effects
20 Option 2. Growth Mixture Models Allows for the estimation of a prespecified number of latent classes of trajectories Determined via a combination of substantive theory, fit indices, and bootstrapped likelihood ratio tests. Estimates mixed effects model (growth model) parameters for each latent class
21
22 Option 2. LGMM i indexes individuals j indexes timepoints K indexes latent classes Each class k has its own class-specific intercept η 0k and slope η 1k, and classspecific drug-effects Y = η + η time + ε ij 0i 1i j ij η = γ + ζ 0i 0k 0i η = γ + γ Idrug ( ) + γ Idrug ( ) + ζ 1i 10k 11k 1 12k 2 1i 22
23 Growth Mixture Model Parameters For each class (indexed by k), we now have Y ij =γ 0k +ζ 0i + γ 10k t ij +ζ 1i t ij + γ 11k cel t ij + γ 12k nap t ij +ε ij Simultaneously, model probability of membership in each class via multinomial logistic regression - this allows for inclusion of predictors of class membership (e.g., age, such that older individuals have greater probability of membership in the fast-decline class.
24 Step 1. for LGMM Single-class LGCM (no covariates) Assess variability of intercepts and slopes (graphically) Determine whether a quadratic term is needed. Assess the correlation structure among outcomes across time. (eg, is it OK to hold residual variance of Ys constant over time?). 24
25 Step 2. For LGMM Fit Latent Class Growth Analyses Unlike GMM, var(i) and var(s) is fixed at 0. Using the same methods as with LCA (BIC and BLRT) determine the appropriate number of classes Do this with and without covariates 25
26 MPLUS Input for LCGA Specify latent classes Fix I and S variances Estimate I and S separately for each class 26
27 MPLUS Input for BLRT one set of start values for parameter estimation Specify # of starts for BLRT Ask for BLRT 27
28 Choosing Number of Classes Without covariates (and with, not shown) a two-class model does not fit the data as well as a three-class model 28
29 Step 3. Fit GMM First with class invariant I, S variances Also possible to have class-varying I,S variances Add covariates Ponder meaning 29
30 Class-Invariant I S Variances 30
31 Adding Covariates Age as a predictor of class membership Drug1 and Drug 2 modify class-specific* slopes. 31
32 GMM with Covariates Input 32
33 Growth Mixture Model Parameter Estimates
34
35 Expected Change Over Time A model where drug effects are forced to be the same across classes fits the data significantly worse (-2LLD: ; p<0.001)
36 Comparison of Options Mixed Effects Assumes one population Simpler interpretation More parsimonious Standard software Results can be more definitive Growth Mixture Model Models subpopulations Complex interpretation More parameters Need larger sample Need $pecial $oftware Results not definitive; post-hoc subgroup analysis
37 Final Thoughts on Growth Mixture Models What does it all mean? possible to get fit indices, etc which support a multi-class mixture when really there are no underlying subgroups. Entails a number of assumptions about the within-person correlation and random effects, results can be highly sensitive to those assumptions Assumptions/model fit difficult to check Hypothesis generating/refining rather than confirming.
Longitudinal Data Analysis of Health Outcomes
 Longitudinal Data Analysis of Health Outcomes Longitudinal Data Analysis Workshop Running Example: Days 2 and 3 University of Georgia: Institute for Interdisciplinary Research in Education and Human Development
Categorical and Zero Inflated Growth Models
 Categorical and Zero Inflated Growth Models Alan C. Acock* Summer, 2009 *Alan C. Acock, Department of Human Development and Family Sciences, Oregon State University, Corvallis OR 97331 (alan.acock@oregonstate.edu).
Mixture Modeling in Mplus
 Mixture Modeling in Mplus Gitta Lubke University of Notre Dame VU University Amsterdam Mplus Workshop John s Hopkins 2012 G. Lubke, ND, VU Mixture Modeling in Mplus 1/89 Outline 1 Overview 2 Latent Class
Online Appendix for Sterba, S.K. (2013). Understanding linkages among mixture models. Multivariate Behavioral Research, 48,
. Understanding linkages among mixture models. Multivariate Behavioral Research, 48,") Online Appendix for, S.K. (2013). Understanding linkages among mixture models. Multivariate Behavioral Research, 48, 775-815. Table of Contents. I. Full presentation of parallel-process groups-based trajectory
Online Appendix for, S.K. (2013). Understanding linkages among mixture models. Multivariate Behavioral Research, 48, 775-815. Table of Contents. I. Full presentation of parallel-process groups-based trajectory
Factor Analysis. Qian-Li Xue
 Factor Analysis Qian-Li Xue Biostatistics Program Harvard Catalyst The Harvard Clinical & Translational Science Center Short course, October 7, 06 Well-used latent variable models Latent variable scale
Review of CLDP 944: Multilevel Models for Longitudinal Data
 Review of CLDP 944: Multilevel Models for Longitudinal Data Topics: Review of general MLM concepts and terminology Model comparisons and significance testing Fixed and random effects of time Significance
An Introduction to Multilevel Models. PSYC 943 (930): Fundamentals of Multivariate Modeling Lecture 25: December 7, 2012
: Fundamentals of Multivariate Modeling Lecture 25: December 7, 2012") An Introduction to Multilevel Models PSYC 943 (930): Fundamentals of Multivariate Modeling Lecture 25: December 7, 2012 Today s Class Concepts in Longitudinal Modeling Between-Person vs. +Within-Person
An Introduction to Multilevel Models PSYC 943 (930): Fundamentals of Multivariate Modeling Lecture 25: December 7, 2012 Today s Class Concepts in Longitudinal Modeling Between-Person vs. +Within-Person
Growth Mixture Modeling and Causal Inference. Booil Jo Stanford University
 Growth Mixture Modeling and Causal Inference Booil Jo Stanford University booil@stanford.edu Conference on Advances in Longitudinal Methods inthe Socialand and Behavioral Sciences June 17 18, 2010 Center
over Time line for the means). Specifically, & covariances) just a fixed variance instead. PROC MIXED: to 1000 is default) list models with TYPE=VC */
. Specifically, & covariances) just a fixed variance instead. PROC MIXED: to 1000 is default) list models with TYPE=VC */") CLP 944 Example 4 page 1 Within-Personn Fluctuation in Symptom Severity over Time These data come from a study of weekly fluctuation in psoriasis severity. There was no intervention and no real reason
CLP 944 Example 4 page 1 Within-Personn Fluctuation in Symptom Severity over Time These data come from a study of weekly fluctuation in psoriasis severity. There was no intervention and no real reason
Personalized Treatment Selection Based on Randomized Clinical Trials. Tianxi Cai Department of Biostatistics Harvard School of Public Health
 Personalized Treatment Selection Based on Randomized Clinical Trials Tianxi Cai Department of Biostatistics Harvard School of Public Health Outline Motivation A systematic approach to separating subpopulations
Joint Modeling of Longitudinal Item Response Data and Survival
 Joint Modeling of Longitudinal Item Response Data and Survival Jean-Paul Fox University of Twente Department of Research Methodology, Measurement and Data Analysis Faculty of Behavioural Sciences Enschede,
Biostatistics Workshop Longitudinal Data Analysis. Session 4 GARRETT FITZMAURICE
 Biostatistics Workshop 2008 Longitudinal Data Analysis Session 4 GARRETT FITZMAURICE Harvard University 1 LINEAR MIXED EFFECTS MODELS Motivating Example: Influence of Menarche on Changes in Body Fat Prospective
Lab 11. Multilevel Models. Description of Data
 Lab 11 Multilevel Models Henian Chen, M.D., Ph.D. Description of Data MULTILEVEL.TXT is clustered data for 386 women distributed across 40 groups. ID: 386 women, id from 1 to 386, individual level (level
Describing Change over Time: Adding Linear Trends
 Describing Change over Time: Adding Linear Trends Longitudinal Data Analysis Workshop Section 7 University of Georgia: Institute for Interdisciplinary Research in Education and Human Development Section
Missing Data in Longitudinal Studies: Mixed-effects Pattern-Mixture and Selection Models
 Missing Data in Longitudinal Studies: Mixed-effects Pattern-Mixture and Selection Models Hedeker D & Gibbons RD (1997). Application of random-effects pattern-mixture models for missing data in longitudinal
Richard N. Jones, Sc.D. HSPH Kresge G2 October 5, 2011
 Harvard Catalyst Biostatistical Seminar Neuropsychological Proles in Alzheimer's Disease and Cerebral Infarction: A Longitudinal MIMIC Model An Overview of Structural Equation Modeling using Mplus Richard
Time-Invariant Predictors in Longitudinal Models
 Time-Invariant Predictors in Longitudinal Models Topics: Summary of building unconditional models for time Missing predictors in MLM Effects of time-invariant predictors Fixed, systematically varying,
BIOSTATISTICAL METHODS
 BIOSTATISTICAL METHODS FOR TRANSLATIONAL & CLINICAL RESEARCH Cross-over Designs #: DESIGNING CLINICAL RESEARCH The subtraction of measurements from the same subject will mostly cancel or minimize effects
Specifying Latent Curve and Other Growth Models Using Mplus. (Revised )
") Ronald H. Heck 1 University of Hawai i at Mānoa Handout #20 Specifying Latent Curve and Other Growth Models Using Mplus (Revised 12-1-2014) The SEM approach offers a contrasting framework for use in analyzing
Ronald H. Heck 1 University of Hawai i at Mānoa Handout #20 Specifying Latent Curve and Other Growth Models Using Mplus (Revised 12-1-2014) The SEM approach offers a contrasting framework for use in analyzing
Mixed-Effects Pattern-Mixture Models for Incomplete Longitudinal Data. Don Hedeker University of Illinois at Chicago
 Mixed-Effects Pattern-Mixture Models for Incomplete Longitudinal Data Don Hedeker University of Illinois at Chicago This work was supported by National Institute of Mental Health Contract N44MH32056. 1
Time Invariant Predictors in Longitudinal Models
 Time Invariant Predictors in Longitudinal Models Longitudinal Data Analysis Workshop Section 9 University of Georgia: Institute for Interdisciplinary Research in Education and Human Development Section
Designing Multilevel Models Using SPSS 11.5 Mixed Model. John Painter, Ph.D.
 Designing Multilevel Models Using SPSS 11.5 Mixed Model John Painter, Ph.D. Jordan Institute for Families School of Social Work University of North Carolina at Chapel Hill 1 Creating Multilevel Models
Mixed Models for Longitudinal Binary Outcomes. Don Hedeker Department of Public Health Sciences University of Chicago.
 Mixed Models for Longitudinal Binary Outcomes Don Hedeker Department of Public Health Sciences University of Chicago hedeker@uchicago.edu https://hedeker-sites.uchicago.edu/ Hedeker, D. (2005). Generalized
Lecture 25. Ingo Ruczinski. November 24, Department of Biostatistics Johns Hopkins Bloomberg School of Public Health Johns Hopkins University
 Lecture 25 Department of Biostatistics Johns Hopkins Bloomberg School of Public Health Johns Hopkins University November 24, 2015 1 2 3 4 5 6 7 8 9 10 11 1 Hypothesis s of homgeneity 2 Estimating risk
Introduction to Within-Person Analysis and RM ANOVA
 Introduction to Within-Person Analysis and RM ANOVA Today s Class: From between-person to within-person ANOVAs for longitudinal data Variance model comparisons using 2 LL CLP 944: Lecture 3 1 The Two Sides
Latent Class Analysis
 Latent Class Analysis Karen Bandeen-Roche October 27, 2016 Objectives For you to leave here knowing When is latent class analysis (LCA) model useful? What is the LCA model its underlying assumptions? How
The impact of covariance misspecification in multivariate Gaussian mixtures on estimation and inference
 The impact of covariance misspecification in multivariate Gaussian mixtures on estimation and inference An application to longitudinal modeling Brianna Heggeseth with Nicholas Jewell Department of Statistics
BIOS 6649: Handout Exercise Solution
 BIOS 6649: Handout Exercise Solution NOTE: I encourage you to work together, but the work you submit must be your own. Any plagiarism will result in loss of all marks. This assignment is based on weight-loss
Generalized Linear Models for Non-Normal Data
 Generalized Linear Models for Non-Normal Data Today s Class: 3 parts of a generalized model Models for binary outcomes Complications for generalized multivariate or multilevel models SPLH 861: Lecture
Rerandomization to Balance Covariates
 Rerandomization to Balance Covariates Kari Lock Morgan Department of Statistics Penn State University Joint work with Don Rubin University of Minnesota Biostatistics 4/27/16 The Gold Standard Randomized
Advantages of Mixed-effects Regression Models (MRM; aka multilevel, hierarchical linear, linear mixed models) 1. MRM explicitly models individual
 1. MRM explicitly models individual") Advantages of Mixed-effects Regression Models (MRM; aka multilevel, hierarchical linear, linear mixed models) 1. MRM explicitly models individual change across time 2. MRM more flexible in terms of repeated
Advantages of Mixed-effects Regression Models (MRM; aka multilevel, hierarchical linear, linear mixed models) 1. MRM explicitly models individual change across time 2. MRM more flexible in terms of repeated
Time-Invariant Predictors in Longitudinal Models
 Time-Invariant Predictors in Longitudinal Models Today s Topics: What happens to missing predictors Effects of time-invariant predictors Fixed vs. systematically varying vs. random effects Model building
Application of Item Response Theory Models for Intensive Longitudinal Data
 Application of Item Response Theory Models for Intensive Longitudinal Data Don Hedeker, Robin Mermelstein, & Brian Flay University of Illinois at Chicago hedeker@uic.edu Models for Intensive Longitudinal
Analyzing criminal trajectory profiles: Bridging multilevel and group-based approaches using growth mixture modeling
 Analyzing criminal trajectory profiles: Bridging multilevel and group-based approaches using growth mixture modeling Frauke Kreuter 1 & Bengt Muthén 2 1 Joint Program in Survey Methodology, University
Thursday Morning. Growth Modelling in Mplus. Using a set of repeated continuous measures of bodyweight
 Thursday Morning Growth Modelling in Mplus Using a set of repeated continuous measures of bodyweight 1 Growth modelling Continuous Data Mplus model syntax refresher ALSPAC Confirmatory Factor Analysis
Using Mplus individual residual plots for. diagnostics and model evaluation in SEM
 Using Mplus individual residual plots for diagnostics and model evaluation in SEM Tihomir Asparouhov and Bengt Muthén Mplus Web Notes: No. 20 October 31, 2017 1 Introduction A variety of plots are available
Time-Invariant Predictors in Longitudinal Models
 Time-Invariant Predictors in Longitudinal Models Topics: What happens to missing predictors Effects of time-invariant predictors Fixed vs. systematically varying vs. random effects Model building strategies
Describing Within-Person Fluctuation over Time using Alternative Covariance Structures
 Describing Within-Person Fluctuation over Time using Alternative Covariance Structures Today s Class: The Big Picture ACS models using the R matrix only Introducing the G, Z, and V matrices ACS models
STAT 705 Generalized linear mixed models
 STAT 705 Generalized linear mixed models Timothy Hanson Department of Statistics, University of South Carolina Stat 705: Data Analysis II 1 / 24 Generalized Linear Mixed Models We have considered random
Time-Invariant Predictors in Longitudinal Models
 Time-Invariant Predictors in Longitudinal Models Today s Class (or 3): Summary of steps in building unconditional models for time What happens to missing predictors Effects of time-invariant predictors
Latent Growth Models 1
 1 We will use the dataset bp3, which has diastolic blood pressure measurements at four time points for 256 patients undergoing three types of blood pressure medication. These are our observed variables:
SAS Syntax and Output for Data Manipulation: CLDP 944 Example 3a page 1
 CLDP 944 Example 3a page 1 From Between-Person to Within-Person Models for Longitudinal Data The models for this example come from Hoffman (2015) chapter 3 example 3a. We will be examining the extent to
STAT 730 Chapter 9: Factor analysis
 STAT 730 Chapter 9: Factor analysis Timothy Hanson Department of Statistics, University of South Carolina Stat 730: Multivariate Data Analysis 1 / 15 Basic idea Factor analysis attempts to explain the
Model Assumptions; Predicting Heterogeneity of Variance
 Model Assumptions; Predicting Heterogeneity of Variance Today s topics: Model assumptions Normality Constant variance Predicting heterogeneity of variance CLP 945: Lecture 6 1 Checking for Violations of
Investigating Population Heterogeneity With Factor Mixture Models
 Psychological Methods 2005, Vol. 10, No. 1, 21 39 Copyright 2005 by the American Psychological Association 1082-989X/05/$12.00 DOI: 10.1037/1082-989X.10.1.21 Investigating Population Heterogeneity With
Analyzing Criminal Trajectory Profiles: Bridging Multilevel and Group-based Approaches Using Growth Mixture Modeling
 J Quant Criminol (2008) 24:1 31 DOI 10.1007/s10940-007-9036-0 ORIGINAL PAPER Analyzing Criminal Trajectory Profiles: Bridging Multilevel and Group-based Approaches Using Growth Mixture Modeling Frauke
Introduction to Random Effects of Time and Model Estimation
 Introduction to Random Effects of Time and Model Estimation Today s Class: The Big Picture Multilevel model notation Fixed vs. random effects of time Random intercept vs. random slope models How MLM =
The Impact of Model Misspecification in Clustered and Continuous Growth Modeling
 The Impact of Model Misspecification in Clustered and Continuous Growth Modeling Daniel J. Bauer Odum Institute for Research in Social Science The University of North Carolina at Chapel Hill Patrick J.
Lecture 4 Multiple linear regression
 Lecture 4 Multiple linear regression BIOST 515 January 15, 2004 Outline 1 Motivation for the multiple regression model Multiple regression in matrix notation Least squares estimation of model parameters
STAT 5500/6500 Conditional Logistic Regression for Matched Pairs
 STAT 5500/6500 Conditional Logistic Regression for Matched Pairs Motivating Example: The data we will be using comes from a subset of data taken from the Los Angeles Study of the Endometrial Cancer Data
Mixed Models for Longitudinal Ordinal and Nominal Outcomes
 Mixed Models for Longitudinal Ordinal and Nominal Outcomes Don Hedeker Department of Public Health Sciences Biological Sciences Division University of Chicago hedeker@uchicago.edu Hedeker, D. (2008). Multilevel
Hierarchical Generalized Linear Models. ERSH 8990 REMS Seminar on HLM Last Lecture!
 Hierarchical Generalized Linear Models ERSH 8990 REMS Seminar on HLM Last Lecture! Hierarchical Generalized Linear Models Introduction to generalized models Models for binary outcomes Interpreting parameter
Mixture Modeling. Identifying the Correct Number of Classes in a Growth Mixture Model. Davood Tofighi Craig Enders Arizona State University
 Identifying the Correct Number of Classes in a Growth Mixture Model Davood Tofighi Craig Enders Arizona State University Mixture Modeling Heterogeneity exists such that the data are comprised of two or
Comparing IRT with Other Models
 Comparing IRT with Other Models Lecture #14 ICPSR Item Response Theory Workshop Lecture #14: 1of 45 Lecture Overview The final set of slides will describe a parallel between IRT and another commonly used
CHAPTER 9 EXAMPLES: MULTILEVEL MODELING WITH COMPLEX SURVEY DATA
 Examples: Multilevel Modeling With Complex Survey Data CHAPTER 9 EXAMPLES: MULTILEVEL MODELING WITH COMPLEX SURVEY DATA Complex survey data refers to data obtained by stratification, cluster sampling and/or
Introduction to lnmle: An R Package for Marginally Specified Logistic-Normal Models for Longitudinal Binary Data
 Introduction to lnmle: An R Package for Marginally Specified Logistic-Normal Models for Longitudinal Binary Data Bryan A. Comstock and Patrick J. Heagerty Department of Biostatistics University of Washington
Categorical Predictor Variables
 Categorical Predictor Variables We often wish to use categorical (or qualitative) variables as covariates in a regression model. For binary variables (taking on only 2 values, e.g. sex), it is relatively
Regression techniques provide statistical analysis of relationships. Research designs may be classified as experimental or observational; regression
 LOGISTIC REGRESSION Regression techniques provide statistical analysis of relationships. Research designs may be classified as eperimental or observational; regression analyses are applicable to both types.
Meta-analysis of epidemiological dose-response studies
 Meta-analysis of epidemiological dose-response studies Nicola Orsini 2nd Italian Stata Users Group meeting October 10-11, 2005 Institute Environmental Medicine, Karolinska Institutet Rino Bellocco Dept.
Tutorial 6: Tutorial on Translating between GLIMMPSE Power Analysis and Data Analysis. Acknowledgements:
 Tutorial 6: Tutorial on Translating between GLIMMPSE Power Analysis and Data Analysis Anna E. Barón, Keith E. Muller, Sarah M. Kreidler, and Deborah H. Glueck Acknowledgements: The project was supported
Regression. Estimation of the linear function (straight line) describing the linear component of the joint relationship between two variables X and Y.
 describing the linear component of the joint relationship between two variables X and Y.") Regression Bivariate i linear regression: Estimation of the linear function (straight line) describing the linear component of the joint relationship between two variables and. Generally describe as a
Regression Bivariate i linear regression: Estimation of the linear function (straight line) describing the linear component of the joint relationship between two variables and. Generally describe as a
Acknowledgements. Outline. Marie Diener-West. ICTR Leadership / Team INTRODUCTION TO CLINICAL RESEARCH. Introduction to Linear Regression
 INTRODUCTION TO CLINICAL RESEARCH Introduction to Linear Regression Karen Bandeen-Roche, Ph.D. July 17, 2012 Acknowledgements Marie Diener-West Rick Thompson ICTR Leadership / Team JHU Intro to Clinical
Moderation 調節 = 交互作用
 Moderation 調節 = 交互作用 Kit-Tai Hau 侯傑泰 JianFang Chang 常建芳 The Chinese University of Hong Kong Based on Marsh, H. W., Hau, K. T., Wen, Z., Nagengast, B., & Morin, A. J. S. (in press). Moderation. In Little,
LISA Short Course Series Generalized Linear Models (GLMs) & Categorical Data Analysis (CDA) in R. Liang (Sally) Shan Nov. 4, 2014
 & Categorical Data Analysis (CDA) in R. Liang (Sally) Shan Nov. 4, 2014") LISA Short Course Series Generalized Linear Models (GLMs) & Categorical Data Analysis (CDA) in R Liang (Sally) Shan Nov. 4, 2014 L Laboratory for Interdisciplinary Statistical Analysis LISA helps VT researchers
LISA Short Course Series Generalized Linear Models (GLMs) & Categorical Data Analysis (CDA) in R Liang (Sally) Shan Nov. 4, 2014 L Laboratory for Interdisciplinary Statistical Analysis LISA helps VT researchers
Statistics Boot Camp. Dr. Stephanie Lane Institute for Defense Analyses DATAWorks 2018
 Statistics Boot Camp Dr. Stephanie Lane Institute for Defense Analyses DATAWorks 2018 March 21, 2018 Outline of boot camp Summarizing and simplifying data Point and interval estimation Foundations of statistical
Longitudinal Modeling with Logistic Regression
 Newsom 1 Longitudinal Modeling with Logistic Regression Longitudinal designs involve repeated measurements of the same individuals over time There are two general classes of analyses that correspond to
Centering Predictor and Mediator Variables in Multilevel and Time-Series Models
 Centering Predictor and Mediator Variables in Multilevel and Time-Series Models Tihomir Asparouhov and Bengt Muthén Part 2 May 7, 2018 Tihomir Asparouhov and Bengt Muthén Part 2 Muthén & Muthén 1/ 42 Overview
Supplemental Materials. In the main text, we recommend graphing physiological values for individual dyad
 1 Supplemental Materials Graphing Values for Individual Dyad Members over Time In the main text, we recommend graphing physiological values for individual dyad members over time to aid in the decision
De-mystifying random effects models
 De-mystifying random effects models Peter J Diggle Lecture 4, Leahurst, October 2012 Linear regression input variable x factor, covariate, explanatory variable,... output variable y response, end-point,
Exogenous Variables and Multiple Groups
 Exogenous Variables and Multiple Groups LGC -- Extension Variables McArdle & Epstein (1987) Growth Model with Exogenous Variable ω 0s z y0 * z ys * ω 0 ω s γ 01 1 γ s1 µ x γ 0x γ sx X σ x 2 y 0 1 1 1 1
2. TRUE or FALSE: Converting the units of one measured variable alters the correlation of between it and a second variable.
 1. The diagnostic plots shown below are from a linear regression that models a patient s score from the SUG-HIGH diabetes risk model as function of their normalized LDL level. a. Based on these plots,
Multilevel Modeling: A Second Course
 Multilevel Modeling: A Second Course Kristopher Preacher, Ph.D. Upcoming Seminar: February 2-3, 2017, Ft. Myers, Florida What this workshop will accomplish I will review the basics of multilevel modeling
Measurement Invariance (MI) in CFA and Differential Item Functioning (DIF) in IRT/IFA
 in CFA and Differential Item Functioning (DIF) in IRT/IFA") Topics: Measurement Invariance (MI) in CFA and Differential Item Functioning (DIF) in IRT/IFA What are MI and DIF? Testing measurement invariance in CFA Testing differential item functioning in IRT/IFA
Topics: Measurement Invariance (MI) in CFA and Differential Item Functioning (DIF) in IRT/IFA What are MI and DIF? Testing measurement invariance in CFA Testing differential item functioning in IRT/IFA
Mixed Effects Models
 Mixed Effects Models What is the effect of X on Y What is the effect of an independent variable on the dependent variable Independent variables are fixed factors. We want to measure their effect Random
SEM Day 3 Lab Exercises SPIDA 2007 Dave Flora
 SEM Day 3 Lab Exercises SPIDA 2007 Dave Flora 1 Today we will see how to estimate SEM conditional latent trajectory models and interpret output using both SAS and LISREL. Exercise 1 Using SAS PROC CALIS,
Ronald Heck Week 14 1 EDEP 768E: Seminar in Categorical Data Modeling (F2012) Nov. 17, 2012
 Nov. 17, 2012") Ronald Heck Week 14 1 From Single Level to Multilevel Categorical Models This week we develop a two-level model to examine the event probability for an ordinal response variable with three categories (persist
Ronald Heck Week 14 1 From Single Level to Multilevel Categorical Models This week we develop a two-level model to examine the event probability for an ordinal response variable with three categories (persist
bmuthen posted on Tuesday, August 23, :06 am The following question appeared on SEMNET Aug 19, 2005.
 Count modeling with different length of exposure uses an offset, that is, a term in the regression which has its coefficient fixed at 1. This can also be used for modeling proportions in that a count is
Bios 6648: Design & conduct of clinical research
 Bios 6648: Design & conduct of clinical research Section 2 - Formulating the scientific and statistical design designs 2.5(b) Binary 2.5(c) Skewed baseline (a) Time-to-event (revisited) (b) Binary (revisited)
Generalized Models: Part 1
 Generalized Models: Part 1 Topics: Introduction to generalized models Introduction to maximum likelihood estimation Models for binary outcomes Models for proportion outcomes Models for categorical outcomes
Measurement Error in Spatial Modeling of Environmental Exposures
 Measurement Error in Spatial Modeling of Environmental Exposures Chris Paciorek, Alexandros Gryparis, and Brent Coull August 9, 2005 Department of Biostatistics Harvard School of Public Health www.biostat.harvard.edu/~paciorek
Regression: Main Ideas Setting: Quantitative outcome with a quantitative explanatory variable. Example, cont.
 TCELL 9/4/205 36-309/749 Experimental Design for Behavioral and Social Sciences Simple Regression Example Male black wheatear birds carry stones to the nest as a form of sexual display. Soler et al. wanted
Interactions among Continuous Predictors
 Interactions among Continuous Predictors Today s Class: Simple main effects within two-way interactions Conquering TEST/ESTIMATE/LINCOM statements Regions of significance Three-way interactions (and beyond
Individualized Treatment Effects with Censored Data via Nonparametric Accelerated Failure Time Models
 Individualized Treatment Effects with Censored Data via Nonparametric Accelerated Failure Time Models Nicholas C. Henderson Thomas A. Louis Gary Rosner Ravi Varadhan Johns Hopkins University July 31, 2018
PRESENTATION TITLE. Is my survey biased? The importance of measurement invariance. Yusuke Kuroki Sunny Moon November 9 th, 2017
 PRESENTATION TITLE Is my survey biased? The importance of measurement invariance Yusuke Kuroki Sunny Moon November 9 th, 2017 Measurement Invariance Measurement invariance: the same construct is being
Describing Within-Person Change over Time
 Describing Within-Person Change over Time Topics: Multilevel modeling notation and terminology Fixed and random effects of linear time Predicted variances and covariances from random slopes Dependency
Introduction to Confirmatory Factor Analysis
 Introduction to Confirmatory Factor Analysis Multivariate Methods in Education ERSH 8350 Lecture #12 November 16, 2011 ERSH 8350: Lecture 12 Today s Class An Introduction to: Confirmatory Factor Analysis
Exam Applied Statistical Regression. Good Luck!
 Dr. M. Dettling Summer 2011 Exam Applied Statistical Regression Approved: Tables: Note: Any written material, calculator (without communication facility). Attached. All tests have to be done at the 5%-level.
Lecture 3.1 Basic Logistic LDA
 y Lecture.1 Basic Logistic LDA 0.2.4.6.8 1 Outline Quick Refresher on Ordinary Logistic Regression and Stata Women s employment example Cross-Over Trial LDA Example -100-50 0 50 100 -- Longitudinal Data
Statistics in medicine
 Statistics in medicine Lecture 4: and multivariable regression Fatma Shebl, MD, MS, MPH, PhD Assistant Professor Chronic Disease Epidemiology Department Yale School of Public Health Fatma.shebl@yale.edu
Latent class analysis and finite mixture models with Stata
 Latent class analysis and finite mixture models with Stata Isabel Canette Principal Mathematician and Statistician StataCorp LLC 2017 Stata Users Group Meeting Madrid, October 19th, 2017 Introduction Latent
36-309/749 Experimental Design for Behavioral and Social Sciences. Sep. 22, 2015 Lecture 4: Linear Regression
 36-309/749 Experimental Design for Behavioral and Social Sciences Sep. 22, 2015 Lecture 4: Linear Regression TCELL Simple Regression Example Male black wheatear birds carry stones to the nest as a form
Variable-Specific Entropy Contribution
 Variable-Specific Entropy Contribution Tihomir Asparouhov and Bengt Muthén June 19, 2018 In latent class analysis it is useful to evaluate a measurement instrument in terms of how well it identifies the
SAS Syntax and Output for Data Manipulation:
 CLP 944 Example 5 page 1 Practice with Fixed and Random Effects of Time in Modeling Within-Person Change The models for this example come from Hoffman (2015) chapter 5. We will be examining the extent
Nemours Biomedical Research Statistics Course. Li Xie Nemours Biostatistics Core October 14, 2014
 Nemours Biomedical Research Statistics Course Li Xie Nemours Biostatistics Core October 14, 2014 Outline Recap Introduction to Logistic Regression Recap Descriptive statistics Variable type Example of
Introduction to SAS proc mixed
 Faculty of Health Sciences Introduction to SAS proc mixed Analysis of repeated measurements, 2017 Julie Forman Department of Biostatistics, University of Copenhagen Outline Data in wide and long format
R E S E A R C H T R I A N G L E P A R K, N O R T H C A R O L I N A
 R E S E A R C H T R I A N G L E P A R K, N O R T H C A R O L I N A Simultaneous Modeling of Multiple Outcomes over Time: A Hierarchical Modeling Approach Abhik Das1, Charlotte Gard1, Henrietta Bada2 and
CHAPTER 3. SPECIALIZED EXTENSIONS
 03-Preacher-45609:03-Preacher-45609.qxd 6/3/2008 3:36 PM Page 57 CHAPTER 3. SPECIALIZED EXTENSIONS We have by no means exhausted the possibilities of LGM with the examples presented thus far. As scientific
Introduction to Structural Equation Modeling
 Introduction to Structural Equation Modeling Notes Prepared by: Lisa Lix, PhD Manitoba Centre for Health Policy Topics Section I: Introduction Section II: Review of Statistical Concepts and Regression
Does low participation in cohort studies induce bias? Additional material
 Does low participation in cohort studies induce bias? Additional material Content: Page 1: A heuristic proof of the formula for the asymptotic standard error Page 2-3: A description of the simulation study
Correlation and Regression
 Correlation and Regression October 25, 2017 STAT 151 Class 9 Slide 1 Outline of Topics 1 Associations 2 Scatter plot 3 Correlation 4 Regression 5 Testing and estimation 6 Goodness-of-fit STAT 151 Class