Basic Medical Statistics Course
|
|
|
- Julius Hall
- 6 years ago
- Views:
Transcription
1 Basic Medical Statistics Course S7 Logistic Regression November 2015 Wilma Heemsbergen
 instead of quantitative (with an unlimited range). The relationship is in this case between explanatory variables and probability (1).")
2 Logistic Regression The concept of a relationship between the distribution of a dependent variable and a number of explanatory variables is also valid when the dependent variable is qualitative (0 or 1) instead of quantitative (with an unlimited range). The relationship is in this case between explanatory variables and probability (1). This cannot be a linear relationship, since probabilities have boundaries 0 and 1. Examples: dead / alive side effect / no side effect disease / no disease 2
3 Examples Dataset N=24 (BMI, Blood Pressure, Diabetes) BMI BloodPr BMI BloodPr Is BMI (x) predictive for Blood Pressure (y)? Linear Regression Model BMI Diabetes BMI Diabetes Is BMI (x) predictive for Diabetes (y)? Linear Regression Model not appropriate 3
4 Scatter Plots Clear pattern. We can fit a regression line. There is a pattern, but this is far from optimal for a linear regression model. 4
 and calculate the proportion of diabetes cases within each bin.")
5 Relationship BMI - Diabetes 3/7=43% 2/17=12% We can make the relationship visible in a simple way, by binning the BMI (e.g. <30, 30) and calculate the proportion of diabetes cases within each bin. 5
 as function of BMI. 6")
6 Relationship: Logistic Regression The logistic regression model fits the data into a probability (DIAB=1) as function of BMI. 6
7 Linear vs Logistic Regression Linear regression: Outcome is a continuous (dependent) variable Y which we try to predict / explain by an independent variable(s) X. Binary logistic regression: Outcome is a binary (0,1) (dependent) variable Y which we try to predict / explain by an independent variable(s) X. In order to fit this relationship into the framework of linear regression, we need a transformation (the link function). 7
8 Method of Logistic Regression In logistic regression, we model the odds : ln p 1 p ln odds, log odds, logit = β0 + β1x1 + β2x2 p = proportion/probability of 1 1 p = proportion/probability of 0 Probability (1 X1,X2,..) = eβ0 + β1x1 + β2x2 1 + eβ0 + β1x1 + β2x2 e=
9 Relationship :Logit - Probability The value of the logit is not restricted. Probability is restricted (between 0 1). Probability Logit (β0 + β1x1 + β2x2 ) 9
10 Odds Previous data: Disease/Exposure BMI 30 BMI <30 Diabetes + A n=3 B n=2 Diabetes - C n=4 D n=15 exposed = BMI 30, not exposed = BMI <30. Odds p/(1-p) = A/C for exposed (3/4=0.75) = B/D for not exposed (2/15= 0.13) Odds ratio = the ratio of odds exposed / odd not exposed (in this case: 0.75 / 0.13 = 5.77) 10
11 Ratios Odds Ratio (OR) = Odds exposed Odds unexposed OR equal to 1 indicates a similar risk for the two groups OR > 1 indicates that the risk is higher in the exposed group. OR < 1 indicates that the risk is lower in the exposed group. The OR can be interpreted as an estimate of the relative risk in case the disease under study is rare. 11
12 Maximum Likelihood Method The maximum likelihood method is a method of estimation to fit the parameters (i.e. estimation of the regression coefficients and its standard errors), which are the most likely values given the data. The maximum likelihood estimates of the regression coefficients are those values that maximize the likelihood : the values for which the data are most likely to occur. Likelihood: product of all probabilities over all individuals. The procedure for fitting a model involves iteration: repeating calculations until a stable solution is reached. 12
13 Examples Linear Regression BMI as predictor for Blood Pressure. Function: Y= constant + B*BMI. Logistic Regression BMI as predictor for Diabetes. / Function: Prob(Y=1)= e constant +B*BMI /(1+ e constant +B*BMI ) 13
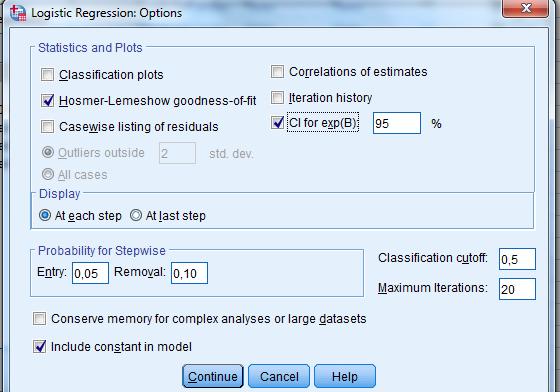
14 Goodness of Fit Hosmer and Lemeshow Test This test evaluates the goodness-of-fit by creating 10 ordered groups, comparing the observed to the predicted no. of cases. Test statistic is chi-square statistic. Non-significance indicates that the model prediction does not significantly differ from the observed, i.e.: the model is appropriate. Significance indicates that the model prediction does sign. differ from the observed data, i.e.: the model is not appropriate for the data. 14
15 Goodness of Fit Output Example output with BMI Diabetes data. SPSS: Tick the box at options 15
16 Explained variance There are several pseudo R Square methods to estimate the explained variance in the model. Model performance is estimated by measuring the distances between predicted and actual outcome. Higher values of R Square indicate better fit. Example of SPSS output with Diabetes BMI Data : SPSS: by default in output 16
17 Variable Types In logistic regression, a variable is analyzed as a continuous variable or a categorical variable. Continuous variable: for each increase of 1 unit, the same regression coefficient is estimated. So the Odds Ratio is the Ratio of the Odds for value X with the Odds of value X-1 as the reference. Categorical variable: for each category, a separate regression coefficient is estimated, with the reference category as a reference. The reference category has to be chosen (in SPSS it can be the lowest or highest value). Binary variables and ordinal variables: they should be handled as categorical variables (rule of thumb: ordinal variables with >7 levels, could be handled as continuous as well). In case of (too) many categories, or categories with few observations, you can merge categories. 17
18 Example Dummies In case of categorical data, we need dummies. These are automatically coded by SPSS and you can find the codings in the output. Example of dummies for tumor stages in lung cancer are shown below. Merging of categories would be better. (dependent is recurrence ) 18
19 Models with >1 Covariate The purpose of models with >1 covariates, can be: 1) unbiased estimate of B for the covariate of interest, or 2) obtain a multivariate model with all the significant predictors. No. of events is limiting the maximum number of covariates you can include in the model. Rule of thumb: at least 10 events per covariate (which is a rough indication when you might run into trouble). This is a guideline first provided by Hosmer and Lemeshow. Case to Variable ratios: general rule of thumb is 20 to 1. Stepwise method (forward conditional in SPSS): variables are selected in the order in which they maximize the statistically significant contribution to the model. 19
 uses the ratio of the maximized value of the likelihood function for the full model (L 1 ) over the maximized value of the likelihood")
20 Nested Models Does a model significantly improve (i.e. better goodness of fit), adding other covariate(s)? The likelihood ratio test (based on Chisquare statistics) uses the ratio of the maximized value of the likelihood function for the full model (L 1 ) over the maximized value of the likelihood function for the simpler/reduced model (L 0 ). = 2 [ LL (model L 1 ) LL(model L 0 )], with df = # parameters model 2 # parameters model 1 20
21 Overview Linear vs Logistic Regression Lin Reg Log Reg Normality is assumed / prerequisite yes no Outliers can be a problem yes yes Multicollinearity can be a problem yes yes Create dummy variables is needed yes no (SPSS coded) Extrapolation can be tricky yes yes 21

22 SPSS Analyze - Regression Binary logistic Univariate analysis: 1 covariate in the model. 22

23 SPSS Submenus 23
24 SPSS Output SPSS runs the logistic regression in two steps: Block 0: Beginning Block. No predictors are included, only the constant (also named intercept ). It includes a table Variables not in the Equation, where it is predicted whether an independent predictive variables that is not included yet, would be significant in the model. Block 1: Method=Enter. Method=Enter is the default. This is the interesting part of the output where you can find the results for the covariate(s) you are investigating. It includes (by default) a Table Variables in the equation where you can find the estimates for the constant and B. 24
25 SPSS Output 25
26 SPSS Output Comparison between model with covariate and model with only constant (likelihood ratio test), with H0: no difference between model with covariate (which is rejected). If we ask SPSS for a stepwise model, these rows would also compare 2LLs of newest model with previous one. Wald Statistic: test the statistical significance of each coefficient (b) in the model, and is based on Z statistics. 26
27 SPSS Output The overall Percentage correct in Block 0 (by chance) was already 75%. This Table gives information whether or not the covariates are useful predictors to separate (distinguish) the cases into 0 and 1. 27
28 Interpretation Sig. indicates the probability of the Wald statistic: the null hypothesis of b=0 is rejected since p < Exp(B) is the Odds Ratio for a unit increase. A value of 1.24 implies a relative increase of the odds of +24%, for each unit increase. In this case, 1 unit = 1 kg / cm 2 (BMI). increase of BMI from 22 to 23: odds increases +24%. increase of BMI from 33 to 34: odds increases +24%. 28
29 Numerical problems Issues that can affect the accuracy of the estimation of B: Multicollinearity among the independent variables. Complete separation' whereby the two groups in the dependent event variable can be perfectly separated by scores on one of the independent variables. Zero cells for a dummy-coded independent variable because all of the subjects have the same value for the variable. Output that indicate numerical problems should not be interpreted. 29
30 Multicollinearity 2 covariates with high correlation (Pearson correlation = 0.99). We put them separately and together in the Logistic Regression Model. We can detect the problem by examining the errors (S.E.): it has become much larger. 30

31 Separation 1 covariate perfectly predicts outcome: no results in SPSS. 1 covariate almost perfectly predicts outcome. We can detect the problem by examining the error (S.E.): it is large (as well as the Exp(B)). 31
32 Category with 1 value 1 covariate has a category with only 1 outcome value. We can detect the problem by examining the error (S.E.): it is large. 32
33 Example We have a data set of lung cancer patients who received radiotherapy and chemotherapy. Some patients developed esophagitis (inflammation of esophagus. Research Questions Is development of this toxicity associated with dose to the esophagus? If yes, which dose levels are predictive? (we will look at 2 dose variables). Is this toxicity associated with chemotherapy? Does the model significantly improve, when we add chemotherapy to a model with the dose variable Vol30Gy? Is the Goodness of Fit acceptable?! SPSS will automatically predict the highest value of the binary outcome var. So we have to code for example 0=no tox, 1=tox. 33
 for 2 dose parameters")
34 Example: results I Results (univariate) for 2 dose parameters V30 V60 34
35 Example: results II Results (univariate) for concurrent chemotherapy (0=no, 1=yes). First table: reference category = first category. Second table: with last category as reference. 35

36 Example: results II SPSS default: reference = last category. Reference = first: tick box & push change. 36
37 Example Nested Model Results (nested model) for Vol30Gy and concurrent chemotherapy. Stepwise model (method = Forward Conditional). The minimum ratio of valid cases to independent variables for stepwise logistic regression is 10 to 1. Likelihood ratio test: model significantly improves. 37
38 Example Nested Model Goodness of Fit (comparing observed and expected no. of cases) Non significance indicates that the model is appropriate. 38

39 Example Nested Model You can obtain a summary of all steps by choosing at last step. In the Step Summary table we see which variable was added or removed at each step. 39
40 Research questions Research Questions Is development of esophagitis associated with dose to the esophagus? yes, we found a statistical significant relationship between dose and esophagitis the model significantly improved adding a dose variable, the estimated B was significant, there were no signs of numerical problems. If yes, which dose levels are predictive? both investigated dose levels were predictive. Is this toxicity associated with chemotherapy? yes Does the model significantly improve, when we add chemotherapy to a model with Vol30Gy? Yes, the likelihood ratio test of the extended model compared to the model with 1 covariate, indicated that the model significantly improved. The Goodness of Fit was acceptable. 40
41 Final Remarks Logistic Regression is a tool to analyze the effect of covariates on a binary outcome. In Logistic Regression, we assume that follow up time is constant or not an issue, for the studied outcome. If this is not the case: Cox Regression (lecture on Friday). We have looked at Unconditional Binary Logistic Regression. Other types of Logistic Regression: Mutinomial & Ordinal Logistic Regression. Conditional (binary) Logistic Regression. 41
42 Practical Head & Neck cancer patients treated with chemoradiation are at risk for developing trismus (reduced maximum mouth opening < 35 mm) as a result of damaged muscles used for opening and closing the mouth. When the tumor is close to these muscles, it will receive radiation dose as well. In the practical, we are going to investigate whether the dose delivered to the Masseter Muscle is predictive for developing Trismus. The Masseter is a bilateral muscle (left and right), involved in mouth opening. We have data on the mean dose to the ipsilateral muscle (at the tumor site, i.e. the muscle receiving the highest dose), and the mean dose to the contralateral muscle (i.e. the masseter muscle receiving the lowest dose). The database also contains a quantitative / continuous outcome (reduction of mouth opening), next to the qualitative / binary outcome of Trismus (0, 1). 42
Correlation and regression
 1 Correlation and regression Yongjua Laosiritaworn Introductory on Field Epidemiology 6 July 2015, Thailand Data 2 Illustrative data (Doll, 1955) 3 Scatter plot 4 Doll, 1955 5 6 Correlation coefficient,
Logistic Regression. Continued Psy 524 Ainsworth
 Logistic Regression Continued Psy 524 Ainsworth Equations Regression Equation Y e = 1 + A+ B X + B X + B X 1 1 2 2 3 3 i A+ B X + B X + B X e 1 1 2 2 3 3 Equations The linear part of the logistic regression
2/26/2017. PSY 512: Advanced Statistics for Psychological and Behavioral Research 2
 PSY 512: Advanced Statistics for Psychological and Behavioral Research 2 When and why do we use logistic regression? Binary Multinomial Theory behind logistic regression Assessing the model Assessing predictors
Statistics in medicine
 Statistics in medicine Lecture 4: and multivariable regression Fatma Shebl, MD, MS, MPH, PhD Assistant Professor Chronic Disease Epidemiology Department Yale School of Public Health Fatma.shebl@yale.edu
Stat 642, Lecture notes for 04/12/05 96
 Stat 642, Lecture notes for 04/12/05 96 Hosmer-Lemeshow Statistic The Hosmer-Lemeshow Statistic is another measure of lack of fit. Hosmer and Lemeshow recommend partitioning the observations into 10 equal
Chapter 19: Logistic regression
 Chapter 19: Logistic regression Self-test answers SELF-TEST Rerun this analysis using a stepwise method (Forward: LR) entry method of analysis. The main analysis To open the main Logistic Regression dialog
Investigating Models with Two or Three Categories
 Ronald H. Heck and Lynn N. Tabata 1 Investigating Models with Two or Three Categories For the past few weeks we have been working with discriminant analysis. Let s now see what the same sort of model might
Dependent Variable Q83: Attended meetings of your town or city council (0=no, 1=yes)
") Logistic Regression Kristi Andrasik COM 731 Spring 2017. MODEL all data drawn from the 2006 National Community Survey (class data set) BLOCK 1 (Stepwise) Lifestyle Values Q7: Value work Q8: Value friends
Logistic Regression Kristi Andrasik COM 731 Spring 2017. MODEL all data drawn from the 2006 National Community Survey (class data set) BLOCK 1 (Stepwise) Lifestyle Values Q7: Value work Q8: Value friends
Analysis of Categorical Data. Nick Jackson University of Southern California Department of Psychology 10/11/2013
 Analysis of Categorical Data Nick Jackson University of Southern California Department of Psychology 10/11/2013 1 Overview Data Types Contingency Tables Logit Models Binomial Ordinal Nominal 2 Things not
Machine Learning Linear Classification. Prof. Matteo Matteucci
 Machine Learning Linear Classification Prof. Matteo Matteucci Recall from the first lecture 2 X R p Regression Y R Continuous Output X R p Y {Ω 0, Ω 1,, Ω K } Classification Discrete Output X R p Y (X)
Advanced Quantitative Data Analysis
 Chapter 24 Advanced Quantitative Data Analysis Daniel Muijs Doing Regression Analysis in SPSS When we want to do regression analysis in SPSS, we have to go through the following steps: 1 As usual, we choose
Multiple linear regression S6
 Basic medical statistics for clinical and experimental research Multiple linear regression S6 Katarzyna Jóźwiak k.jozwiak@nki.nl November 15, 2017 1/42 Introduction Two main motivations for doing multiple
7. Assumes that there is little or no multicollinearity (however, SPSS will not assess this in the [binary] Logistic Regression procedure).
![7. Assumes that there is little or no multicollinearity (however, SPSS will not assess this in the [binary] Logistic Regression procedure).](/thumbs/78/76973644.jpg "7. Assumes that there is little or no multicollinearity (however, SPSS will not assess this in the [binary] Logistic Regression procedure).") 1 Neuendorf Logistic Regression The Model: Y Assumptions: 1. Metric (interval/ratio) data for 2+ IVs, and dichotomous (binomial; 2-value), categorical/nominal data for a single DV... bear in mind that
1 Neuendorf Logistic Regression The Model: Y Assumptions: 1. Metric (interval/ratio) data for 2+ IVs, and dichotomous (binomial; 2-value), categorical/nominal data for a single DV... bear in mind that
Introduction to logistic regression
 Introduction to logistic regression Tuan V. Nguyen Professor and NHMRC Senior Research Fellow Garvan Institute of Medical Research University of New South Wales Sydney, Australia What we are going to learn
Analysing data: regression and correlation S6 and S7
 Basic medical statistics for clinical and experimental research Analysing data: regression and correlation S6 and S7 K. Jozwiak k.jozwiak@nki.nl 2 / 49 Correlation So far we have looked at the association
Lecture 12: Effect modification, and confounding in logistic regression
 Lecture 12: Effect modification, and confounding in logistic regression Ani Manichaikul amanicha@jhsph.edu 4 May 2007 Today Categorical predictor create dummy variables just like for linear regression
STAT 7030: Categorical Data Analysis
 STAT 7030: Categorical Data Analysis 5. Logistic Regression Peng Zeng Department of Mathematics and Statistics Auburn University Fall 2012 Peng Zeng (Auburn University) STAT 7030 Lecture Notes Fall 2012
Chapter 6. Logistic Regression. 6.1 A linear model for the log odds
 Chapter 6 Logistic Regression In logistic regression, there is a categorical response variables, often coded 1=Yes and 0=No. Many important phenomena fit this framework. The patient survives the operation,
8 Nominal and Ordinal Logistic Regression
 8 Nominal and Ordinal Logistic Regression 8.1 Introduction If the response variable is categorical, with more then two categories, then there are two options for generalized linear models. One relies on
Class Notes: Week 8. Probit versus Logit Link Functions and Count Data
 Ronald Heck Class Notes: Week 8 1 Class Notes: Week 8 Probit versus Logit Link Functions and Count Data This week we ll take up a couple of issues. The first is working with a probit link function. While
EDF 7405 Advanced Quantitative Methods in Educational Research. Data are available on IQ of the child and seven potential predictors.
 EDF 7405 Advanced Quantitative Methods in Educational Research Data are available on IQ of the child and seven potential predictors. Four are medical variables available at the birth of the child: Birthweight
Multinomial Logistic Regression Models
 Stat 544, Lecture 19 1 Multinomial Logistic Regression Models Polytomous responses. Logistic regression can be extended to handle responses that are polytomous, i.e. taking r>2 categories. (Note: The word
Simple logistic regression
 Simple logistic regression Biometry 755 Spring 2009 Simple logistic regression p. 1/47 Model assumptions 1. The observed data are independent realizations of a binary response variable Y that follows a
Review: what is a linear model. Y = β 0 + β 1 X 1 + β 2 X 2 + A model of the following form:
 Outline for today What is a generalized linear model Linear predictors and link functions Example: fit a constant (the proportion) Analysis of deviance table Example: fit dose-response data using logistic
Model Based Statistics in Biology. Part V. The Generalized Linear Model. Chapter 18.1 Logistic Regression (Dose - Response)
") Model Based Statistics in Biology. Part V. The Generalized Linear Model. Logistic Regression ( - Response) ReCap. Part I (Chapters 1,2,3,4), Part II (Ch 5, 6, 7) ReCap Part III (Ch 9, 10, 11), Part IV
Model Based Statistics in Biology. Part V. The Generalized Linear Model. Logistic Regression ( - Response) ReCap. Part I (Chapters 1,2,3,4), Part II (Ch 5, 6, 7) ReCap Part III (Ch 9, 10, 11), Part IV
Logistic Regression. Interpretation of linear regression. Other types of outcomes. 0-1 response variable: Wound infection. Usual linear regression
 Logistic Regression Usual linear regression (repetition) y i = b 0 + b 1 x 1i + b 2 x 2i + e i, e i N(0,σ 2 ) or: y i N(b 0 + b 1 x 1i + b 2 x 2i,σ 2 ) Example (DGA, p. 336): E(PEmax) = 47.355 + 1.024
Procedia - Social and Behavioral Sciences 109 ( 2014 )
") Available online at www.sciencedirect.com ScienceDirect Procedia - Social and Behavioral Sciences 09 ( 04 ) 730 736 nd World Conference On Business, Economics And Management - WCBEM 03 Categorical Principal
Available online at www.sciencedirect.com ScienceDirect Procedia - Social and Behavioral Sciences 09 ( 04 ) 730 736 nd World Conference On Business, Economics And Management - WCBEM 03 Categorical Principal
Hierarchical Generalized Linear Models. ERSH 8990 REMS Seminar on HLM Last Lecture!
 Hierarchical Generalized Linear Models ERSH 8990 REMS Seminar on HLM Last Lecture! Hierarchical Generalized Linear Models Introduction to generalized models Models for binary outcomes Interpreting parameter
Binary Logistic Regression
 The coefficients of the multiple regression model are estimated using sample data with k independent variables Estimated (or predicted) value of Y Estimated intercept Estimated slope coefficients Ŷ = b
LOGISTICS REGRESSION FOR SAMPLE SURVEYS
 4 LOGISTICS REGRESSION FOR SAMPLE SURVEYS Hukum Chandra Indian Agricultural Statistics Research Institute, New Delhi-002 4. INTRODUCTION Researchers use sample survey methodology to obtain information
Binary Dependent Variables
 Binary Dependent Variables In some cases the outcome of interest rather than one of the right hand side variables - is discrete rather than continuous Binary Dependent Variables In some cases the outcome
Categorical data analysis Chapter 5
 Categorical data analysis Chapter 5 Interpreting parameters in logistic regression The sign of β determines whether π(x) is increasing or decreasing as x increases. The rate of climb or descent increases
Logistic Regression: Regression with a Binary Dependent Variable
 Logistic Regression: Regression with a Binary Dependent Variable LEARNING OBJECTIVES Upon completing this chapter, you should be able to do the following: State the circumstances under which logistic regression
SOS3003 Applied data analysis for social science Lecture note Erling Berge Department of sociology and political science NTNU.
 SOS3003 Applied data analysis for social science Lecture note 08-00 Erling Berge Department of sociology and political science NTNU Erling Berge 00 Literature Logistic regression II Hamilton Ch 7 p7-4
Chapter 19: Logistic regression
 Chapter 19: Logistic regression Smart Alex s Solutions Task 1 A display rule refers to displaying an appropriate emotion in a given situation. For example, if you receive a Christmas present that you don
Logistic Regression. Building, Interpreting and Assessing the Goodness-of-fit for a logistic regression model
 Logistic Regression In previous lectures, we have seen how to use linear regression analysis when the outcome/response/dependent variable is measured on a continuous scale. In this lecture, we will assume
More Statistics tutorial at Logistic Regression and the new:
 Logistic Regression and the new: Residual Logistic Regression 1 Outline 1. Logistic Regression 2. Confounding Variables 3. Controlling for Confounding Variables 4. Residual Linear Regression 5. Residual
Models for Binary Outcomes
 Models for Binary Outcomes Introduction The simple or binary response (for example, success or failure) analysis models the relationship between a binary response variable and one or more explanatory variables.
Section IX. Introduction to Logistic Regression for binary outcomes. Poisson regression
 Section IX Introduction to Logistic Regression for binary outcomes Poisson regression 0 Sec 9 - Logistic regression In linear regression, we studied models where Y is a continuous variable. What about
WORKSHOP 3 Measuring Association
 WORKSHOP 3 Measuring Association Concepts Analysing Categorical Data o Testing of Proportions o Contingency Tables & Tests o Odds Ratios Linear Association Measures o Correlation o Simple Linear Regression
BMI 541/699 Lecture 22
 BMI 541/699 Lecture 22 Where we are: 1. Introduction and Experimental Design 2. Exploratory Data Analysis 3. Probability 4. T-based methods for continous variables 5. Power and sample size for t-based
Generalized linear models
 Generalized linear models Outline for today What is a generalized linear model Linear predictors and link functions Example: estimate a proportion Analysis of deviance Example: fit dose- response data
STA6938-Logistic Regression Model
 Dr. Ying Zhang STA6938-Logistic Regression Model Topic 2-Multiple Logistic Regression Model Outlines:. Model Fitting 2. Statistical Inference for Multiple Logistic Regression Model 3. Interpretation of
Unit 11: Multiple Linear Regression
 Unit 11: Multiple Linear Regression Statistics 571: Statistical Methods Ramón V. León 7/13/2004 Unit 11 - Stat 571 - Ramón V. León 1 Main Application of Multiple Regression Isolating the effect of a variable
Lecture 14: Introduction to Poisson Regression
 Lecture 14: Introduction to Poisson Regression Ani Manichaikul amanicha@jhsph.edu 8 May 2007 1 / 52 Overview Modelling counts Contingency tables Poisson regression models 2 / 52 Modelling counts I Why
Modelling counts. Lecture 14: Introduction to Poisson Regression. Overview
 Modelling counts I Lecture 14: Introduction to Poisson Regression Ani Manichaikul amanicha@jhsph.edu Why count data? Number of traffic accidents per day Mortality counts in a given neighborhood, per week
Hypothesis Testing, Power, Sample Size and Confidence Intervals (Part 2)
") Hypothesis Testing, Power, Sample Size and Confidence Intervals (Part 2) B.H. Robbins Scholars Series June 23, 2010 1 / 29 Outline Z-test χ 2 -test Confidence Interval Sample size and power Relative effect
Hypothesis Testing, Power, Sample Size and Confidence Intervals (Part 2) B.H. Robbins Scholars Series June 23, 2010 1 / 29 Outline Z-test χ 2 -test Confidence Interval Sample size and power Relative effect
BIOSTATS Intermediate Biostatistics Spring 2017 Exam 2 (Units 3, 4 & 5) Practice Problems SOLUTIONS
 Practice Problems SOLUTIONS") BIOSTATS 640 - Intermediate Biostatistics Spring 2017 Exam 2 (Units 3, 4 & 5) Practice Problems SOLUTIONS Practice Question 1 Both the Binomial and Poisson distributions have been used to model the quantal
BIOSTATS 640 - Intermediate Biostatistics Spring 2017 Exam 2 (Units 3, 4 & 5) Practice Problems SOLUTIONS Practice Question 1 Both the Binomial and Poisson distributions have been used to model the quantal
Analysing categorical data using logit models
 Analysing categorical data using logit models Graeme Hutcheson, University of Manchester The lecture notes, exercises and data sets associated with this course are available for download from: www.research-training.net/manchester
CHAPTER 1: BINARY LOGIT MODEL
 CHAPTER 1: BINARY LOGIT MODEL Prof. Alan Wan 1 / 44 Table of contents 1. Introduction 1.1 Dichotomous dependent variables 1.2 Problems with OLS 3.3.1 SAS codes and basic outputs 3.3.2 Wald test for individual
Chapter 22: Log-linear regression for Poisson counts
 Chapter 22: Log-linear regression for Poisson counts Exposure to ionizing radiation is recognized as a cancer risk. In the United States, EPA sets guidelines specifying upper limits on the amount of exposure
Correlation and simple linear regression S5
 Basic medical statistics for clinical and eperimental research Correlation and simple linear regression S5 Katarzyna Jóźwiak k.jozwiak@nki.nl November 15, 2017 1/41 Introduction Eample: Brain size and
ADVANCED STATISTICAL ANALYSIS OF EPIDEMIOLOGICAL STUDIES. Cox s regression analysis Time dependent explanatory variables
 ADVANCED STATISTICAL ANALYSIS OF EPIDEMIOLOGICAL STUDIES Cox s regression analysis Time dependent explanatory variables Henrik Ravn Bandim Health Project, Statens Serum Institut 4 November 2011 1 / 53
LOGISTIC REGRESSION. Lalmohan Bhar Indian Agricultural Statistics Research Institute, New Delhi
 LOGISTIC REGRESSION Lalmohan Bhar Indian Agricultural Statistics Research Institute, New Delhi- lmbhar@gmail.com. Introduction Regression analysis is a method for investigating functional relationships
Statistical Modelling with Stata: Binary Outcomes
 Statistical Modelling with Stata: Binary Outcomes Mark Lunt Arthritis Research UK Epidemiology Unit University of Manchester 21/11/2017 Cross-tabulation Exposed Unexposed Total Cases a b a + b Controls
STAT 5500/6500 Conditional Logistic Regression for Matched Pairs
 STAT 5500/6500 Conditional Logistic Regression for Matched Pairs Motivating Example: The data we will be using comes from a subset of data taken from the Los Angeles Study of the Endometrial Cancer Data
Introduction to the Logistic Regression Model
 CHAPTER 1 Introduction to the Logistic Regression Model 1.1 INTRODUCTION Regression methods have become an integral component of any data analysis concerned with describing the relationship between a response
Review of the General Linear Model
 Review of the General Linear Model EPSY 905: Multivariate Analysis Online Lecture #2 Learning Objectives Types of distributions: Ø Conditional distributions The General Linear Model Ø Regression Ø Analysis
Practical Biostatistics
 Practical Biostatistics Clinical Epidemiology, Biostatistics and Bioinformatics AMC Multivariable regression Day 5 Recap Describing association: Correlation Parametric technique: Pearson (PMCC) Non-parametric:
ST3241 Categorical Data Analysis I Multicategory Logit Models. Logit Models For Nominal Responses
 ST3241 Categorical Data Analysis I Multicategory Logit Models Logit Models For Nominal Responses 1 Models For Nominal Responses Y is nominal with J categories. Let {π 1,, π J } denote the response probabilities
Glossary. The ISI glossary of statistical terms provides definitions in a number of different languages:
 Glossary The ISI glossary of statistical terms provides definitions in a number of different languages: http://isi.cbs.nl/glossary/index.htm Adjusted r 2 Adjusted R squared measures the proportion of the
Chapter 5: Logistic Regression-I
 : Logistic Regression-I Dipankar Bandyopadhyay Department of Biostatistics, Virginia Commonwealth University BIOS 625: Categorical Data & GLM [Acknowledgements to Tim Hanson and Haitao Chu] D. Bandyopadhyay
REVIEW 8/2/2017 陈芳华东师大英语系
 REVIEW Hypothesis testing starts with a null hypothesis and a null distribution. We compare what we have to the null distribution, if the result is too extreme to belong to the null distribution (p
Multiple linear regression
 Multiple linear regression Course MF 930: Introduction to statistics June 0 Tron Anders Moger Department of biostatistics, IMB University of Oslo Aims for this lecture: Continue where we left off. Repeat
Logistic Regression Models to Integrate Actuarial and Psychological Risk Factors For predicting 5- and 10-Year Sexual and Violent Recidivism Rates
 Logistic Regression Models to Integrate Actuarial and Psychological Risk Factors For predicting 5- and 10-Year Sexual and Violent Recidivism Rates WI-ATSA June 2-3, 2016 Overview Brief description of logistic
Multilevel Models in Matrix Form. Lecture 7 July 27, 2011 Advanced Multivariate Statistical Methods ICPSR Summer Session #2
 Multilevel Models in Matrix Form Lecture 7 July 27, 2011 Advanced Multivariate Statistical Methods ICPSR Summer Session #2 Today s Lecture Linear models from a matrix perspective An example of how to do
Model Estimation Example
 Ronald H. Heck 1 EDEP 606: Multivariate Methods (S2013) April 7, 2013 Model Estimation Example As we have moved through the course this semester, we have encountered the concept of model estimation. Discussions
EPSY 905: Fundamentals of Multivariate Modeling Online Lecture #7
 Introduction to Generalized Univariate Models: Models for Binary Outcomes EPSY 905: Fundamentals of Multivariate Modeling Online Lecture #7 EPSY 905: Intro to Generalized In This Lecture A short review
Exam Applied Statistical Regression. Good Luck!
 Dr. M. Dettling Summer 2011 Exam Applied Statistical Regression Approved: Tables: Note: Any written material, calculator (without communication facility). Attached. All tests have to be done at the 5%-level.
Chapter 1 Statistical Inference
 Chapter 1 Statistical Inference causal inference To infer causality, you need a randomized experiment (or a huge observational study and lots of outside information). inference to populations Generalizations
Binomial Model. Lecture 10: Introduction to Logistic Regression. Logistic Regression. Binomial Distribution. n independent trials
 Lecture : Introduction to Logistic Regression Ani Manichaikul amanicha@jhsph.edu 2 May 27 Binomial Model n independent trials (e.g., coin tosses) p = probability of success on each trial (e.g., p =! =
Using the same data as before, here is part of the output we get in Stata when we do a logistic regression of Grade on Gpa, Tuce and Psi.
 Logistic Regression, Part III: Hypothesis Testing, Comparisons to OLS Richard Williams, University of Notre Dame, https://www3.nd.edu/~rwilliam/ Last revised January 14, 2018 This handout steals heavily
Introducing Generalized Linear Models: Logistic Regression
 Ron Heck, Summer 2012 Seminars 1 Multilevel Regression Models and Their Applications Seminar Introducing Generalized Linear Models: Logistic Regression The generalized linear model (GLM) represents and
Lecture 10: Introduction to Logistic Regression
 Lecture 10: Introduction to Logistic Regression Ani Manichaikul amanicha@jhsph.edu 2 May 2007 Logistic Regression Regression for a response variable that follows a binomial distribution Recall the binomial
Logistic Regression. Fitting the Logistic Regression Model BAL040-A.A.-10-MAJ
 Logistic Regression The goal of a logistic regression analysis is to find the best fitting and most parsimonious, yet biologically reasonable, model to describe the relationship between an outcome (dependent
Ron Heck, Fall Week 8: Introducing Generalized Linear Models: Logistic Regression 1 (Replaces prior revision dated October 20, 2011)
") Ron Heck, Fall 2011 1 EDEP 768E: Seminar in Multilevel Modeling rev. January 3, 2012 (see footnote) Week 8: Introducing Generalized Linear Models: Logistic Regression 1 (Replaces prior revision dated October
Ron Heck, Fall 2011 1 EDEP 768E: Seminar in Multilevel Modeling rev. January 3, 2012 (see footnote) Week 8: Introducing Generalized Linear Models: Logistic Regression 1 (Replaces prior revision dated October
Lecture 7 Time-dependent Covariates in Cox Regression
 Lecture 7 Time-dependent Covariates in Cox Regression So far, we ve been considering the following Cox PH model: λ(t Z) = λ 0 (t) exp(β Z) = λ 0 (t) exp( β j Z j ) where β j is the parameter for the the
Example: Forced Expiratory Volume (FEV) Program L13. Example: Forced Expiratory Volume (FEV) Example: Forced Expiratory Volume (FEV)
 Program L13. Example: Forced Expiratory Volume (FEV) Example: Forced Expiratory Volume (FEV)") Program L13 Relationships between two variables Correlation, cont d Regression Relationships between more than two variables Multiple linear regression Two numerical variables Linear or curved relationship?
Program L13 Relationships between two variables Correlation, cont d Regression Relationships between more than two variables Multiple linear regression Two numerical variables Linear or curved relationship?
Goodness-of-Fit Tests for the Ordinal Response Models with Misspecified Links
 Communications of the Korean Statistical Society 2009, Vol 16, No 4, 697 705 Goodness-of-Fit Tests for the Ordinal Response Models with Misspecified Links Kwang Mo Jeong a, Hyun Yung Lee 1, a a Department
Turning a research question into a statistical question.
 Turning a research question into a statistical question. IGINAL QUESTION: Concept Concept Concept ABOUT ONE CONCEPT ABOUT RELATIONSHIPS BETWEEN CONCEPTS TYPE OF QUESTION: DESCRIBE what s going on? DECIDE
Logistic Regression Analysis
 Logistic Regression Analysis Predicting whether an event will or will not occur, as well as identifying the variables useful in making the prediction, is important in most academic disciplines as well
Two Correlated Proportions Non- Inferiority, Superiority, and Equivalence Tests
 Chapter 59 Two Correlated Proportions on- Inferiority, Superiority, and Equivalence Tests Introduction This chapter documents three closely related procedures: non-inferiority tests, superiority (by a
STA 4504/5503 Sample Exam 1 Spring 2011 Categorical Data Analysis. 1. Indicate whether each of the following is true (T) or false (F).
 or false (F).") STA 4504/5503 Sample Exam 1 Spring 2011 Categorical Data Analysis 1. Indicate whether each of the following is true (T) or false (F). (a) T In 2 2 tables, statistical independence is equivalent to a population
STA 4504/5503 Sample Exam 1 Spring 2011 Categorical Data Analysis 1. Indicate whether each of the following is true (T) or false (F). (a) T In 2 2 tables, statistical independence is equivalent to a population
Time-Invariant Predictors in Longitudinal Models
 Time-Invariant Predictors in Longitudinal Models Today s Topics: What happens to missing predictors Effects of time-invariant predictors Fixed vs. systematically varying vs. random effects Model building
Lecture 2: Poisson and logistic regression
 Dankmar Böhning Southampton Statistical Sciences Research Institute University of Southampton, UK S 3 RI, 11-12 December 2014 introduction to Poisson regression application to the BELCAP study introduction
A note on R 2 measures for Poisson and logistic regression models when both models are applicable
 Journal of Clinical Epidemiology 54 (001) 99 103 A note on R measures for oisson and logistic regression models when both models are applicable Martina Mittlböck, Harald Heinzl* Department of Medical Computer
NATIONAL UNIVERSITY OF SINGAPORE EXAMINATION. ST3241 Categorical Data Analysis. (Semester II: ) April/May, 2011 Time Allowed : 2 Hours
 April/May, 2011 Time Allowed : 2 Hours") NATIONAL UNIVERSITY OF SINGAPORE EXAMINATION Categorical Data Analysis (Semester II: 2010 2011) April/May, 2011 Time Allowed : 2 Hours Matriculation No: Seat No: Grade Table Question 1 2 3 4 5 6 Full marks
NATIONAL UNIVERSITY OF SINGAPORE EXAMINATION Categorical Data Analysis (Semester II: 2010 2011) April/May, 2011 Time Allowed : 2 Hours Matriculation No: Seat No: Grade Table Question 1 2 3 4 5 6 Full marks
ECON 594: Lecture #6
 ECON 594: Lecture #6 Thomas Lemieux Vancouver School of Economics, UBC May 2018 1 Limited dependent variables: introduction Up to now, we have been implicitly assuming that the dependent variable, y, was
MULTINOMIAL LOGISTIC REGRESSION
 MULTINOMIAL LOGISTIC REGRESSION Model graphically: Variable Y is a dependent variable, variables X, Z, W are called regressors. Multinomial logistic regression is a generalization of the binary logistic
16.400/453J Human Factors Engineering. Design of Experiments II
 J Human Factors Engineering Design of Experiments II Review Experiment Design and Descriptive Statistics Research question, independent and dependent variables, histograms, box plots, etc. Inferential
ESP 178 Applied Research Methods. 2/23: Quantitative Analysis
 ESP 178 Applied Research Methods 2/23: Quantitative Analysis Data Preparation Data coding create codebook that defines each variable, its response scale, how it was coded Data entry for mail surveys and
Regression: Main Ideas Setting: Quantitative outcome with a quantitative explanatory variable. Example, cont.
 TCELL 9/4/205 36-309/749 Experimental Design for Behavioral and Social Sciences Simple Regression Example Male black wheatear birds carry stones to the nest as a form of sexual display. Soler et al. wanted
Introduction to Statistical Analysis
 Introduction to Statistical Analysis Changyu Shen Richard A. and Susan F. Smith Center for Outcomes Research in Cardiology Beth Israel Deaconess Medical Center Harvard Medical School Objectives Descriptive
Three-Way Contingency Tables
 Newsom PSY 50/60 Categorical Data Analysis, Fall 06 Three-Way Contingency Tables Three-way contingency tables involve three binary or categorical variables. I will stick mostly to the binary case to keep
1. BINARY LOGISTIC REGRESSION
 1. BINARY LOGISTIC REGRESSION The Model We are modelling two-valued variable Y. Model s scheme Variable Y is the dependent variable, X, Z, W are independent variables (regressors). Typically Y values are
STA 4504/5503 Sample Exam 1 Spring 2011 Categorical Data Analysis. 1. Indicate whether each of the following is true (T) or false (F).
 or false (F).") STA 4504/5503 Sample Exam 1 Spring 2011 Categorical Data Analysis 1. Indicate whether each of the following is true (T) or false (F). (a) (b) (c) (d) (e) In 2 2 tables, statistical independence is equivalent
STA 4504/5503 Sample Exam 1 Spring 2011 Categorical Data Analysis 1. Indicate whether each of the following is true (T) or false (F). (a) (b) (c) (d) (e) In 2 2 tables, statistical independence is equivalent
11 November 2011 Department of Biostatistics, University of Copengen. 9:15 10:00 Recap of case-control studies. Frequency-matched studies.
 Matched and nested case-control studies Bendix Carstensen Steno Diabetes Center, Gentofte, Denmark http://staff.pubhealth.ku.dk/~bxc/ Department of Biostatistics, University of Copengen 11 November 2011
Course Introduction and Overview Descriptive Statistics Conceptualizations of Variance Review of the General Linear Model
 Course Introduction and Overview Descriptive Statistics Conceptualizations of Variance Review of the General Linear Model PSYC 943 (930): Fundamentals of Multivariate Modeling Lecture 1: August 22, 2012
Generalized logit models for nominal multinomial responses. Local odds ratios
 Generalized logit models for nominal multinomial responses Categorical Data Analysis, Summer 2015 1/17 Local odds ratios Y 1 2 3 4 1 π 11 π 12 π 13 π 14 π 1+ X 2 π 21 π 22 π 23 π 24 π 2+ 3 π 31 π 32 π
Chapter 10 Logistic Regression
 Chapter 10 Logistic Regression Data Mining for Business Intelligence Shmueli, Patel & Bruce Galit Shmueli and Peter Bruce 2010 Logistic Regression Extends idea of linear regression to situation where outcome