Hypothesis Testing, Bayes Theorem, & Parameter Estimation
|
|
|
- Shannon Jennings
- 5 years ago
- Views:
Transcription
1 Data Mining In Modern Astronomy Sky Surveys: Hypothesis Testing, Bayes Theorem, & Parameter Estimation Ching-Wa Yip Bloomberg 518
2 Erratum of Last Lecture The Central Limit Theorem was proved by Bernoulli back in 17 th century. The Michelson-Morley speed-of-light experiment was carried out in 18 th century. Michelson & Morley could have accessed to the Central Limit Theorem and decided to carry out many, repeated measurements. (Need more research)


3 From Data to Information We don t just want data. We want information from the data. Information Database Sensors Data Analysis or Data Mining
4 From Data to Information We don t just want data. We want information from the data. Information Database Sensors Data Analysis or Data Mining

5 Probability Density Function (PDF) A function which tells the probability of an event, e.g.: Temperature T lies between 34F and 50F. Variable X lies between X 1 and X 2. A well-known PDF is the Standard Normal Distribution:
 (Yip, Connolly, Szalay,")
6 Number/Total Number PDFs Come in Many Shapes E.g., Color of galaxies Color (Redder ) (Yip, Connolly, Szalay, et al. 2004)
7 Properties of PDFs The total area under the function is 1 (= 100% probability): p x dx = 1 The probability of the variable x lying between a and b is: P x beween a and b b = p x dx a
8 2D Probability Density Function (PDF) A function which tells the probability of an event, just like the 1D PDF but with 2 variables: the variables X lies between X 1 and X 2 AND Y between Y 1 and Y 2 The total area under the curve is still 1. p x, y dxdy = 1

9 Example 2D PDF Seeing disk of stellar image. p(x, Y) Y X
10 Standard Normal Distribution Revisit: Some Terminologies Significance Level = Area at the tail of the distribution = = 2.5% = Critical Values = Z = The value corresponds to a Significance Level
11 (Abridged, Taken from Dekking et al.)
 We get: Z = 1.")
12 If: = (tabulated as 0250) We get: Z = 1.96 (Abridged, Taken from Dekking et al.)

13 Significance Level ( ) and its Critical No more tables! Values (Z)
14 Hypothesis Testing Goal: To test whether a hypothesis is true or false. The beginning hypothesis is our best knowledge for the problem (also called the Null Hypothesis). If Null Hypothesis is FALSE, Alternative Hypothesis is TRUE.
15 Hypothesis Testing Suppose we think the average of a sample is some number. We want to test this hypothesis. Null hypothesis: some # Alternative hypothesis: some # +
16 Hypothesis Testing: (Step 1) Set Significance Levels It is the area at the tail(s). +
17 Hypothesis Testing: (Step 2) Find Critical Values Use: - Look-up tables - Computational software +
18 Hypothesis Testing: (Step 3) Calculate Statistics From Data Also called Test Statistics. T.S. +
19 Hypothesis Testing: (Step 3) Calculate Statistics From Data T.S. + Also called Test Statistics. Test Statistics is usually mean-subtracted. Therefore, we can use mean=0 Normal Distribution to carry on the hypothesis testing.
20 Hypothesis Testing: (Step 4) Draw Conclusion Fail to reject the (null) hypothesis.
21 Hypothesis Testing: (Step 4) Draw Conclusion Reject the (null) hypothesis
22 Hypothesis Testing: (Step 4) Draw Conclusion Reject the (null) hypothesis

23 Hypothesis Testing Example A galaxy formation theory predicted that the average radius of galaxies in the nearby universe is 35 kpc (1pc = 1parsec = m). A random sample of 225 galaxies has a mean radius x = 30 kpc, and the S.D. of radius = 20 kpc. Task: Set up an hypothesis test at 5% significance level. Null hypothesis: 35 kpc Alt. hypothesis: 35 kpc Use two-tailed test. (M. Calvo)
24 Details: Calculate Sampling Distribution of the mean: μ x = by Central Limit Thm = μ(theory) = 35 σ x = by Central Limit Thm = S.D.(theory) ~ S.D. = 20 = 4 n n 15 3 Calculate Test Statistics from data: Z = x μ x σ x = /3 = 3.75
25 n = ; Almost Normal ( = 35 kpc from theory)

26 n = ; Almost Normal Conclusion: Reject the galaxy formation theory. Accept 35 kpc at 5% significance level ( = 35 kpc from theory)
27 Meaning of the Confidence Level It is the chance we will make Type I error. Type I error is when we reject Null Hypothesis which is actually true: There is 5% chance we are wrong by rejecting the theory (that average galaxy size being 35 kpc).

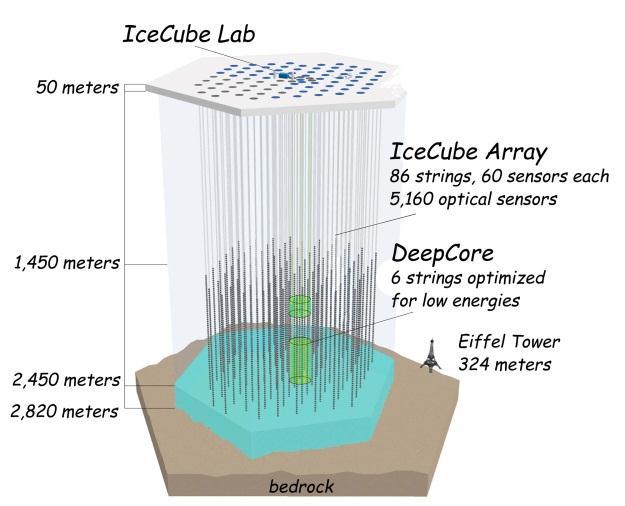

28 Hypothesis Testing Example: 28 Sources in IceCube (2013)
29 Null Hypothesis: Sources are uniformly distributed on the sky. Alternative Hypothesis: Sources are originated from the Milky Way center.
30 Conditional Probability: Discrete Drawing a random card from a stack of 52 playing cards, what is the probability of a card being a Jack given it is a Face card (J, Q, K)? P Jack Face = Number of Jack s Number of Face s = 4 12 = 1 3
31 Thinking Like Bayesian There will be a bicycle race tomorrow, what is the probability a particular athlete will win? Problem: The event only occurs once, we do not have a sample to calculate the probability of a particular athlete winning. Solution: Bayesian Statistics.

32 Bayes Theorem (1763) P A B = P B A P(A) P(B) Posterior = Probability of A after B occurs. Probability of A before B occurs. Likelihood Prior Normalization Factor (Thomas Bayes, )
33 Conditional Probability: Discrete Drawing a random card from a stack of 52 playing cards, what is the probability of a card being a Jack given it is a Face card (J, Q, K)? When I know nothing beforehand: P Jack = 4 52 If my friend told me it is a Face card (Added Evidence): P Jack Face = P Face Jack P(Jack) P(Face) = = 1 3
34 Main Idea behind Bayes Theorem When we add a new piece of evidence, we change our outlook on the probability of an event.

35 Frequentist vs. Bayesian Frequentist: Bayesians assume a prior probability. Bayesian: Frequentist cannot assign a probability to a single event.
36 Parameter Estimation: The Problem Estimate parameter from data given model. 1 modeled parameter: θ Multi modeled parameters: θ = (θ 1, θ 2, θ 3,, θ N )

37 Quality of an Estimator: Bias and Variance Usually, the best estimator is somewhere in-between.
38 Least-Square Fitting (LSQ) A popular way to find linear model that bestfit the data. A linear model is a model in which there is no square, cube,, and higher order power terms in the variables. Example: straight lines Y = Slope * X + Constant Slope and Constant are the parameters in the model. A Parameter Estimation problem.
39 Least-Square Fitting (LSQ): Linear model Y = Slope * X + Constant X: Independent Variable, Input Variable, etc. Y: Dependent Variable, Output Variable, etc.

40 Example of LSQ Fitting in R
41 Goodness of Fit A goodness of fit measures how well the model fit the data. E.g., Chi-sq (the sum of square of the difference over all of the N data points) x 2 = N i=1 D M 2 σ 2
42 Graphical Meaning of Chi-sq Y Model Fit Data Points X
43 Graphical Meaning of Chi-sq Y Model Fit Data Points Chi-sq measures how far away the points are from the model. X
44 Graphical Meaning of Chi-sq Y M D Model Fit Data Points Chi-sq measures how far away the points are from the model. X

45 (Astronomy) Data are Imperfect Random Error Photon counts follow Poisson distribution Random error for Poisson = photon count Systematic Error Bad CCD pixels Cosmic Rays Sky Emissions Etc.
46 Sky Emission (or Skylines) Average Sky Emissions From SDSS DR6 (Yip)

47 Image Stacking: Central Limit Theorem Revisit Fruchter & Hook (2002): Stack images in order to remove cosmic ray (= systematic error in pixel flux)
")
48 Similarly, Spectra Stacking (Yip, Connolly et al. 2004)
49 whereas individual spectrum is noisy. (SDSS Data Release 6)
50 Outliers: Using Median vs. Mean When there are outliers, the median could be more robust than the mean as a measure for the average. Outliers are difficult to define, because we need to know the average distribution as well (Next Lecture: Unsupervised Machine Learning). Subfield of study: Robust Statistics.

51 Median as the Robust Average
52 Homework 2014 Jan 14 (due Monday noon, Jan 20) The data file (saved in the course website as hubbletable1.csv ) contains the Object Name, Distance (in 10 6 pc = Mpc), and Recession Velocity (in km/s) from Hubble s 1929 work. 1) Find the Hubble s Constant by using Least Square Fitting. 2) Plot the Velocity vs. Distance; and the best-fit model. 3) The Hubble s constant from WMAP survey is determined to be 71 km/s/mpc. Comment on the comparison between the calculated and the WMAP values. Read the article on Bayes theorem. A CCD records a signal of 100 photons. What is the signal-to-noise ratio (SNR)? If the human eyes can discern features with 100% certainty in an image which has SNR 5 (*), what is the minimum number of photons we need for 100% certainty? (*) This is a simplified version of the Rose Criterion, Hints: Use read.csv() in R to read Comma Separated Values. To extract a column from the data, use x$column. For example, x$distance_mpc.
Statistics notes. A clear statistical framework formulates the logic of what we are doing and why. It allows us to make precise statements.
 Statistics notes Introductory comments These notes provide a summary or cheat sheet covering some basic statistical recipes and methods. These will be discussed in more detail in the lectures! What is
AST 418/518 Instrumentation and Statistics
 AST 418/518 Instrumentation and Statistics Class Website: http://ircamera.as.arizona.edu/astr_518 Class Texts: Practical Statistics for Astronomers, J.V. Wall, and C.R. Jenkins Measuring the Universe,
ORF 245 Fundamentals of Statistics Practice Final Exam
 Princeton University Department of Operations Research and Financial Engineering ORF 245 Fundamentals of Statistics Practice Final Exam January??, 2016 1:00 4:00 pm Closed book. No computers. Calculators
Statistical Methods for Astronomy
 Statistical Methods for Astronomy Probability (Lecture 1) Statistics (Lecture 2) Why do we need statistics? Useful Statistics Definitions Error Analysis Probability distributions Error Propagation Binomial
Brandon C. Kelly (Harvard Smithsonian Center for Astrophysics)
") Brandon C. Kelly (Harvard Smithsonian Center for Astrophysics) Probability quantifies randomness and uncertainty How do I estimate the normalization and logarithmic slope of a X ray continuum, assuming
Brandon C. Kelly (Harvard Smithsonian Center for Astrophysics) Probability quantifies randomness and uncertainty How do I estimate the normalization and logarithmic slope of a X ray continuum, assuming
Physics 403. Segev BenZvi. Classical Hypothesis Testing: The Likelihood Ratio Test. Department of Physics and Astronomy University of Rochester
 Physics 403 Classical Hypothesis Testing: The Likelihood Ratio Test Segev BenZvi Department of Physics and Astronomy University of Rochester Table of Contents 1 Bayesian Hypothesis Testing Posterior Odds
Statistical Methods for Astronomy
 Statistical Methods for Astronomy If your experiment needs statistics, you ought to have done a better experiment. -Ernest Rutherford Lecture 1 Lecture 2 Why do we need statistics? Definitions Statistical
SYDE 372 Introduction to Pattern Recognition. Probability Measures for Classification: Part I
 SYDE 372 Introduction to Pattern Recognition Probability Measures for Classification: Part I Alexander Wong Department of Systems Design Engineering University of Waterloo Outline 1 2 3 4 Why use probability
2. A Basic Statistical Toolbox
 . A Basic Statistical Toolbo Statistics is a mathematical science pertaining to the collection, analysis, interpretation, and presentation of data. Wikipedia definition Mathematical statistics: concerned
STATS 200: Introduction to Statistical Inference. Lecture 29: Course review
 STATS 200: Introduction to Statistical Inference Lecture 29: Course review Course review We started in Lecture 1 with a fundamental assumption: Data is a realization of a random process. The goal throughout
MULTIPLE EXPOSURES IN LARGE SURVEYS
 MULTIPLE EXPOSURES IN LARGE SURVEYS / Johns Hopkins University Big Data? Noisy Skewed Artifacts Big Data? Noisy Skewed Artifacts Serious Issues Significant fraction of catalogs is junk GALEX 50% PS1 3PI
Homework on Properties of Galaxies in the Hubble Deep Field Name: Due: Friday, April 8 30 points Prof. Rieke & TA Melissa Halford
 Homework on Properties of Galaxies in the Hubble Deep Field Name: Due: Friday, April 8 30 points Prof. Rieke & TA Melissa Halford You are going to work with some famous astronomical data in this homework.
Learning Objectives for Stat 225
 Learning Objectives for Stat 225 08/20/12 Introduction to Probability: Get some general ideas about probability, and learn how to use sample space to compute the probability of a specific event. Set Theory:
Homework #7: Properties of Galaxies in the Hubble Deep Field Name: Due: Friday, October points Profs. Rieke
 Homework #7: Properties of Galaxies in the Hubble Deep Field Name: Due: Friday, October 31 30 points Profs. Rieke You are going to work with some famous astronomical data in this homework. The image data
Frequentist Statistics and Hypothesis Testing Spring
 Frequentist Statistics and Hypothesis Testing 18.05 Spring 2018 http://xkcd.com/539/ Agenda Introduction to the frequentist way of life. What is a statistic? NHST ingredients; rejection regions Simple
Physics Lab #9: Measuring the Hubble Constant
 Physics 10263 Lab #9: Measuring the Hubble Constant Introduction In the 1920 s, Edwin Hubble discovered a relationship that is now known as Hubble s Law. It states that the recession velocity of a galaxy
Statistics of Small Signals
 Statistics of Small Signals Gary Feldman Harvard University NEPPSR August 17, 2005 Statistics of Small Signals In 1998, Bob Cousins and I were working on the NOMAD neutrino oscillation experiment and we
Probability Distributions
 Department of Statistics The University of Auckland https://www.stat.auckland.ac.nz/ brewer/ Suppose a quantity X might be 1, 2, 3, 4, or 5, and we assign probabilities of 1 5 to each of those possible
Quiz 1. Name: Instructions: Closed book, notes, and no electronic devices.
 Quiz 1. Name: Instructions: Closed book, notes, and no electronic devices. 1.(10) What is usually true about a parameter of a model? A. It is a known number B. It is determined by the data C. It is an
Business Statistics. Lecture 10: Course Review
 Business Statistics Lecture 10: Course Review 1 Descriptive Statistics for Continuous Data Numerical Summaries Location: mean, median Spread or variability: variance, standard deviation, range, percentiles,
The Cosmological Redshift. Cepheid Variables. Hubble s Diagram
 SOME NEGATIVE EFFECTS OF THE EXPANSION OF THE UNIVERSE. Lecture 22 Hubble s Law and the Large Scale Structure of the Universe PRS: According to modern ideas and observations, what can be said about the
F & B Approaches to a simple model
 A6523 Signal Modeling, Statistical Inference and Data Mining in Astrophysics Spring 215 http://www.astro.cornell.edu/~cordes/a6523 Lecture 11 Applications: Model comparison Challenges in large-scale surveys
HST.582J / 6.555J / J Biomedical Signal and Image Processing Spring 2007
 MIT OpenCourseWare http://ocw.mit.edu HST.582J / 6.555J / 16.456J Biomedical Signal and Image Processing Spring 2007 For information about citing these materials or our Terms of Use, visit: http://ocw.mit.edu/terms.
Big Data Analysis with Apache Spark UC#BERKELEY
 Big Data Analysis with Apache Spark UC#BERKELEY This Lecture: Relation between Variables An association A trend» Positive association or Negative association A pattern» Could be any discernible shape»
Robustness and Distribution Assumptions
 Chapter 1 Robustness and Distribution Assumptions 1.1 Introduction In statistics, one often works with model assumptions, i.e., one assumes that data follow a certain model. Then one makes use of methodology
Physics 403. Segev BenZvi. Credible Intervals, Confidence Intervals, and Limits. Department of Physics and Astronomy University of Rochester
 Physics 403 Credible Intervals, Confidence Intervals, and Limits Segev BenZvi Department of Physics and Astronomy University of Rochester Table of Contents 1 Summarizing Parameters with a Range Bayesian
Probability Methods in Civil Engineering Prof. Dr. Rajib Maity Department of Civil Engineering Indian Institution of Technology, Kharagpur
 Probability Methods in Civil Engineering Prof. Dr. Rajib Maity Department of Civil Engineering Indian Institution of Technology, Kharagpur Lecture No. # 36 Sampling Distribution and Parameter Estimation
PROJECT GLOBULAR CLUSTERS
 PROJECT 5 GLOBULAR CLUSTERS Objective: The objective of this exercise is the calculation of the core and tidal radius of a globular cluster in the Milky Way. Measure the tidal radius of a globular cluster
Review. DS GA 1002 Statistical and Mathematical Models. Carlos Fernandez-Granda
 Review DS GA 1002 Statistical and Mathematical Models http://www.cims.nyu.edu/~cfgranda/pages/dsga1002_fall16 Carlos Fernandez-Granda Probability and statistics Probability: Framework for dealing with
ECE521 week 3: 23/26 January 2017
 ECE521 week 3: 23/26 January 2017 Outline Probabilistic interpretation of linear regression - Maximum likelihood estimation (MLE) - Maximum a posteriori (MAP) estimation Bias-variance trade-off Linear
Statistical inference
 Statistical inference Contents 1. Main definitions 2. Estimation 3. Testing L. Trapani MSc Induction - Statistical inference 1 1 Introduction: definition and preliminary theory In this chapter, we shall
Statistical Methods for Astronomy
 Statistical Methods for Astronomy Probability (Lecture 1) Statistics (Lecture 2) Why do we need statistics? Useful Statistics Definitions Error Analysis Probability distributions Error Propagation Binomial
The Cosmic Distance Ladder. Hubble s Law and the Expansion of the Universe!
 The Cosmic Distance Ladder Hubble s Law and the Expansion of the Universe! Last time: looked at Cepheid Variable stars as standard candles. Massive, off-main sequence stars: at a certain stage between
Bayesian Model Diagnostics and Checking
 Earvin Balderama Quantitative Ecology Lab Department of Forestry and Environmental Resources North Carolina State University April 12, 2013 1 / 34 Introduction MCMCMC 2 / 34 Introduction MCMCMC Steps in
Statistical Tools and Techniques for Solar Astronomers
 Statistical Tools and Techniques for Solar Astronomers Alexander W Blocker Nathan Stein SolarStat 2012 Outline Outline 1 Introduction & Objectives 2 Statistical issues with astronomical data 3 Example:
Review of Statistics
 Review of Statistics Topics Descriptive Statistics Mean, Variance Probability Union event, joint event Random Variables Discrete and Continuous Distributions, Moments Two Random Variables Covariance and
DS-GA 1003: Machine Learning and Computational Statistics Homework 7: Bayesian Modeling
 DS-GA 1003: Machine Learning and Computational Statistics Homework 7: Bayesian Modeling Due: Tuesday, May 10, 2016, at 6pm (Submit via NYU Classes) Instructions: Your answers to the questions below, including
Introduction to Bayesian Learning. Machine Learning Fall 2018
 Introduction to Bayesian Learning Machine Learning Fall 2018 1 What we have seen so far What does it mean to learn? Mistake-driven learning Learning by counting (and bounding) number of mistakes PAC learnability
PRACTICAL ANALYTICS 7/19/2012. Tamás Budavári / The Johns Hopkins University
 PRACTICAL ANALYTICS / The Johns Hopkins University Statistics Of numbers Of vectors Of functions Of trees Statistics Description, modeling, inference, machine learning Bayesian / Frequentist / Pragmatist?
Practical Statistics
 Practical Statistics Lecture 1 (Nov. 9): - Correlation - Hypothesis Testing Lecture 2 (Nov. 16): - Error Estimation - Bayesian Analysis - Rejecting Outliers Lecture 3 (Nov. 18) - Monte Carlo Modeling -
Intro to Bayesian Methods
 Intro to Bayesian Methods Rebecca C. Steorts Bayesian Methods and Modern Statistics: STA 360/601 Lecture 1 1 Course Webpage Syllabus LaTeX reference manual R markdown reference manual Please come to office
Visual interpretation with normal approximation
 Visual interpretation with normal approximation H 0 is true: H 1 is true: p =0.06 25 33 Reject H 0 α =0.05 (Type I error rate) Fail to reject H 0 β =0.6468 (Type II error rate) 30 Accept H 1 Visual interpretation
Open Cluster Research Project
 Open Cluster Research Project I. Introduction The observational data indicate that all stars form in clusters. In a cloud of hydrogen gas, laced with helium and a trace of other elements, something triggers
Exam 2 Practice Questions, 18.05, Spring 2014
 Exam 2 Practice Questions, 18.05, Spring 2014 Note: This is a set of practice problems for exam 2. The actual exam will be much shorter. Within each section we ve arranged the problems roughly in order
A brief outline of the lab procedure, the steps will be walked through later on.
 Name: Partner(s): Lab #12 The Hubble Law Objectives In this lab you will use simple observational evidence to recreate the most profound discovery in cosmology. By calculating the distance to other galaxies
Data Mining Chapter 4: Data Analysis and Uncertainty Fall 2011 Ming Li Department of Computer Science and Technology Nanjing University
 Data Mining Chapter 4: Data Analysis and Uncertainty Fall 2011 Ming Li Department of Computer Science and Technology Nanjing University Why uncertainty? Why should data mining care about uncertainty? We
Exam 4 Review EXAM COVERS LECTURES 22-29
 Exam 4 Review EXAM COVERS LECTURES 22-29 Theoretically is there a center of the universe? Is there an edge? Do we know where Earth is on this? There is no center to the Universe, What kind of light we
AstroBITS: Open Cluster Project
 AstroBITS: Open Cluster Project I. Introduction The observational data that astronomers have gathered over many years indicate that all stars form in clusters. In a cloud of hydrogen gas, laced with helium
Stat 5101 Lecture Notes
 Stat 5101 Lecture Notes Charles J. Geyer Copyright 1998, 1999, 2000, 2001 by Charles J. Geyer May 7, 2001 ii Stat 5101 (Geyer) Course Notes Contents 1 Random Variables and Change of Variables 1 1.1 Random
Statistical Methods in Particle Physics Lecture 1: Bayesian methods
 Statistical Methods in Particle Physics Lecture 1: Bayesian methods SUSSP65 St Andrews 16 29 August 2009 Glen Cowan Physics Department Royal Holloway, University of London g.cowan@rhul.ac.uk www.pp.rhul.ac.uk/~cowan
Recursive Estimation
 Recursive Estimation Raffaello D Andrea Spring 08 Problem Set : Bayes Theorem and Bayesian Tracking Last updated: March, 08 Notes: Notation: Unless otherwise noted, x, y, and z denote random variables,
CS Homework 3. October 15, 2009
 CS 294 - Homework 3 October 15, 2009 If you have questions, contact Alexandre Bouchard (bouchard@cs.berkeley.edu) for part 1 and Alex Simma (asimma@eecs.berkeley.edu) for part 2. Also check the class website
Frequentist-Bayesian Model Comparisons: A Simple Example
 Frequentist-Bayesian Model Comparisons: A Simple Example Consider data that consist of a signal y with additive noise: Data vector (N elements): D = y + n The additive noise n has zero mean and diagonal
Machine Learning! in just a few minutes. Jan Peters Gerhard Neumann
 Machine Learning! in just a few minutes Jan Peters Gerhard Neumann 1 Purpose of this Lecture Foundations of machine learning tools for robotics We focus on regression methods and general principles Often
Lecture 5: Bayes pt. 1
 Lecture 5: Bayes pt. 1 D. Jason Koskinen koskinen@nbi.ku.dk Photo by Howard Jackman University of Copenhagen Advanced Methods in Applied Statistics Feb - Apr 2016 Niels Bohr Institute 2 Bayes Probabilities
Statistical Distribution Assumptions of General Linear Models
 Statistical Distribution Assumptions of General Linear Models Applied Multilevel Models for Cross Sectional Data Lecture 4 ICPSR Summer Workshop University of Colorado Boulder Lecture 4: Statistical Distributions
Introduction to Probability and Statistics (Continued)
") Introduction to Probability and Statistics (Continued) Prof. icholas Zabaras Center for Informatics and Computational Science https://cics.nd.edu/ University of otre Dame otre Dame, Indiana, USA Email:
Introduction to Probability and Statistics (Continued) Prof. icholas Zabaras Center for Informatics and Computational Science https://cics.nd.edu/ University of otre Dame otre Dame, Indiana, USA Email:
Business Statistics: Lecture 8: Introduction to Estimation & Hypothesis Testing
 Business Statistics: Lecture 8: Introduction to Estimation & Hypothesis Testing Agenda Introduction to Estimation Point estimation Interval estimation Introduction to Hypothesis Testing Concepts en terminology
Physics 509: Bootstrap and Robust Parameter Estimation
 Physics 509: Bootstrap and Robust Parameter Estimation Scott Oser Lecture #20 Physics 509 1 Nonparametric parameter estimation Question: what error estimate should you assign to the slope and intercept
Bayesian Inference in Astronomy & Astrophysics A Short Course
 Bayesian Inference in Astronomy & Astrophysics A Short Course Tom Loredo Dept. of Astronomy, Cornell University p.1/37 Five Lectures Overview of Bayesian Inference From Gaussians to Periodograms Learning
Probability - Lecture 4
 1 Introduction Probability - Lecture 4 Many methods of computation physics and the comparison of data to a mathematical representation, apply stochastic methods. These ideas were first introduced in the
Ch18 links / ch18 pdf links Ch18 image t-dist table
 Ch18 links / ch18 pdf links Ch18 image t-dist table ch18 (inference about population mean) exercises: 18.3, 18.5, 18.7, 18.9, 18.15, 18.17, 18.19, 18.27 CHAPTER 18: Inference about a Population Mean The
Monte Carlo Integration. Computer Graphics CMU /15-662, Fall 2016
 Monte Carlo Integration Computer Graphics CMU 15-462/15-662, Fall 2016 Talk Announcement Jovan Popovic, Senior Principal Scientist at Adobe Research will be giving a seminar on Character Animator -- Monday
Announcements. Proposals graded
 Announcements Proposals graded Kevin Jamieson 2018 1 Hypothesis testing Machine Learning CSE546 Kevin Jamieson University of Washington October 30, 2018 2018 Kevin Jamieson 2 Anomaly detection You are
STATISTICS OF OBSERVATIONS & SAMPLING THEORY. Parent Distributions
 ASTR 511/O Connell Lec 6 1 STATISTICS OF OBSERVATIONS & SAMPLING THEORY References: Bevington Data Reduction & Error Analysis for the Physical Sciences LLM: Appendix B Warning: the introductory literature
Basic Statistics. 1. Gross error analyst makes a gross mistake (misread balance or entered wrong value into calculation).
.") Basic Statistics There are three types of error: 1. Gross error analyst makes a gross mistake (misread balance or entered wrong value into calculation). 2. Systematic error - always too high or too low
Basic Statistics There are three types of error: 1. Gross error analyst makes a gross mistake (misread balance or entered wrong value into calculation). 2. Systematic error - always too high or too low
Deep Learning for Computer Vision
 Deep Learning for Computer Vision Lecture 3: Probability, Bayes Theorem, and Bayes Classification Peter Belhumeur Computer Science Columbia University Probability Should you play this game? Game: A fair
A Brief Review of Probability, Bayesian Statistics, and Information Theory
 A Brief Review of Probability, Bayesian Statistics, and Information Theory Brendan Frey Electrical and Computer Engineering University of Toronto frey@psi.toronto.edu http://www.psi.toronto.edu A system
Review. One-way ANOVA, I. What s coming up. Multiple comparisons
 Review One-way ANOVA, I 9.07 /15/00 Earlier in this class, we talked about twosample z- and t-tests for the difference between two conditions of an independent variable Does a trial drug work better than
Observational Astronomy - Lecture 13 Evolution of the Universe and Final Review
 Observational Astronomy - Lecture 13 Evolution of the Universe and Final Review Craig Lage New York University - Department of Physics craig.lage@nyu.edu May 12, 2014 1 / 22 Remaining course logistics
Astr 598: Astronomy with SDSS. Spring Quarter 2004, University of Washington, Željko Ivezić. Lecture 6: Milky Way Structure I: Thin and Thick Disks
 Astr 598: Astronomy with SDSS Spring Quarter 004, University of Washington, Željko Ivezić Lecture 6: Milky Way Structure I: Thin and Thick Disks Stellar Counts There is a lot of information about the Milky
Hypothesis Testing. 1 Definitions of test statistics. CB: chapter 8; section 10.3
 Hypothesis Testing CB: chapter 8; section 0.3 Hypothesis: statement about an unknown population parameter Examples: The average age of males in Sweden is 7. (statement about population mean) The lowest
Uncertain Knowledge and Bayes Rule. George Konidaris
 Uncertain Knowledge and Bayes Rule George Konidaris gdk@cs.brown.edu Fall 2018 Knowledge Logic Logical representations are based on: Facts about the world. Either true or false. We may not know which.
Statistical Methods in Particle Physics. Lecture 2
 Statistical Methods in Particle Physics Lecture 2 October 17, 2011 Silvia Masciocchi, GSI Darmstadt s.masciocchi@gsi.de Winter Semester 2011 / 12 Outline Probability Definition and interpretation Kolmogorov's
Expression arrays, normalization, and error models
 1 Epression arrays, normalization, and error models There are a number of different array technologies available for measuring mrna transcript levels in cell populations, from spotted cdna arrays to in
Comparison of Bayesian and Frequentist Inference
 Comparison of Bayesian and Frequentist Inference 18.05 Spring 2014 First discuss last class 19 board question, January 1, 2017 1 /10 Compare Bayesian inference Uses priors Logically impeccable Probabilities
Quiz 1. Name: Instructions: Closed book, notes, and no electronic devices.
 Quiz 1. Name: Instructions: Closed book, notes, and no electronic devices. 1. What is the difference between a deterministic model and a probabilistic model? (Two or three sentences only). 2. What is the
Computer Vision Group Prof. Daniel Cremers. 10a. Markov Chain Monte Carlo
 Group Prof. Daniel Cremers 10a. Markov Chain Monte Carlo Markov Chain Monte Carlo In high-dimensional spaces, rejection sampling and importance sampling are very inefficient An alternative is Markov Chain
AUTOMATIC MORPHOLOGICAL CLASSIFICATION OF GALAXIES. 1. Introduction
 AUTOMATIC MORPHOLOGICAL CLASSIFICATION OF GALAXIES ZSOLT FREI Institute of Physics, Eötvös University, Budapest, Pázmány P. s. 1/A, H-1117, Hungary; E-mail: frei@alcyone.elte.hu Abstract. Sky-survey projects
Hubble s Law: Finding the Age of the Universe
 Lab 16 Name: Hubble s Law: Finding the Age of the Universe 16.1 Introduction In your lecture sessions (or the lab on spectroscopy), you will find out that an object s spectrum can be used to determine
Introduction to Simple Linear Regression
 Introduction to Simple Linear Regression Yang Feng http://www.stat.columbia.edu/~yangfeng Yang Feng (Columbia University) Introduction to Simple Linear Regression 1 / 68 About me Faculty in the Department
This does not cover everything on the final. Look at the posted practice problems for other topics.
 Class 7: Review Problems for Final Exam 8.5 Spring 7 This does not cover everything on the final. Look at the posted practice problems for other topics. To save time in class: set up, but do not carry
Statistical Methods in Particle Physics
 Statistical Methods in Particle Physics Lecture 11 January 7, 2013 Silvia Masciocchi, GSI Darmstadt s.masciocchi@gsi.de Winter Semester 2012 / 13 Outline How to communicate the statistical uncertainty
PSY 305. Module 3. Page Title. Introduction to Hypothesis Testing Z-tests. Five steps in hypothesis testing
 Page Title PSY 305 Module 3 Introduction to Hypothesis Testing Z-tests Five steps in hypothesis testing State the research and null hypothesis Determine characteristics of comparison distribution Five
Physics 403. Segev BenZvi. Choosing Priors and the Principle of Maximum Entropy. Department of Physics and Astronomy University of Rochester
 Physics 403 Choosing Priors and the Principle of Maximum Entropy Segev BenZvi Department of Physics and Astronomy University of Rochester Table of Contents 1 Review of Last Class Odds Ratio Occam Factors
Lecture 1: Probability Fundamentals
 Lecture 1: Probability Fundamentals IB Paper 7: Probability and Statistics Carl Edward Rasmussen Department of Engineering, University of Cambridge January 22nd, 2008 Rasmussen (CUED) Lecture 1: Probability
CS-E3210 Machine Learning: Basic Principles
 CS-E3210 Machine Learning: Basic Principles Lecture 4: Regression II slides by Markus Heinonen Department of Computer Science Aalto University, School of Science Autumn (Period I) 2017 1 / 61 Today s introduction
Practice Problems Section Problems
 Practice Problems Section 4-4-3 4-4 4-5 4-6 4-7 4-8 4-10 Supplemental Problems 4-1 to 4-9 4-13, 14, 15, 17, 19, 0 4-3, 34, 36, 38 4-47, 49, 5, 54, 55 4-59, 60, 63 4-66, 68, 69, 70, 74 4-79, 81, 84 4-85,
Review of Statistics 101
 Review of Statistics 101 We review some important themes from the course 1. Introduction Statistics- Set of methods for collecting/analyzing data (the art and science of learning from data). Provides methods
Accouncements. You should turn in a PDF and a python file(s) Figure for problem 9 should be in the PDF
 Figure for problem 9 should be in the PDF") Accouncements You should turn in a PDF and a python file(s) Figure for problem 9 should be in the PDF Please do not zip these files and submit (unless there are >5 files) 1 Bayesian Methods Machine Learning
Accouncements You should turn in a PDF and a python file(s) Figure for problem 9 should be in the PDF Please do not zip these files and submit (unless there are >5 files) 1 Bayesian Methods Machine Learning
Machine Learning. Bayes Basics. Marc Toussaint U Stuttgart. Bayes, probabilities, Bayes theorem & examples
 Machine Learning Bayes Basics Bayes, probabilities, Bayes theorem & examples Marc Toussaint U Stuttgart So far: Basic regression & classification methods: Features + Loss + Regularization & CV All kinds
Prelab Questions for Hubble Expansion Lab. 1. Why does the pitch of a firetruck s siren change as it speeds past you?
 AST 114 Spring 2011 NAME: Prelab Questions for Lab 1. Why does the pitch of a firetruck s siren change as it speeds past you? 2. What color light has a longer wavelength blue or red? 3. What are the typical
Math 50: Final. 1. [13 points] It was found that 35 out of 300 famous people have the star sign Sagittarius.
![Math 50: Final. 1. [13 points] It was found that 35 out of 300 famous people have the star sign Sagittarius.](/thumbs/95/124875477.jpg "Math 50: Final. 1. [13 points] It was found that 35 out of 300 famous people have the star sign Sagittarius.") Math 50: Final 180 minutes, 140 points. No algebra-capable calculators. Try to use your calculator only at the end of your calculation, and show working/reasoning. Please do look up z, t, χ 2 values for
Math 50: Final 180 minutes, 140 points. No algebra-capable calculators. Try to use your calculator only at the end of your calculation, and show working/reasoning. Please do look up z, t, χ 2 values for
9/12/17. Types of learning. Modeling data. Supervised learning: Classification. Supervised learning: Regression. Unsupervised learning: Clustering
 Types of learning Modeling data Supervised: we know input and targets Goal is to learn a model that, given input data, accurately predicts target data Unsupervised: we know the input only and want to make
Statistics for Managers Using Microsoft Excel/SPSS Chapter 4 Basic Probability And Discrete Probability Distributions
 Statistics for Managers Using Microsoft Excel/SPSS Chapter 4 Basic Probability And Discrete Probability Distributions 1999 Prentice-Hall, Inc. Chap. 4-1 Chapter Topics Basic Probability Concepts: Sample
ORF 245 Fundamentals of Statistics Chapter 9 Hypothesis Testing
 ORF 245 Fundamentals of Statistics Chapter 9 Hypothesis Testing Robert Vanderbei Fall 2014 Slides last edited on November 24, 2014 http://www.princeton.edu/ rvdb Coin Tossing Example Consider two coins.
Fundamentals to Biostatistics. Prof. Chandan Chakraborty Associate Professor School of Medical Science & Technology IIT Kharagpur
 Fundamentals to Biostatistics Prof. Chandan Chakraborty Associate Professor School of Medical Science & Technology IIT Kharagpur Statistics collection, analysis, interpretation of data development of new
The Chi-Square Distributions
 MATH 03 The Chi-Square Distributions Dr. Neal, Spring 009 The chi-square distributions can be used in statistics to analyze the standard deviation of a normally distributed measurement and to test the
Galaxy Metallicity: What Oxygen Tells Us About The Lifecycles of Galaxies Designed by Prof Jess Werk, modified by Marie Wingyee Lau
 Introduction Galaxy Metallicity: What Oxygen Tells Us About The Lifecycles of Galaxies Designed by Prof Jess Werk, modified by Marie Wingyee Lau Before stars and galaxies came into existence, the very
The Hubble Law & The Structure of the Universe
 Name: Lab Meeting Date/Time: The Hubble Law & The Structure of the Universe The Hubble Law is a relationship between two quantities the speed of and distance to a galaxy. In order to determine the Hubble