Math 50: Final. 1. [13 points] It was found that 35 out of 300 famous people have the star sign Sagittarius.
|
|
|
- Virginia Stephens
- 5 years ago
- Views:
Transcription
1 Math 50: Final 180 minutes, 140 points. No algebra-capable calculators. Try to use your calculator only at the end of your calculation, and show working/reasoning. Please do look up z, t, χ 2 values for full credit. Attempt all questions, but in the order most comfortable for you, and heed the number of points available. Later question parts may be independent of earlier ones, so skip over one you can t do. 1. [13 points] It was found that 35 out of 300 famous people have the star sign Sagittarius. (a) Test the null hypothesis that Sagittariuses are no more likely to become famous than any other star sign (assume each sign is exactly 1/12 of the year), against the hypothesis that they are more prone to fame and fortune. (b) Give this same data, what would a Bayesian, with no prior bias towards any particular value of the proportion p of famous Sagittariuses, conclude about p? (That is, what is the normalized posterior on p?) 1
2 2. [15 points] Consider the joint pdf f X,Y (x, y) = 6y, for 0 < x < 1 and 0 < y < 1 x. [Hint: double-check your domain]. (a) Find the marginal pdf f X (x). (b) Find the conditional pdf f Y x (y). (c) Find the covariance Cov(X, Y ).
3 3. [14 points] (a) How many ways are there of choosing a team of 3 and a team of 5 out of a class of 8? [2-point Bonus: if the teams are both of size 4 and not distinguishable, e.g. not labelled A or B, how many ways are there now?] (b) A shipment of 24 eggs has 6 bad ones. You test the shipment by picking 3 at random and accepting it if at most one is bad. What is the chance that you accept the shipment?
4 (c) You have 3 drawers of socks: A contains two white, B contains a white and a black, and C contains two black. However, you can t remember which drawer is which. Suppose you open a random drawer and pick out a random sock. That sock is white. What are the probabilities that the drawer you opened are A, B, or C? Please explain, using probability notation, and stating what rule of probability you used. 4. [18 points] Rectangular mint candies of variable size are produced by a machine. Let X and Y be random variables giving their width and length. (a) If X has uniform pdf in the interval [0, 1] and, independently, Y has uniform pdf in the interval [0, 2], find the probability that Y X.
5 (b) Given the same pdf as above, find the pdf of the candy area A = XY. (c) The edge of each candy is lined by chocolate, with length given by the perimeter P = 2(X + Y ). Given the same pdf as above, find the pdf of the perimeter. [Hint: find pdf of X + Y first, taking care to consider its various domains]. (d) Finally, assume the machine is adjusted so that the candies are each square, so there is only one random variable, X, and it has uniform pdf in [0, 1]. Find the new pdf of the area A = X 2.
6 5. [25 points] Consider the model pdf f Y (y; θ) = (1/θ)e y/θ for y 0. Data {y i }, i = 1,..., n are collected, from which we wish to estimate θ. (a) Derive the Maximum Likelihood estimator ˆθ. Please show your working. (b) Compute the variance of this estimator, Var(ˆθ), assuming the data does in fact come from the model pdf with parameter value θ. (c) Compare this to the Cramér-Rao lower bound. Is then ˆθ an efficient estimator?
7 (d) Prove that the estimator is consistent. [Hint: make sure you demonstrate everything you need to]. (e) With the same assumption as before, compute the full normalized pdf of the estimator, f ˆθ(u). [Hint: go back to the form of ˆθ]. (f) What family is the conjugate prior, and why?
8 6. [25 points] Heights of a random sample of four US males were 70, 72, 62, 68 inches. (a) US females have an approximately normal height distribution with mean 64, variance 6. Assuming the male variance is the same as for females, use the data to test the hypothesis that µ for males is greater than that of females, at the 95% confidence level. (b) What is your p-value for the above test? (c) Instead assume the male variance σ 2 is unknown, and compute the 95% confidence interval on the mean µ for US males.
9 (d) Assuming the underlying pdf is normal, and µ is unknown, compute a 80% confidence interval on the variance σ 2. (e) Can you reject the null hypothesis that σ 2 = 6 (that of US females), at the 80% confidence level, compared against the hypothesis that σ 2 6?
10 7. [15 points] Responses to the survey question, Do you like cheese? gave 147 out of 210 responding Yes. (The rest responded, conveniently enough, No ). (a) Give a 95% confidence interval on the underlying proportion p of the population that like cheese. (b) What assumption(s) is/are needed to justify this last conclusion? (c) After a brutal nationwide marketing campaign by the Cheese Board of America (no pun intended), a new survey finds 118 out of 150 responding Yes. Test the hypothesis that the proportion has increased, against the null hypothesis that it remained the same, at the 95% confidence level.
11 8. [15 points] A computer LCD screen contains 1 million (that is, 10 6 ) pixels, each of which has an independent probability p of being dead due to manufacturing defects. LCD panels are considered acceptable if they have at most 3 dead pixels. (a) Say p = What is the average percentage of LCD panels produced that are unacceptable? (b) What is the largest p can be if the factory must produce on average at least 50% of panels which have no dead pixels? (c) Quality Control examines 100 panels and counts 200 dead pixels in total. Use this data, and possibly additional assumptions, to construct a 95% confidence interval on p.
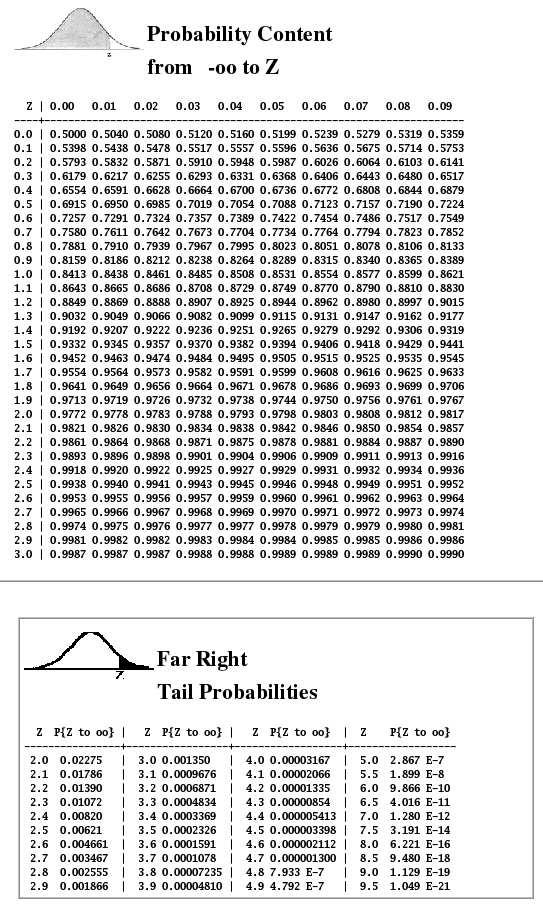
12 Useful formulae and pdfs: f Y i (y) = f W (w) = f W (w) = f W (w) = n! (i 1)!(n i)! F Y (y) i 1 [1 F Y (y)] n i f Y (y) f X (x)f Y (w x)dx for W = X + Y 1 x f X(w/x)f Y (x)dx for W = XY x f X (x)f Y (wx)dx for W = Y/X poisson p X (k; λ) = e λ λk, for k = 0, 1, 2,..., λ 0, E(X) = Var(X) = λ k! gamma f Y (y; r, λ) = λr Γ(r) yr 1 e λy, for y 0, E(Y ) = r λ, Var(Y ) = r λ 2 beta f Y (y; r, s) = normal f Y (y; µ, σ) = negative binomial p X (k; r, p) = Γ(r + s) Γ(r)Γ(s) yr 1 (1 y) s 1 for 0 y 1, E(Y ) = r r + s 1 e (y µ)2 2σ 2, E(Y ) = µ, Var(Y ) = σ 2 2π σ ( ) k 1 p k (1 p) k r, for k = r, r + 1,..., E(X) = r r(1 p), Var(X) = r 1 p p 2 CDF of standard normal follows on next page, and far-right tail probabilities which are 1 F Z (z) for large z up to 9.5. Note you can get F Z (z) for z < 0 via 1 F Z ( z).
13

14 t values corresponding to upper tail probabilities: χ 2 values corresponding to lower and upper tail probabilities:
This does not cover everything on the final. Look at the posted practice problems for other topics.
 Class 7: Review Problems for Final Exam 8.5 Spring 7 This does not cover everything on the final. Look at the posted practice problems for other topics. To save time in class: set up, but do not carry
Class 26: review for final exam 18.05, Spring 2014
 Probability Class 26: review for final eam 8.05, Spring 204 Counting Sets Inclusion-eclusion principle Rule of product (multiplication rule) Permutation and combinations Basics Outcome, sample space, event
CONTINUOUS RANDOM VARIABLES
 the Further Mathematics network www.fmnetwork.org.uk V 07 REVISION SHEET STATISTICS (AQA) CONTINUOUS RANDOM VARIABLES The main ideas are: Properties of Continuous Random Variables Mean, Median and Mode
This exam is closed book and closed notes. (You will have access to a copy of the Table of Common Distributions given in the back of the text.
 TEST #3 STA 5326 December 4, 214 Name: Please read the following directions. DO NOT TURN THE PAGE UNTIL INSTRUCTED TO DO SO Directions This exam is closed book and closed notes. (You will have access to
MATH c UNIVERSITY OF LEEDS Examination for the Module MATH2715 (January 2015) STATISTICAL METHODS. Time allowed: 2 hours
 STATISTICAL METHODS. Time allowed: 2 hours") MATH2750 This question paper consists of 8 printed pages, each of which is identified by the reference MATH275. All calculators must carry an approval sticker issued by the School of Mathematics. c UNIVERSITY
MATH2750 This question paper consists of 8 printed pages, each of which is identified by the reference MATH275. All calculators must carry an approval sticker issued by the School of Mathematics. c UNIVERSITY
t x 1 e t dt, and simplify the answer when possible (for example, when r is a positive even number). In particular, confirm that EX 4 = 3.
. In particular, confirm that EX 4 = 3.") Mathematical Statistics: Homewor problems General guideline. While woring outside the classroom, use any help you want, including people, computer algebra systems, Internet, and solution manuals, but mae
Mathematical Statistics: Homewor problems General guideline. While woring outside the classroom, use any help you want, including people, computer algebra systems, Internet, and solution manuals, but mae
Brandon C. Kelly (Harvard Smithsonian Center for Astrophysics)
") Brandon C. Kelly (Harvard Smithsonian Center for Astrophysics) Probability quantifies randomness and uncertainty How do I estimate the normalization and logarithmic slope of a X ray continuum, assuming
Brandon C. Kelly (Harvard Smithsonian Center for Astrophysics) Probability quantifies randomness and uncertainty How do I estimate the normalization and logarithmic slope of a X ray continuum, assuming
STA 2201/442 Assignment 2
 STA 2201/442 Assignment 2 1. This is about how to simulate from a continuous univariate distribution. Let the random variable X have a continuous distribution with density f X (x) and cumulative distribution
STA 2101/442 Assignment 2 1
 STA 2101/442 Assignment 2 1 These questions are practice for the midterm and final exam, and are not to be handed in. 1. A polling firm plans to ask a random sample of registered voters in Quebec whether
Lecture 2: Repetition of probability theory and statistics
 Algorithms for Uncertainty Quantification SS8, IN2345 Tobias Neckel Scientific Computing in Computer Science TUM Lecture 2: Repetition of probability theory and statistics Concept of Building Block: Prerequisites:
Math Review Sheet, Fall 2008
 1 Descriptive Statistics Math 3070-5 Review Sheet, Fall 2008 First we need to know about the relationship among Population Samples Objects The distribution of the population can be given in one of the
Final Exam. 1. (6 points) True/False. Please read the statements carefully, as no partial credit will be given.
 True/False. Please read the statements carefully, as no partial credit will be given.") 1. (6 points) True/False. Please read the statements carefully, as no partial credit will be given. (a) If X and Y are independent, Corr(X, Y ) = 0. (b) (c) (d) (e) A consistent estimator must be asymptotically
1. (6 points) True/False. Please read the statements carefully, as no partial credit will be given. (a) If X and Y are independent, Corr(X, Y ) = 0. (b) (c) (d) (e) A consistent estimator must be asymptotically
MTH U481 : SPRING 2009: PRACTICE PROBLEMS FOR FINAL
 MTH U481 : SPRING 2009: PRACTICE PROBLEMS FOR FINAL 1). Two urns are provided as follows: urn 1 contains 2 white chips and 4 red chips, while urn 2 contains 5 white chips and 3 red chips. One chip is chosen
EC212: Introduction to Econometrics Review Materials (Wooldridge, Appendix)
") 1 EC212: Introduction to Econometrics Review Materials (Wooldridge, Appendix) Taisuke Otsu London School of Economics Summer 2018 A.1. Summation operator (Wooldridge, App. A.1) 2 3 Summation operator For
1 EC212: Introduction to Econometrics Review Materials (Wooldridge, Appendix) Taisuke Otsu London School of Economics Summer 2018 A.1. Summation operator (Wooldridge, App. A.1) 2 3 Summation operator For
Class 8 Review Problems 18.05, Spring 2014
 1 Counting and Probability Class 8 Review Problems 18.05, Spring 2014 1. (a) How many ways can you arrange the letters in the word STATISTICS? (e.g. SSSTTTIIAC counts as one arrangement.) (b) If all arrangements
The Chi-Square Distributions
 MATH 183 The Chi-Square Distributions Dr. Neal, WKU The chi-square distributions can be used in statistics to analyze the standard deviation σ of a normally distributed measurement and to test the goodness
Problem 1 (20) Log-normal. f(x) Cauchy
 Log-normal. f(x) Cauchy") ORF 245. Rigollet Date: 11/21/2008 Problem 1 (20) f(x) f(x) 0.0 0.1 0.2 0.3 0.4 0.0 0.2 0.4 0.6 0.8 4 2 0 2 4 Normal (with mean -1) 4 2 0 2 4 Negative-exponential x x f(x) f(x) 0.0 0.1 0.2 0.3 0.4 0.5
ORF 245. Rigollet Date: 11/21/2008 Problem 1 (20) f(x) f(x) 0.0 0.1 0.2 0.3 0.4 0.0 0.2 0.4 0.6 0.8 4 2 0 2 4 Normal (with mean -1) 4 2 0 2 4 Negative-exponential x x f(x) f(x) 0.0 0.1 0.2 0.3 0.4 0.5
Mathematical statistics
 October 4 th, 2018 Lecture 12: Information Where are we? Week 1 Week 2 Week 4 Week 7 Week 10 Week 14 Probability reviews Chapter 6: Statistics and Sampling Distributions Chapter 7: Point Estimation Chapter
Mock Exam - 2 hours - use of basic (non-programmable) calculator is allowed - all exercises carry the same marks - exam is strictly individual
 calculator is allowed - all exercises carry the same marks - exam is strictly individual") Mock Exam - 2 hours - use of basic (non-programmable) calculator is allowed - all exercises carry the same marks - exam is strictly individual Question 1. Suppose you want to estimate the percentage of
Mock Exam - 2 hours - use of basic (non-programmable) calculator is allowed - all exercises carry the same marks - exam is strictly individual Question 1. Suppose you want to estimate the percentage of
Review. DS GA 1002 Statistical and Mathematical Models. Carlos Fernandez-Granda
 Review DS GA 1002 Statistical and Mathematical Models http://www.cims.nyu.edu/~cfgranda/pages/dsga1002_fall16 Carlos Fernandez-Granda Probability and statistics Probability: Framework for dealing with
Smoking Habits. Moderate Smokers Heavy Smokers Total. Hypertension No Hypertension Total
 Math 3070. Treibergs Final Exam Name: December 7, 00. In an experiment to see how hypertension is related to smoking habits, the following data was taken on individuals. Test the hypothesis that the proportions
Statistics Ph.D. Qualifying Exam: Part I October 18, 2003
 Statistics Ph.D. Qualifying Exam: Part I October 18, 2003 Student Name: 1. Answer 8 out of 12 problems. Mark the problems you selected in the following table. 1 2 3 4 5 6 7 8 9 10 11 12 2. Write your answer
ECE 302, Final 3:20-5:20pm Mon. May 1, WTHR 160 or WTHR 172.
 ECE 302, Final 3:20-5:20pm Mon. May 1, WTHR 160 or WTHR 172. 1. Enter your name, student ID number, e-mail address, and signature in the space provided on this page, NOW! 2. This is a closed book exam.
Homework 10 (due December 2, 2009)
") Homework (due December, 9) Problem. Let X and Y be independent binomial random variables with parameters (n, p) and (n, p) respectively. Prove that X + Y is a binomial random variable with parameters (n
Homework (due December, 9) Problem. Let X and Y be independent binomial random variables with parameters (n, p) and (n, p) respectively. Prove that X + Y is a binomial random variable with parameters (n
This paper is not to be removed from the Examination Halls
 ~~ST104B ZA d0 This paper is not to be removed from the Examination Halls UNIVERSITY OF LONDON ST104B ZB BSc degrees and Diplomas for Graduates in Economics, Management, Finance and the Social Sciences,
, 0 x < 2. a. Find the probability that the text is checked out for more than half an hour but less than an hour. = (1/2)2
2") Math 205 Spring 206 Dr. Lily Yen Midterm 2 Show all your work Name: 8 Problem : The library at Capilano University has a copy of Math 205 text on two-hour reserve. Let X denote the amount of time the text
Math 205 Spring 206 Dr. Lily Yen Midterm 2 Show all your work Name: 8 Problem : The library at Capilano University has a copy of Math 205 text on two-hour reserve. Let X denote the amount of time the text
Midterm Examination. Mth 136 = Sta 114. Wednesday, 2000 March 8, 2:20 3:35 pm
 Midterm Examination Mth 136 = Sta 114 Wednesday, 2000 March 8, 2:20 3:35 pm This is a closed-book examination so please do not refer to your notes, the text, or to any other books. You may use a two-sided
First Year Examination Department of Statistics, University of Florida
 First Year Examination Department of Statistics, University of Florida August 19, 010, 8:00 am - 1:00 noon Instructions: 1. You have four hours to answer questions in this examination.. You must show your
Fall 2017 STAT 532 Homework Peter Hoff. 1. Let P be a probability measure on a collection of sets A.
 1. Let P be a probability measure on a collection of sets A. (a) For each n N, let H n be a set in A such that H n H n+1. Show that P (H n ) monotonically converges to P ( k=1 H k) as n. (b) For each n
Chapter 5 continued. Chapter 5 sections
 Chapter 5 sections Discrete univariate distributions: 5.2 Bernoulli and Binomial distributions Just skim 5.3 Hypergeometric distributions 5.4 Poisson distributions Just skim 5.5 Negative Binomial distributions
Sample Problems for the Final Exam
 Sample Problems for the Final Exam 1. Hydraulic landing assemblies coming from an aircraft rework facility are each inspected for defects. Historical records indicate that 8% have defects in shafts only,
18.05 Final Exam. Good luck! Name. No calculators. Number of problems 16 concept questions, 16 problems, 21 pages
 Name No calculators. 18.05 Final Exam Number of problems 16 concept questions, 16 problems, 21 pages Extra paper If you need more space we will provide some blank paper. Indicate clearly that your solution
Final Examination. STA 215: Statistical Inference. Saturday, 2001 May 5, 9:00am 12:00 noon
 Final Examination Saturday, 2001 May 5, 9:00am 12:00 noon This is an open-book examination, but you may not share materials. A normal distribution table, a PMF/PDF handout, and a blank worksheet are attached
Estimation of Quantiles
 9 Estimation of Quantiles The notion of quantiles was introduced in Section 3.2: recall that a quantile x α for an r.v. X is a constant such that P(X x α )=1 α. (9.1) In this chapter we examine quantiles
Mathematical statistics
 October 18 th, 2018 Lecture 16: Midterm review Countdown to mid-term exam: 7 days Week 1 Chapter 1: Probability review Week 2 Week 4 Week 7 Chapter 6: Statistics Chapter 7: Point Estimation Chapter 8:
Introduction to Statistics
 MTH4106 Introduction to Statistics Notes 15 Spring 2013 Testing hypotheses about the mean Earlier, we saw how to test hypotheses about a proportion, using properties of the Binomial distribution It is
# of 6s # of times Test the null hypthesis that the dice are fair at α =.01 significance
 Practice Final Exam Statistical Methods and Models - Math 410, Fall 2011 December 4, 2011 You may use a calculator, and you may bring in one sheet (8.5 by 11 or A4) of notes. Otherwise closed book. The
Physics 6720 Introduction to Statistics April 4, 2017
 Physics 6720 Introduction to Statistics April 4, 2017 1 Statistics of Counting Often an experiment yields a result that can be classified according to a set of discrete events, giving rise to an integer
Lecture 1: August 28
 36-705: Intermediate Statistics Fall 2017 Lecturer: Siva Balakrishnan Lecture 1: August 28 Our broad goal for the first few lectures is to try to understand the behaviour of sums of independent random
STAT 414: Introduction to Probability Theory
 STAT 414: Introduction to Probability Theory Spring 2016; Homework Assignments Latest updated on April 29, 2016 HW1 (Due on Jan. 21) Chapter 1 Problems 1, 8, 9, 10, 11, 18, 19, 26, 28, 30 Theoretical Exercises
Algorithms for Uncertainty Quantification
 Algorithms for Uncertainty Quantification Tobias Neckel, Ionuț-Gabriel Farcaș Lehrstuhl Informatik V Summer Semester 2017 Lecture 2: Repetition of probability theory and statistics Example: coin flip Example
The Chi-Square Distributions
 MATH 03 The Chi-Square Distributions Dr. Neal, Spring 009 The chi-square distributions can be used in statistics to analyze the standard deviation of a normally distributed measurement and to test the
This exam contains 13 pages (including this cover page) and 10 questions. A Formulae sheet is provided with the exam.
 and 10 questions. A Formulae sheet is provided with the exam.") Probability and Statistics FS 2017 Session Exam 22.08.2017 Time Limit: 180 Minutes Name: Student ID: This exam contains 13 pages (including this cover page) and 10 questions. A Formulae sheet is provided
Probability and Statistics FS 2017 Session Exam 22.08.2017 Time Limit: 180 Minutes Name: Student ID: This exam contains 13 pages (including this cover page) and 10 questions. A Formulae sheet is provided
Precept 4: Hypothesis Testing
 Precept 4: Hypothesis Testing Soc 500: Applied Social Statistics Ian Lundberg Princeton University October 6, 2016 Learning Objectives 1 Introduce vectorized R code 2 Review homework and talk about RMarkdown
[POLS 8500] Review of Linear Algebra, Probability and Information Theory
![[POLS 8500] Review of Linear Algebra, Probability and Information Theory](/thumbs/72/67586683.jpg "[POLS 8500] Review of Linear Algebra, Probability and Information Theory") [POLS 8500] Review of Linear Algebra, Probability and Information Theory Professor Jason Anastasopoulos ljanastas@uga.edu January 12, 2017 For today... Basic linear algebra. Basic probability. Programming
[POLS 8500] Review of Linear Algebra, Probability and Information Theory Professor Jason Anastasopoulos ljanastas@uga.edu January 12, 2017 For today... Basic linear algebra. Basic probability. Programming
This exam is closed book and closed notes. (You will have access to a copy of the Table of Common Distributions given in the back of the text.
 TEST #3 STA 536 December, 00 Name: Please read the following directions. DO NOT TURN THE PAGE UNTIL INSTRUCTED TO DO SO Directions This exam is closed book and closed notes. You will have access to a copy
Final Solutions Fri, June 8
 EE178: Probabilistic Systems Analysis, Spring 2018 Final Solutions Fri, June 8 1. Small problems (62 points) (a) (8 points) Let X 1, X 2,..., X n be independent random variables uniformly distributed on
Probability and Statistics Notes
 Probability and Statistics Notes Chapter Five Jesse Crawford Department of Mathematics Tarleton State University Spring 2011 (Tarleton State University) Chapter Five Notes Spring 2011 1 / 37 Outline 1
Probability and Estimation. Alan Moses
 Probability and Estimation Alan Moses Random variables and probability A random variable is like a variable in algebra (e.g., y=e x ), but where at least part of the variability is taken to be stochastic.
2. Variance and Covariance: We will now derive some classic properties of variance and covariance. Assume real-valued random variables X and Y.
 CS450 Final Review Problems Fall 08 Solutions or worked answers provided Problems -6 are based on the midterm review Identical problems are marked recap] Please consult previous recitations and textbook
Chapter 4 Multiple Random Variables
 Review for the previous lecture Theorems and Examples: How to obtain the pmf (pdf) of U = g ( X Y 1 ) and V = g ( X Y) Chapter 4 Multiple Random Variables Chapter 43 Bivariate Transformations Continuous
STATS 200: Introduction to Statistical Inference. Lecture 29: Course review
 STATS 200: Introduction to Statistical Inference Lecture 29: Course review Course review We started in Lecture 1 with a fundamental assumption: Data is a realization of a random process. The goal throughout
their contents. If the sample mean is 15.2 oz. and the sample standard deviation is 0.50 oz., find the 95% confidence interval of the true mean.
 Math 1342 Exam 3-Review Chapters 7-9 HCCS **************************************************************************************** Name Date **********************************************************************************************
n px p x (1 p) n x. p x n(n 1)... (n x + 1) x!
 n x. p x n(n 1)... (n x + 1) x!") Lectures 3-4 jacques@ucsd.edu 7. Classical discrete distributions D. The Poisson Distribution. If a coin with heads probability p is flipped independently n times, then the number of heads is Bin(n, p)
Lectures 3-4 jacques@ucsd.edu 7. Classical discrete distributions D. The Poisson Distribution. If a coin with heads probability p is flipped independently n times, then the number of heads is Bin(n, p)
Elementary Statistics Triola, Elementary Statistics 11/e Unit 17 The Basics of Hypotheses Testing
 (Section 8-2) Hypotheses testing is not all that different from confidence intervals, so let s do a quick review of the theory behind the latter. If it s our goal to estimate the mean of a population,
Solutions to the Spring 2015 CAS Exam ST
 Solutions to the Spring 2015 CAS Exam ST (updated to include the CAS Final Answer Key of July 15) There were 25 questions in total, of equal value, on this 2.5 hour exam. There was a 10 minute reading
Advanced topics from statistics
 Advanced topics from statistics Anders Ringgaard Kristensen Advanced Herd Management Slide 1 Outline Covariance and correlation Random vectors and multivariate distributions The multinomial distribution
Continuous Distributions
 Continuous Distributions 1.8-1.9: Continuous Random Variables 1.10.1: Uniform Distribution (Continuous) 1.10.4-5 Exponential and Gamma Distributions: Distance between crossovers Prof. Tesler Math 283 Fall
Practical Statistics
 Practical Statistics Lecture 1 (Nov. 9): - Correlation - Hypothesis Testing Lecture 2 (Nov. 16): - Error Estimation - Bayesian Analysis - Rejecting Outliers Lecture 3 (Nov. 18) - Monte Carlo Modeling -
Midterm Exam 1 Solution
 EECS 126 Probability and Random Processes University of California, Berkeley: Fall 2015 Kannan Ramchandran September 22, 2015 Midterm Exam 1 Solution Last name First name SID Name of student on your left:
MATH 3510: PROBABILITY AND STATS June 15, 2011 MIDTERM EXAM
 MATH 3510: PROBABILITY AND STATS June 15, 2011 MIDTERM EXAM YOUR NAME: KEY: Answers in Blue Show all your work. Answers out of the blue and without any supporting work may receive no credit even if they
STAT515, Review Worksheet for Midterm 2 Spring 2019
 STAT55, Review Worksheet for Midterm 2 Spring 29. During a week, the proportion of time X that a machine is down for maintenance or repair has the following probability density function: 2( x, x, f(x The
STA 584 Supplementary Examples (not to be graded) Fall, 2003
 Fall, 2003") Page 1 of 8 Central Michigan University Department of Mathematics STA 584 Supplementary Examples (not to be graded) Fall, 003 1. (a) If A and B are independent events, P(A) =.40 and P(B) =.70, find (i)
Page 1 of 8 Central Michigan University Department of Mathematics STA 584 Supplementary Examples (not to be graded) Fall, 003 1. (a) If A and B are independent events, P(A) =.40 and P(B) =.70, find (i)
STAT 418: Probability and Stochastic Processes
 STAT 418: Probability and Stochastic Processes Spring 2016; Homework Assignments Latest updated on April 29, 2016 HW1 (Due on Jan. 21) Chapter 1 Problems 1, 8, 9, 10, 11, 18, 19, 26, 28, 30 Theoretical
Masters Comprehensive Examination Department of Statistics, University of Florida
 Masters Comprehensive Examination Department of Statistics, University of Florida May 6, 003, 8:00 am - :00 noon Instructions: You have four hours to answer questions in this examination You must show
SDS 321: Practice questions
 SDS 2: Practice questions Discrete. My partner and I are one of married couples at a dinner party. The 2 people are given random seats around a round table. (a) What is the probability that I am seated
UC Berkeley Department of Electrical Engineering and Computer Sciences. EECS 126: Probability and Random Processes
 UC Berkeley Department of Electrical Engineering and Computer Sciences EECS 6: Probability and Random Processes Problem Set 3 Spring 9 Self-Graded Scores Due: February 8, 9 Submit your self-graded scores
Introduction to Simple Linear Regression
 Introduction to Simple Linear Regression Yang Feng http://www.stat.columbia.edu/~yangfeng Yang Feng (Columbia University) Introduction to Simple Linear Regression 1 / 68 About me Faculty in the Department
4. Distributions of Functions of Random Variables
 4. Distributions of Functions of Random Variables Setup: Consider as given the joint distribution of X 1,..., X n (i.e. consider as given f X1,...,X n and F X1,...,X n ) Consider k functions g 1 : R n
Statistics 427: Sample Final Exam
 Statistics 427: Sample Final Exam Instructions: The following sample exam was given several quarters ago in Stat 427. The same topics were covered in the class that year. This sample exam is meant to be
Lectures on Statistics. William G. Faris
 Lectures on Statistics William G. Faris December 1, 2003 ii Contents 1 Expectation 1 1.1 Random variables and expectation................. 1 1.2 The sample mean........................... 3 1.3 The sample
1 Probability theory. 2 Random variables and probability theory.
 Probability theory Here we summarize some of the probability theory we need. If this is totally unfamiliar to you, you should look at one of the sources given in the readings. In essence, for the major
MAS3301 Bayesian Statistics
 MAS331 Bayesian Statistics M. Farrow School of Mathematics and Statistics Newcastle University Semester 2, 28-9 1 9 Conjugate Priors II: More uses of the beta distribution 9.1 Geometric observations 9.1.1
Practice Problems Section Problems
 Practice Problems Section 4-4-3 4-4 4-5 4-6 4-7 4-8 4-10 Supplemental Problems 4-1 to 4-9 4-13, 14, 15, 17, 19, 0 4-3, 34, 36, 38 4-47, 49, 5, 54, 55 4-59, 60, 63 4-66, 68, 69, 70, 74 4-79, 81, 84 4-85,
Originality in the Arts and Sciences: Lecture 2: Probability and Statistics
 Originality in the Arts and Sciences: Lecture 2: Probability and Statistics Let s face it. Statistics has a really bad reputation. Why? 1. It is boring. 2. It doesn t make a lot of sense. Actually, the
EXAMINATIONS OF THE ROYAL STATISTICAL SOCIETY
 EXAMINATIONS OF THE ROYAL STATISTICAL SOCIETY GRADUATE DIPLOMA, 00 MODULE : Statistical Inference Time Allowed: Three Hours Candidates should answer FIVE questions. All questions carry equal marks. The
STAT:2020 Probability and Statistics for Engineers Exam 2 Mock-up. 100 possible points
 STAT:2020 Probability and Statistics for Engineers Exam 2 Mock-up 100 possible points Student Name Section [letter/#] Section [day/time] Instructions: 1) Make sure you have the correct number of pages.
Review. December 4 th, Review
 December 4 th, 2017 Att. Final exam: Course evaluation Friday, 12/14/2018, 10:30am 12:30pm Gore Hall 115 Overview Week 2 Week 4 Week 7 Week 10 Week 12 Chapter 6: Statistics and Sampling Distributions Chapter
1. Let X be a random variable with probability density function. 1 x < f(x) = 0 otherwise
 = 0 otherwise") Name M36K Final. Let X be a random variable with probability density function { /x x < f(x = 0 otherwise Compute the following. You can leave your answers in integral form. (a ( points Find F X (t = P
Name M36K Final. Let X be a random variable with probability density function { /x x < f(x = 0 otherwise Compute the following. You can leave your answers in integral form. (a ( points Find F X (t = P
DS-GA 1003: Machine Learning and Computational Statistics Homework 7: Bayesian Modeling
 DS-GA 1003: Machine Learning and Computational Statistics Homework 7: Bayesian Modeling Due: Tuesday, May 10, 2016, at 6pm (Submit via NYU Classes) Instructions: Your answers to the questions below, including
Two hours. Statistical Tables to be provided THE UNIVERSITY OF MANCHESTER. 14 January :45 11:45
 Two hours Statistical Tables to be provided THE UNIVERSITY OF MANCHESTER PROBABILITY 2 14 January 2015 09:45 11:45 Answer ALL four questions in Section A (40 marks in total) and TWO of the THREE questions
Class 8 Review Problems solutions, 18.05, Spring 2014
 Class 8 Review Problems solutions, 8.5, Spring 4 Counting and Probability. (a) Create an arrangement in stages and count the number of possibilities at each stage: ( ) Stage : Choose three of the slots
Inferences About Two Population Proportions
 Inferences About Two Population Proportions MATH 130, Elements of Statistics I J. Robert Buchanan Department of Mathematics Fall 2018 Background Recall: for a single population the sampling proportion
Spring 2012 Math 541B Exam 1
 Spring 2012 Math 541B Exam 1 1. A sample of size n is drawn without replacement from an urn containing N balls, m of which are red and N m are black; the balls are otherwise indistinguishable. Let X denote
STA 2101/442 Assignment 3 1
 STA 2101/442 Assignment 3 1 These questions are practice for the midterm and final exam, and are not to be handed in. 1. Suppose X 1,..., X n are a random sample from a distribution with mean µ and variance
AMCS243/CS243/EE243 Probability and Statistics. Fall Final Exam: Sunday Dec. 8, 3:00pm- 5:50pm VERSION A
 AMCS243/CS243/EE243 Probability and Statistics Fall 2013 Final Exam: Sunday Dec. 8, 3:00pm- 5:50pm VERSION A *********************************************************** ID: ***********************************************************
Hypothesis Testing: Chi-Square Test 1
 Hypothesis Testing: Chi-Square Test 1 November 9, 2017 1 HMS, 2017, v1.0 Chapter References Diez: Chapter 6.3 Navidi, Chapter 6.10 Chapter References 2 Chi-square Distributions Let X 1, X 2,... X n be
Chris Piech CS109 CS109 Final Exam. Fall Quarter Dec 14 th, 2017
 Chris Piech CS109 CS109 Final Exam Fall Quarter Dec 14 th, 2017 This is a closed calculator/computer exam. You are, however, allowed to use notes in the exam. The last page of the exam is a Standard Normal
18.05 Practice Final Exam
 No calculators. 18.05 Practice Final Exam Number of problems 16 concept questions, 16 problems. Simplifying expressions Unless asked to explicitly, you don t need to simplify complicated expressions. For
Sampling Distributions
 In statistics, a random sample is a collection of independent and identically distributed (iid) random variables, and a sampling distribution is the distribution of a function of random sample. For example,
GEOMETRIC -discrete A discrete random variable R counts number of times needed before an event occurs
 STATISTICS 4 Summary Notes. Geometric and Exponential Distributions GEOMETRIC -discrete A discrete random variable R counts number of times needed before an event occurs P(X = x) = ( p) x p x =,, 3,...
1 Basic continuous random variable problems
 Name M362K Final Here are problems concerning material from Chapters 5 and 6. To review the other chapters, look over previous practice sheets for the two exams, previous quizzes, previous homeworks and
Table of z values and probabilities for the standard normal distribution. z is the first column plus the top row. Each cell shows P(X z).
.") Table of z values and probabilities for the standard normal distribution. z is the first column plus the top row. Each cell shows P(X z). For example P(X.04) =.8508. For z < 0 subtract the value from,
Table of z values and probabilities for the standard normal distribution. z is the first column plus the top row. Each cell shows P(X z). For example P(X.04) =.8508. For z < 0 subtract the value from,
Chapter 4 continued. Chapter 4 sections
 Chapter 4 sections Chapter 4 continued 4.1 Expectation 4.2 Properties of Expectations 4.3 Variance 4.4 Moments 4.5 The Mean and the Median 4.6 Covariance and Correlation 4.7 Conditional Expectation SKIP:
ECE 302 Division 2 Exam 2 Solutions, 11/4/2009.
 NAME: ECE 32 Division 2 Exam 2 Solutions, /4/29. You will be required to show your student ID during the exam. This is a closed-book exam. A formula sheet is provided. No calculators are allowed. Total
STA2603/205/1/2014 /2014. ry II. Tutorial letter 205/1/
 STA263/25//24 Tutorial letter 25// /24 Distribution Theor ry II STA263 Semester Department of Statistics CONTENTS: Examination preparation tutorial letterr Solutions to Assignment 6 2 Dear Student, This
Probability and Distributions
 Probability and Distributions What is a statistical model? A statistical model is a set of assumptions by which the hypothetical population distribution of data is inferred. It is typically postulated
STAT 515 MIDTERM 2 EXAM November 14, 2018
 STAT 55 MIDTERM 2 EXAM November 4, 28 NAME: Section Number: Instructor: In problems that require reasoning, algebraic calculation, or the use of your graphing calculator, it is not sufficient just to write
Estimation theory. Parametric estimation. Properties of estimators. Minimum variance estimator. Cramer-Rao bound. Maximum likelihood estimators
 Estimation theory Parametric estimation Properties of estimators Minimum variance estimator Cramer-Rao bound Maximum likelihood estimators Confidence intervals Bayesian estimation 1 Random Variables Let
Introduction to Probability
 Introduction to Probability Math 353, Section 1 Fall 212 Homework 9 Solutions 1. During a season, a basketball team plays 7 home games and 6 away games. The coach estimates at the beginning of the season