SDS 321: Practice questions
|
|
|
- William Owen
- 6 years ago
- Views:
Transcription
1 SDS 2: Practice questions Discrete. My partner and I are one of married couples at a dinner party. The 2 people are given random seats around a round table. (a) What is the probability that I am seated next to my spouse? there are two seats next to me, and 9 people who can sit in those seats. P (spouse on left) = /9, P (spouse on right spouse not on left)p (spouse not on left) = /8 8/9 = /9, so P (next to spouse) = 2/9. (b) What is the expected number of couples that are seated next to each other? The expected number of people sat next to their spouse is 4/9 (sum of expectations). So, the expected number of couples sat next to each other is 2/9. 2. How many unique combinations can you get by rearranging the letters MISSISSIPPI? letters so! permutations. 4 Is, 4Ss, 2 Ps, so!/(4!4!2!) unique combinations.. Combinatorics question: (a) How many different solutions are there to the equation x + x 2 + x =, where x, x 2 and x are positive integers? (count x =, x 2 = 2, x = 7 and x = 2, x 2 =, x = 7 as two separate solutions). Stars and bars... We have 9 places to put the first bar, and 8 places to put the second. But, there are 2 possible rearrangements of the bars. So, 9 8/2 = 6. Or, equivalently, there are ( 9 2=6) ways of placing 2 bars. (b) How many different solutions are there to the equation x + x 2 + x =, where x < x 2? We know there are 6 solutions in total. Of these, let s remove the solutions where x = x 2. We have 4 such solutions (x = x 2 =, x = x 2 = 2, x = x 2 =, x = x 2 = 4), leaving 2 solutions with different x and x 2. Of these, half have x < x 2, so 6 solutions. (c) How many different solutions are there to the equation x + x 2 + x =, where x < x 2 < x? We know there are 6 solutions in total. Let s first remove the solutions with repeats. We have no solutions with all three numbers the same, and 2 solutions with 2 numbers the same ( ways each of having 2 ones, 2 twos, 2 threes, 2 fours). So, 24 solutions with no repeats. Of these, there are! permutations of each sequence, so there are 24/! = 4 solutions. Double checking, we have +2+7, ++6, +4+5, that s it!
2 4. I have three envelopes, each containing two objects. In one, there is a silver square and a gold disk. In another, there are a gold square and a gold disk. In the third, there are a silver square and a silver disk. (a) I pick an envelope (at random), and take out an object (at random). It is gold. What is the probability that the second object is silver? We have 4 possibilities: (S,S) (prob /), (S,G) (prob /6), (G,S) prob (/6), (G,G) (prob /). We want A = {2nd item is S} and B = {st item is G}. P (A B) = P (AB)/P (B) = P (GS) P (G,S)+P (G,G) = (/6)/(/2) = /. (b) I put the objects back in their envelope and shuffle the envelopes. I again pick an envelope (at random), and take out an object (at random). It is a gold disk. What is the probability that the second object is silver? Let D be disk, Q be square. Our sample space, after we know the first object is a gold disk, is now (GD, SQ), (GD, GQ). So, the probability is /2. 5. On the first day of a non-leap-year, I put $ in a box. On the second day, I put $2 in the box. On the third day, I put $ in. And so on. At the end of the year (65 days), how much money is in the box? The first day you put in $, the last day you put in $65. The average of these two is 8. The average of the second and penultimate days is also 8. Etc. So, the total is 65 8 = $ Alice and Bob are playing rock-paper-scissors. If both Alice and Bob play the same hand, they play again. What is the expected number of turns before someone wins? This is a Geometric distribution with p = 2/ (probability someone wins). The expected value of a random variable with total number of tries upto the first success is /p = /2. Since we are interested in the expected number of turns before somebody wins, our answer is /2 = /2. 2 Continuous. Let X be a normal random variable with mean and variance, and let Y be a normal random variable with mean 4 and variance 2. (a) What is the distribution of Z = X + Y? Normal(7, ) (b) What is the probability that Z is between 6 and 8? P(6 Z 8) = P( 6 7 Z ) = P(.577 Z 7.577) =.44 (from standard normal tables) 2. I am waiting for a bus, that I know will arrive at some time between pm and 2pm, with all times being equally likely. It gets to :, and the bus has still not arrived. What is the probability that it arrives before :4? /. Let X be a continuous random variable with PDF {.25x +.25 x f X (x) = otherwise 2
3 What is the PDF of Z = X? The CDF is P (Z z). If z < this is zero since Z is always positive. If z > this is one. So the action is in between. If z, then F Z (z) = P ( X z) = P ( z X z) = If < z then z z (.25x +.25)dx =.25z. F Z (z) = P ( X z) = P ( < X < )+P ( X z) = (z 2 /2 )+.25(z ) Differentiating we get:.25 z f Z (z) = z < z otherwise. Let X be a continuous random variable, with PDF: x < f X (x) =.5 x < ce x x (a) What is c? We need f X (x)dx =, so ce x dx =.5. The integral gives c[ e x ] = ce so c =.5e (b) What is the conditional expectation of X, given X <? E[X X < ] =.5 (c) What is the conditional expectation of X, given X? E[X(X )] = cxe x dx =, since ce x is f X (x)(x ). Note that E[X X ] = E[X(X )]/P (X ) = /(/2) = 2 Another way to do this is to note that and so Substituting, x-=v 2c f X X (x) = f X (x)(x )/P (X ) = ce x /.5 E[X X ] = cxe x dx/.5 = 2c ( + v)e (+v) dv = 2c e ( + xe x dx ve v dv) = 4c/e = 2
4 (d) What is the expectation of X? E[X] = P (X < ).5 + P (X ) 2 = = Let X and Y be random variables with joint PDF: { ay x, y f X,Y (x, y) = x 2 otherwise (a) What is a? so, a = 2 f X (x) = = ay x 2 dy = [ ay 2 2x 2 a [ 2x 2 dx = a 2x ] ] = a 2x 2 = /2 (b) What is the conditional PDF f Y X (y x) of Y given X = x? f Y X (y x) = f X,Y (x, y) f X (x) = ay/x2 a/2x 2 = 2y (c) What is the conditional expectation of Y given X? So, E[Y X] = 2/. E[Y X = x] = 2y 2 dy = 2/ (d) What is the expected value of Y? E[Y ] = E[E[Y X]] = 2/. Let X and Y be uniform random variables between and. What is the probability that: (a) X < Y.5 (b) X < 2Y If Y = y, P(X 2y) = 2y if y.5, if y >.5,. So, overall, P(X 2Y ) =.5 2ydy +.5 dy = =.75. (c) X + Y <.5 If Y = y, P(X + Y <.5 Y = y) =.5 y for y <.5. Integrating over y we have: P(X + Y <.5) =.5 (.5 y)dy =.25 (d) max{x, Y }.7 P(max{X, Y }.7 = P(X.7)P(Y.7) =.7 2 = Let X be the number of ice-cream cones a vendor sells on a day. If the average temperature of a summer day is a random variable Y (in Fahrenheit), where Y Uniform([95, 5]). We also have X P oisson(y 2 / + Y/5 + 5). 4
5 (a) What is E[X Y ]? E[X Y = y] = y 2 /+y/5+5. So E[X Y ] = Y 2 /+Y/5+5. (b) What is E[X]? Remember E[Y 2 ] = var(y ) + E[Y ] 2 = (5 95) 2 /2 + 2 = 8. E[X] = E[Y 2 ]/ + E[Y ]/5 + 5 = 8/ + /5 + 5 = = If there are no distractions, it takes me minutes to walk to the store. However, if I pass someone with a dog, I stop and pet the dog and chat to the owner. The number Y of dogs I pass is a Poisson random variable with mean 2. Each time I stop, the number of minutes I spend petting the dog and chatting is an exponential random variable with PDF: f X (x) =.5e.5x (a) If I see a single dog, what is the expectation and variance of the time spent petting the dog and chatting to its owner? X is exponential, and so E[X] =.5xe.5x dx = 2, E[X 2 ] =.5x 2 e.5x = 8, var(x) = E[X 2 ] E[X] 2 = 4. (b) What is the conditional expectation of the total time spent petting dogs and chatting to their owners, as a function of Y? E[X Y = y] = 2y, (expectation of sum), so E[X Y ] = 2Y (c) Using the law of iterated expectation calculate E[X]. E[X] = E[E[X Y ]] = 2E[Y ] = 2 2 = 4. Statistics. Consider n iid Poisson random variables X i P oisson(λ). (a) What is the MLE ˆλ of λ? Calculate log likelihood l λ = i log(e λ λ X i /X i!) = nλ + i X i log λ + const. The constant term does not depend on λ, so we dont need to worry about it. Differentiate and set to zero and solve. n+ i X i/ˆλ =. So ˆλ = i X i/n. (b) Is it unbiased or biased? Unbiased. 2. Consider n iid Exponential random variables X i Exp(λ). (a) What is the MLE ˆλ of λ? We did this in class. ˆλ = / X n. (b) Is /ˆλ an unbiased or biased estimator of /λ? E[/ˆλ] = i E[X i]/n = /λ. So unbiased. (c) What is the variance of /ˆλ? var(/ˆλ) = var( X n ) = var(x )/n = nλ 2 (d) Using CLT approximate the distribution of /ˆλ. N ˆλ ( λ, ) nλ 2 (e) Using CLT, compute how big n had to be in order to have P ( /ˆλ /λ./λ) =.95. P ( /ˆλ /λ /λ. n) P ( Z. n) =.95. So. n =.96 n and so n 4. 5
6 (f) Using Chebyshev s inequality, use the n you found in the last question to upper bound P ( /ˆλ /λ./λ). P ( /ˆλ /λ./λ) var(/ˆλ)/(./λ 2 ) = /(n.) = /4.. On a given day, a P oisson() number of insects fly through my yard. Using an appropriate approximation, what is the the probability that, over the month of May ( days), the average number of insects is between 98 and 2? You may use the fact that a P oisson(λ) random variable has mean and variance λ. E[X i ] = λ so E[ X] = λ. var(x i ) = λ, so var( X) = λ/n. We can approximate the distribution as N ormal(λ, λ/n) = N ormal(, /). P(98 X 2 2) P( Z / 2 / =.7 4. I am interested in seeing whether a sequence of 6 observations has zero mean. My null hypothesis is H : µ =, and my alternative is H : µ. I know the variance is. What is an appropriate rejection region for the null hypothesis at.5 significance? I want to pick γ s.t. P ( X > γ) =.25 under the null. Under the null, X Normal(, /6), so P( X > γ) = P(4 X > 4γ) =.25. We have P (Z >.96) =.25, so γ =.96/4 =.49. So, reject if X > I set up a motion sensor to look for intruders. The signal when there is no intruder is a normal random variable with mean and variance. The signal where there is an intruder is a normal random variable with mean and variance 2. (a) If I raise the alarm if the signal is greater than.7, what is my Type I error? Type I error is probability of false rejection of the null, i.e. P (X >.7) under the Normal(, ) null. From tables, we get α =.758 =.242 (b) What is the corresponding Type II error? Type II error is probability of false acceptance of the null, i.e. P (X <.7) under the Normal(, 2) null. This is the same as P ((X )/ 2 <./ 2) = P (Z <.2) =.582 =.468 (from the standard normal tables) 6. I have a coin with unknown probability of heads θ. I throw the coin n times, and count the number k of heads. What is the MLE estimator of θ? Is it biased or unbiased? hint: we can write the likelihood of a single Bernoulli random variable as f X (x i ; θ) = θ x i ( θ) x i differentiating and setting to zero, ˆθ = arg max θ k ( θ) n k θ kˆθ k ( ˆθ) n k (n k)ˆθ k ( ˆθ) n k = k( ˆθ) (n k)ˆθ = ˆθ = k/n ˆθ = i X i/n and by linearity of expectation, since E[X i ] = θ, this is unbiased. 6
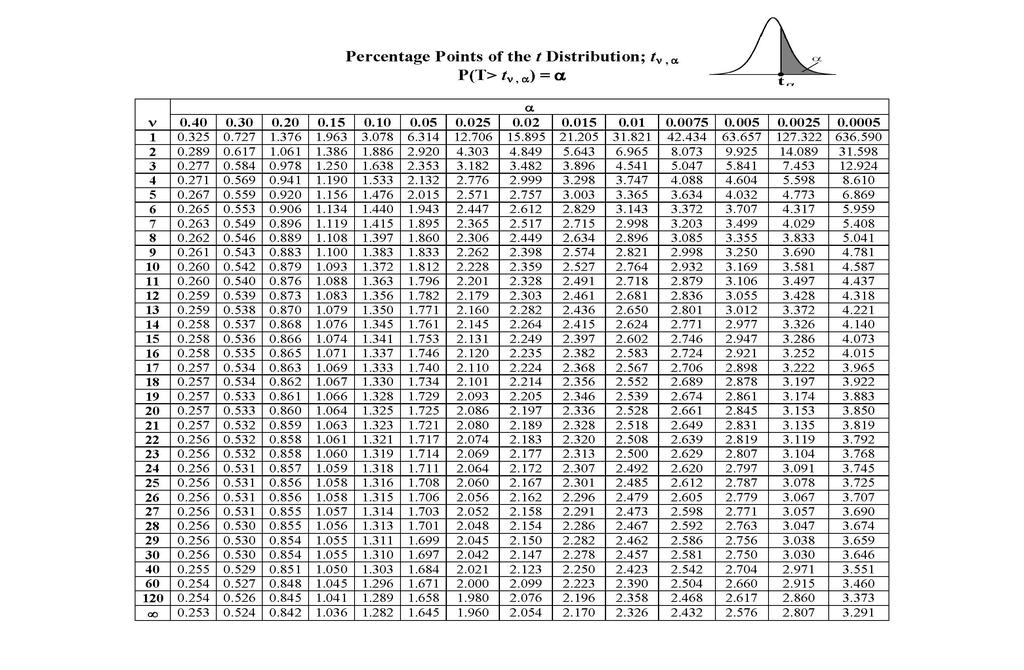
7 7. I have samples x,..., x from a normal distribution with unknown mean µ and i= variance 4. The mean x = x i of the samples is 5.. (a) What is the mean and variance of x? E[ x] = µ, var( x) = 4/ = 2/5. (b) Give a 95% confidence interval for the mean. We want P( X µ < γ) =.95. So, P( X µ < γ) =.975. So, P( X µ < γ/ 2/5) =.975. We know 2/5 P(Z <.96) =.975, so γ =.96 2/5 =.24. So, our C.I. is ( X.24, X +.24) (c) If I see more observations, will the confidence interval be narrower or wider? Narrower - because the variance of the sample mean will be smaller 8. I want to estimate the mean water level of a lake. I assume that, on any given day, the water level will be a normal random variable with unknown mean corresponding to the mean water level, and unknown variance σ 2. Show that ŝ 2 n = n i= (x i x) 2 n is an unbiased estimator for the variance. Bookwork You record the water height over three days as 5, 2, 8. unbiased estimator for the mean and variance of the water level. Calculate an X = ( )/ = 8 ŝ 2 n = (5 8)2 + (2 8) 2 + (8 8) 2 2 = 9 Using the attached t-distribution tables, give a.95 confidence region for the true mean. We want P( X µ > γ) =.5, i.e. P( X µ > γ) =.25. ( X µ)/ t 2 Do not forget to divide the sample standard deviation by n to get the standard deviation of the average or X. Thanks to Mert Hizli for catching this! Translating to the standard normal, this is the same as P( X µ = γ/ ) =.25. From the t-table with 2 degrees of freedom, we have γ/ = 4. so γ = So, an appropriate CI is (.55, 25.45) 9. I have 5 samples from a Poisson distribution with pdf p X (x) = λx e λ x!. My null hypothesis is that λ = ; my alternative hypothesis is that λ >. (a) Is this a one-sided or two-sided test? one-sided (b) Under the null hypothesis, use a normal approximation to estimate the probability that X <.9. You may use the fact that the mean and variance of a Poisson random variable are both λ. 7
8 Under the null, E[ X] = λ var( X) = λ/5. ( ) X P( X <.9) = P / 5 <. 5 P(Z < 2.2) = P(Z < 2.2) =.987 =.29 (c) We want to choose a critical value ξ such that we reject the null hypothesis if X > ξ. Find a value of ξ that gives a significance of.. We are looking for ξ ( s.t. P( X > ξ) =.. Translating to the standard normal, X this is the same as P / < ) 5(ξ ) =.. From the standard normal 5 tables, 5(ξ ) = 2. so ξ =... I have two independent sequences, X and Y (which are also mutually independent), with known variance σ 2 and unknown means µ X and µ Y. I want to test the null hypothesis that µ X = 2µ Y using a two-sided significance test. (a) Suggest an appropriate statistic specifically, a function of X and Ȳ that has zero mean under the null hypothesis. X 2 Ȳ (b) What is the variance of this statistic? var( X) + var(2ȳ ) = var( X) + 4var(Ȳ ) = 5σ 2 (c) Construct an appropriate significance test for the null hypothesis, at significance level α =.5 We want P( X 2Ȳ > γ) =.5 under the null. ( This is the ) same as P( X 2Ȳ > γ) =.25, which in turn is the same as P X 2 Ȳ 5σ < γ 5σ =.25. This gives γ 5σ =.96 so γ = 4.8σ 8
9 Standard normal table
10
Probability Models. 4. What is the definition of the expectation of a discrete random variable?
 1 Probability Models The list of questions below is provided in order to help you to prepare for the test and exam. It reflects only the theoretical part of the course. You should expect the questions
This does not cover everything on the final. Look at the posted practice problems for other topics.
 Class 7: Review Problems for Final Exam 8.5 Spring 7 This does not cover everything on the final. Look at the posted practice problems for other topics. To save time in class: set up, but do not carry
1. Let X be a random variable with probability density function. 1 x < f(x) = 0 otherwise
 = 0 otherwise") Name M36K Final. Let X be a random variable with probability density function { /x x < f(x = 0 otherwise Compute the following. You can leave your answers in integral form. (a ( points Find F X (t = P
Name M36K Final. Let X be a random variable with probability density function { /x x < f(x = 0 otherwise Compute the following. You can leave your answers in integral form. (a ( points Find F X (t = P
Probability and Statistics
 Probability and Statistics Jane Bae Stanford University hjbae@stanford.edu September 16, 2014 Jane Bae (Stanford) Probability and Statistics September 16, 2014 1 / 35 Overview 1 Probability Concepts Probability
S n = x + X 1 + X X n.
 0 Lecture 0 0. Gambler Ruin Problem Let X be a payoff if a coin toss game such that P(X = ) = P(X = ) = /2. Suppose you start with x dollars and play the game n times. Let X,X 2,...,X n be payoffs in each
CSE 312: Foundations of Computing II Quiz Section #10: Review Questions for Final Exam (solutions)
") CSE 312: Foundations of Computing II Quiz Section #10: Review Questions for Final Exam (solutions) 1. (Confidence Intervals, CLT) Let X 1,..., X n be iid with unknown mean θ and known variance σ 2. Assume
CSE 312: Foundations of Computing II Quiz Section #10: Review Questions for Final Exam (solutions) 1. (Confidence Intervals, CLT) Let X 1,..., X n be iid with unknown mean θ and known variance σ 2. Assume
IIT JAM : MATHEMATICAL STATISTICS (MS) 2013
 2013") IIT JAM : MATHEMATICAL STATISTICS (MS 2013 Question Paper with Answer Keys Ctanujit Classes Of Mathematics, Statistics & Economics Visit our website for more: www.ctanujit.in IMPORTANT NOTE FOR CANDIDATES
IIT JAM : MATHEMATICAL STATISTICS (MS 2013 Question Paper with Answer Keys Ctanujit Classes Of Mathematics, Statistics & Economics Visit our website for more: www.ctanujit.in IMPORTANT NOTE FOR CANDIDATES
This exam contains 13 pages (including this cover page) and 10 questions. A Formulae sheet is provided with the exam.
 and 10 questions. A Formulae sheet is provided with the exam.") Probability and Statistics FS 2017 Session Exam 22.08.2017 Time Limit: 180 Minutes Name: Student ID: This exam contains 13 pages (including this cover page) and 10 questions. A Formulae sheet is provided
Probability and Statistics FS 2017 Session Exam 22.08.2017 Time Limit: 180 Minutes Name: Student ID: This exam contains 13 pages (including this cover page) and 10 questions. A Formulae sheet is provided
CSE 312 Final Review: Section AA
 CSE 312 TAs December 8, 2011 General Information General Information Comprehensive Midterm General Information Comprehensive Midterm Heavily weighted toward material after the midterm Pre-Midterm Material
THE QUEEN S UNIVERSITY OF BELFAST
 THE QUEEN S UNIVERSITY OF BELFAST 0SOR20 Level 2 Examination Statistics and Operational Research 20 Probability and Distribution Theory Wednesday 4 August 2002 2.30 pm 5.30 pm Examiners { Professor R M
2. Suppose (X, Y ) is a pair of random variables uniformly distributed over the triangle with vertices (0, 0), (2, 0), (2, 1).
 is a pair of random variables uniformly distributed over the triangle with vertices (0, 0), (2, 0), (2, 1).") Name M362K Final Exam Instructions: Show all of your work. You do not have to simplify your answers. No calculators allowed. There is a table of formulae on the last page. 1. Suppose X 1,..., X 1 are independent
Name M362K Final Exam Instructions: Show all of your work. You do not have to simplify your answers. No calculators allowed. There is a table of formulae on the last page. 1. Suppose X 1,..., X 1 are independent
Exercises and Answers to Chapter 1
 Exercises and Answers to Chapter The continuous type of random variable X has the following density function: a x, if < x < a, f (x), otherwise. Answer the following questions. () Find a. () Obtain mean
STAT Chapter 5 Continuous Distributions
 STAT 270 - Chapter 5 Continuous Distributions June 27, 2012 Shirin Golchi () STAT270 June 27, 2012 1 / 59 Continuous rv s Definition: X is a continuous rv if it takes values in an interval, i.e., range
MAS223 Statistical Inference and Modelling Exercises
 MAS223 Statistical Inference and Modelling Exercises The exercises are grouped into sections, corresponding to chapters of the lecture notes Within each section exercises are divided into warm-up questions,
1 Basic continuous random variable problems
 Name M362K Final Here are problems concerning material from Chapters 5 and 6. To review the other chapters, look over previous practice sheets for the two exams, previous quizzes, previous homeworks and
Problem 1 (20) Log-normal. f(x) Cauchy
 Log-normal. f(x) Cauchy") ORF 245. Rigollet Date: 11/21/2008 Problem 1 (20) f(x) f(x) 0.0 0.1 0.2 0.3 0.4 0.0 0.2 0.4 0.6 0.8 4 2 0 2 4 Normal (with mean -1) 4 2 0 2 4 Negative-exponential x x f(x) f(x) 0.0 0.1 0.2 0.3 0.4 0.5
ORF 245. Rigollet Date: 11/21/2008 Problem 1 (20) f(x) f(x) 0.0 0.1 0.2 0.3 0.4 0.0 0.2 0.4 0.6 0.8 4 2 0 2 4 Normal (with mean -1) 4 2 0 2 4 Negative-exponential x x f(x) f(x) 0.0 0.1 0.2 0.3 0.4 0.5
MATH/STAT 3360, Probability Sample Final Examination Model Solutions
 MATH/STAT 3360, Probability Sample Final Examination Model Solutions This Sample examination has more questions than the actual final, in order to cover a wider range of questions. Estimated times are
STAT 414: Introduction to Probability Theory
 STAT 414: Introduction to Probability Theory Spring 2016; Homework Assignments Latest updated on April 29, 2016 HW1 (Due on Jan. 21) Chapter 1 Problems 1, 8, 9, 10, 11, 18, 19, 26, 28, 30 Theoretical Exercises
Exponential Distribution and Poisson Process
 Exponential Distribution and Poisson Process Stochastic Processes - Lecture Notes Fatih Cavdur to accompany Introduction to Probability Models by Sheldon M. Ross Fall 215 Outline Introduction Exponential
Review. December 4 th, Review
 December 4 th, 2017 Att. Final exam: Course evaluation Friday, 12/14/2018, 10:30am 12:30pm Gore Hall 115 Overview Week 2 Week 4 Week 7 Week 10 Week 12 Chapter 6: Statistics and Sampling Distributions Chapter
Exercises in Probability Theory Paul Jung MA 485/585-1C Fall 2015 based on material of Nikolai Chernov
 Exercises in Probability Theory Paul Jung MA 485/585-1C Fall 2015 based on material of Nikolai Chernov Many of the exercises are taken from two books: R. Durrett, The Essentials of Probability, Duxbury
Practice Problems Section Problems
 Practice Problems Section 4-4-3 4-4 4-5 4-6 4-7 4-8 4-10 Supplemental Problems 4-1 to 4-9 4-13, 14, 15, 17, 19, 0 4-3, 34, 36, 38 4-47, 49, 5, 54, 55 4-59, 60, 63 4-66, 68, 69, 70, 74 4-79, 81, 84 4-85,
1 Basic continuous random variable problems
 Name M362K Final Here are problems concerning material from Chapters 5 and 6. To review the other chapters, look over previous practice sheets for the two exams, previous quizzes, previous homeworks and
CME 106: Review Probability theory
 : Probability theory Sven Schmit April 3, 2015 1 Overview In the first half of the course, we covered topics from probability theory. The difference between statistics and probability theory is the following:
We introduce methods that are useful in:
 Instructor: Shengyu Zhang Content Derived Distributions Covariance and Correlation Conditional Expectation and Variance Revisited Transforms Sum of a Random Number of Independent Random Variables more
Continuous r.v practice problems
 Continuous r.v practice problems SDS 321 Intro to Probability and Statistics 1. (2+2+1+1 6 pts) The annual rainfall (in inches) in a certain region is normally distributed with mean 4 and standard deviation
Final Solutions Fri, June 8
 EE178: Probabilistic Systems Analysis, Spring 2018 Final Solutions Fri, June 8 1. Small problems (62 points) (a) (8 points) Let X 1, X 2,..., X n be independent random variables uniformly distributed on
This paper is not to be removed from the Examination Halls
 ~~ST104B ZA d0 This paper is not to be removed from the Examination Halls UNIVERSITY OF LONDON ST104B ZB BSc degrees and Diplomas for Graduates in Economics, Management, Finance and the Social Sciences,
EECS 126 Probability and Random Processes University of California, Berkeley: Spring 2015 Abhay Parekh February 17, 2015.
 EECS 126 Probability and Random Processes University of California, Berkeley: Spring 2015 Abhay Parekh February 17, 2015 Midterm Exam Last name First name SID Rules. You have 80 mins (5:10pm - 6:30pm)
01 Probability Theory and Statistics Review
 NAVARCH/EECS 568, ROB 530 - Winter 2018 01 Probability Theory and Statistics Review Maani Ghaffari January 08, 2018 Last Time: Bayes Filters Given: Stream of observations z 1:t and action data u 1:t Sensor/measurement
Continuous Expectation and Variance, the Law of Large Numbers, and the Central Limit Theorem Spring 2014
 Continuous Expectation and Variance, the Law of Large Numbers, and the Central Limit Theorem 18.5 Spring 214.5.4.3.2.1-4 -3-2 -1 1 2 3 4 January 1, 217 1 / 31 Expected value Expected value: measure of
STAT FINAL EXAM
 STAT101 2013 FINAL EXAM This exam is 2 hours long. It is closed book but you can use an A-4 size cheat sheet. There are 10 questions. Questions are not of equal weight. You may need a calculator for some
Non-parametric Inference and Resampling
 Non-parametric Inference and Resampling Exercises by David Wozabal (Last update. Juni 010) 1 Basic Facts about Rank and Order Statistics 1.1 10 students were asked about the amount of time they spend surfing
Statistics 100A Homework 5 Solutions
 Chapter 5 Statistics 1A Homework 5 Solutions Ryan Rosario 1. Let X be a random variable with probability density function a What is the value of c? fx { c1 x 1 < x < 1 otherwise We know that for fx to
EECS 126 Probability and Random Processes University of California, Berkeley: Fall 2014 Kannan Ramchandran November 13, 2014.
 EECS 126 Probability and Random Processes University of California, Berkeley: Fall 2014 Kannan Ramchandran November 13, 2014 Midterm Exam 2 Last name First name SID Rules. DO NOT open the exam until instructed
A Very Brief Summary of Statistical Inference, and Examples
 A Very Brief Summary of Statistical Inference, and Examples Trinity Term 2009 Prof. Gesine Reinert Our standard situation is that we have data x = x 1, x 2,..., x n, which we view as realisations of random
Class 26: review for final exam 18.05, Spring 2014
 Probability Class 26: review for final eam 8.05, Spring 204 Counting Sets Inclusion-eclusion principle Rule of product (multiplication rule) Permutation and combinations Basics Outcome, sample space, event
Math 407: Probability Theory 5/10/ Final exam (11am - 1pm)
") Math 407: Probability Theory 5/10/2013 - Final exam (11am - 1pm) Name: USC ID: Signature: 1. Write your name and ID number in the spaces above. 2. Show all your work and circle your final answer. Simplify
Math 407: Probability Theory 5/10/2013 - Final exam (11am - 1pm) Name: USC ID: Signature: 1. Write your name and ID number in the spaces above. 2. Show all your work and circle your final answer. Simplify
Chapter 5. Chapter 5 sections
 1 / 43 sections Discrete univariate distributions: 5.2 Bernoulli and Binomial distributions Just skim 5.3 Hypergeometric distributions 5.4 Poisson distributions Just skim 5.5 Negative Binomial distributions
GEOMETRIC -discrete A discrete random variable R counts number of times needed before an event occurs
 STATISTICS 4 Summary Notes. Geometric and Exponential Distributions GEOMETRIC -discrete A discrete random variable R counts number of times needed before an event occurs P(X = x) = ( p) x p x =,, 3,...
STAT 418: Probability and Stochastic Processes
 STAT 418: Probability and Stochastic Processes Spring 2016; Homework Assignments Latest updated on April 29, 2016 HW1 (Due on Jan. 21) Chapter 1 Problems 1, 8, 9, 10, 11, 18, 19, 26, 28, 30 Theoretical
2. Variance and Covariance: We will now derive some classic properties of variance and covariance. Assume real-valued random variables X and Y.
 CS450 Final Review Problems Fall 08 Solutions or worked answers provided Problems -6 are based on the midterm review Identical problems are marked recap] Please consult previous recitations and textbook
EC212: Introduction to Econometrics Review Materials (Wooldridge, Appendix)
") 1 EC212: Introduction to Econometrics Review Materials (Wooldridge, Appendix) Taisuke Otsu London School of Economics Summer 2018 A.1. Summation operator (Wooldridge, App. A.1) 2 3 Summation operator For
1 EC212: Introduction to Econometrics Review Materials (Wooldridge, Appendix) Taisuke Otsu London School of Economics Summer 2018 A.1. Summation operator (Wooldridge, App. A.1) 2 3 Summation operator For
ISyE 6644 Fall 2016 Test #1 Solutions
 1 NAME ISyE 6644 Fall 2016 Test #1 Solutions This test is 85 minutes. You re allowed one cheat sheet. Good luck! 1. Suppose X has p.d.f. f(x) = 3x 2, 0 < x < 1. Find E[3X + 2]. Solution: E[X] = 1 0 x 3x2
A Probability Primer. A random walk down a probabilistic path leading to some stochastic thoughts on chance events and uncertain outcomes.
 A Probability Primer A random walk down a probabilistic path leading to some stochastic thoughts on chance events and uncertain outcomes. Are you holding all the cards?? Random Events A random event, E,
(Practice Version) Midterm Exam 2
 Midterm Exam 2") EECS 126 Probability and Random Processes University of California, Berkeley: Fall 2014 Kannan Ramchandran November 7, 2014 (Practice Version) Midterm Exam 2 Last name First name SID Rules. DO NOT open
EECS 126 Probability and Random Processes University of California, Berkeley: Fall 2014 Kannan Ramchandran November 7, 2014 (Practice Version) Midterm Exam 2 Last name First name SID Rules. DO NOT open
Probability and Distributions
 Probability and Distributions What is a statistical model? A statistical model is a set of assumptions by which the hypothetical population distribution of data is inferred. It is typically postulated
Quick Tour of Basic Probability Theory and Linear Algebra
 Quick Tour of and Linear Algebra Quick Tour of and Linear Algebra CS224w: Social and Information Network Analysis Fall 2011 Quick Tour of and Linear Algebra Quick Tour of and Linear Algebra Outline Definitions
Lecture 2: Repetition of probability theory and statistics
 Algorithms for Uncertainty Quantification SS8, IN2345 Tobias Neckel Scientific Computing in Computer Science TUM Lecture 2: Repetition of probability theory and statistics Concept of Building Block: Prerequisites:
SOLUTION FOR HOMEWORK 11, ACTS 4306
 SOLUTION FOR HOMEWORK, ACTS 36 Welcome to your th homework. This is a collection of transformation, Central Limit Theorem (CLT), and other topics.. Solution: By definition of Z, Var(Z) = Var(3X Y.5). We
Massachusetts Institute of Technology Department of Electrical Engineering & Computer Science 6.041/6.431: Probabilistic Systems Analysis
 6.04/6.43: Probabilistic Systems Analysis Question : Multiple choice questions. CLEARLY circle the best answer for each question below. Each question is worth 4 points each, with no partial credit given.
UNIVERSITY OF TORONTO SCARBOROUGH Department of Computer and Mathematical Sciences FINAL EXAMINATION, APRIL 2013
 UNIVERSITY OF TORONTO SCARBOROUGH Department of Computer and Mathematical Sciences FINAL EXAMINATION, APRIL 2013 STAB57H3 Introduction to Statistics Duration: 3 hours Last Name: First Name: Student number:
Probability Theory and Statistics. Peter Jochumzen
 Probability Theory and Statistics Peter Jochumzen April 18, 2016 Contents 1 Probability Theory And Statistics 3 1.1 Experiment, Outcome and Event................................ 3 1.2 Probability............................................
STAT/MA 416 Answers Homework 6 November 15, 2007 Solutions by Mark Daniel Ward PROBLEMS
 STAT/MA 4 Answers Homework November 5, 27 Solutions by Mark Daniel Ward PROBLEMS Chapter Problems 2a. The mass p, corresponds to neither of the first two balls being white, so p, 8 7 4/39. The mass p,
Week 9 The Central Limit Theorem and Estimation Concepts
 Week 9 and Estimation Concepts Week 9 and Estimation Concepts Week 9 Objectives 1 The Law of Large Numbers and the concept of consistency of averages are introduced. The condition of existence of the population
EECS 70 Discrete Mathematics and Probability Theory Fall 2015 Walrand/Rao Final
 EECS 70 Discrete Mathematics and Probability Theory Fall 2015 Walrand/Rao Final PRINT Your Name:, (last) SIGN Your Name: (first) PRINT Your Student ID: CIRCLE your exam room: 220 Hearst 230 Hearst 237
Estimation theory. Parametric estimation. Properties of estimators. Minimum variance estimator. Cramer-Rao bound. Maximum likelihood estimators
 Estimation theory Parametric estimation Properties of estimators Minimum variance estimator Cramer-Rao bound Maximum likelihood estimators Confidence intervals Bayesian estimation 1 Random Variables Let
STAT 516 Midterm Exam 2 Friday, March 7, 2008
 STAT 516 Midterm Exam 2 Friday, March 7, 2008 Name Purdue student ID (10 digits) 1. The testing booklet contains 8 questions. 2. Permitted Texas Instruments calculators: BA-35 BA II Plus BA II Plus Professional
Two hours. Statistical Tables to be provided THE UNIVERSITY OF MANCHESTER. 14 January :45 11:45
 Two hours Statistical Tables to be provided THE UNIVERSITY OF MANCHESTER PROBABILITY 2 14 January 2015 09:45 11:45 Answer ALL four questions in Section A (40 marks in total) and TWO of the THREE questions
HW1 (due 10/6/05): (from textbook) 1.2.3, 1.2.9, , , (extra credit) A fashionable country club has 100 members, 30 of whom are
: (from textbook) 1.2.3, 1.2.9, , , (extra credit) A fashionable country club has 100 members, 30 of whom are") HW1 (due 10/6/05): (from textbook) 1.2.3, 1.2.9, 1.2.11, 1.2.12, 1.2.16 (extra credit) A fashionable country club has 100 members, 30 of whom are lawyers. Rumor has it that 25 of the club members are liars
HW1 (due 10/6/05): (from textbook) 1.2.3, 1.2.9, 1.2.11, 1.2.12, 1.2.16 (extra credit) A fashionable country club has 100 members, 30 of whom are lawyers. Rumor has it that 25 of the club members are liars
Tom Salisbury
 MATH 2030 3.00MW Elementary Probability Course Notes Part V: Independence of Random Variables, Law of Large Numbers, Central Limit Theorem, Poisson distribution Geometric & Exponential distributions Tom
Chapter 1: Revie of Calculus and Probability
 Chapter 1: Revie of Calculus and Probability Refer to Text Book: Operations Research: Applications and Algorithms By Wayne L. Winston,Ch. 12 Operations Research: An Introduction By Hamdi Taha, Ch. 12 OR441-Dr.Khalid
CSE 312, 2017 Winter, W.L. Ruzzo. 7. continuous random variables
 CSE 312, 2017 Winter, W.L. Ruzzo 7. continuous random variables The new bit continuous random variables Discrete random variable: values in a finite or countable set, e.g. X {1,2,..., 6} with equal probability
Mathematical statistics
 October 18 th, 2018 Lecture 16: Midterm review Countdown to mid-term exam: 7 days Week 1 Chapter 1: Probability review Week 2 Week 4 Week 7 Chapter 6: Statistics Chapter 7: Point Estimation Chapter 8:
You may use your calculator and a single page of notes.
 LAST NAME (Please Print): KEY FIRST NAME (Please Print): HONOR PLEDGE (Please Sign): Statistics 111 Midterm 2 This is a closed book exam. You may use your calculator and a single page of notes. The room
Guidelines for Solving Probability Problems
 Guidelines for Solving Probability Problems CS 1538: Introduction to Simulation 1 Steps for Problem Solving Suggested steps for approaching a problem: 1. Identify the distribution What distribution does
MATH 407 FINAL EXAM May 6, 2011 Prof. Alexander
 MATH 407 FINAL EXAM May 6, 2011 Prof. Alexander Problem Points Score 1 22 2 18 Last Name: First Name: USC ID: Signature: 3 20 4 21 5 27 6 18 7 25 8 28 Total 175 Points total 179 but 175 is maximum. This
Midterm Exam 1 Solution
 EECS 126 Probability and Random Processes University of California, Berkeley: Fall 2015 Kannan Ramchandran September 22, 2015 Midterm Exam 1 Solution Last name First name SID Name of student on your left:
Stat 100a, Introduction to Probability.
 Stat 100a, Introduction to Probability. Outline for the day: 1. Geometric random variables. 2. Negative binomial random variables. 3. Moment generating functions. 4. Poisson random variables. 5. Continuous
Math/Stats 425, Sec. 1, Fall 04: Introduction to Probability. Final Exam: Solutions
 Math/Stats 45, Sec., Fall 4: Introduction to Probability Final Exam: Solutions. In a game, a contestant is shown two identical envelopes containing money. The contestant does not know how much money is
Expectation. DS GA 1002 Statistical and Mathematical Models. Carlos Fernandez-Granda
 Expectation DS GA 1002 Statistical and Mathematical Models http://www.cims.nyu.edu/~cfgranda/pages/dsga1002_fall16 Carlos Fernandez-Granda Aim Describe random variables with a few numbers: mean, variance,
Section 4.6 Simple Linear Regression
 Section 4.6 Simple Linear Regression Objectives ˆ Basic philosophy of SLR and the regression assumptions ˆ Point & interval estimation of the model parameters, and how to make predictions ˆ Point and interval
Part IA Probability. Definitions. Based on lectures by R. Weber Notes taken by Dexter Chua. Lent 2015
 Part IA Probability Definitions Based on lectures by R. Weber Notes taken by Dexter Chua Lent 2015 These notes are not endorsed by the lecturers, and I have modified them (often significantly) after lectures.
18.440: Lecture 28 Lectures Review
 18.440: Lecture 28 Lectures 18-27 Review Scott Sheffield MIT Outline Outline It s the coins, stupid Much of what we have done in this course can be motivated by the i.i.d. sequence X i where each X i is
E X A M. Probability Theory and Stochastic Processes Date: December 13, 2016 Duration: 4 hours. Number of pages incl.
 E X A M Course code: Course name: Number of pages incl. front page: 6 MA430-G Probability Theory and Stochastic Processes Date: December 13, 2016 Duration: 4 hours Resources allowed: Notes: Pocket calculator,
ISyE 3044 Fall 2017 Test #1a Solutions
 1 NAME ISyE 344 Fall 217 Test #1a Solutions This test is 75 minutes. You re allowed one cheat sheet. Good luck! 1. Suppose X has p.d.f. f(x) = 4x 3, < x < 1. Find E[ 2 X 2 3]. Solution: By LOTUS, we have
Lecture 3. David Aldous. 31 August David Aldous Lecture 3
 Lecture 3 David Aldous 31 August 2015 This size-bias effect occurs in other contexts, such as class size. If a small Department offers two courses, with enrollments 90 and 10, then average class (faculty
Qualifying Exam CS 661: System Simulation Summer 2013 Prof. Marvin K. Nakayama
 Qualifying Exam CS 661: System Simulation Summer 2013 Prof. Marvin K. Nakayama Instructions This exam has 7 pages in total, numbered 1 to 7. Make sure your exam has all the pages. This exam will be 2 hours
Chapter 3, 4 Random Variables ENCS Probability and Stochastic Processes. Concordia University
 Chapter 3, 4 Random Variables ENCS6161 - Probability and Stochastic Processes Concordia University ENCS6161 p.1/47 The Notion of a Random Variable A random variable X is a function that assigns a real
Table of z values and probabilities for the standard normal distribution. z is the first column plus the top row. Each cell shows P(X z).
.") Table of z values and probabilities for the standard normal distribution. z is the first column plus the top row. Each cell shows P(X z). For example P(X.04) =.8508. For z < 0 subtract the value from,
Table of z values and probabilities for the standard normal distribution. z is the first column plus the top row. Each cell shows P(X z). For example P(X.04) =.8508. For z < 0 subtract the value from,
Continuous-time Markov Chains
 Continuous-time Markov Chains Gonzalo Mateos Dept. of ECE and Goergen Institute for Data Science University of Rochester gmateosb@ece.rochester.edu http://www.ece.rochester.edu/~gmateosb/ October 23, 2017
IE 230 Probability & Statistics in Engineering I. Closed book and notes. 120 minutes.
 Closed book and notes. 10 minutes. Two summary tables from the concise notes are attached: Discrete distributions and continuous distributions. Eight Pages. Score _ Final Exam, Fall 1999 Cover Sheet, Page
Write your Registration Number, Test Centre, Test Code and the Number of this booklet in the appropriate places on the answersheet.
 2016 Booklet No. Test Code : PSA Forenoon Questions : 30 Time : 2 hours Write your Registration Number, Test Centre, Test Code and the Number of this booklet in the appropriate places on the answersheet.
n(1 p i ) n 1 p i = 1 3 i=1 E(X i p = p i )P(p = p i ) = 1 3 p i = n 3 (p 1 + p 2 + p 3 ). p i i=1 P(X i = 1 p = p i )P(p = p i ) = p1+p2+p3
 n 1 p i = 1 3 i=1 E(X i p = p i )P(p = p i ) = 1 3 p i = n 3 (p 1 + p 2 + p 3 ). p i i=1 P(X i = 1 p = p i )P(p = p i ) = p1+p2+p3") Introduction to Probability Due:August 8th, 211 Solutions of Final Exam Solve all the problems 1. (15 points) You have three coins, showing Head with probabilities p 1, p 2 and p 3. You perform two different
Introduction to Probability Due:August 8th, 211 Solutions of Final Exam Solve all the problems 1. (15 points) You have three coins, showing Head with probabilities p 1, p 2 and p 3. You perform two different
CS 109 Midterm Review!
 CS 109 Midterm Review! Major Topics: Counting and Combinatorics Probability Conditional Probability Random Variables Discrete/Continuous Distributions Joint Distributions and Convolutions Counting Sum
1 Review of Probability and Distributions
 Random variables. A numerically valued function X of an outcome ω from a sample space Ω X : Ω R : ω X(ω) is called a random variable (r.v.), and usually determined by an experiment. We conventionally denote
Chapter 2. Discrete Distributions
 Chapter. Discrete Distributions Objectives ˆ Basic Concepts & Epectations ˆ Binomial, Poisson, Geometric, Negative Binomial, and Hypergeometric Distributions ˆ Introduction to the Maimum Likelihood Estimation
Basics of Stochastic Modeling: Part II
 Basics of Stochastic Modeling: Part II Continuous Random Variables 1 Sandip Chakraborty Department of Computer Science and Engineering, INDIAN INSTITUTE OF TECHNOLOGY KHARAGPUR August 10, 2016 1 Reference
SDS 321: Introduction to Probability and Statistics
 SDS 321: Introduction to Probability and Statistics Lecture 14: Continuous random variables Purnamrita Sarkar Department of Statistics and Data Science The University of Texas at Austin www.cs.cmu.edu/
Math Review Sheet, Fall 2008
 1 Descriptive Statistics Math 3070-5 Review Sheet, Fall 2008 First we need to know about the relationship among Population Samples Objects The distribution of the population can be given in one of the
CSE 312 Foundations, II Final Exam
 CSE 312 Foundations, II Final Exam 1 Anna Karlin June 11, 2014 DIRECTIONS: Closed book, closed notes except for one 8.5 11 sheet. Time limit 110 minutes. Calculators allowed. Grading will emphasize problem
Discrete Mathematics and Probability Theory Fall 2017 Ramchandran and Rao Final Solutions
 CS 70 Discrete Mathematics and Probability Theory Fall 2017 Ramchandran and Rao Final Solutions CS 70, Fall 2017, Final Solutions 1 1. Discrete Math: True/False (2pts/part,9 parts. 18 points) 1. (True/False)
Expectation. DS GA 1002 Probability and Statistics for Data Science. Carlos Fernandez-Granda
 Expectation DS GA 1002 Probability and Statistics for Data Science http://www.cims.nyu.edu/~cfgranda/pages/dsga1002_fall17 Carlos Fernandez-Granda Aim Describe random variables with a few numbers: mean,
ISyE 6739 Test 1 Solutions Summer 2015
 1 NAME ISyE 6739 Test 1 Solutions Summer 2015 This test is 100 minutes long. You are allowed one cheat sheet. 1. (50 points) Short-Answer Questions (a) What is any subset of the sample space called? Solution:
ECE 313: Conflict Final Exam Tuesday, May 13, 2014, 7:00 p.m. 10:00 p.m. Room 241 Everitt Lab
 University of Illinois Spring 1 ECE 313: Conflict Final Exam Tuesday, May 13, 1, 7: p.m. 1: p.m. Room 1 Everitt Lab 1. [18 points] Consider an experiment in which a fair coin is repeatedly tossed every
Mathematical statistics
 October 4 th, 2018 Lecture 12: Information Where are we? Week 1 Week 2 Week 4 Week 7 Week 10 Week 14 Probability reviews Chapter 6: Statistics and Sampling Distributions Chapter 7: Point Estimation Chapter
Mathematics Qualifying Examination January 2015 STAT Mathematical Statistics
 Mathematics Qualifying Examination January 2015 STAT 52800 - Mathematical Statistics NOTE: Answer all questions completely and justify your derivations and steps. A calculator and statistical tables (normal,
Statement: With my signature I confirm that the solutions are the product of my own work. Name: Signature:.
 MATHEMATICAL STATISTICS Homework assignment Instructions Please turn in the homework with this cover page. You do not need to edit the solutions. Just make sure the handwriting is legible. You may discuss
Chapter 3: Random Variables 1
 Chapter 3: Random Variables 1 Yunghsiang S. Han Graduate Institute of Communication Engineering, National Taipei University Taiwan E-mail: yshan@mail.ntpu.edu.tw 1 Modified from the lecture notes by Prof.
Example continued. Math 425 Intro to Probability Lecture 37. Example continued. Example
 continued : Coin tossing Math 425 Intro to Probability Lecture 37 Kenneth Harris kaharri@umich.edu Department of Mathematics University of Michigan April 8, 2009 Consider a Bernoulli trials process with