Simultaneous measurement of in-plane and through-plane thermal conductivity using beam-offset frequency domain thermoreflectance
|
|
|
- Alban Wade
- 5 years ago
- Views:
Transcription
1 Simultaneous measurement of in-plane and through-plane thermal conductivity using beam-offset frequency domain thermoreflectance David Rodin 1 and Shannon K. Yee 1 1 George W. Woodruff School of Mechanical Engineering, Georgia Institute of Technology, Atlanta, Georgia 30332, USA Transient thermoreflectance (TTR) techniques are ubiquitous methods for measuring thermal conductivity of bulk materials and thin-films. Both through-plane thermal conductivity k and inplane thermal conductivity k should be independently measured in transversely anisotropic materials. When these properties are measured using conventional TTR techniques, the accuracy of the k measurement is dependent on the accuracy of measuring k, and vice versa. This is especially problematic for thin-films measurements as uncertainty in k (~5%) can propagate and grow for uncertainty in k. In this paper, we present a method for the simultaneous measurement of k and k using beam-offset frequency domain thermoreflectance (FDTR) with robust uncertainty estimation. The conventional diffusive heat transfer solution is analyzed to show that offset and heating frequency can independently control the sensitivity to directional thermal conductivity and extract values for k and k. Numerical uncertainty analyses demonstrate that sweeping both heating frequency and beam offset results in a reduction of measurement uncertainty. This modified measurement technique is demonstrated on crystalline alumina (c- Al 2 O 3 ), amorphous alumina (a-al 2 O 3 ), quartz, fused silica, and highly-oriented pyrolytic graphite (HOPG). I. INTRODUCTION The continued use of thin-film technologies perpetuates interest in the thermal properties of nanostructured materials. 1-5 Nanostructuring and other size effects (e.g., nanoinclusions, block copolymer macrostructures, and grain boundaries) lead to significant differences in the thermal properties of thin-films compared to their bulk counterparts. 3 Additionally, some isotropic bulk materials show anisotropic behavior when processed into thin-films. 6 Materials whose thermal conductivity tensor can be fully defined by in-plane and through-plane values are referred to as transversely isotropic materials. Numerous techniques 7-11 have been developed to measure thin-film thermal properties with the 3-omega method and the transient thermoreflectance (TTR) methods, which includes time-domain thermoreflectance (TDTR) and frequencydomain thermoreflectance (FDTR), being most widely used. The ability of both 3-omega and TTR methods to measure the through-plane thermal conductivity of thin-films has been 1, robustly demonstrated. Beam offset has been shown to improve the sensitivity of TDTR to in-plane thermal conductivity 10 and recent advancements in TDTR methodologies by Feser, Liu, and Cahill have demonstrated the ability to resolve full thermal conductivity tensors. 14 In-plane thermal conductivity measurements using FDTR with co-aligned beams have also been 1
2 demonstrated on transversely isotropic 15, 16 materials. Although FDTR measurement capabilities are lagging those of TDTR when it comes to anisotropic materials, FDTR still offers some important advantages. In particular, FDTR uses a continuous-wave (CW) laser as opposed to TDTR s femtosecond pulsed laser and does not require a delay stage. These two factors contribute to the lower cost of FDTR and the use of a CW laser allows for a single timescale. 17 Furthermore, the ability of FDTR to achieve high heating frequencies using a heterodyned signal may provide some important insights into nanoscale heat transport. 9, 17, 18 Reducing the experimental uncertainty of FDTR without significantly increasing the complexity or cost of the measurement is an important step towards improving measurement capabilities for anisotropic thin films. The general approach for anisotropic TTR measurements 10 is to perform two independent measurements: (i) to measure the through-plane thermal conductivity and then (ii) to measure the in-plane thermal conductivity where the previous throughplane value is used as a dependent parameter. One approach to improving the sensitivity to independent values in TTR measurements involves changing the spot size of the pump and probe beams. 10 This requires a realignment of the optics for each measurement and prevents the two measurements from being performed in rapid succession. Hence, measurement time and accuracy could be improved if both inplane and through-plane thermal conductivity are measured simultaneously. Herein, we demonstrate the measurement realization of a simultaneous in-plane and through-plane thermal conductivity measurement using a beamoffset FDTR technique that works for both bulk and thin-film materials, can be applied across a wide range of thermal conductivities (~ 5 to ~2000 W/m-K), and results in lower in-plane measurement uncertainty when compared to alternative FDTR methodologies. 30 In Sec. II, the heat transfer model is analyzed to show how sensitivity to in-plane thermal conductivity, k, and through-plane thermal conductivity, k, can be determined without changing the laser spot size. In Sec. III, experimental data is presented alongside a robust method of uncertainty analysis to demonstrate the measurement capabilities. II. METHODOLOGY FDTR, which is well described in literature, 8, 9, 13 measures an unknown thermal property, most often thermal conductivity, using a pump-probe laser technique relying on a transducer s temperature dependent thermoreflectance, R -1 dr / dt. As an overview to FDTR, one experimentally measures the phase lag between a periodic heat source and its corresponding temperature response on a surface as a function of heating frequency. Then one matches the experimental frequency dependent phase lag data to an analytical model 19, 20 by adjusting the unknown thermal property until the best fit (minimizing the mean-squared error) is obtained. The value of the unknown parameter that yields the best fit is the measured value of the unknown thermal property. To absorb the periodic heat source delivered by a laser, FDTR requires the deposition of a thin (~ nm) thermoreflectance transducer atop the sample; Au is the best transducer for the laser wavelengths used in many FDTR setups because the reflectance of Au exhibits a relatively strong temperature dependence at the wavelength of 532 nm, 2

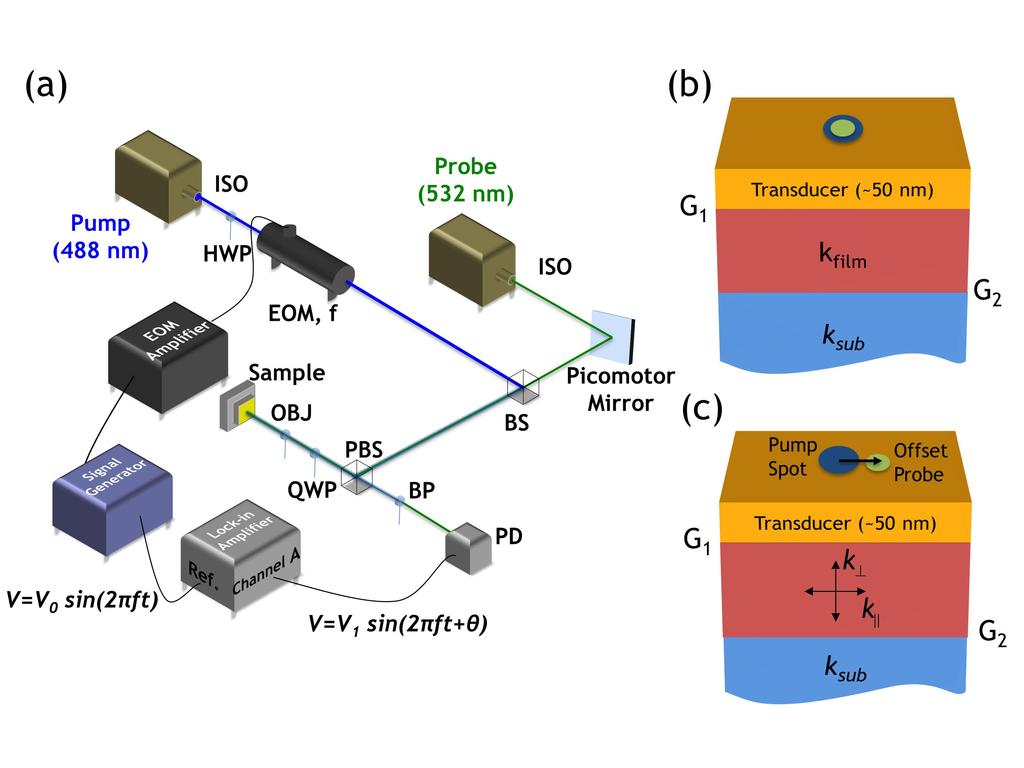
3 FIG. 1. (a) Schematic of an offset FDTR set-up. The only difference between the experimental set-ups of offset FDTR and traditional FDTR is the addition of the picomotor mirror, which scans the probe beam across the sample to create precise offsets between the pump and probe beams. (b) Sample configuration for traditional FDTR. The pump beam (blue) is concentrically aligned with the probe beam (green). The interfacial thermal conductance between the transducer and film is labeled G 1 and the conductance between the film and substrate is labeled G 2. (b) Sample configuration for offset FDTR. The probe beam is offset from the pump beam and the film or substrate may have unique values for through-plane (k ) and in-plane (k ) thermal conductivity. R -1 dr / dt 10 4 K -1 and it absorbs well at phase-lag θ. The surface temperature oscillation induces a coherent oscillation in wavelengths near 488 nm. Thus, a pump the reflectance of the Au transducer. The laser (at 488 nm) creates a periodic heat incoming probe beam is initially at a source absorbed by the transducer and a constant intensity but, upon reflection, probe laser (at 532 nm) monitors the becomes modulated at frequency f and picks temperature response of the transducer. up the phase-lag θ. Upon reflection, the Therefore, the transducer serves two pump and the probe beams take the same purposes: it absorbs the pump beam, which path to a photodiode, where their intensity is enables isothermal surface heating (see converted into a voltage signal. The voltage Supplementary Materials 30 ), and it reflects signals from the pump and probe are the probe beam, which carries information measured individually (separated using about the temperature response of the inline band pass filters) as a function of surface to the periodic heat source encoded heating frequency. Some additional phase by the thermoreflectance of the transducer. 21 lag is probably acquired by the post-sample The pump laser s intensity is modulated optics. However, since the reflected paths at a frequency f and creates a temperature of the beams are identical, the only source of oscillation on the sample surface at that phase lag that is different between the pump same frequency f but with an additional and probe signals arises from the phase lag 3
4 response of the periodic heating at the sample and the associated temperature response. Therefore, the phase difference between the pump and probe voltage signals is θ. An analytical solution to the heat diffusion equation can be used to predict θ. 19, 20 The inputs to the model are the thermal conductivity, volumetric heat capacity, thickness of each layer, as well as the 1/e 2 radius of the pump and probe beams. In a typical isotropic sample, the thermal conductivity, k, and the thermal interface conductance between the transducer and the sample, G, are unknown. In the case of a multilayered sample, as shown in Fig. 1(a) and 1(b), the unknown parameters may include: (i) the film conductivity, k film, (ii) the substrate conductivity, k sub, and (iii) the thermal interface conductances, G 1 and G 2. In many multilayer samples, the substrate conductivity is independently measured without the film and k sub can be treated as a known input parameter to the model. The transducer thickness and thermal conductivity, as well as the volumetric heat capacity of the sample, can be independently measured with the methodologies described in the Supplementary Materials. 30 The remaining unknown parameters are used as fitting parameters (primarily k film ) to match the model to the experimental data. The measurement results are the set of fitted values that minimize the mean-squared error between the analytical model and experimental data. A detailed configuration for traditional and broadband FDTR is presented by Regner et al. 9 and the experimental set-up for beam-offset FDTR is shown in Fig. 1(a). In our setup, both the pump (Coherent MX-488 SLM) and probe (Coherent Verdi G2) beams pass through optical isolators (ISO, Conoptics 711A and 711C-3) tuned to their specific wavelengths. The isolators act as optical diodes to prevent light from reentering and damaging the laser cavities. The signal generator (Rigol DG5252) produces a sinusoidal voltage at a controllable frequency, which is amplified (Conoptics Model 200) to drive the electrooptic modulator (EOM, Model KD*P Series with reduced aperture). The frequency range of the modulation system is between 9 khz and 200 MHz. However, we found that the experimental data is most reliable between 400 khz and 5 MHz. The lower limit of 400 khz was established to minimize uncertainty due to beam spot size errors and the upper limit was established to avoid high-frequency ambient (RF) noise. The EOM is a polarization-dependent optics and must be rotated such that the incoming light is polarized at a 45 angle relative to the EOM s crystal. To more easily achieve this, a half-wave plate (HWP, ThorLabs WPH10M-488) rotates the polarization of the laser before it enters the EOM s aperture and eliminates the need for the user to rotate the EOM thus simplifying the alignment process. The pump and probe beams are coaligned as they pass through the beam splitter (BS, ThorLabs BS025) and are then directed towards the sample using a polarizing beam splitter (PBS, ThorLabs CM1-PBS251). The beam polarizations are tuned through a quarter-wave plate (QWP, ThorLabs WPQ10M-488) and focused through an objective (OBJ, Nikon MUE31100) onto the sample. The reflected beams are sent to the photodiode (PD, ThorLabs PDA36A) and their phase-lag relative to the voltage signal generated by the signal generator is measured using a lock-in amplifier (SRS SR844). The reason the phase is measured relative to the arbitrary reference signal is because the lock-in amplifier requires the magnitude of the reference signal to be greater than 200 mv. The voltage magnitudes associated with the pump and probe are 100 mv and 4
 Sensitivity to in-plane thermal conductivity as a function of beam offset and heating frequency.")
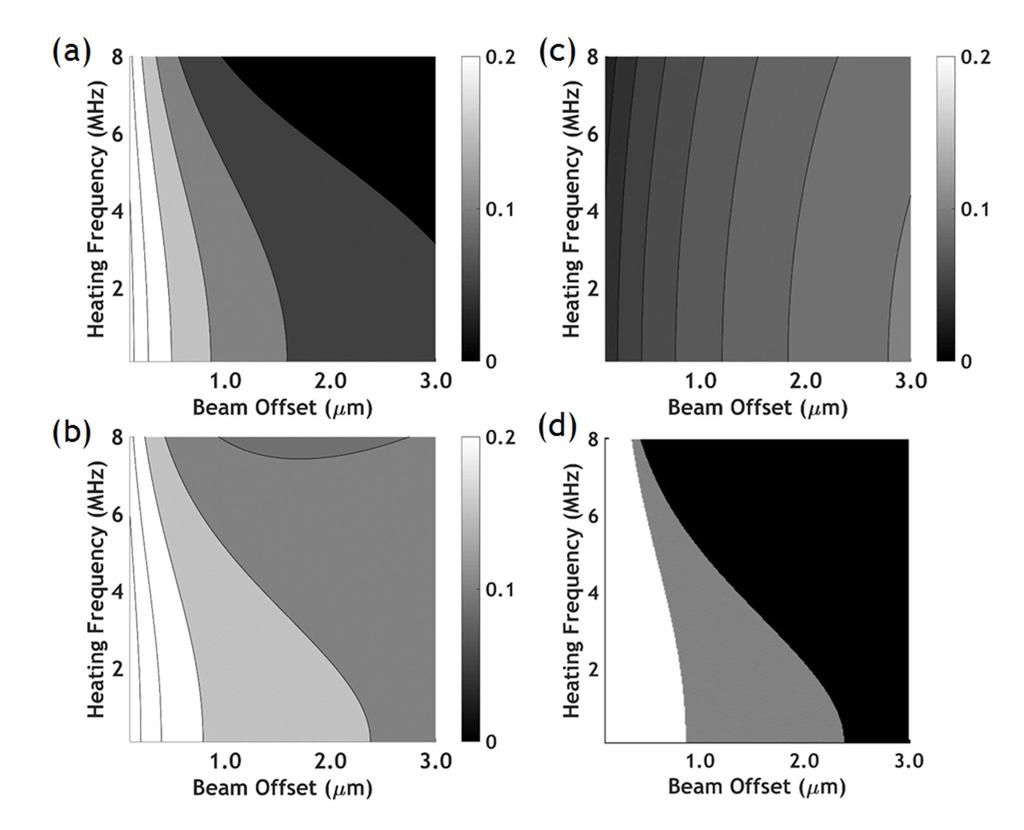
5 FIG. 2. Sensitivity analysis results for single-crystal quartz with input parameters listed in Table II. (a) Sensitivity to in-plane thermal conductivity as a function of beam offset and heating frequency. Regions of high (white), moderate (gray), and low (black) sensitivity are all found within the domain (see Supplemental Materials 30 ). (b) Sensitivity to through-plane thermal conductivity. (c) Sensitivity to thermal interface conductance demonstrates low sensitivity to G across the entire domain. (d) Total sensitivity shows regions where measurement is sensitive to both in-plane and through-plane thermal conductivity (white), only to through-plane conductivity (gray), and insensitivity to both (black). 100 μv, respectively, so neither signal can be used as a reference. Instead, the phase lag between the two signals is obtained by independently measuring their phase lag relative to the signal generator and taking the difference between the measured phase lag values. The individual measurement of the beams is enabled by bandpass filters for each laser respectively (BP, ThorLabs FL488-1 and ThorLabs FL532-10). In order to controllably offsetting the probe beam, a picomotor mirror mount (Newport Model 8807) with an open-loop driver (Newport Model 8742) is used. The mirror is controlled using high-precision piezo-actuators with each actuator step corresponding to a change in angle of 0.7 µrad. The probe beam passes through several optical elements between the picomotor mirror and the sample, so it is necessary to calibrate changes in mirror 5
6 angle to changes in spatial positioning of the probe beam on the sample. These calibrations were performed using a scanning slit beam profiler (DataRay Beam R2) with a spatial resolution of 100 nm, which allows for the full resolution of the laser spots even when fully focused. The calibration results showed that, although the probe s positioning is consistently linear with respect to picomotor steps, the slope of this relationship would vary each day by as much as 4% (Supplemental Materials 30 ). Therefore, we calibrate the Picomotor before and after each measurement to get an accurate measure of the beam offset distances and to ensure that the calibration does not drift over the course of the measurement. A. Analytical Heat Transfer Solution The heat transfer model for TTR experiments has been rigorously 19, 20 developed. The temperature fluctuation detected by the probe beam is given by 2 T G( f, h) P( h) S( h) hdh A, (1) s 0 where P(h) and S(h) are the Hankel transforms of the intensity profiles of the pump and probe beams, G(f,h) is the Hankel transform of the Green s function solution for the temperature response from a point heat source that oscillates sinusoidally with unit strength, and A s is the incident power of the probe beam. Feser et al. describe the formulations of G(f,h), P(h), and S(h) for the case of offset beams with transversely isotropic materials. 10 A full solution for Equation (1) can be found in the Supplemental Materials. 30 B. Offset Sensitivity Analysis A sensitivity analysis can be used to determine how a specific parameter influences the phase-lag θ. The sensitivity is TABLE I. Nominal parameters for quartz used in the sensitivity analysis shown in Fig. 2. Property Nominal Value Uncertainty C transducer 2.5 MJ/m 3 -K 5% k transducer 220 W/m-K 5% L transducer 110 nm 3% r probe 2.0 µm 3% r pump 3.2 µm 4% L sample 500 µm N/A C sample 1.65 MJ/m 3 -K 5% k 6.5 W/m-K 10% k 9.8 W/m-K 19% G transducer 51 MW/m 2 -K 22% defined as the logarithmic derivative of θ with respect to the system parameter of interest β. S d ln d ln (2) Equation (2) is evaluated numerically by changing the value of β by 1% about the nominal value and observing the corresponding change in the phase-lag of Equation (1). The results of a sensitivity analysis on single-crystal quartz are shown in Figure 2 with the nominal parameters listed in Table I. The sensitivity analysis allows one to determine which parameters most heavily influence the measurement response across a range of frequencies and beam offsets. The measurement should be more sensitive to the fitting parameters than the input parameters to prevent small uncertainties in the independent input measurements from propagating into the final result. This consideration is used to optimize the measurement accuracy by selecting proper film thickness, transducer thickness, heating frequency range, and beam offsets. If any 6
7 input parameter shows greater sensitivity than the fitting parameters, an emphasis is placed on the accuracy of the independent measurement of that input parameter. Input parameters with low sensitivity (S β < 0.05) can exhibit relatively large uncertainty (U β ~ 25%) without significantly impacting the uncertainty of the final measurement so long as the sensitivity to the fitting parameters is relatively high (S β > 0.2) (see Supplemental Materials 30 ). In some unavoidable cases, the sensitivity to multiple input parameters may be higher than the sensitivity to the fitting parameters and measurement uncertainty is very high (U β > 50%). For these cases, a robust approach to uncertainty analysis plays a critical role in proper reporting of measurement results. The results of a sensitivity analysis on single-crystal quartz are shown in Figure 2 with the sample parameters listed in Table I. Since the sensitivity to the thermal interface conductance between the transducer and sample is low across the entire domain (see Fig. 2(c)), inaccuracies in the measured value of G are unlikely to propagate into the measurement uncertainty of k and k The total sensitivity plot in Figure 2(d) shows how using both heating frequency and beam offset creates regions that are sensitive to both k and k (white) as well as regions that are only sensitive to k (gray). The existence of both regions is important because it allows the measurement to produce unique results when fitting to multiple parameters simultaneously. C. Computational Uncertainty Analysis A Monte Carlo computational approach, similar to the methods of other TTR measurements, is used to calculate measurement uncertainty In this approach, the nominal input parameters are first collected through independent measurements (see Supplemental Materials 30 ) and the uncertainty associated with the independent measurement is recorded. The contribution of experimental noise to uncertainty is accounted for by making five independent measurements at each heating frequency and recording the measurement standard deviation. The errors in our input parameters and experimental phase data are normally distributed about their nominal and mean values, respectively. A new set of input parameters and a new set of experimental data are randomly sampled from these distributions. Next, using the input parameters, the generated data is fit to the heat transfer model to determine the fitting parameters that minimize the mean squared error. The resulting fitting parameters are treated as a single trial outcome and this process is repeated until the distribution of these outcomes converges to a normal distribution, typically after 2000 trials. 7
, through-plane thermal conductivity (k ), and volumetric heat capacity (C v ) and measured values for thermal interface")
8 Table II. Literature and measured values for in-plane thermal conductivity (k ), through-plane thermal conductivity (k ), and volumetric heat capacity (C v ) and measured values for thermal interface conductance (G 1 and G 2 for a- Al 2 O 3 ). Literature Measured (this work) Sample C v (MJ/m 3 -K) k (W/m-K) k (W/m-K) k (W/m-K) k (W/m-K) G(W/m 2 -K) Fused Silica 1.6 ± ± ± ± ± ±23 Quartz 2.0 ± ± ± ± ± ±11 a-al 2 O ± ± ± ± ± ±16, 68±24 c-al 2 O ± ± ± ± ± ±56 HOPG 1.6 ± ± ± , 28 9± ± ±43 Once the outcome distribution is obtained, a 95% confidence interval is used to quantify the uncertainty in the fitting parameter. This approach is more conservative than reporting the uncertainty at one standard deviation, albeit at a perceived higher uncertainty. An example of the Monte Carlo histogram using this approach for the in-plane thermal conductivity of single crystal quartz is shown in Fig. 3. This approach is advantageous because it does not assume a hierarchy of dominant uncertainty sources and factors both parameter uncertainty propagating through the model and experimental fluctuations into the total reported measurement uncertainty. D. Sample Selection and Preparation The ability to simultaneously measure in-plane and through-plane thermal conductivity is demonstrated over a range of conductivities and degrees of anisotropy. The samples are listed with their nominal thermal conductivity and volumetric heat capacity values in Table II. With the exception of the highlyoriented pyrolytic graphite (HOPG), each sample is prepared by submersion in a sonication bath of deionized water, followed by isopropyl alcohol, and finally ethanol. Immediately before the deposition of the Au transducer, the samples are rinsed in a 3:1 piranha solution at 120 C for 30 minutes. This is to ensure that all organic matter is removed from the surface. Before the deposition of the gold, a thin (~ 5 nm) layer of chromium is deposited onto the cleaned sample surface to serve as an adhesion layer. Regner et al. found that a high transducer interface conductance improves sensitivity to the sample thermal conductivity. 9 The chromium layer serves to increase the thermal interface conductance by acting as an adhesion layer. HOPG was prepared by exfoliating the top layers using Scotch tape several times prior to deposition. FIG. 3. Uncertainty distribution for in-plane thermal conductivity of single crystal quartz. 95% of the outcomes fall between 7.3 W/m-K and 13.3 W/m-K, yielding a measured in-plane conductivity of W/m-K. III. EXPERIMENTAL RESULTS A. Experimental Data and Analysis We present the raw experimental data and uncertainty analysis results for single crystal quartz, and compare the measured 8
9 thermal conductivity values for all samples against their nominal values from Table II. For each sample, the in-plane and throughplane conductivities are treated as fitting parameters fitting the analytical solution to the experimental data. The model and experimental data for quartz are shown in Fig. 4, alongside the results from the computational uncertainty analysis. Raw data of the other samples can be found in the Supplemental Materials. 30 The measured phase-lag is in good agreement with the analytical model using the nominal values. Residuals never exceed 0.35 and are typically less than 0.2. The experimental phase-lag was observed to fluctuate by about 0.3 from ambient noise, so residuals below 0.2 are considered insignificant. Furthermore, the residuals between the model and experiment do not exhibit a dependence on any of the independent variables (beam offset and heating frequency), indicating that the technique is free of systematic errors. For quartz, the measured values for k and k are each within 7% of their nominal values. The thermal interface conductance between the transducer and substrate, G, is used as an additional fitting parameter, however this technique is not very sensitive to the value of G because the sensitivity to thermal conductivity is much higher than the sensitivity to G across the range of heating frequencies. The sensitivity to G tends to increase at higher heating frequencies and lower thermal conductivities, so a sensitivity analysis must be performed on each sample before making assumptions about the relevance of thermal interface conductance. FIG. 4. (a) Experimental phase data (dots) with fitted analytical solution (solid lines) for single crystal quartz. The beam-offset values were swept from 0 (blue) to 0.75 µm (red). Monte Carlo uncertainty estimations for both throughplane (top) and in-plane (bottom) thermal conductivity. 9
10 The measurement uncertainty was calculated to be 29% for k and 19% for k, which is comparable to the uncertainty in the reported nominal literature values 29. The same analysis shown for quartz was applied to all samples in Table II. Figure 5 compares the measured values of both k and k to their respective nominal values. Overall, the through-plane measurement results show good agreement with nominal literature values across the range of conductivities (~1-25 W/m-K). However, the uncertainty for the in-plane thermal conductivity for low thermal conductivity materials is large, particularly in fused silica, amorphous alumina, and HOPG. The surface roughness of HOPG created uncertainty in the transducer thickness which propagated into the final measurement uncertainty. For amorphous alumina and fused silica, we attribute the high uncertainty to large in-plane heat spreading in the Au transducer; the majority of in-plane heat spreading occurs in the transducer (not the sample), which causes the measurement to be less sensitive to the in-plane thermal conductivity of the sample. Two potential avenues to improve this sensitivity, both discussed in the Supplemental Materials, 30 include using a less conductive transducer or patterning the transducer to force heat to travel through the sample. IV. CONCLUSION We have developed a modified version of FDTR for simultaneous measurement of in-plane and through-plane thermal conductivity using beam-offset control. The technique sweeps over a range of both heating frequencies and beam offsets to independently achieve sensitivity in both k and k. Measurement capabilities have been demonstrated over a range of thermal conductivities (~ W/m-K) and materials ranging from isotropic (k /k =1) to FIG. 5.(a) Comparison between measured and nominal values for k. Vertical error bars indicate measurement uncertainty and horizontal bars indicate uncertainty in nominal value. (b) Comparison between measured and nominal values for k. The bottom half of the error bars are omitted for a-al 2 O 3 and fused silica. highly anisotropic (k /k >300) with a reduced in-plane measurement uncertainty compared to alternative FDTR approaches 30. Measurement uncertainty for through-plane thermal conductivity ranged between 10-45% with uncertainty increasing as thermal conductivity decreased. Measurement 10
11 uncertainty in the in-plane thermal conductivity varied between 10-20% for materials with conductivities greater than 5 W/m-K. However, uncertainties are larger for in-plane thermal conductivity below 5 W/m-K because of lateral heat spreading in the Au transducer. Despite its high in-plane conductivity, measurement uncertainty for in-plane thermal conductivity of HOPG approached 40% due to uncertainty in the transducer thickness. SUPPLEMENTARY MATERIALS See supplementary materials for the (a) analytical solutions, (b) beam diameter measurement protocol, (c) picomotor calibration, (d) full data sets, (e) sensitivity threshold analysis, (f) additional independent measurements, (g) low thermal conductivity threshold measurements, (h) uncertainty measurement bounds, (i) comparison of measurement uncertainty to alternative FDTR techniques. ACKNOWLEDGEMENTS This work was supported by the AFOSR under Award No. FA D. Rodin would like to acknowledge support from the NSF-IGERT fellowship. The authors would like to thank Professor Jonathan Malen and Dr. Keith Regner at the Carnegie Melon University for insightful conversations. REFERENCES 1. J. Liu, J. Zhu, M. Tian, X. Gu, A. Schmidt and R. Yang, Review of Scientific Instruments 84 (3), (2013). 2. D. G. Cahill, W. K. Ford, K. E. Goodson, G. D. Mahan, A. Majumdar, H. J. Maris, R. Merlin and S. R. Phillpot, Journal of Applied Physics 93 (2), (2003). 3. A. Jain, S. Rogojevic, S. Ponoth, W. N. Gill, J. L. Plawsky, E. Simonyi, S. T. Chen and P. S. Ho, Journal of Applied Physics 91 (5), (2002). 4. D. G. Cahill, K. Goodson and A. Majumdar, Journal of Heat Transfer 124 (2), (2001). 5. S. Vineis, Majumdar, Kanatzidis, Adv. Mater. 22 (36), 10 (2010). 6. T. Bing Yue, Y. Chen Chi and F. Kuo Lung, presented at the VLSI Technology, Systems, and Applications, 2003 International Symposium on, 2003 (unpublished). 7. T. Tong and A. Majumdar, Review of Scientific Instruments 77 (10), (2006). 8. A. J. Schmidt, R. Cheaito and M. Chiesa, Review of Scientific Instruments 80 (9), (2009). 9. K. T. Regner, S. Majumdar and J. A. Malen, Review of Scientific Instruments 84 (6), (2013). 10. J. P. Feser and D. G. Cahill, Review of Scientific Instruments 83 (10), (2012). 11. D. G. Cahill, Review of Scientific Instruments 61 (2), (1990). 12. C. Dames and G. Chen, Review of Scientific Instruments 76 (12), (2005). 13. J. A. Malen, K. Baheti, T. Tong, Y. Zhao, J. A. Hudgings and A. Majumdar, Journal of Heat Transfer 133 (8), (2011). 14. J. P. Feser, J. Liu and D. G. Cahill, Review of Scientific Instruments 85 (10), (2014). 15. J. Yang, C. Maragliano and A. J. Schmidt, Review of Scientific Instruments 84 (10), (2013). 16. V. V. Medvedev, J. Yang, A. J. Schmidt, A. E. Yakshin, R. W. E. van de Kruijs, E. Zoethout and F. Bijkerk, Journal of Applied Physics 118 (8), (2015). 17. K. T. Regner, J. P. Freedman and J. A. Malen, Nanoscale and Microscale Thermophysical Engineering 19 (3), (2015). 18. K. T. Regner, D. P. Sellan, Z. Su, C. H. Amon, A. J. H. McGaughey and J. A. Malen, Nature Communications 4, 1640 (2013). 19. D. G. Cahill, Review of Scientific Instruments 75 (12), (2004). 11
12 20. A. J. Schmidt, X. Chen and G. Chen, Review of Scientific Instruments 79 (11), (2008). 21. P. L. K. P.E. Raad, M.G. Burzo, Electronics Cooling 14 (2008). 22. T. L. Bougher, L. Yates, C. F. Lo, W. Johnson, S. Graham and B. A. Cola, Nanoscale and Microscale Thermophysical Engineering, 1 11 (2016). 23. C. E. Papadopoulos and H. Yeung, Flow Measurement and Instrumentation 12 (4), (2001). 24. J. Yang, E. Ziade and A. J. Schmidt, Review of Scientific Instruments 87 (1), (2016). 25. M. Neubronner, T. Bodmer, C. Hübner, B. P. Kempa, E. Tsotsas, A. Eschner, G. Kasparek, F. Ochs, H. Müller Steinhagen, H. Werner and H. M. Spitzner, (Springer Verlag). 26. I. Stark, M. Stordeur and F. Syrowatka, Thin Solid Films 226 (1), (1993). 27. R. R. Monchamp, Journal of Solid State Chemistry 12 (3), (1975). 28. S. P. Inc., (2016). 29. J. V. A. a. P. J. Hart, Phys. Rev. 59, (1941). 30. Supplemental materials at [URL to be inserted by AIP] for experimental and computational details. 12
13
14
15
16
17
Supplementary Figures
 Supplementary Figures Supplementary Figure S1. The effect of window size. The phonon MFP spectrum of intrinsic c-si (T=300 K) is shown for 7-point, 13-point, and 19-point windows. Increasing the window
Supplementary Table 1. Parameters for estimating minimum thermal conductivity in MoS2
 Supplementary Table 1. Parameters for estimating minimum thermal conductivity in MoS2 crystal. The three polarizations (TL1 TL2 and TA) are named following the isoenergydecomposition process described
Supplementary Figures
 Supplementary Figures Supplementary Figure. X-ray diffraction pattern of CH 3 NH 3 PbI 3 film. Strong reflections of the () family of planes is characteristics of the preferred orientation of the perovskite
Highly Efficient and Anomalous Charge Transfer in van der Waals Trilayer Semiconductors
 Highly Efficient and Anomalous Charge Transfer in van der Waals Trilayer Semiconductors Frank Ceballos 1, Ming-Gang Ju 2 Samuel D. Lane 1, Xiao Cheng Zeng 2 & Hui Zhao 1 1 Department of Physics and Astronomy,
Supporting Information for
 Supporting Information for Enhancing the Thermal Conductance of Polymer and Sapphire Interface via Self-Assembled Monolayer Kun Zheng,,+ Fangyuan Sun,,+ Jie Zhu, *,, Yongmei Ma, *, Xiaobo Li, Dawei Tang,
Thermal characterization of Au-Si multilayer using 3- omega method
 Thermal characterization of Au-Si multilayer using 3- omega method Sunmi Shin Materials Science and Engineering Program Abstract As thermal management becomes a serious issue in applications of thermoelectrics,
Picosecond Transient Thermoreflectance for Thermal Conductivity Characterization. and Yaguo Wang 1,5,*
 Picosecond Transient Thermoreflectance for Thermal Conductivity Characterization Jihoon Jeong 1, Xianghai Meng 1, Ann Kathryn Rockwell 2, Seth R Bank 2, Wen-Pin Hsieh 3, Jung-fu Lin 4,5* and Yaguo Wang
A Two-Parameter Nondiffusive Heat Conduction Model for Data. Analysis in Pump-Probe Experiments
 A Two-Parameter Nondiffusive Heat Conduction Model for Data Analysis in Pump-Probe Experiments Yanbao Ma School of Engineering, University of California at Merced, USA Nondiffusive heat transfer has attracted
Comparison of the 3ω method and time-domain
 Comparison of the 3ω method and time-domain thermoreflectance David G. Cahill, Shawn Putnam, Yee Kan Koh Materials Research Lab and Department of Materials Science and Engineering, U. of Illinois, Urbana,
Time-resolved magneto-optical Kerr effect for studies of phonon thermal transport
 Time-resolved magneto-optical Kerr effect for studies of phonon thermal transport David G. Cahill, Jun Liu, Judith Kimling, Johannes Kimling, Department of Materials Science and Engineering University
Report on 7th US-Japan Joint Seminar on Nanoscale Transport Phenomena Science and Engineering
 Report on 7th US-Japan Joint Seminar on Nanoscale Transport Phenomena Science and Engineering December 11-14, 2011, Shima, Japan co-chairs: Shigeo Maruyama, Kazuyoshi Fushinobu, Jennifer Lukes, Li Shi
SUPPLEMENTARY MATERIALS FOR PHONON TRANSMISSION COEFFICIENTS AT SOLID INTERFACES
 148 A p p e n d i x D SUPPLEMENTARY MATERIALS FOR PHONON TRANSMISSION COEFFICIENTS AT SOLID INTERFACES D.1 Overview The supplementary information contains additional information on our computational approach
SUPPLEMENTARY INFORMATION
 Engineered doping of organic semiconductors for enhanced thermoelectric efficiency G.-H. Kim, 1 L. Shao, 1 K. Zhang, 1 and K. P. Pipe 1,2,* 1 Department of Mechanical Engineering, University of Michigan,
Supporting Information
 Supporting Information Analysis Method for Quantifying the Morphology of Nanotube Networks Dusan Vobornik*, Shan Zou and Gregory P. Lopinski Measurement Science and Standards, National Research Council
Electronic thermal transport in nanoscale metal layers
 Electronic thermal transport in nanoscale metal layers David Cahill, Richard Wilson, Wei Wang, Joseph Feser Department of Materials Science and Engineering Materials Research Laboratory University of Illinois
On the Steady-State Temperature Rise During Laser Heating of Multilayer Thin Films in Optical Pump Probe Techniques
 Jeffrey L. Braun Department of Mechanical and Aerospace Engineering, Charlottesville, VA 22904 Chester J. Szwejkowski Department of Mechanical and Aerospace Engineering, Charlottesville, VA 22904 Ashutosh
Structure-Thermal Property Correlation of Aligned Silicon. Dioxide Nanorod Arrays
 Supplementary Material for Structure-Thermal Property Correlation of Aligned Silicon Dioxide Nanorod Arrays S. Dynamic shadowing growth (DSG) technique Figure S depicts a schematic of the DSG setup. For
Supplementary Figures
 Supplementary Figures Supplementary Figure S1. a, the cross-sectional and b, top view SEM images of a PC/SWNT bilayer (SWNT film thickness of ~ 1µm). S1 Supplementary Figure S2. The obtained SWNT film
A Variational Approach to Extracting the Phonon Mean Free Path Distribution from the Spectral Boltzmann Transport Equation
 A Variational Approach to Extracting the Phonon Mean Free Path Distribution from the Spectral Boltzmann Transport Equation Vazrik Chiloyan a, Lingping Zeng a, Samuel Huberman a, Alexei A. Maznev b, Keith
A Photonic Crystal Laser from Solution Based. Organo-Lead Iodide Perovskite Thin Films
 SUPPORTING INFORMATION A Photonic Crystal Laser from Solution Based Organo-Lead Iodide Perovskite Thin Films Songtao Chen 1, Kwangdong Roh 2, Joonhee Lee 1, Wee Kiang Chong 3,4, Yao Lu 5, Nripan Mathews
POLARIZATION OF LIGHT
 POLARIZATION OF LIGHT OVERALL GOALS The Polarization of Light lab strongly emphasizes connecting mathematical formalism with measurable results. It is not your job to understand every aspect of the theory,
Plasma Formation and Self-focusing in Continuum Generation
 Plasma Formation and Self-focusing in Continuum Generation Paper by Andrew Parkes Advisors: Jennifer Tate, Douglass Schumacher The Ohio State University REU 2003 Supported by NSF I. Abstract This summer
A novel scheme for measuring the relative phase difference between S and P polarization in optically denser medium
 A novel scheme for measuring the relative phase difference between S and P polarization in optically denser medium Abstract Yu Peng School of Physics, Beijing Institute of Technology, Beijing, 100081,
Plasmonic sensing of heat transport and phase change near solid-liquid interfaces
 Plasmonic sensing of heat transport and phase change near solid-liquid interfaces David G. Cahill and Jonglo Park Department of Materials Science and Engineering University of Illinois at Urbana-Champaign
Instrumentation and Operation
 Instrumentation and Operation 1 STM Instrumentation COMPONENTS sharp metal tip scanning system and control electronics feedback electronics (keeps tunneling current constant) image processing system data
A compact heat transfer model based on an enhanced Fourier law for analysis. of frequency-domain thermoreflectance experiments
 A compact heat transfer model based on an enhanced Fourier law for analysis of frequency-domain thermoreflectance experiments Ashok T. Ramu 1 and John E. Bowers 1 1 Department of Electrical and Computer
Department of Mechanical Engineering, University of Colorado, Boulder, Colorado 80309, USA
 A new elliptical-beam method based on time-domain thermoreflectance (TDTR) to measure the in-plane anisotropic thermal conductivity and its comparison with the beam-offset method Puqing Jiang, Xin Qian
Optimisation using measured Green s function for improving spatial coherence in acoustic measurements
 Ultrasonics 42 (2004) 205 212 www.elsevier.com/locate/ultras Optimisation using measured Green s function for improving spatial coherence in acoustic measurements Matthew Clark *, Steve D. Sharples, Mike
SUPPORTING INFORMATION: Titanium Contacts to Graphene: Process-Induced Variability in Electronic and Thermal Transport
 SUPPORTING INFORMATION: Titanium Contacts to Graphene: Process-Induced Variability in Electronic and Thermal Transport Keren M. Freedy 1, Ashutosh Giri 2, Brian M. Foley 2, Matthew R. Barone 1, Patrick
Supplementary Materials for
 advances.sciencemag.org/cgi/content/full/2//e50054/dc Supplementary Materials for Two-photon quantum walk in a multimode fiber Hugo Defienne, Marco Barbieri, Ian A. Walmsley, Brian J. Smith, Sylvain Gigan
Performance of the MCP-PMT for the Belle II TOP counter
 Performance of the MCP-PMT for the Belle II TOP counter a, S. Hirose b, T. Iijima ab, K. Inami b, Y. Kato a, Y. Maeda a, R. Mizuno b, Y. Sato a and K. Suzuki b a Kobayashi-Maskawa Institute, Nagoya University
Transient Thermal Measurement and Behavior of Integrated Circuits
 Transient Thermal Measurement and Behavior of Integrated Circuits Dustin Kendig¹*, Kazuaki Kazawa 1,2, and Ali Shakouri 2 ¹Microsanj LLC 3287 Kifer Rd, Santa Clara, CA 95051, USA ² Birck Nanotechnology
Supporting Information: Ultrafast Excited State Transport and Decay Dynamics in Cesium Lead Mixed-Halide Perovskites
 Supporting Information: Ultrafast Excited State Transport and Decay Dynamics in Cesium Lead MixedHalide Perovskites Casey L. Kennedy, Andrew H. Hill, Eric S. Massaro, Erik M. Grumstrup *,,. Department
Ultrafast Lateral Photo-Dember Effect in Graphene. Induced by Nonequilibrium Hot Carrier Dynamics
 1 Ultrafast Lateral Photo-Dember Effect in Graphene Induced by Nonequilibrium Hot Carrier Dynamics Chang-Hua Liu, You-Chia Chang, Seunghyun Lee, Yaozhong Zhang, Yafei Zhang, Theodore B. Norris,*,, and
Elastic Constants and Microstructure of Amorphous SiO 2 Thin Films Studied by Brillouin Oscillations
 1st International Symposium on Laser Ultrasonics: Science, Technology and Applications July 16-18 2008, Montreal, Canada Elastic Constants and Microstructure of Amorphous SiO 2 Thin Films Studied by Brillouin
Ultrafast laser-based metrology for micron-scale measurements of thermal transport, coefficient of thermal expansion, and temperature
 Ultrafast laser-based metrology for micron-scale measurements of thermal transport, coefficient of thermal expansion, and temperature David G. Cahill, Xuan Zheng, Chang-Ki Min, Ji-Yong Park Materials Research
Laser Ablation for Chemical Analysis: 50 Years. Rick Russo Laser Damage Boulder, CA September 25, 2012
 Laser Ablation for Chemical Analysis: 50 Years Rick Russo Lawrence Berkeley National Laboratory Applied Spectra, Inc 2012 Laser Damage Boulder, CA September 25, 2012 Laser Ablation for Chemical Analysis:
Parametric down-conversion
 Parametric down-conversion 1 Introduction You have seen that laser light, for all its intensity and coherence, gave us the same PP(mm) counts distribution as a thermal light source with a high fluctuation
Title of file for HTML: Supplementary Information Description: Supplementary Figures and Supplementary References
 Title of file for HTML: Supplementary Information Description: Supplementary Figures and Supplementary References Supplementary Figure 1. SEM images of perovskite single-crystal patterned thin film with
CW-Lyman- Source for Laser Cooling of Antihydrogen in a Magnetic Trap
 CW-Lyman- Source for Laser Cooling of Antihydrogen in a Magnetic Trap F. Markert, M. Scheid, D. Kolbe, A. Müllers, T. Weber, V. Neises, R. Steinborn and J. Walz Institut für Physik, Johannes Gutenberg-Universität
Uncertainty Qualification of Photothermal Radiometry Measurements Using Monte Carlo Simulation and Experimental Repeatability
 Utah State University DigitalCommons@USU All Graduate Theses and Dissertations Graduate Studies 5-2014 Uncertainty Qualification of Photothermal Radiometry Measurements Using Monte Carlo Simulation and
Supplementary Figure 1 Experimental setup for crystal growth. Schematic drawing of the experimental setup for C 8 -BTBT crystal growth.
 Supplementary Figure 1 Experimental setup for crystal growth. Schematic drawing of the experimental setup for C 8 -BTBT crystal growth. Supplementary Figure 2 AFM study of the C 8 -BTBT crystal growth
APPLICATION NOTE. Supercontinuum Generation in SCG-800 Photonic Crystal Fiber. Technology and Applications Center Newport Corporation
 APPLICATION NOTE Supercontinuum Generation in SCG-800 Photonic Crystal Fiber 28 Technology and Applications Center Newport Corporation 1. Introduction Since the discovery of supercontinuum generation (white
Optical Microscopy Study of Topological Insulators Using Ellipsometry
 Optical Microscopy Study of Topological Insulators Using Ellipsometry Amber Schedlbauer August 23, 2011 1 Abstract An optical setup based on normal-incidence reflectivity allows the Magneto Optic Kerr
Carbonized Electrospun Nanofiber Sheets for Thermophones
 Supporting Information Carbonized Electrospun Nanofiber Sheets for Thermophones Ali E. Aliev 1 *, Sahila Perananthan 2, John P. Ferraris 1,2 1 A. G. MacDiarmid NanoTech Institute, University of Texas at
EUV Reflectivity measurements on Acktar Sample Magic Black
 Report EUV Reflectivity measurements on Acktar Sample Magic Black S. Döring, Dr. K. Mann Laser-Laboratorium Göttingen e.v. October 28, 2011 Contents 1 Introduction 3 2 Setup 3 3 Measurements 4 4 Conclusion
Development of measurement technique to evaluate thermal conductivity of thermoelectric Bi 2 Te 3 submicron thin films by photothermal radiometry
 Development of measurement technique to evaluate thermal conductivity of thermoelectric Bi Te 3 submicron thin films by photothermal radiometry H Jitsukawa 1 and Y Nagasaka 1 School of Integrated Design
Nanoscale Energy Conversion and Information Processing Devices - NanoNice - Photoacoustic response in mesoscopic systems
 Nanoscale Energy Conversion and Information Processing Devices - NanoNice - Photoacoustic response in mesoscopic systems Photonics group W. Claeys, S. Dilhair, S. Grauby, JM. Rampnoux, L. Patino Lopez,
Let us consider a typical Michelson interferometer, where a broadband source is used for illumination (Fig. 1a).
.") 7.1. Low-Coherence Interferometry (LCI) Let us consider a typical Michelson interferometer, where a broadband source is used for illumination (Fig. 1a). The light is split by the beam splitter (BS) and
7.1. Low-Coherence Interferometry (LCI) Let us consider a typical Michelson interferometer, where a broadband source is used for illumination (Fig. 1a). The light is split by the beam splitter (BS) and
Confocal Microscopy Imaging of Single Emitter Fluorescence and Hanbury Brown and Twiss Photon Antibunching Setup
 1 Confocal Microscopy Imaging of Single Emitter Fluorescence and Hanbury Brown and Twiss Photon Antibunching Setup Abstract Jacob Begis The purpose of this lab was to prove that a source of light can be
Supporting Information. Temperature dependence on charge transport behavior of threedimensional
 Supporting Information Temperature dependence on charge transport behavior of threedimensional superlattice crystals A. Sreekumaran Nair and K. Kimura* University of Hyogo, Graduate School of Material
Simulation and Analysis of an Integrated Device to Simultaneously Characterize Thermal and Thermoelectric Properties
 3nd International Thermal Conductivity Conference th International Thermal Expansion Symposium April 7 May 1, 14 Purdue University, West Lafayette, Indiana, USA Simulation and Analysis of an Integrated
Supplemental material for Bound electron nonlinearity beyond the ionization threshold
 Supplemental material for Bound electron nonlinearity beyond the ionization threshold 1. Experimental setup The laser used in the experiments is a λ=800 nm Ti:Sapphire amplifier producing 42 fs, 10 mj
Segregated chemistry and structure on (001) and (100) surfaces of
 and (100) surfaces of") Supporting Information Segregated chemistry and structure on (001) and (100) surfaces of (La 1-x Sr x ) 2 CoO 4 override the crystal anisotropy in oxygen exchange kinetics Yan Chen a, Helena Téllez b,c,
Supporting Information Segregated chemistry and structure on (001) and (100) surfaces of (La 1-x Sr x ) 2 CoO 4 override the crystal anisotropy in oxygen exchange kinetics Yan Chen a, Helena Téllez b,c,
Supplemental material: Transient thermal characterization of suspended monolayer MoS 2
 Supplemental material: Transient thermal characterization of suspended monolayer MoS Robin J. Dolleman,, David Lloyd, Martin Lee, J. Scott Bunch,, Herre S. J. van der Zant, and Peter G. Steeneken, Kavli
Edward S. Rogers Sr. Department of Electrical and Computer Engineering. ECE318S Fundamentals of Optics. Final Exam. April 16, 2007.
 Edward S. Rogers Sr. Department of Electrical and Computer Engineering ECE318S Fundamentals of Optics Final Exam April 16, 2007 Exam Type: D (Close-book + two double-sided aid sheets + a non-programmable
Supplementary Methods A. Sample fabrication
 Supplementary Methods A. Sample fabrication Supplementary Figure 1(a) shows the SEM photograph of a typical sample, with three suspended graphene resonators in an array. The cross-section schematic is
Supporting Information for. 1 Department of Applied and Engineering Physics, Cornell University, Ithaca, New York, 14853, 2
 Supporting Information for High-Throughput Graphene Imaging on Arbitrary Substrates with Widefield Raman Spectroscopy Robin W. Havener 1,, Sang-Yong Ju,2,3,, Lola Brown 2, Zenghui Wang 2, Michal Wojcik
Optical Properties of Thin Semiconductor Films
 Optical Properties of Thin Semiconductor Films Grolik Benno,KoppJoachim October, 31st 2003 1 Introduction Optical experiments provide a good way of examining the properties of semiconductors. Particulary
Multi-cycle THz pulse generation in poled lithium niobate crystals
 Laser Focus World April 2005 issue (pp. 67-72). Multi-cycle THz pulse generation in poled lithium niobate crystals Yun-Shik Lee and Theodore B. Norris Yun-Shik Lee is an assistant professor of physics
b imaging by a double tip potential
 Supplementary Figure Measurement of the sheet conductance. Resistance as a function of probe spacing including D and 3D fits. The distance is plotted on a logarithmic scale. The inset shows corresponding
Second-Harmonic Generation Studies of Silicon Interfaces
 Second-Harmonic Generation Studies of Silicon Interfaces Z. Marka 1, Y. D. Glinka 1, Y. Shirokaya 1, M. Barry 1, S. N. Rashkeev 1, W. Wang 1, R. D. Schrimpf 2,D. M. Fleetwood 2 and N. H. Tolk 1 1 Department
SUPPLEMENTARY INFORMATION
 In the format provided by the authors and unedited. SUPPLEMENTARY INFORMATION DOI: 10.1038/NCHEM.2720 1 2 3 Tuning underwater adhesion with cation-π interactions Matthew A. Gebbie, Wei Wei, Alex M. Schrader,
In-situ Multilayer Film Growth Characterization by Brewster Angle Reflectance Differential Spectroscopy
 In-situ Multilayer Film Growth Characterization by Brewster Angle Reflectance Differential Spectroscopy N. Dietz, D.J. Stephens, G. Lucovsky and K.J. Bachmann North Carolina State University, Raleigh,
SUPPLEMENTARY INFORMATION
 Supplementary Information Speckle-free laser imaging using random laser illumination Brandon Redding 1*, Michael A. Choma 2,3*, Hui Cao 1,4* 1 Department of Applied Physics, Yale University, New Haven,
Supplementary Figure 1 Transient absorption (TA) spectrum pumped at 400 nm in the FAPbI3 sample with different excitation intensities and initial
 spectrum pumped at 400 nm in the FAPbI3 sample with different excitation intensities and initial") Supplementary Figure 1 Transient absorption (TA) spectrum pumped at 400 nm in the FAPbI3 sample with different excitation intensities and initial carrier concentrations: (a) N0 = 4.84 10 18 cm -3 ; (c)
Supplementary Figure 1 Transient absorption (TA) spectrum pumped at 400 nm in the FAPbI3 sample with different excitation intensities and initial carrier concentrations: (a) N0 = 4.84 10 18 cm -3 ; (c)
Generation of photovoltage in graphene on a femtosecond timescale through efficient carrier heating
 DOI: 1.138/NNANO.215.54 Generation of photovoltage in graphene on a femtosecond timescale through efficient carrier heating K. J. Tielrooij, L. Piatkowski, M. Massicotte, A. Woessner, Q. Ma, Y. Lee, K.
Section 2 ADVANCED TECHNOLOGY DEVELOPMENTS
 Section 2 ADVANCED TECHNOLOGY DEVELOPMENTS 2.A Application of KTP Crystal as an Electro-Optic Amplitude Modulator Potassium titanyl phosphate (KTiOP04 or KTP) has become a widely used nonlinear optical
Nanocomposite photonic crystal devices
 Nanocomposite photonic crystal devices Xiaoyong Hu, Cuicui Lu, Yulan Fu, Yu Zhu, Yingbo Zhang, Hong Yang, Qihuang Gong Department of Physics, Peking University, Beijing, P. R. China Contents Motivation
Research on the Wide-angle and Broadband 2D Photonic Crystal Polarization Splitter
 Progress In Electromagnetics Research Symposium 2005, Hangzhou, China, August 22-26 551 Research on the Wide-angle and Broadband 2D Photonic Crystal Polarization Splitter Y. Y. Li, P. F. Gu, M. Y. Li,
Thermal conductance of weak and strong interfaces
 Thermal conductance of weak and strong interfaces David G. Cahill, Wen-Pin Hsieh, Mark Losego, Paul Braun, Dong-Wook Oh, Seok Kim, Eric Pop, Sanjiv Sinha, Paul Braun, and John Rogers Department of Materials
Phonon and Electron Transport through Ge 2 Sb 2 Te 5 Films and Interfaces Bounded by Metals
 Supporting Online Material for Phonon and Electron Transport through Ge 2 Sb 2 Te 5 Films and Interfaces Bounded by Metals Jaeho Lee 1, Elah Bozorg-Grayeli 1, SangBum Kim 2, Mehdi Asheghi 1, H.-S. Philip
Entanglement and Bell s Inequalities. Benjamin Feifke, Kara Morse. Professor Svetlana Lukishova
 Entanglement and Bell s Inequalities Benjamin Feifke, Kara Morse Professor Svetlana Lukishova Abstract The purpose of this is experiment was to observe quantum entanglement by calculating Bell s Inequality
Second Harmonic Generation in Solid-State Materials
 Second Harmonic Generation in Solid-State Materials Galan Moody Alan D. Bristow, Steven T. Cundiff Summer 2007 Abstract Solid-state materials are examined as a function of azimuthal angle using optical
Supplementary Materials to Addressable Photo-Charging of Single Quantum Dots Assisted with Atomic Force Microscopy Probe
 Supplementary Materials to Addressable Photo-Charging of Single Quantum Dots Assisted with Atomic Force Microscopy Probe M. Dokukin 1, R. Olac-Vaw 2, N. Guz 1, V. Mitin 2, and I. Sokolov 1,* 1 Dept. of
Nonstationary electrical charge distribution on the fused silica bifilar pendulum and its effect on the mechanical Q-factor
 Nonstationary electrical charge distribution on the fused silica bifilar pendulum and its effect on the mechanical Q-factor V.P. Mitrofanov, L.G. Prokhorov, K.V. Tokmakov Moscow State University G050097-00-Z
Experimental confirmation of the negentropic character of the diffraction polarization of diffuse radiation
 Experimental confirmation of the negentropic character of the diffraction polarization of diffuse radiation V. V. Savukov In the course of analyzing the axiomatic principles on which statistical physics
Thermal conductance of interfaces with amorphous SiO 2 measured by time-resolved magneto-optic Kerr-effect thermometry. Abstract
 Thermal conductance of interfaces with amorphous SiO 2 measured by time-resolved magneto-optic Kerr-effect thermometry Judith Kimling,, André Philippi-Kobs, 2, 3 Jonathan Jacobsohn, 2 Hans Peter Oepen,
Supplementary Figure 1. Characterization of the single-photon quantum light source based on spontaneous parametric down-conversion (SPDC).
.") .2 Classical light source.8 g (2) ().6.4.2 EMCCD SPAD 2 3.2.4.6.8..2.4.6.8.2 Mean number of photon pairs per pump pulse 4 5 6 7 8 9 2 3 4 Supplementary Figure. Characterization of the single-photon quantum
.2 Classical light source.8 g (2) ().6.4.2 EMCCD SPAD 2 3.2.4.6.8..2.4.6.8.2 Mean number of photon pairs per pump pulse 4 5 6 7 8 9 2 3 4 Supplementary Figure. Characterization of the single-photon quantum
Electric field enhancement in metallic and multilayer dielectric gratings
 Electric field enhancement in metallic and multilayer dielectric gratings B. W. Shore, M. D. Feit, M. D. Perry, R. D. Boyd, J. A. Britten, R. Chow, G. E. Loomis Lawrence Livermore National Laboratory,
Electric Field Measurements in Atmospheric Pressure Electric Discharges
 70 th Gaseous Electronics Conference Pittsburgh, PA, November 6-10, 2017 Electric Field Measurements in Atmospheric Pressure Electric Discharges M. Simeni Simeni, B.M. Goldberg, E. Baratte, C. Zhang, K.
Visualizing the bi-directional electron transfer in a Schottky junction consisted of single CdS nanoparticles and a planar gold film
 Electronic Supplementary Material (ESI) for Chemical Science. This journal is The Royal Society of Chemistry 2017 Electronic Supplementary Information Visualizing the bi-directional electron transfer in
Simulation and Optimization of an In-plane Thermal Conductivity Measurement Structure for Silicon Nanostructures
 32nd International Thermal Conductivity Conference 20th International Thermal Expansion Symposium April 27 May 1, 2014 Purdue University, West Lafayette, Indiana, USA Simulation and Optimization of an
The generation of terahertz frequency radiation by optical rectification
 University of Wollongong Research Online Australian Institute for Innovative Materials - Papers Australian Institute for Innovative Materials 29 The generation of terahertz frequency radiation by optical
Polarization of Light and Birefringence of Materials
 Polarization of Light and Birefringence of Materials Ajit Balagopal (Team Members Karunanand Ogirala, Hui Shen) ECE 614- PHOTONIC INFORMATION PROCESSING LABORATORY Abstract-- In this project, we study
Supplementary Figure 1 Detailed illustration on the fabrication process of templatestripped
 Supplementary Figure 1 Detailed illustration on the fabrication process of templatestripped gold substrate. (a) Spin coating of hydrogen silsesquioxane (HSQ) resist onto the silicon substrate with a thickness
Chapter 2 Correlation Force Spectroscopy
 Chapter 2 Correlation Force Spectroscopy Correlation Force Spectroscopy: Rationale In principle, the main advantage of correlation force spectroscopy (CFS) over onecantilever atomic force microscopy (AFM)
Lab 2: Mach Zender Interferometer Overview
 Lab : Mach Zender Interferometer Overview Goals:. Study factors that govern the interference between two light waves with identical amplitudes and frequencies. Relative phase. Relative polarization. Learn
Photo-Acoustic Measurement of Thermal Conductivity of Thin Films and Bulk Materials
 Xinwei Wang Hanping Hu 1 Xianfan Xu School of Mechanical Engineering, Purdue University, West Lafayette, IN 47907 Photo-Acoustic Measurement of Thermal Conductivity of Thin Films and Bulk Materials The
Supporting Information
 Supporting Information Devlin et al. 10.1073/pnas.1611740113 Optical Characterization We deposit blanket TiO films via ALD onto silicon substrates to prepare samples for spectroscopic ellipsometry (SE)
Measuring Lysozyme Monomer at 0.1 mg/ml Concentration. Equipment used : Sample Preparation and Measurement :
 Application Report #001 Measuring Lysozyme Monomer at 0.1 mg/ml Concentration Equipment used : ALV-NIBS / HPPS High Sensitivity Version, Lysozyme (MERCK), 0.1 molar Sodium-Acetate buffer (ph 4.25), syringe
Light for which the orientation of the electric field is constant although its magnitude and sign vary in time.
 L e c t u r e 8 1 Polarization Polarized light Light for which the orientation of the electric field is constant although its magnitude and sign vary in time. Imagine two harmonic, linearly polarized light
Supplementary Materials. Mechanics and Chemistry: Single Molecule Bond Rupture Forces Correlate with
 Supplementary Materials Mechanics and Chemistry: Single Molecule Bond Rupture Forces Correlate with Molecular Backbone Structure M. Frei 1, S Aradhya 1, M. Koentopp 2, M. S. Hybertsen 3, L. Venkataraman
2 Steady-state absorption spectroscopy measurements
 Electronic Supplementary Material (ESI) for CrystEngComm. This journal is The Royal Society of Chemistry Electronic Supplementary Information (ESI) for Synchronized Photoreversion of Spirooxazine Ring
Realisation of Transparency below the One-Photon Absorption Level for a Coupling Laser Driving a Lambda System under EIT Conditions
 Vol. 112 (2007) ACTA PHYSICA POLONICA A No. 5 Proceedings of the International School and Conference on Optics and Optical Materials, ISCOM07, Belgrade, Serbia, September 3 7, 2007 Realisation of Transparency
Thermal transport through thin films: Mirage technique measurements on aluminum/titanium multilayers ABSTRACT INTRODUCTION
 Thermal transport through thin films: Mirage technique measurements on aluminum/titanium multilayers E. J. Gonzalez, J. E. Bonevich, G. R. Stafford, G. White and D. Josell National Institute of Standards
V High frequency magnetic measurements
 V High frequency magnetic measurements Rémy Lassalle-Balier What we are doing and why Ferromagnetic resonance CHIMP memory Time-resolved magneto-optic Kerr effect NISE Task 8 New materials Spin dynamics
Observing the Doppler Absorption of Rubidium Using a Tunable Laser Diode System
 Observing the Doppler Absorption of Rubidium Using a Tunable Laser Diode System Ryan Prenger 5/5/00 Final Submission Purdue University Physics Department Abstract Using a tunable laser diode, Doppler absorption
Citation for published version (APA): Mollema, A. K. (2008). Laser cooling, trapping and spectroscopy of calcium isotopes s.n.
: Mollema, A. K. (2008). Laser cooling, trapping and spectroscopy of calcium isotopes s.n.") University of Groningen Laser cooling, trapping and spectroscopy of calcium isotopes Mollema, Albert Kornelis IMPORTANT NOTE: You are advised to consult the publisher's version (publisher's PDF) if you
University of Groningen Laser cooling, trapping and spectroscopy of calcium isotopes Mollema, Albert Kornelis IMPORTANT NOTE: You are advised to consult the publisher's version (publisher's PDF) if you
Low Coherence Vibration Insensitive Fizeau Interferometer
 Low Coherence Vibration Insensitive Fizeau Interferometer Brad Kimbrough, James Millerd, James Wyant, John Hayes 4D Technology Corporation, 3280 E. Hemisphere Loop, Suite 146, Tucson, AZ 85706 (520) 294-5600,