Fall International Student Enrollment & Scholar Statistics
|
|
|
- Sheena Dayna Pearson
- 5 years ago
- Views:
Transcription
1 International Student & Scholar Services Fall 2008 International Student Enrollment & Scholar Statistics Julie Misa Director
2 Contents Summary...2 International Student Enrollment by Country...3 Associated tables and charts...8 Regional Trends: Africa...10 Asia...12 Europe...14 Latin America...16 Middle East...18 North America...20 Oceania...22 International Student Enrollment by Curricula...24 Associated tables and charts...28 Enrollment trends...29 New international student data...31 International Scholar Data...32 Associated tables and charts
3 Summary For the Fall 2008 semester, UIUC welcomed 1,879 new international students to campus, a 22.5 percent increase from the number of new students who arrived in Fall The total number of enrolled international students rose by 9.6 percent from the previous year for a total of 5,794. These students represent 123 countries from around the globe, with the top five countries of South Korea (25%), China (20%), India (13%), Taiwan (7%), and Canada (2%). Broken down by educational level, the enrollment of international students increased for undergraduates (9.6%) and decreased slightly for graduates (-.6%). Seventy-eight percent of all international students come from Asia, with 71 percent of those coming from countries in East Asia. Asia saw the greatest percentage jump in enrollment for 2008, increasing by 33.0 percent from last year with the additional 463 students coming from that area of the world. A majority of the international students are coming to UIUC in order to study in the field of Engineering. Approximately 36 percent are studying within the College of Engineering and of all the departments on campus, Electrical and Computer Engineering (558; 9.6%) is the most popular. The other top ranking departments in terms of international student enrollment include Computer Science (359; 6.2%), Civil and Environmental Engineering (272; 4.7%), Economics (223; 4.6%), and Mechanical Science and Engineering (220; 4.3%). Sixty-two percent of international students are studying at the Graduate level, composing approximately 34.7 percent of all UIUC graduate students. International undergraduates account for 7.1 percent of the total UIUC undergraduate population (approximately 11.8% of these are non-degree exchange students), making the total percentage for all international students at UIUC 14.0 percent. From July 2007 through June 2008, the number of international faculty and staff at UIUC increased from 1,438 to 1,541. Over 25% were working in the field of Engineering, followed by nearly 13% in Biological and Biomedical Sciences, and 12.78% in Physical Sciences. The most represented country was China, with 396 faculty and staff, followed by South Korea with 228, India with 183, Japan with 53, and Canada and Germany both with 51. 2
4 Fall 2008 International Student Enrollment by Country, Educational Level, and Gender Undergraduates Graduates Degree Non-Degree Total Master's PhD Professional Non-Degree Total Grand Total Female Male Female Male Female Male Female Male Female Male Female Male AFRICA EASTERN AFRICA Burundi Eritrea Ethiopia Kenya Madagascar Malawi Mauritius Rwanda Somalia Tanzania Uganda Zambia CENTRAL AFRICA Angola Cameroon Congo Sao Tome & Prindipe NORTH AFRICA Algeria Egypt Morocco Sudan Tunisia SOUTHERN AFRICA Botswana South Africa Zimbabwe WESTERN AFRICA Benin Burkina Faso Cote d'ivoire Gambia, The Ghana Liberia Mali Niger Nigeria Senegal Sierra Leone
5 4 Fall 2008 International Student Enrollment by Country, Educational Level, and Gender Undergraduates Graduates Degree Non-Degree Total Master's PhD Professional Non-Degree Total Grand Total Female Male Female Male Female Male Female Male Female Male Female Male ASIA EAST ASIA China (PRC) Hong Kong Japan Korea, Republic of Macau Mongolia Taiwan (ROC) SOUTH AND CENTRAL ASIA Afghanistan Bangladesh India Kazakhstan Kyrgyzstan Maldives Nepal Pakistan Sri Lanka Uzbekistan SOUTHEAST ASIA Brunei Cambodia Indonesia Laos Malaysia Myanmar (Burma) Philippines Singapore Thailand Vietnam
6 Fall 2008 International Student Enrollment by Country, Educational Level, and Gender Undergraduates Graduates Degree Non-Degree Total Master's PhD Professional Non-Degree Total Grand Total Female Male Female Male Female Male Female Male Female Male Female Male EUROPE EASTERN EUROPE Albania Armenia Azerbaijan Belarus Bosnia and Herzegovina Bulgaria Croatia Czech Republic Estonia Georgia Hungary Latvia Lithuania Moldova Montenegro Poland Romania Russia Serbia Slovakia Ukraine WESTERN EUROPE Austria Belgium Denmark Finland France Germany Greece Iceland Ireland Italy Netherlands Norway Portugal Spain Sweden Switzerland United Kingdom
7 6 Fall 2008 International Student Enrollment by Country, Educational Level, and Gender Undergraduates Graduates Degree Non-Degree Total Master's PhD Professional Non-Degree Total Grand Total Female Male Female Male Female Male Female Male Female Male Female Male LATIN AMERICA CARIBBEAN Bahamas Barbados Cayman Islands Cuba Dominican Republic Haiti Jamaica St. Vincent Trinidad & Tobago CENTRAL AMERICA & MEXICO Belize Costa Rica El Salvador Guatemala Honduras Mexico Nicaragua Panama SOUTH AMERICA Argentina Bolivia Brazil Chile Colombia Ecuador Guyana Paraguay Peru Suriname Uruguay Venezuela
8 Fall 2008 International Student Enrollment by Country, Educational Level, and Gender Undergraduates Graduates Degree Non-Degree Total Master's PhD Professional Non-Degree Total Grand Total Female Male Female Male Female Male Female Male Female Male Female Male MIDDLE EAST Bahrain Cyprus Iran Iraq Israel Jordan Kuwait Lebanon Oman Palestinian Authority Qatar Saudi Arabia Syria Turkey United Arab Emirates Yemen NORTH AMERICA Canada OCEANIA Australia Figi New Zealand TOTALS
9 Fall 2008 Regional Summary Undergraduates Graduates Degree Exchange Total Master's PhD Professional Non-Degree Female Male Female Male Female Male Female Male Female Male Female Male Total Grand Total AFRICA ASIA EUROPE LATIN AMERICA MIDDLE EAST NORTH AMERICA OCEANIA TOTAL ENROLLMENT Regional Summary % Change Over Six Years % Change From Last Year Africa % 5.6% Asia % 11.4% Europe % 3.0% Latin America % 4.3% Middle East % 1.2% North America % 6.5% Oceania % 2.6% Total % 9.6% Fall 2008 Regional Distribution of International Students EUROPE 8% LATIN AMERICA 5% MIDDLE EAST 4% ASIA 78% NORTH AMERICA 2% OCEANIA 1% AFRICA 2% Fall 2008 Asian Enrollment by Region SOUTHEAST ASIA 10% SOUTH AND CENTRAL ASIA 19% EAST ASIA 71% 8
10 Fall 2008 Top Ten Countries Undergra Grad Female Male Total Korea, Republic of China (PRC) India Taiwan (ROC) Canada Singapore Turkey Malaysia Indonesia Iran Largest Countries Represented Fall 2008 Other 33% South Korea 25% Canada 2% Taiwan 7% India 13% China 20% Top Ten Countries by Class Top Ten Countries by Gender Korea, Republic of Korea, Republic of China (PRC) China (PRC) India India Taiwan (ROC) Canada Singapore Undergrad Grad Taiwan (ROC) Canada Singapore Female Male Turkey Turkey Malaysia Malaysia Indonesia Indonesia Iran Iran Fall 2008 Breakdown by Gender Overall International Population Female 40% Male 60% Undergraduate International Population Graduate International Population Male 64% Female 36% Male 58% Female 42% 9
11 10
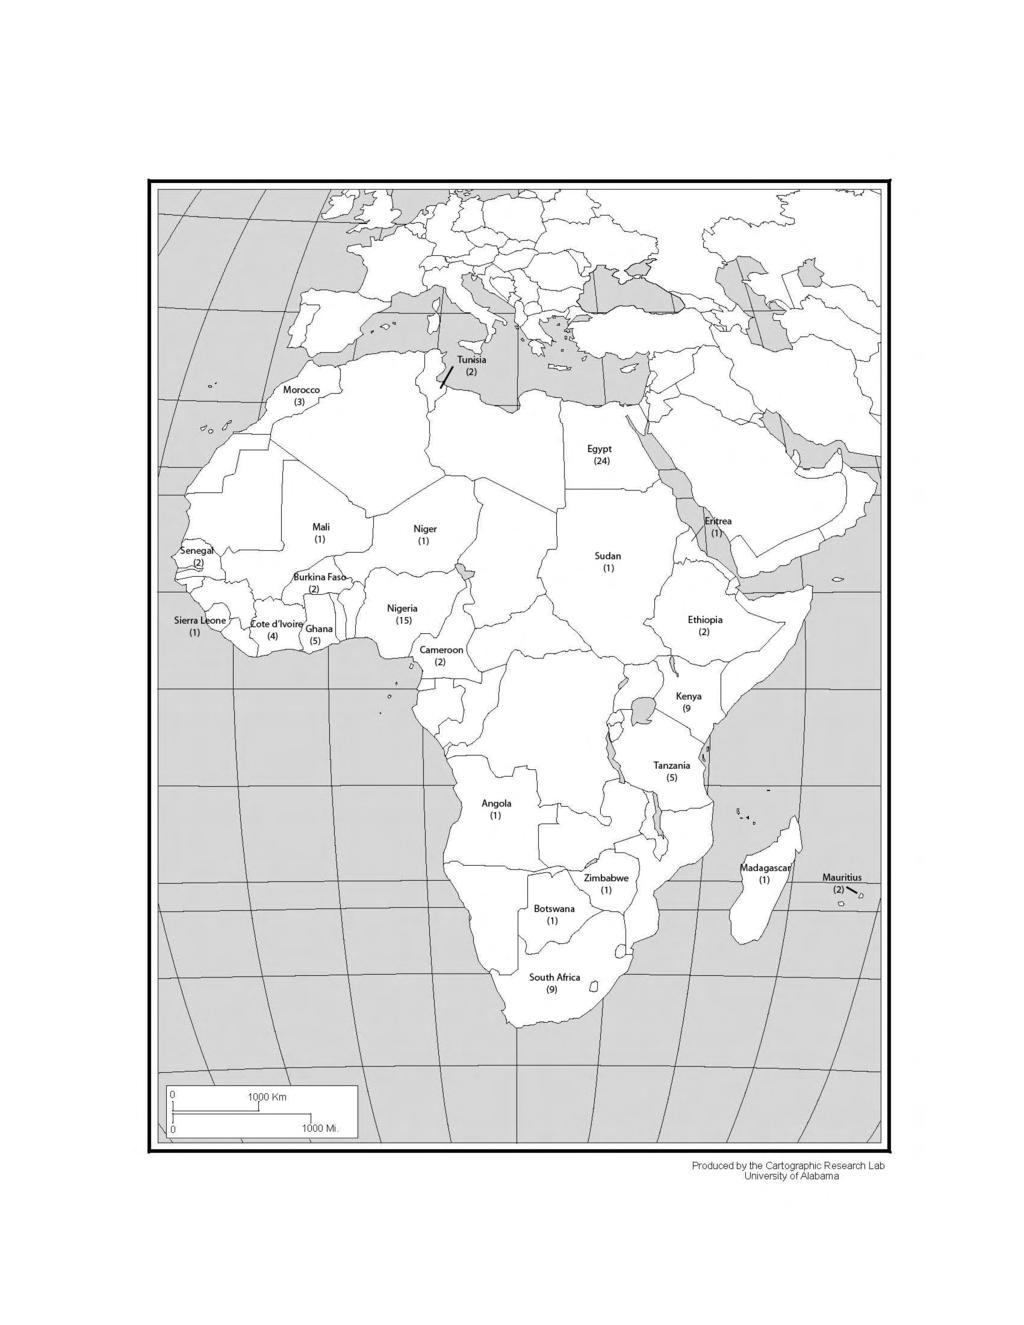
12 Africa Enrollment of international students at the University of Illinois at Urbana-Champaign whose Country of Citizenship is in Africa FIVE YEAR REGIONAL TREND EASTERN AFRICA CENTRAL AFRICA NORTH AFRICA SOUTHERN AFRICA WESTERN AFRICA AFRICA TOTAL Fall 2008 EASTERN AFRICA Burundi Eritrea Top 5 African % Change Over 6 % Change from last Countries Total Years year Ethiopia Egypt % 41.2% Kenya Nigeria % 36.4% Madagascar Kenya % -30.8% Malawi South Africa % -10.0% Mauritius Ghana % -37.5% Rwanda Somalia Tanzania Uganda Zambia CENTRAL AFRICA Angola Cameroon Congo Sao Tome & Prindipe NORTH AFRICA Algeria Egypt Morocco Sudan Tunisia SOUTHERN AFRICA Botswana South Africa Zimbabwe WESTERN AFRICA Benin Burkina Faso Cote d'ivoire Gambia, The Ghana Liberia Mali Niger Nigeria Senegal Sierra Leone AFRICA TOTAL
13 12
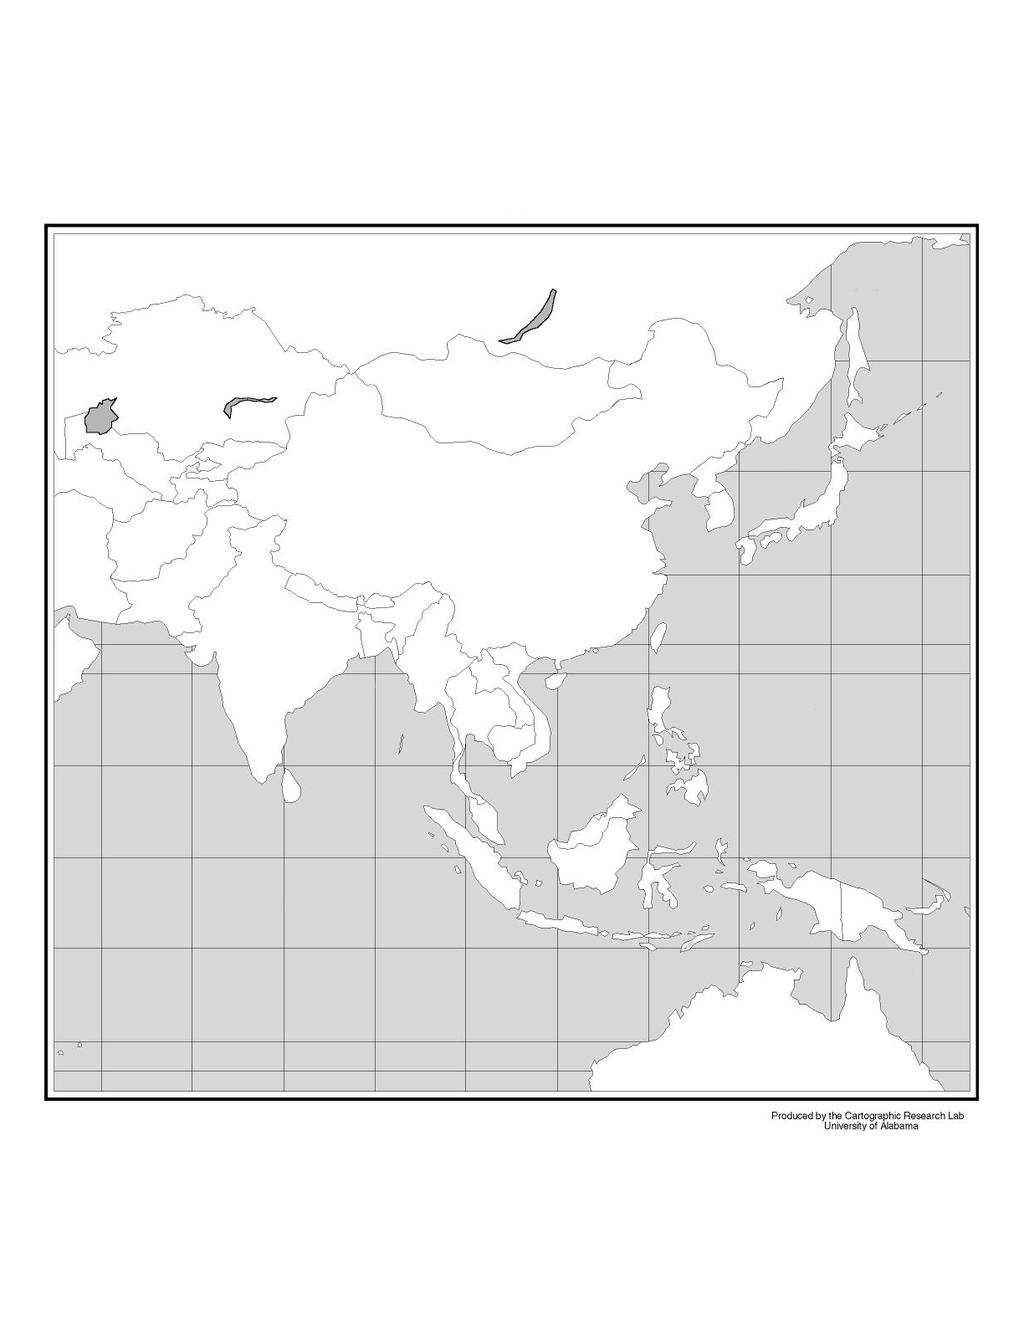
14 Asia Enrollment of international students at the University of Illinois at Urbana-Champaign whose Country of Citizenship is in Asia FIVE YEAR REGIONAL TREND EAST ASIA SOUTH AND CENTRAL ASIA SOUTHEAST ASIA ASIA TOTAL Fall 2008 EAST ASIA China (PRC) Hong Kong Countries Total Years year Japan Korea, Republic of % 12.5% Korea, Republic of China (PRC) % 20.5% Macau India % 13.3% Mongolia Taiwan (ROC) % -4.3% Taiwan (ROC) Singapore % 8.2% SOUTH AND CENTRAL ASIA Afghanistan Bangladesh India Kazakhstan Kyrgyzstan Maldives Nepal Pakistan Sri Lanka Uzbekistan Top 5 Asian % Change Over 6 % Change from last SOUTHEAST ASIA Brunei Cambodia Indonesia Laos Malaysia Myanmar (Burma) Philippines Singapore Thailand Vietnam ASIA TOTAL
15 14
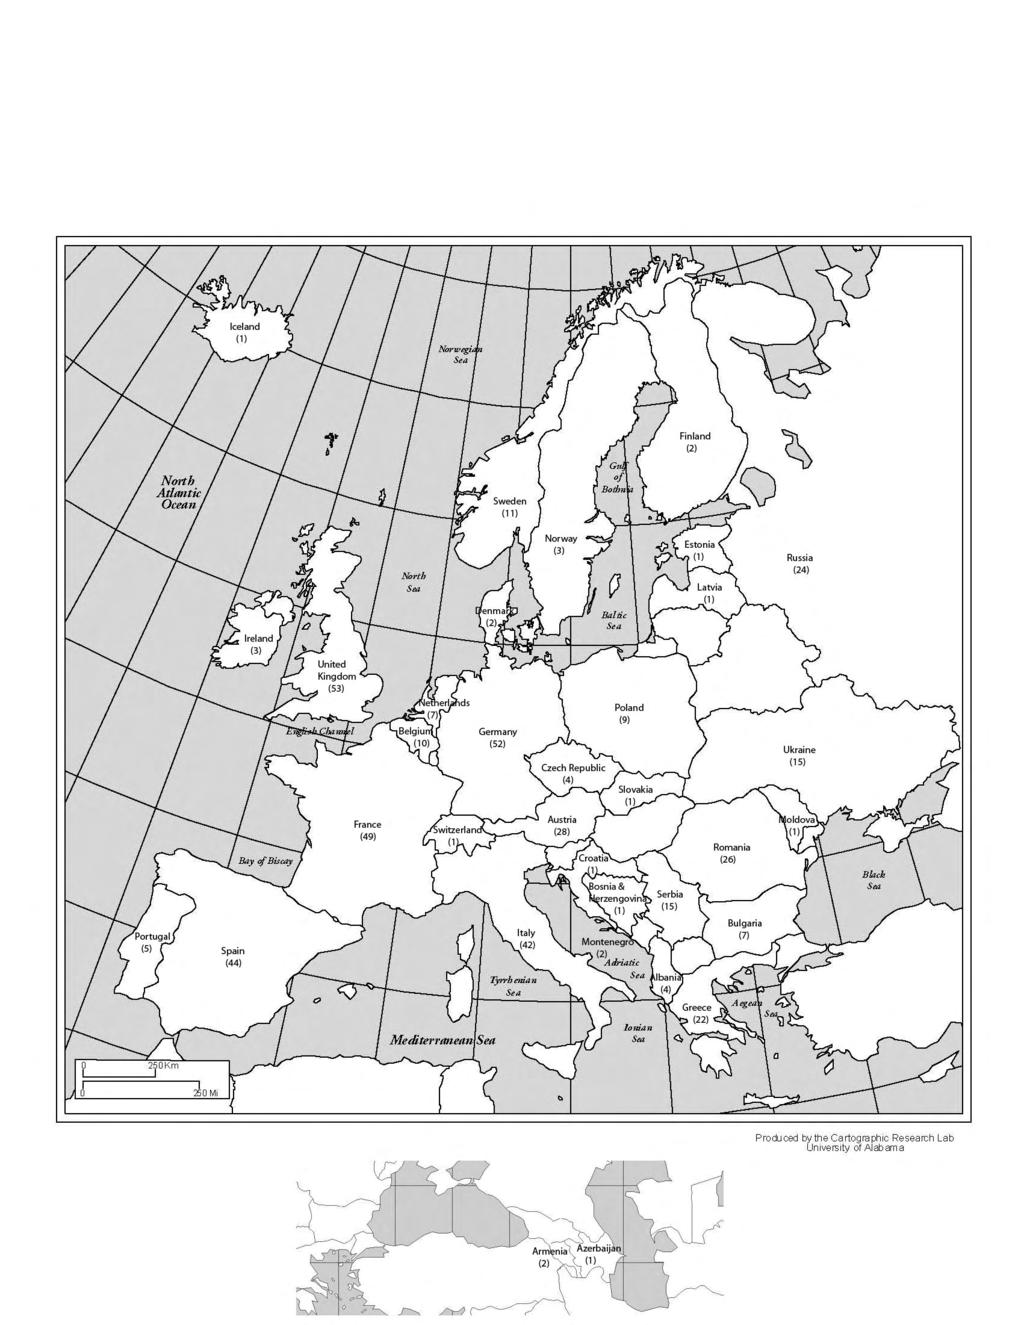
16 Europe Enrollment of international students at the University of Illinois at Urbana-Champaign whose Country of Citizenship is in Europe FIVE YEAR REGIONAL TREND EASTERN EUROPE WESTERN EUROPE EUROPE TOTAL Fall 2008 EASTERN EUROPE Albania Armenia Top 5 European % Change Over 6 % Change from last Countries Total Years year Azerbaijan United Kingdom % 0.0% Belarus Germany % 2.0% Bosnia and Herzengovina France % 2.0% Bulgaria Spain % 10.0% Croatia Italy % 82.6% Czech Republic Estonia Georgia Hungary Latvia Lithuania Moldova Poland Romania Russia Serbia & Montenegro* Slovakia Ukraine WESTERN EUROPE Austria Belgium Denmark Finland France Germany Greece Iceland Ireland Italy Netherlands Norway Portugal Spain Sweden Switzerland United Kingdom EUROPE TOTAL * Serbia and Montenegro are now separate countries, however they are listed together here because historical data would not be available otherwise. 15
17 16
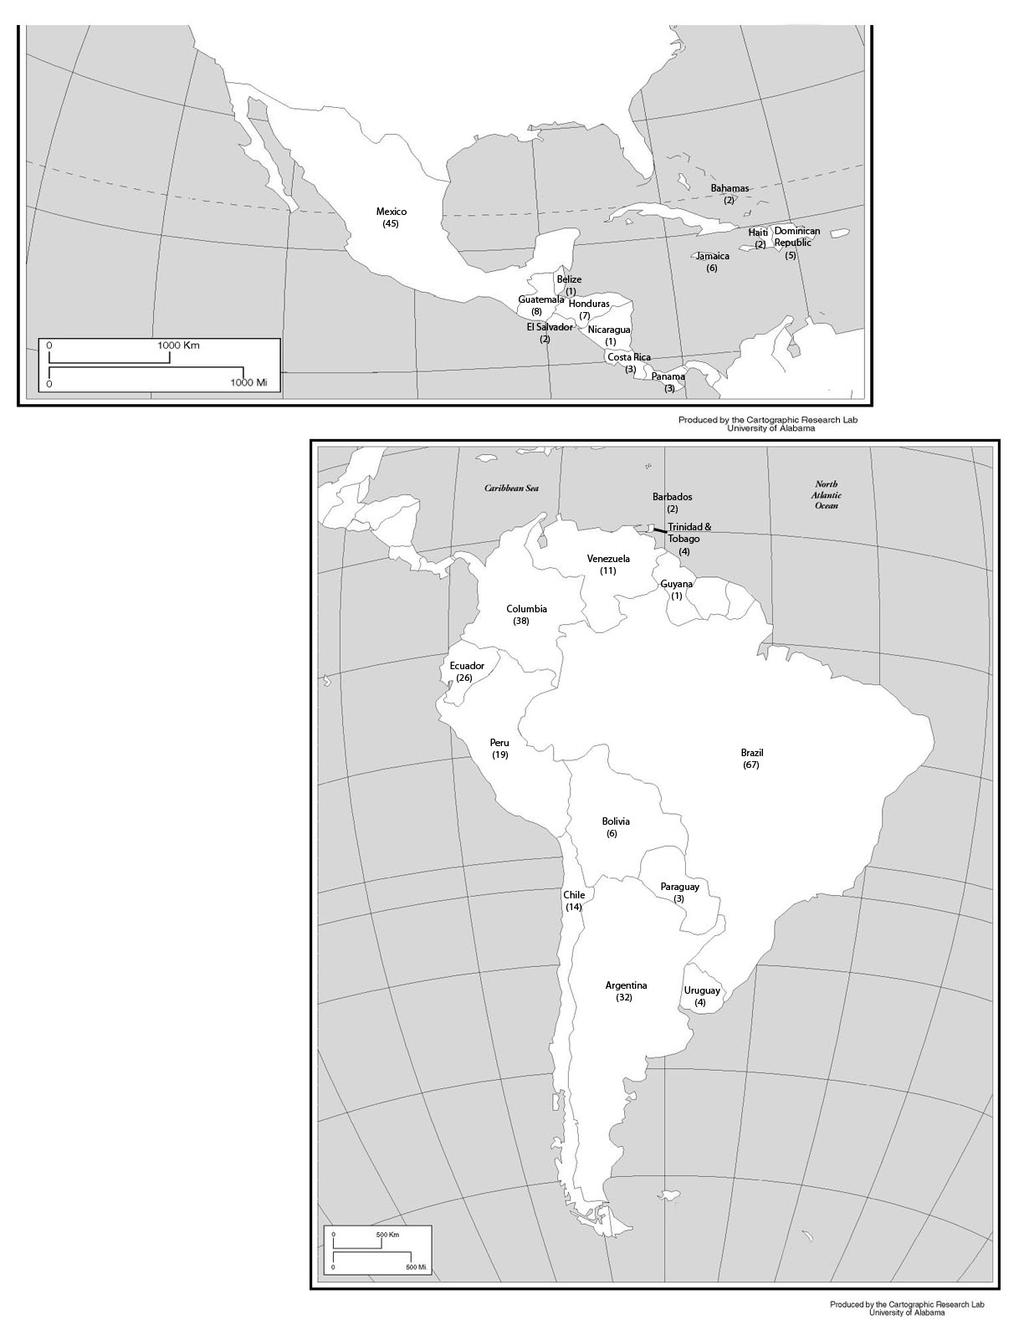
18 Latin America Enrollment of international students at the University of Illinois at Urbana-Champaign whose Country of Citizenship is in Latin America FIVE YEAR REGIONAL TREND CARIBBEAN CENTRAL AMERICA AND MEXICO SOUTH AMERICA LATIN AMERICA TOTAL Fall 2008 CARIBBEAN Bahamas Barbados American Countries Total Years year Cayman Islands Brazil % 11.7% Cuba Mexico % 2.3% Dominican Republic Colombia % 2.7% Haiti Argentina % -5.9% Jamaica Ecuador % 0.0% St. Vincent Trinidad & Tobago CENTRAL AMERICA AND MEXICO Belize Costa Rica El Salvador Guatemala Honduras Mexico Nicaragua Panama Top 5 Latin % Change Over 6 % Change from last SOUTH AMERICA Argentina Bolivia Brazil Chile Colombia Ecuador Guyana Paraguay Peru Suriname Uruguay Venezuela LATIN AMERICA TOTAL
19 18
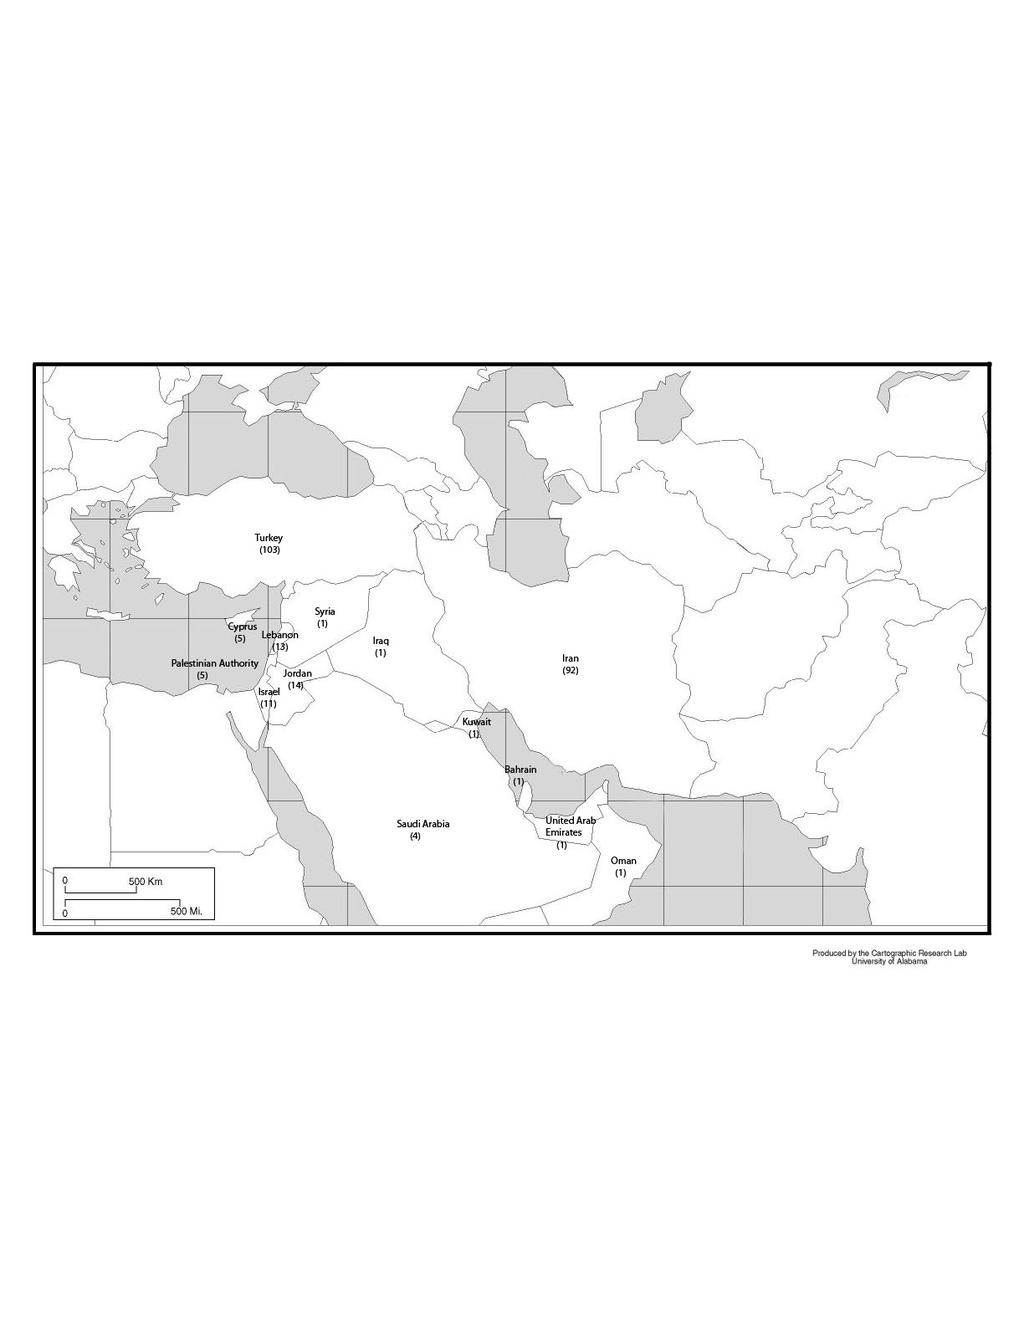
20 Middle East Enrollment of international students at the University of Illinois at Urbana-Champaign whose Country of Citizenship is in the Middle East FIVE YEAR REGIONAL TREND Fall 2008 MIDDLE EAST Bahrain Cyprus Iran Iraq Countries Total Years year Israel Turkey % -12.7% Jordan Iran % 27.8% Kuwait Lebanon % -13.3% Lebanon Israel % -15.4% Oman Jordan % 16.7% Palestinian Authority Qatar Saudi Arabia Syria Turkey United Arab Emirates Yemen MIDDLE EAST TOTAL Top 5 Middle Eastern % Change Over 6 % Change from last 19
21 20
22 North America Enrollment of international students at the University of Illinois at Urbana-Champaign whose Country of Citizenship is in North America FIVE YEAR REGIONAL TREND NORTH AMERICA Canada NORTH AMERICA TOTAL
23 22
24 Oceania Enrollment of international students at the University of Illinois at Urbana-Champaign whose Country of Citizenship is in Oceania FIVE YEAR REGIONAL TREND OCEANIA Australia Figi New Zealand OCEANIA TOTAL
25 24 Fall 2008 International Student Enrollment by Department, Educational Level, and Class Undergraduate Graduate Degree Nondegree Total Masters Doctorate Professional Non-degree Total Grand Total % UIUC International Enrolled Agricultural, Consumer and Environmental Sciences % Ag & Consumer Econ % Ag & Biol Engineering % Animal Sciences % Crop Sciences % Food Sci/Hum Nutr % Hum & Com Dev % Nat Res/Env Sci % Nutritional Sciences % Exchange % Applied Health Sciences % Community Health % Kinesiology % Rec/Sport/Tourism % Sp & Hearing Sci % Exchange % Institute of Aviation % Business % Accountancy % Bus Administration % Finance % MBA Program % Undeclared % Exchange % Media % Advertising % Communications % Institute of Communications Research % Journalism % Undeclared % Exchange %
26 Fall 2008 International Student Enrollment by Department, Educational Level, and Class Undergraduate Graduate Degree Nondegree Total Masters Doctorate Professional Non-degree Total Grand Total % UIUC International Enrolled Education % Curr & Instruction % Educ Org & Ldrshp % Educ Policy Studies % Educ Psychology % Human Res Educ % Special Education % Undeclared % Exchange % Engineering % Aero/Astro Eng % Bioengineering % Civil/Environ Eng % Computer Science % Electrical & Computer Eng % Engineering Administration % Industrial & Enterprise Systems Eng % MATSE % Mechanical Science & Eng % Physics % Plasma/Radiological Eng % Exchange % Fine and Applied Arts % Architecture % Art and Design % Dance % Landscape Arch % Music % Theatre % Urban/Regional Plan % Undeclared % Exchange % 25
27 26 Fall 2008 International Student Enrollment by Department, Educational Level, and Class Undergraduate Graduate Degree Nondegree Total Masters Doctorate Professional Non-degree Total Grand Total % UIUC International Enrolled 0.00% Institute of Labor and Industrial Relations % Law % Graduate % Professional % Exchanges % Liberal Arts and Sciences % African Studies % Anthropology % Astronomy % Atmospheric Sci % Biochemistry % Biological Sciences Program % Cell and Developmental Biology % Chem & Biomolecular Eng % Chemistry % Classics % Communication % Comparative Lit % Division of General Studies % E Asian Langs % Earth, Society, Environment % Economics % English % Eng/International Lang % Entomology % French % Geography % Geology % Germanic Langs % History % Integrative Biology %
28 Fall 2008 International Student Enrollment by Department, Educational Level, and Class Undergraduate Graduate Degree Nondegree Total Masters Doctorate Professional Non-degree Total Grand Total % UIUC International Enrolled LAS Admin % Life Sciences % Linguistics % Mathematics % Microbiology % Molecular & Cellular Biology % Molecular & Integrative Physiology % Philosophy % Plant Biology % Political Science % Psychology % Religious Studies % Russian and Eastern European Studies % Slavic Langs % Sociology % Spanish/Italian/Port % Statistics % Exchange % Graduate School of Library and Information Sciences % School of Social Work % Veterinary Medicine % Professional % Vet Biosciences % Vet Clinical Med % Vet Med Science % Vet Pathobiology % GRAND TOTALS
29 Distribution by Degree Level Graduate % Undergradu ate % Graduate Distribution Undergraduate Distribution Professional % Non-degree % Masters % Nondegree, 262, 12% Doctorate % Degree, 1955, 88% Distribution by Academic Class Undergraduate Master's PhD Professional Non-degree Distribution by College Engineering 2105 Liberal Arts and Sciences 1890 Business 688 Fine and Applied Arts 358 Agricultural, Consumer and Environmental Sciences 251 Education 179 Law 64 Applied Health Sciences 64 Media 62 Institute of Labor and Industrial Relations 38 Graduate School of Library and Information Sciences 38 Vetrinary Medicine 32 School of Social Work 17 Institute of Aviation
30 College Enrollment Trends %Change Over Six Years %Change from Last Year College Agricultural, Consumer and Environmental Sciences % 13.6% Applied Health Sciences % -4.5% Institute of Aviation % 33.3% Business % 6.5% Media % 12.7% Education % -10.9% Engineering % 15.9% Fine and Applied Arts % 6.5% Institute of Labor and Industrial Relations % -9.5% Law % -9.9% Liberal Arts and Sciences % 8.2% Graduate School of Library and Information Sciences % 15.2% School of Social Work % 0.0% Veterinary Medicine % 6.7% % 9.6% Top 5 College Trends Engineering Liberal Arts and Sciences Business Fine and Applied Arts 1000 Agricultural, Consumer and Environmental Sciences Top Ten Departments* Electrical & Computer Eng 282 Computer Science Civil & Environ Eng Economics Mechanical Sci & Eng Accountancy Math Division of General Studies Physics Finance Undergraduate Graduate * Non-Degree Exchange students not included 29
31 International Student Enrollment by Degree Level ( )* International Undergrad UIUC Undergrad % Int UG of UIUC 2.0% 2.4% 3.1% 3.4% 4.0% 4.5% 4.8% 5.0% 5.5% 7.1% International Grad UIUC Grad % Int Grad of UIUC 32.7% 34.7% 35.8% 35.9% 35.4% 35.3% 33.8% 34.5% 34.5% 34.7% Total International Total UIUC % International of UIUC 9.4% 10.3% 11.4% 11.9% 12.3% 12.5% 12.1% 12.4% 12.9% 14.0% * UIUC totals gathered from 10 day student enrollment statistics produced by the Division of Management Information. Professional students included in graduate student counts. International Student Enrollment International Student Enrollment by Degree Level International Undergrad International Grad Percent Change in Enrollment Over Time 14.0% 12.0% 10.0% 8.0% 6.0% 4.0% 2.0% 0.0% -2.0% 12.9% 10.0% 9.6% 6.4% 6.3% 4.7% 4.9% 2.8% 4.1% -1.2%
32 Fall 2008 New International Student Enrollment by College College Undergraduate UG Exchange Graduate Grad Nondegree Totals Engineering LAS Business FAA ACES Law Media AHS Education Inst. of LIR LIS Vet Med Sch. of Soc Work Inst. of Aviation Totals India % Fall 2008 New International Student Top Five Countries Represented Taiwan 115 9% China % United Kingdom 39 3% South Korea % Fall 2008 New International Student Enrollment Distribution by Academic Class Freshman Sophomore Junior Senior UG Non- Degree/ Exchange Masters Doctorate Professional Graduate Non-degree/ Exchange New International Student Enrollment Percent Change in New International Student Enrollment % 20.0% 22.5% 15.0% 10.0% 5.0% 0.0% -5.0% 7.6% 3.7% 4.1% -1.6%
33 International Faculty and Staff by World Region * J-1 H-1B Other Female Male Female Male Female Male Total AFRICA EASTERN AFRICA Burundi Eritrea Ethiopia Kenya Madagascar Malawi Mauritius Rwanda Somalia Tanzania Uganda Zambia CENTRAL AFRICA Angola Cameroon Congo Sao Tome & Prindipe NORTH AFRICA Algeria Egypt Morocco Sudan Tunisia SOUTHERN AFRICA Botswana South Africa Zimbabwe WESTERN AFRICA Benin Burkina Faso Cote d'ivoire Gambia, The Ghana Liberia Mali Niger Nigeria Senegal Sierra Leone *These are total numbers for Actual length of stay may range from a few weeks to several years.
34 International Faculty and Staff by World Region * J-1 H-1B Other Female Male Female Male Female Male Total ASIA EAST ASIA China (PRC) Hong Kong Japan Korea, Republic of Macau Mongolia Taiwan (ROC) SOUTH AND CENTRAL ASIA Afghanistan Bangladesh India Kazakhstan Kyrgyzstan Maldives Nepal Pakistan Sri Lanka Uzbekistan SOUTHEAST ASIA Brunei Cambodia Indonesia Laos Malaysia Myanmar (Burma) Philippines Singapore Thailand Vietnam *These are total numbers for Actual length of stay may range from a few weeks to several years. 33
35 International Faculty and Staff by World Region * J-1 H-1B Other Female Male Female Male Female Male Total EUROPE EASTERN EUROPE Albania Armenia Azerbaijan Belarus Bosnia and Herzengovina Bulgaria Croatia Czech Republic Estonia Georgia Hungary Latvia Lithuania Moldova Montenegro Poland Romania Russia Serbia Slovakia Ukraine WESTERN EUROPE Austria Belgium Denmark Finland France Germany Greece Iceland Ireland Italy Netherlands Norway Portugal Spain Sweden Switzerland United Kingdom *These are total numbers for Actual length of stay may range from a few weeks to several years.
36 International Faculty and Staff by World Region * J-1 H-1B Other Female Male Female Male Female Male Total LATIN AMERICA CARIBBEAN Bahamas Barbados Cayman Islands Cuba Dominican Republic Haiti Jamaica St. Vincent Trinidad & Tobago CENTRAL AMERICA AND MEXICO Belize Costa Rica El Salvador Guatemala Honduras Mexico Nicaragua Panama SOUTH AMERICA Argentina Bolivia Brazil Chile Colombia Ecuador Guyana Paraguay Peru Suriname Uruguay Venezuela *These are total numbers for Actual length of stay may range from a few weeks to several years. 35
37 International Faculty and Staff by World Region * J-1 H-1B Other Female Male Female Male Female Male Total MIDDLE EAST Bahrain Cyprus Iran Iraq Israel Jordan Kuwait Lebanon Oman Palestinian Authority Qatar Saudi Arabia Syria Turkey United Arab Emirates Yemen NORTH AMERICA Canada OCEANIA Australia Figi New Zealand TOTALS *These are total numbers for Actual length of stay may range from a few weeks to several years.
38 UIUC International Faculty and Staff by Field of Specialization Field of Specialization Total % of Total Agriculture % Architecture and Environtmental Design % Area and Ethnic Studies % Communications % Computer and Information Sciences % Education % Engineering % Foreign Languages and Literature % Family and Consumer Sciences % Law and Legal Studies % Letters % Library Sciences % Biological and Biomedical Sciences % Mathematics % Philosophy and Religion % Physical Sciences % Psychology % Public Administration and Social Service % Social Sciences % Visual and Performing Arts % Health Sciences % Business and Management % History % Other % Total 1541 H-1B 32% Faculty and Staff by Immigration Status Other 5% J-1 63% Female 30% International Faculty and Staff Faculty and Staff by Gender Male 70% Top 5 Countries Represented China 396 South Korea 228 India 183 Japan Canada Germany Engineering Biological and Biomedical Sciences Physical Sciences Computer and Information Sciences Agriculture Health Sciences Social Sciences Business and Management Library Sciences Education Mathematics Law and Legal Studies Psychology Letters Family and Consumer Sciences Communications Area and Ethnic Studies Visual and Performing Arts Public Administration and Social Service Architecture and Environtmental Design Foreign Languages and Literature Other History Philosophy and Religion Field of Specialization
Spring 2007 International Student Enrollment by Country, Educational Level, and Gender
 Grand AFRICA 3 9 0 0 12 5 8 18 42 3 0 0 0 76 88 EASTERN AFRICA 0 0 0 0 0 2 3 7 16 1 0 0 0 29 29 Burundi 0 0 0 0 0 0 0 1 0 0 0 0 0 1 1 Eritrea 0 0 0 0 0 0 0 0 0 0 0 0 0 0 0 Ethiopia 0 0 0 0 0 0 0 1 4 0
Fall International Student Enrollment Statistics
 International Student & Scholar Services Fall 2006 International Student Enrollment Statistics Julie Misa Director www.ips.uiuc.edu/isss Contents Summary...3 International Student Enrollment by Country...5
Fall International Student Enrollment Statistics
 International Student & Scholar Services Fall 2007 International Student Enrollment Statistics Julie Misa Director www.ips.uiuc.edu/isss Contents Summary...2 International Student Enrollment by Country...3
Country of Citizenship, College-Wide - All Students, Fall 2014
 Country of Citizenship, College-Wide - All Students, Fall 2014-49,552 (72%) students were U.S. Citizens in Fall 2014. - MDC's non-citizen students come from at least 167 countries and speak approximately
Supplementary Appendix for. Version: February 3, 2014
 Supplementary Appendix for When Do Governments Resort to Election Violence? Version: February 3, 2014 This appendix provides supplementary information not included in the published draft. Supplementary
Situation on the death penalty in the world. UNGA Vote 2012 Resolutio n 67/176. UNGA Vote 2010 Resolutio n 65/206. UNGA Vote 2008 Resolutio n 63/168
 Situation on the death penalty in the world Prepared by the International Commission against the Death Penalty (ICDP), as of 8 June 2014. Based on Amnesty International and Death Penalty Worldwide. Country
International Student Enrollment Fall 2018 By CIP Code, Country of Citizenship, and Education Level Harpur College of Arts and Sciences
 International Student Enrollment Fall 2018 By CIP Code, Country of Citizenship, and Education Level Harpur College of Arts and Sciences CIP Code Description Citizenship Graduate Undergrad Total 00.0000
Appendices. Please note that Internet resources are of a time-sensitive nature and URL addresses may often change or be deleted.
 Appendices Appendix A Table of Treaties Appendix B State Trademark Registration Provisions Appendix C Resources Appendix D Forms Appendix Appendix E Selected Statutes Please note that Internet resources
PROPOSED BUDGET FOR THE PROGRAMME OF WORK OF THE CONVENTION ON BIOLOGICAL DIVERSITY FOR THE BIENNIUM Corrigendum
 CBD Distr. GENERAL UNEP/CBD/COP/11/10/Corr.1 6 October ORIGINAL: ENGLISH CONFERENCE OF THE PARTIES TO THE CONVENTION ON BIOLOGICAL DIVERSITY Eleventh meeting Hyderabad, India, 8-19 October Item 14.2 of
INTERNATIONAL S T U D E N T E N R O L L M E N T
 The University of California at Berkeley INTERNATIONAL S T U D E N T E N R O L L M E N T Fall 2008 Prepared by: Berkeley International Office 2299 Piedmont Avenue Berkeley, CA 94720-2321 510.642.2818 http://internationaloffice.berkeley.edu/
PRECURSORS. Pseudoephedrine preparations 3,4-MDP-2-P a P-2-P b. Ephedrine
 ANNEXES Annex II Annual legitimate requirements for ephedrine, pseudoephedrine, 3,4-methylenedioxyphenyl-2-propanone and 1-phenyl-2-propanone, substances frequently used in the manufacture of amphetamine-type
GINA Children. II Global Index for humanitarian Needs Assessment (GINA 2004) Sheet N V V VI VIII IX X XI XII XII HDR2003 HDR 2003 UNDP
 Sheet N V V VI VIII IX X XI XII XII HDR2003 HDR 2003 UNDP") Human UNICEF Index Index Natural 2003 GDP per Total as % of Total Rate HDI HPI Disasters Conflicts capita Population population 5 1 Congo, Democratic Republic of the 2,80000 3 3 1 3 3 3 3 3 3 3 2 Burundi
Human UNICEF Index Index Natural 2003 GDP per Total as % of Total Rate HDI HPI Disasters Conflicts capita Population population 5 1 Congo, Democratic Republic of the 2,80000 3 3 1 3 3 3 3 3 3 3 2 Burundi
Mexico, Central America and the Caribbean South America
 Objective: This assignment is a way to prepare you for many different aspects of AP Human Geography. You will be held accountable for this assignment; it will be the first grade of the quarter. Failure
About the Authors Geography and Tourism: The Attraction of Place p. 1 The Elements of Geography p. 2 Themes of Geography p. 4 Location: The Where of
 Preface p. ix About the Authors p. xi Geography and Tourism: The Attraction of Place p. 1 The Elements of Geography p. 2 Themes of Geography p. 4 Location: The Where of Geography p. 4 Place and Space:
Most Recent Periodic Report Initial State Report. Next Periodic Accession/Ratification. Report Publication Publication. Report Due
 Country Signature Most Recent Periodic Report Initial State Report Next Periodic Accession/Ratification Report Publication Publication Report Due Number Date Afghanistan 4 Feb 1985 1 Apr 1987 25 Jun 1992
Does socio-economic indicator influent ICT variable? II. Method of data collection, Objective and data gathered
 Does socio-economic indicator influent ICT variable? I. Introduction This paper obtains a model of relationship between ICT indicator and macroeconomic indicator in a country. Modern economy paradigm assumes
04 June Dim A W V Total. Total Laser Met
 4 June 218 Member State State as on 4 June 218 Acronyms are listed in the last page of this document. AUV Mass and Related Quantities Length PR T TF EM Mass Dens Pres F Torq Visc H Grav FF Dim A W V Total
Canadian Imports of Honey
 of 0409000029 - Honey, natural, in containers of a weight > 5 kg, nes (Kilogram) Argentina 236,716 663,087 2,160,216 761,990 35.27% 202.09% /0 76,819 212,038 717,834 257,569 35.88% 205.69% /0 United States
University of Oklahoma, Norman Campus International Student Report Fall 2014
 International Student Report Fall 2014 Prepared by Institutional Research & Reporting June 2015 http://www.ou.edu/content/irr/data-center/annual-reports.html International Student Report Notes and Definitions
DISTILLED SPIRITS - EXPORTS BY VALUE DECEMBER 2017
 DISTILLED SPIRITS - EXPORTS BY VALUE DECEMBER 2017 U.S. COMMERCIAL EXPORTS OF DISTILLED SPIRITS - DECEMBER 2017 (U.S. DOLLARS) Da-Value-17-12 SUMMARY BY CLASS CLASS DECEMBER DECEMBER DOLLAR YTD YTD DOLLAR
Programme budget for the biennium Programme budget for the biennium
 DRAFT TEXT on SB 46 agenda item 16(a) Administrative, financial and institutional matters Programme budget for the biennium 2018 2019 Version 1 of 13 May at 12:00 Programme budget for the biennium 2018
2001 Environmental Sustainability Index
 2001 Environmental Sustainability Index Annex 6: Variable Descriptions and Data An Initiative of the Global Leaders of Tomorrow Environment Task Force, World Economic Forum Annual Meeting 2001 Davos, Switzerland
The Chemical Weapons Convention, Biological and Toxin Weapons Convention, Geneva Protocol
 The Chemical Weapons Convention, Biological and Toxin Weapons Convention, Geneva Afghanistan 14 Jan 93 24 Sep 03 6 Mar 75 (R) 09 Dec 86 Albania 14 Jan 93 11 May 94 03 Jun 92 20 Dec 89 Algeria 13 Jan 93
SUGAR YEAR BOOK INTERNATIONAL SUGAR ORGANIZATION 1 CANADA SQUARE, CANARY WHARF, LONDON, E14 5AA.
 SUGAR YEAR BOOK 2017 INTERNATIONAL SUGAR ORGANIZATION 1 CANADA SQUARE, CANARY WHARF, LONDON, E14 5AA www.isosugar.org Copyright 2017 International Sugar Organization All rights reserved. No part of ISO
Government Size and Economic Growth: A new Framework and Some Evidence from Cross-Section and Time-Series Data
 1 Government Size and Economic Growth: A new Framework and Some Evidence from Cross-Section and Time-Series Data Original Paper by Rati Ram (1986) Replication and Extension by Nicolas Lopez ECON 5341 The
Patent Cooperation Treaty (PCT) Working Group
 Working Group") E PCT/WG/7/26 ORIGINAL: ENGLISH DATE: MAY 21, 2014 Patent Cooperation Treaty (PCT) Working Group Seventh Session Geneva, June 10 to 13, 2014 FEE REDUCTIONS FOR CERTAIN APPLICANTS FROM CERTAIN COUNTRIES,
E PCT/WG/7/26 ORIGINAL: ENGLISH DATE: MAY 21, 2014 Patent Cooperation Treaty (PCT) Working Group Seventh Session Geneva, June 10 to 13, 2014 FEE REDUCTIONS FOR CERTAIN APPLICANTS FROM CERTAIN COUNTRIES,
Governments that have requested pre-export notifications pursuant to article 12, paragraph 10 (a), of the 1988 Convention
, of the 1988 Convention") Annex X Governments that have requested pre-export notifications pursuant to article 12, paragraph 10 (a), of the 1988 Convention 1. Governments of all exporting countries and territories are reminded
Annex X Governments that have requested pre-export notifications pursuant to article 12, paragraph 10 (a), of the 1988 Convention 1. Governments of all exporting countries and territories are reminded
PROPOSED BUDGET FOR THE PROGRAMME OF WORK OF THE CARTAGENA PROTOCOL ON BIOSAFETY FOR THE BIENNIUM Corrigendum
 CBD CONFERENCE OF THE PARTIES TO THE CONVENTION ON BIOLOGICAL DIVERSITY SERVING AS THE MEETING OF THE PARTIES TO THE CARTAGENA PROTOCOL ON BIOSAFETY Fifth meeting, Nagoya, Japan, 11-15 October 2010 Item
Natural Resource Management Indicators for the Least Developed Countries
 Natural Resource Management Indicators for the Least Developed Countries Alex de Sherbinin CIESIN, Columbia University 24 June 2005 Millennium Challenge Corporation workshop Brookings Institution Washington,
Erratum to: Policies against human trafficking: the role of religion and political institutions
 Econ Gov (2016) 17:387 396 DOI 10.1007/s10101-016-0185-1 ERRATUM Erratum to: Policies against human trafficking: the role of religion and political institutions Niklas Potrafke 1,2 Published online: 16
Immigrant Status and Period of Immigration Newfoundland and Labrador 2001 Census
 and Period of Immigration Census - Total - Place of birth of respondent 8,985 8,030 1,635 1,510 1,700 1,165 2,015 880 1,130 955 Americas 2,165 1,835 210 445 635 225 315 140 175 335 North America 1,995
2017 Source of Foreign Income Earned By Fund
 2017 Source of Foreign Income Earned By Fund Putnam Emerging Markets Equity Fund EIN: 26-2670607 FYE: 08/31/2017 Statement Pursuant to 1.853-4: The fund is hereby electing to apply code section 853 for
Countries in Order of Increasing Per Capita Income, 2000
 ,400 45000,200 Population Per Capita Income 40000 35000,000 30000 Population, millions 800 600 25000 20000 Per Capita Income 5000 400 0000 200 5000 0 2 3 4 5 6 7 8 9 0 2 3 4 5 6 7 Countries in Order of
DISTILLED SPIRITS - IMPORTS BY VALUE DECEMBER 2017
 DISTILLED SPIRITS - IMPORTS BY VALUE DECEMBER 2017 U.S. DUTIABLE IMPORTS OF DISTILLED SPIRITS (U.S. DOLLARS) Ea-Value-17-12 SUMMARY: IMPORTS ENTERED FOR CONSUMPTION CLASS DECEMBER DECEMBER PERCENT JANUARY
DISTILLED SPIRITS - IMPORTS BY VOLUME DECEMBER 2017
 DISTILLED SPIRITS - IMPORTS BY VOLUME DECEMBER 2017 U.S. DUTIABLE IMPORTS OF DISTILLED SPIRITS (PROOF GALLONS) Ea-17-12 SUMMARY: IMPORTS ENTERED FOR CONSUMPTION CLASS DECEMBER DECEMBER PERCENT JANUARY
Solow model: Convergence
 Solow model: Convergence Per capita income k(0)>k* Assume same s, δ, & n, but no technical progress y* k(0)=k* k(0) k Assume same s, δ, &
International legal instruments related to the prevention and suppression of international terrorism
 III. International legal instruments related to the prevention and suppression of international terrorism A. Status of international conventions pertaining to international terrorism 138. Currently, there
Appendix A. ICT Core Indicators: Definitions
 Appendix A. ICT Core Indicators: Definitions ICT indicator Fixed telephone subscriptions per 100 inhabitants Mobile cellular telephone subscriptions per 100 inhabitants Fixed (wired) Internet subscriptions
Velocity Virtual Rate Card 2018
 Local 0.26 0.00 0.26 Local National 0.26 0.00 0.26 National Mobile 0.26 0.00 0.26 Mobile AFGHANISTAN ALBANIA 2.20 0.00 2.20 International ALGERIA 2.20 0.00 2.20 International ANDORRA 2.20 0.00 2.20 International
Delegations School GA Opening Speech 1 SPC Opening Speech 2 SC Total Amnesty International Agora Sant Cugat Botswana Agora Sant Cugat 1 Y 1 Y
 Amnesty International Agora Sant Cugat 1 1 0 2 Botswana Agora Sant Cugat 1 Y 1 Y 0 2 Cameroon Agora Sant Cugat 1 Y 1 Y 0 2 Cuba Agora Sant Cugat 1 Y 1 Y 0 2 Indonesia Agora Sant Cugat 1 Y 1 Y 0 2 Israel
Export Destinations and Input Prices. Appendix A
 Export Destinations and Input Prices Paulo Bastos Joana Silva Eric Verhoogen July 2017 Appendix A For Online Publication Figure A1. Real exchange rate, selected richer destinations relative price level
Climate variability and international migration: an empirical analysis
 Climate variability and international migration: an empirical analysis NICOLA D. CONIGLIO, Corresponding author University of Bari Aldo Moro, Department of Economics, Largo Abbazia Santa Scolastica 53,
AT&T Phone. International Calling Rates for Phone International Plus, Phone 200 and Phone Unlimited North America
 AT&T Phone International Calling Rates for Phone International Plus, Phone 200 and Phone Unlimited North Rates do not include taxes, fees or surcharges. Call destinations and rates are subject to change.
Dimensionality Reduction and Visualization
 MTTTS17 Dimensionality Reduction and Visualization Spring 2018 Jaakko Peltonen Lecture 7: Nonlinear dimensionality reduction, part 2 Two measures of faithfulness - precision and recall Faithfully? Good
natural gas World Oil and Gas Review
 natural gas Reserves Production Reserves/Production Ratio Consumption Per Capita Consumption Production/Consumption Ratio Exports Imports Traded Gas LNG - Liquefaction and Regasification Capacity Natural
ICC Rev August 2010 Original: English. Agreement. International Coffee Council 105 th Session September 2010 London, England
 ICC 105-7 Rev. 1 31 August 2010 Original: English Agreement E International Coffee Council 105 th Session 21 24 September 2010 London, England Obstacles to consumption Background 1. In accordance with
Report by the Secretariat
 SIXTY-FIFTH WORLD HEALTH ASSEMBLY A65/30 Provisional agenda item 16.3 5 April 2012 Status of collection of assessed contributions, including Member States in arrears in the payment of their contributions
Yodekoo Business Pro Tariff (Including Quickstart Out Of Bundle)
") Yodekoo Business Pro Tariff (Including Quickstart Out Of Bundle) This is the full tariff for Business Pro and any out of bundle spend using Quickstart products. All prices shown are in GBP per minute and
Yodekoo Business Pro Tariff (Including Quickstart Out Of Bundle) This is the full tariff for Business Pro and any out of bundle spend using Quickstart products. All prices shown are in GBP per minute and
North-South Gap Mapping Assignment Country Classification / Statistical Analysis
 North-South Gap Mapping Assignment Country Classification / Statistical Analysis Due Date: (Total Value: 55 points) Name: Date: Learning Outcomes: By successfully completing this assignment, you will be
W o r l d O i l a n d G a s R e v i e w
 W o r l d O i l a n d G a s R e v i e w 2 0 0 8 Pro duction / Produzione In 2006 the world production of natural gas grew by 3.5%, reaching 2,929 billion cubic metres (bcm). In 2006, Russia was the leading
November 2014 CL 150/LIM 2 COUNCIL. Hundred and Fiftieth Session. Rome, 1-5 December 2014
 November 2014 CL 150/LIM 2 E COUNCIL Hundred and Fiftieth Session Rome, 1-5 December 2014 Status of Current Assessments and Arrears as at 24 November 2014 Executive Summary The document presents the Status
Hundred and Fifty-sixth Session. Rome, 3-7 November Status of Current Assessments and Arrears as at 30 June 2014
 September 2014 FC 156/INF/2 E FINANCE COMMITTEE Hundred and Fifty-sixth Session Rome, 3-7 November 2014 Status of Current Assessments and Arrears as at 30 June 2014 Queries on the substantive content of
Does Corruption Persist In Sub-Saharan Africa?
 Int Adv Econ Res (2009) 15:336 350 DOI 10.1007/s11294-009-9210-2 ORIGINAL PAPER Does Corruption Persist In Sub-Saharan Africa? Nicole Bissessar Published online: 12 June 2009 # International Atlantic Economic
Human resources: update
 Human resources: update Workforce data As at 31 July 2017 Document issued 04 October 2017 Index of tables The information is as of 31 July 2017 (unless otherwise stated) and does not include data from
 World OilReview 201 Contents List of Countries: Europe: Albania, Austria, Belarus, Belgium, Bosnia Herzegovina, Bulgaria, Croatia, Cyprus, Czech Republic, Denmark, Estonia, Finland, France, Germany,
COMMITTEE ON FISHERIES
 September 2017 COFI:AQ/IX/2017/SBD.12 E COMMITTEE ON FISHERIES SUB-COMMITTEE ON AQUACULTURE Ninth Session Rome, 24 27 October 2017 REGIONAL STATISTICAL ANALYSIS OF RESPONSES BY FAO MEMBERS, REGIONAL FISHERIES
MULTIPLE REGRESSION. part 1. Christopher Adolph. and. Department of Political Science. Center for Statistics and the Social Sciences
 CSSS/SOC/STAT 321 Case-Based Statistics I MULTIPLE REGRESSION part 1 Christopher Adolph Department of Political Science and Center for Statistics and the Social Sciences University of Washington, Seattle
Office of Budget & Planning 311 Thomas Boyd Hall Baton Rouge, LA Telephone 225/ Fax 225/
 Louisiana Acadia 25 19 4 2 0 0 Allen 8 7 1 0 0 0 Ascension 173 143 26 1 0 3 Assumption 14 12 2 0 0 0 Avoyelles 51 41 9 0 0 1 Beauregard 18 14 3 0 0 1 Bienville 5 0 4 0 1 0 Bossier 28 27 0 1 0 0 Caddo 95
COUNCIL. Hundred and Fifty-eighth Session. Rome, 4-8 December Status of Current Assessments and Arrears as at 27 November 2017
 November 2017 CL 158/LIM/2 E COUNCIL Hundred and Fifty-eighth Session Rome, 4-8 December 2017 Status of Current Assessments and Arrears as at 27 November 2017 Executive Summary The document presents the
Florida's Refugee Population Statistical Report
 Florida's Refugee Population Statistical Report October 1 st, 2008 September 30 th, 2009 And Federal Fiscal Year 2005-2009 Courtesy of the US Coast Guard Prepared By: Florida Department of Children & Families
COUNCIL. Hundred and Fifty-fifth Session. Rome, 5-9 December Status of Current Assessments and Arrears as at 29 November 2016.
 November 2016 CL 155/LIM/2 E COUNCIL Hundred and Fifty-fifth Session Rome, 5-9 December 2016 Status of Current Assessments and Arrears as at 29 November 2016 Executive Summary The document presents the
International and regional network status
 WORLD METEOROLOGICAL ORGANIZATION JOINT MEETING OF CBS EXPERT TEAM ON SURFACE-BASED REMOTELY- SENSED OBSERVATIONS (Second Session) AND CIMO EXPERT TEAM ON OPERATIONAL REMOTE SENSING (First Session) CBS/ET-SBRSO-2
Big Data at BBVA Research using BigQuery
 Big Data at BBVA Research using BigQuery Tomasa Rodrigo June 2017 Google Cloud Next Click here to modify the style of the master title Summary 01 What is GDELT and how BigQuery helps us to exploit it 02
Scaling Seed Kits Through Household Gardens
 Scaling Seed Kits Through Household Gardens SENEGAL WESTERN SAHARA LIBERIA PORTUGAL REPULIC OF IRELAND COTE D IVOIRE UNITED KINGDOM GHANA NETHERLANDS BELGIUM DENMARK SWITZ. TUNISIA CAMEROON CZECH REPUBLIC
Overview of past procurement of Solar Direct Drive (SDD) refrigeration systems and UNICEF SD support in Cold Chain
 refrigeration systems and UNICEF SD support in Cold Chain") Overview of past procurement of Solar Direct Drive (SDD) refrigeration systems and UNICEF SD support in Cold Chain 1 UNICEF Supply Does Make a Difference The overall objectives include: Shorten procurement
Overview of past procurement of Solar Direct Drive (SDD) refrigeration systems and UNICEF SD support in Cold Chain 1 UNICEF Supply Does Make a Difference The overall objectives include: Shorten procurement
Duke Visa Services Open Doors Report on International Educational Exchange Annual Census of International Students Fall 2017
 Duke Visa Services Open Doors Report on International Educational Exchange Annual Census of International Students Fall 2017 Basic Data Total Total Enrolled International Students (excluding OPT): 3415
ProxiWorld tariffs & zones 2016
 made sent Internet zones Afghanistan 0,91 0,99 2,27 2,89 0 0,1 0,62 0,62 12 3 Albania 0,7 0,91 1,65 2,27 0 0,1 0,62 0,62 12 2 Algeria 0,7 0,91 1,65 2,27 0 0,1 0,62 0,62 12 2 Andorra 0,7 0,91 1,65 2,27
Table of Contents. Alumni. Introduction
 Alumni Table of Contents Alumni Introduction Office of Alumni Relations and Annual Giving and Alumni Association All Active Alumni: by Preferred Degree Level and Preferred Degree College by Preferred Class
Annex 6. Variable Descriptions and Data
 Annex 6. Variable Descriptions and Data This section contains complete variable descriptions along with the original data used to produce the 2002 Environmental Sustainability Index. The variables are
Marketing Report: Traffic Demographics (Monthly Comprehensive)
") Marketing Report: Traffic Demographics (Monthly Comprehensive) 06/17/2015 Search Traffic Overview Traffic Sources Marketing KPI: Visitor Behavior Audience Geo Location Audience Demographics Performance
Marketing Report: Traffic Demographics (Monthly Comprehensive) 06/17/2015 Search Traffic Overview Traffic Sources Marketing KPI: Visitor Behavior Audience Geo Location Audience Demographics Performance
SuperPack -Light. Data Sources. SuperPack-Light is for sophisticated weather data users who require large volumes of high quality world
 SuperPack -Light Global Data Coverage SuperPack-Light is for sophisticated weather data users who require large volumes of high quality world wide data but who do not need the full-service provided under
LAND INFO Worldwide Mapping, LLC 1 of 5
 Topographic Map List Country Afghanistan 1653 R 1653 0 R 447 41 R 130 0 N 63 P Albania 16 R 110 0 R 36 0 R 12 0 N 2 P Algeria 0 R 143 P 0 R 372 0 N 52 P Andorra 0 R 1 Angola 4 R 192 P 0 N 48 P? Antigua
Chapter 8 - Appendixes
 Chapter 8 - Appendixes Appendix 8.. Individual Preferences for Growth, Environment, and Income Distribution Funds to be invested in projects that Funds to be invested in projects to Funds to be invested
Demography, Time and Space
 Demography, Time and Space Martin Bell The University of Queensland WD Borrie Lecture Australian Population Association 2014 Conference Hobart, Tasmania Wednesday December 3rd 2014 Professor WD (Mick)
Research Exercise 1: Instructions
 Research Exercise 1: Instructions Instructions: 1. Cross-national scatter plots of trade openness and economic performance. a. Create a scatter plot with some measure of trade openness on the x-axis and
READY TO SCRAP: HOW MANY VESSELS AT DEMOLITION VALUE?
 READY TO SCRAP: HOW MANY VESSELS AT DEMOLITION VALUE? August 206 VesselsValue Global number of vessels at demolition value At scrap value 7,27 6 Above scrap value,8 84 Number of vessels at demolition value
Swaziland Posts and Telecommunications Corporation (SPTC)---International Call Charges
---International Call Charges") Swaziland Posts and Telecommunications Corporation (SPTC)---International Call Charges INTERNATIONAL DIRECT (PER MINUTE) AND OPERATOR DIALLING (PER 3 MINUTES) CALL CHARGES Charge Letter Country Country
Swaziland Posts and Telecommunications Corporation (SPTC)---International Call Charges INTERNATIONAL DIRECT (PER MINUTE) AND OPERATOR DIALLING (PER 3 MINUTES) CALL CHARGES Charge Letter Country Country
Bahrain, Israel, Jordan, Kuwait, Saudi Arabia, United Arab Emirates, Azerbaijan, Iraq, Qatar and Sudan.
 Publication Date: 4 Dec 2012 Effective Date: 4 Dec 2012 Addendum 3 to the CRI Technical Report, (Version: 2012, Update 2) This document updates the Technical Report (Version: 2012, Update 2) and details
Nigerian Capital Importation QUARTER THREE 2016
 Nigerian Capital Importation QUARTER THREE 2016 _ November 2016 Capital Importation Data The data on Capital Importation used in this report was obtained from the Central Bank of Nigeria (CBN). The data
Radiation Protection Procedures
 S A F E T Y S E R IE S N o. 38 Radiation Protection Procedures IN T E R N A T IO N A L A T O M IC E N E R G Y A G E N C Y, V IEN N A, 1973 R A D I A T I O N P R O T E C T I O N P R O C E D U R E S The
Tables of Results 21
 Tables of Results 21 Tables of Results 23 2005 ICP Global Results: Summary Table Price GDP per GDP per capita Gross domestic Gross domestic level capita indices indices product per capita product, billions
Travel and Diabetes Survey
 Travel and Diabetes Survey [ ] = Check all that apply, ( ) = Choose one answer, * = Required answer Which of the following best describes you? Check all that apply.* [ ] A person with type 1 diabetes (T1D)
GEODATA AVAILABILITY. 50% off. Order RegioGraph by October 31, 2018 and save 50% on maps for an additional country of your choice!
 GEODATA AVAILABILITY You can use our geomarketing software RegioGraph to visualize and analyze your company data on digital maps. In just a few steps, you can extract insights from your data that would
USDA Dairy Import License Circular for 2018
 USDA Dairy Import License Circular for 2018 Commodity/Note Country Name TRQ Jan Feb Mar Apr May Jun Jul Aug Sep Oct Nov Grand Total Non-Cheese 21,864,781 624,064 651,121 432,669 901,074 1,202,567 907,493
CALLS FROM HOME RESIDENTIAL TARIFFS. Prices effective from 3rd February _03/02/09_Residential_Cable _Version 2
 CALLS FROM HOME RESIDENTIAL TARIFFS Prices effective from 3rd February 2009 002261_03/02/09_Residential_Cable _Version 2 Telephone charges Phone packages (including line rental) Package Price (per month)
Africa, Asia and the Pacific, Latin America and the Caribbean. Africa, Asia and the Pacific, Latin America and the Caribbean
 ANNEXE I (disponible en anglais) UNESCO/POLAND CO-SPONSORED FELLOWSHIPS PROGRAMME 2017 List of Invited Member States per region and field of research as determined by the Polish authorities Project (Number
Asia. JigsawGeo. Free Printable Maps for Geography Education. Try our geography games for the ipod Touch or iphone.
 Free Printable Maps for Geography Education Map with region names shown Map without names, for coloring or quizzes Map with coordinate system, for location practice Answer key for coordinate system quiz
MOCK EXAMINATION 1. Name Class Date INSTRUCTIONS
 Name Class Date PRIMARY 2 mathematics MOCK EXAMINATION 1 INSTRUCTIONS Total time for Section A, Section B and Section C: 1 hour 45 minutes The use of calculators is not allowed. SECTION A : Multiple Choice
Official Journal of the European Union L 312/19 COMMISSION
 9.10.2004 Official Journal of the European Union L 312/19 COMMISSION COMMISSION DECISION of 27 September 2004 amending Decision 2004/432/EC on the approval of residue monitoring plans submitted by third
Kernel Wt. 593,190,150 1,218,046,237 1,811,236, ,364, ,826, ,191, Crop Year
 Almond Industry Position Report JULY 2016 2015-2016 Crop Year Salable Forecast Million Lbs. 2015-2016 8/1-7/31 Kernel Wt. 2014-2015 8/1-7/31 Kernel Wt. % Change 1. Carryin August 1, 2015 2. Crop Receipts
2005 Environmental Sustainability Index Benchmarking National Environmental Stewardship. Appendix C Variable Profiles and Data
 2005 Environmental Sustainability Index Benchmarking National Environmental Stewardship Appendix C Variable Profiles and Data 253 This page is intentionally blank. 254 Appendix C: Variable Profiles and
Grand Total Baccalaureate Post-Baccalaureate Masters Doctorate Professional Post-Professional
 s by Location of Permanent Home Address and Degree Level Louisiana Acadia 26 19 0 6 1 0 0 0 0 Allen 7 7 0 0 0 0 0 0 0 Ascension 275 241 3 23 1 6 0 1 0 Assumption 13 12 0 1 0 0 0 0 0 Avoyelles 15 11 0 3
Controls on Exports of Green List Waste to non-oecd Countries an Update.
 Controls on Exports of Green List Waste to non-oecd Countries an Update. The current regulation (1418/2007/EC) providing control measures for the export of green list waste came into force on 29 November
Online APPENDIX. Further Results for: The Effects of the International Security Environment on National Military Expenditures: A Multi-Country Study
 Online APPENDIX Further Results for: The Effects of the International Security Environment on National Military Expenditures: A Multi-Country Study William Nordhaus*, John R. Oneal**, Bruce Russett***
International Student Achievement in Mathematics
 Chapter 1 International Student Achievement in Mathematics Chapter 1 contains the TIMSS 2007 achievement results for fourth and eighth grade students in mathematics for each of the participating countries
AP Human Geography Summer Assignment (2014)
") Name: Period AP Human Geography Summer Assignment (2014) Students enrolled in AP Human Geography are required to complete an assignment during the summer prior to the start of school. The assignment is
Name: Period AP Human Geography Summer Assignment (2014) Students enrolled in AP Human Geography are required to complete an assignment during the summer prior to the start of school. The assignment is
Bilateral Labour Agreements, 2004
 Guest Austria Canada Turkey ( 64) Canada, Czech Republic, Hungary ( 98), Belgium Italy ( 46, 54), Turkey ( 64) Bulgaria ( 99), Pol (02) Germany ( 91) Bulgaria ( 99), Mongolia ( 99), Pol ( 92), Russia (
USDA Dairy Import License Circular for 2018
 USDA Dairy Import License Circular for 2018 Commodity/Note Country Name TRQ Jan Feb Mar Apr May Jun Grand Total Non-Cheese 21,864,781 624,064 651,121 432,669 901,074 1,202,567 907,493 4,718,988 BUTTER
INTERNATIONAL TELECOMMUNICATION UNION SERIES T: TERMINALS FOR TELEMATIC SERVICES
 INTERNATIONAL TELECOMMUNICATION UNION TELECOMMUNICATION STANDARDIZATION SECTOR OF ITU T.35 (02/2000) SERIES T: TERMINALS FOR TELEMATIC SERVICES Procedure for the allocation of ITU-T defined codes for non-standard
1. Impacts of Natural Disasters by Region, 2008
 1. Impacts of Natural Disasters by Region, 2008 Among all regions across the world in 2008, Asia not only ranks first but also dominates in all natural disaster s impact categories occurrence, killed,