5. 추정 (Estimation) 2014/4/17
|
|
|
- Neal Howard
- 5 years ago
- Views:
Transcription
1 5. 추정 (Estimatio) 014/4/17
2 5.1 머리말 (Itoriductio) 통계적추측 (statistical iferece) 어느모집단으로부터구한표본에서얻어진결과를기초로그모집단에관해추측하는과정 Say somethig about the populatio based o the iformatio of the sample 1) 추정 (estimatio) ) 가설검정 (hypothesis testig)
3 추정치 (estimate) 1) 점추정 (poit estimate) ) 구간추정 (iterval estimate) 추정식 (estimator) 불편이성 (ubiasedess) x 3 Target populatio vs. samplig populatio x i 의추정식 ˆ( rv.. based o data) is a ubaised estimator of (parameter) if E( ˆ ) ex. E( X ), so sample mea is a ue of the populatio mea if the samples are radomly selected from N(, )
4 예 ) sample variace ( of So Es ( ) Bias = 1 E ( yi y) E( ˆ ) s ) is a ubiased estimator : ot a ubiased estimator Bias of a ubiased estimator is zero Probability samplig ad o-probability samplig Radomizatio Blidig
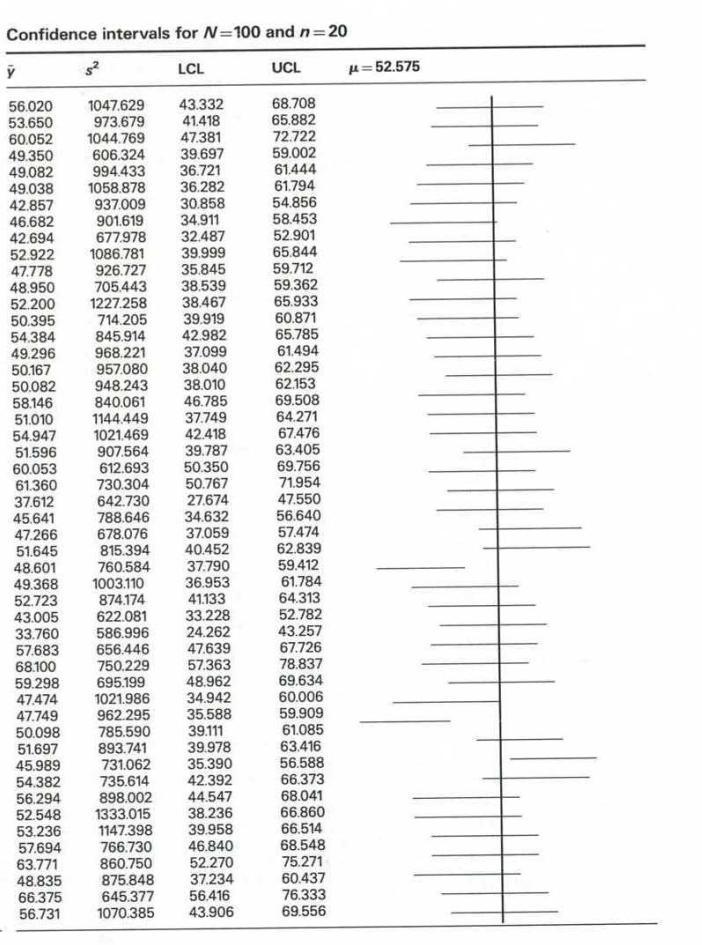
5 5. 모집단평균의신뢰구간 (Cofidece iterval of populatio mea) 신뢰구간 = 추정평균 ( 신뢰도계수) 표준오차 cof. it.=eatimated value (reliability coef) SE x z (1 ) x If we select samples repeatedly from ormal populatio, x z(1 ) x will iclude with the probability of 100(1- )% 1 :cofidece level (ex..95) 신뢰수준 :sigificace level (ex..05) 유의수준
6
7 < 보기 5..1> A researcher measures amout of a certai ezyme. =10, sample mea=, We ca assume ormality with pop variace= % C.I. of? 45 x x (17.76, 6.4) 100
8 < 보기 5..> Measurig maximum stregth of a certai muscle. We wat 99% CI of the pop mea. We assume ormality with pop variace=144. =15, sample mea=84.3, z=.58 with 0.99 cofidece level, SE= x What is the 99% C.I. of? (3.10) (76.3, 9.3)
9 Sample from o-ormal pop cetral limit theorem < 보기 5..3> delay time because of patiet s beig late at a cliic, =35, sample mea=17. mi, sd from the previous study (assumed to be kow)=8 mi. Pop is ot ormally dist ed. what is 90% CI of? 8/ x (1.35) , 19.4
10 < 보기 5..4> Measure activity of a certai ezyme from 35 patiets Populatio variace= 0.36, 95% CI? -> apply CLT (.6/ 35) (0.5174, )
11 CI calculatio usig R > m < > s <- sqrt(0.36) > <- 35 > alpha < > error <- qorm(1-alpha/)*s/sqrt() > left <- m-error > right <- m+error > left [1] > right [1] > cofit <- fuctio(m,s,,alpha=0.05){ error <- qorm(1-alpha/)*s/sqrt() left <- m-error right <- m+error prit(c(left,right)) } cofit(0.7164,sqrt(0.36),35) [1]
12 5.3 t- 분포 (t-dist ) Pop variace is kow ad is large: Pop variace is ot kow ad is large : Small sample size (<30) : derived by Gosset Studet s t-dist 표 E ( ) 1 i x x s 1 x t t s x z
13 Some properties of t-dist 1) mea= 0 ) Symmetric about the mea 3) Variace > 1, -> 1 as -> 4) t 5) The shape depeds o degrees-offreedom)=-1 x <- seq(-4, 4, legth=100) hx <- dorm(x) degf <- c(1, 3, 8, 30) colors <- c("red", "blue", "darkgree", "gold", "black") labels <- c("df=1", "df=3", "df=8", "df=30", "ormal") plot(x, hx, type="l", lty=, xlab="x value", ylab="desity", mai="compariso of t Distributios") for (i i 1:4){ lies(x, dt(x,degf[i]), lwd=, col=colors[i]) } leged("topright", iset=.05, title="distributios", labels, lwd=, lty=c(1, 1, 1, 1, ), col=colors)
14 6) Flatter at the ceter ad heavier tails tha ormal dist 7) t-dist -> ormal dist as -1 -> CI : x t (1 ) s
15 < 보기 5.3.1> =15, measure Amylase, sample mea=96uit/100ml, sd= 35, pop variace is ot kow. 95% CI of the pop mea? SE( x)= s df= 1 14 t (9.04) (77,115)
16 Choice of z ad t pop~ormal? eough? eough? σ kow? σ kow? σ kow? σ kow? applyig CLT No-parametric methods
17 5.4 CI of the differece of the two meas Samples from ormal pop s 1 x1 x z1 1 < 보기 5.4.1> Measure serum uric acid from 1 patiets x1 4.5 ml /100ml, measuremets from 15 ormal cotrols x 3.4, variaces are kow to be 1 for each group, 95% CI for 1-? ( ) (.39) (.3, 1.9) 1 15 CI does ot iclude 0
18 Sample from o-ormal pop cetral limit theorem < 보기 5.4.> To compare socio-ecoomic status (SES) of patiets from two hospitals. 75 pts from hospital A: x1 6,800, 80 pts from hospital B: x 4, 450, pop variaces are 1 99% CI of -? 1 600, 500, (600) (500) ( ).58 (10, 580) 75 80
19 t-dist ad differece of the meas: I practice, pop variace is typically ukow. Two approaches 1) Same variaces, ) Differet variaces 1) Whe the variaces are the same: we calculate pooled estimate by calculatig weighted average of the variaces s ( 1 1) s1 ( 1) s p 1
20 100(1 )% CI of 1 sp sp ( x1 x ) t(1 ) df= 1 1 < 보기 5.4.3> to measure Amylase: 15 ormal cotrols(group) sample mea=96, sd=35. pts(group1) sample mea ad sd=10 ad 40. pop ormal. Variaces ukow but equal. 100(1 )% CI of? s p 1 14(35) 1(40) (10 96) ,50 15
21 ) Whe the variaces are differet ( x x ) ( ) s s 1 does ot follow t-dist! w1 t1 wt t ' 1 w1 w ( x1 x ) t '(1 ) s 1 s * w s, w s, df 1 t t, df 1 t t
22 < 보기 5.4.3> To measure some biomarker. We ca assume ormal dist. But variaces are ot the same. 95% CI of? 1 Pts ormal t 9 t (.6) (.0930) t ' ( ).55 ( 9., 40.0) 10 0
23 pop~ormal? σ kow? applyig CLT No-parametric methods
24 숙제
25 5.5 모집단비율의신뢰구간 (CI of proportio) 100(1 -)% CI of p? p z(1 ) p(1 p) < 보기 5.5.1> behavior of oral hygiee. 13 take oral exams per year out of % CI of p? p 13/ (0.59) / ,.46
26 5.6 두모집단비율의차이의신뢰구간 CI of differece of two proportios 100(1 - )% CI of p1-p? < 보기 5.6.1> p1 (1 p1 ) p(1 p) p1 p z(1 ) 1 Recovery times of a disease by two treatmets Assig 00 pts radomly to two trt groups. Trt A: 78pts recovered withi 3days, trt B 90 pts. 95% CI of p1-p? (.78)(.) (.90)(.10) (.78.90) 1.96 (.,.0)
27 5.7 평균을추정할때의표본수의결정 sample size calculatio: iferece of the mea (width of the CI)/, Samplig from a ifiite pop d ( reliability coef ) (SE) Samplig without replacemet from a small pop d z N N 1 d (reliability coef) (SE) z Nz d ( N 1) z z d
28 < 보기 5.7.1> measure daily protei itake from teeage girls. Width of CI=10 (+-5). Cofidece level= 0.95, pop sd=0, pop is very large; we ca igore fiite pop correctio factor z1.96, 0, d 5 z (1.96) (0) girls d (5)
29 5.8 비율을추정할때표본수의결정 sample size calculatio: iferece of the proportio < 보기 5.8.1> z pq d surveyig proportio of household with medical service. We kow p<0.35. d of 95% CI =0.05, =? Nz pq d ( N 1) z pq ( N 0.05) (1.96) (.35)(.65) households (.05)
30 숙제
31 5.9 정규분포모집단분산의신뢰구간 CI of the variace from ormal dist Poit estimator of variace Good estimator? ubiasedess Es ( )?
32 Pop=(6,8,10,1,14), = (exam at chap4) S ( xi ) N ( xi ) N w replacemet- w/o replacemet- si 0 0 Es ( ) 8 N 5 si 8 S N E( s ) 10 10
33 large N N N 1 E( s ) S ( 1) s CI of o the dis' of depeds = (x i-x) /. (chi-square distributio) i=1 ( 1) s 1 표 F
34 100(1 )% CI of? / (1 / ) ( 1) s ( 1) s 100(1 )% CI of ( 1) s ( 1) s (1 / ) / 100(1 )% CI of
35 < 보기 5.9.1> =15, measure Amylase, x 96, s35, 95% CI of? s 15, df 114 (14)(15) (14)(15)
36 5.10 두정규분포모집단의분산비에대한신뢰구간 CI for the ratio of two variaces 1 1 s s F 1, 1 1 표 G
37 1 100(1 )% CI of? s / (1 / ), s s F F s s s F F (1 / ) / < 보기 > ormal adults, =1(group1). Parkiso disease pts, =16명 (group). Observe respose time of a certai stimulus. Sample variace of grp1=1600,grp=15. 95% CI of? F.975 F s s s s,,
38 Statistical distributios : sum of idepedet ormal rv s 1,,, N(, ) Y Y Y radom sample from iid, Y N 1 1 ( 1) i i Y Y s 0,1 / Y N 1 / Y t s 1 (0,1) i i i Y Y N /, 1 1 /, 1 ( 1) 1 s P
39 : ratio of idepedet chi-squares (df= 1, ) F 1, 1 / / 1 F, 1 s s 1 / 1 / F 1, 1 1 PF 1 s1 / F 1 / s 1
40 Homework 종합문제
Chapter 6 Sampling Distributions
 Chapter 6 Samplig Distributios 1 I most experimets, we have more tha oe measuremet for ay give variable, each measuremet beig associated with oe radomly selected a member of a populatio. Hece we eed to
7-1. Chapter 4. Part I. Sampling Distributions and Confidence Intervals
 7-1 Chapter 4 Part I. Samplig Distributios ad Cofidece Itervals 1 7- Sectio 1. Samplig Distributio 7-3 Usig Statistics Statistical Iferece: Predict ad forecast values of populatio parameters... Test hypotheses
Class 23. Daniel B. Rowe, Ph.D. Department of Mathematics, Statistics, and Computer Science. Marquette University MATH 1700
 Class 23 Daiel B. Rowe, Ph.D. Departmet of Mathematics, Statistics, ad Computer Sciece Copyright 2017 by D.B. Rowe 1 Ageda: Recap Chapter 9.1 Lecture Chapter 9.2 Review Exam 6 Problem Solvig Sessio. 2
MBACATÓLICA. Quantitative Methods. Faculdade de Ciências Económicas e Empresariais UNIVERSIDADE CATÓLICA PORTUGUESA 9. SAMPLING DISTRIBUTIONS
 MBACATÓLICA Quatitative Methods Miguel Gouveia Mauel Leite Moteiro Faculdade de Ciêcias Ecoómicas e Empresariais UNIVERSIDADE CATÓLICA PORTUGUESA 9. SAMPLING DISTRIBUTIONS MBACatólica 006/07 Métodos Quatitativos
Computing Confidence Intervals for Sample Data
 Computig Cofidece Itervals for Sample Data Topics Use of Statistics Sources of errors Accuracy, precisio, resolutio A mathematical model of errors Cofidece itervals For meas For variaces For proportios
z is the upper tail critical value from the normal distribution
 Statistical Iferece drawig coclusios about a populatio parameter, based o a sample estimate. Populatio: GRE results for a ew eam format o the quatitative sectio Sample: =30 test scores Populatio Samplig
Common Large/Small Sample Tests 1/55
 Commo Large/Small Sample Tests 1/55 Test of Hypothesis for the Mea (σ Kow) Covert sample result ( x) to a z value Hypothesis Tests for µ Cosider the test H :μ = μ H 1 :μ > μ σ Kow (Assume the populatio
Statistical Inference (Chapter 10) Statistical inference = learn about a population based on the information provided by a sample.
 Statistical inference = learn about a population based on the information provided by a sample.") Statistical Iferece (Chapter 10) Statistical iferece = lear about a populatio based o the iformatio provided by a sample. Populatio: The set of all values of a radom variable X of iterest. Characterized
Statistical Iferece (Chapter 10) Statistical iferece = lear about a populatio based o the iformatio provided by a sample. Populatio: The set of all values of a radom variable X of iterest. Characterized
Interval Estimation (Confidence Interval = C.I.): An interval estimate of some population parameter is an interval of the form (, ),
: An interval estimate of some population parameter is an interval of the form (, ),") Cofidece Iterval Estimatio Problems Suppose we have a populatio with some ukow parameter(s). Example: Normal(,) ad are parameters. We eed to draw coclusios (make ifereces) about the ukow parameters. We
Cofidece Iterval Estimatio Problems Suppose we have a populatio with some ukow parameter(s). Example: Normal(,) ad are parameters. We eed to draw coclusios (make ifereces) about the ukow parameters. We
Statistics Lecture 27. Final review. Administrative Notes. Outline. Experiments. Sampling and Surveys. Administrative Notes
 Admiistrative Notes s - Lecture 7 Fial review Fial Exam is Tuesday, May 0th (3-5pm Covers Chapters -8 ad 0 i textbook Brig ID cards to fial! Allowed: Calculators, double-sided 8.5 x cheat sheet Exam Rooms:
Lecture 5: Parametric Hypothesis Testing: Comparing Means. GENOME 560, Spring 2016 Doug Fowler, GS
 Lecture 5: Parametric Hypothesis Testig: Comparig Meas GENOME 560, Sprig 2016 Doug Fowler, GS (dfowler@uw.edu) 1 Review from last week What is a cofidece iterval? 2 Review from last week What is a cofidece
Inferential Statistics. Inference Process. Inferential Statistics and Probability a Holistic Approach. Inference Process.
 Iferetial Statistics ad Probability a Holistic Approach Iferece Process Chapter 8 Poit Estimatio ad Cofidece Itervals This Course Material by Maurice Geraghty is licesed uder a Creative Commos Attributio-ShareAlike
BIOS 4110: Introduction to Biostatistics. Breheny. Lab #9
 BIOS 4110: Itroductio to Biostatistics Brehey Lab #9 The Cetral Limit Theorem is very importat i the realm of statistics, ad today's lab will explore the applicatio of it i both categorical ad cotiuous
Lecture 5. Materials Covered: Chapter 6 Suggested Exercises: 6.7, 6.9, 6.17, 6.20, 6.21, 6.41, 6.49, 6.52, 6.53, 6.62, 6.63.
 STT 315, Summer 006 Lecture 5 Materials Covered: Chapter 6 Suggested Exercises: 67, 69, 617, 60, 61, 641, 649, 65, 653, 66, 663 1 Defiitios Cofidece Iterval: A cofidece iterval is a iterval believed to
Mathacle. PSet Stats, Concepts In Statistics Level Number Name: Date:
 PSet ----- Stats, Cocepts I Statistics 7.3. Cofidece Iterval for a Mea i Oe Sample [MATH] The Cetral Limit Theorem. Let...,,, be idepedet, idetically distributed (i.i.d.) radom variables havig mea µ ad
Working with Two Populations. Comparing Two Means
 Workig with Two Populatios Comparig Two Meas Coditios for Two-Sample Iferece The data are from two radom samples from two distict idepedet populatios. Normality. Two sample t procedures are more robust
STA Learning Objectives. Population Proportions. Module 10 Comparing Two Proportions. Upon completing this module, you should be able to:
 STA 2023 Module 10 Comparig Two Proportios Learig Objectives Upo completig this module, you should be able to: 1. Perform large-sample ifereces (hypothesis test ad cofidece itervals) to compare two populatio
October 25, 2018 BIM 105 Probability and Statistics for Biomedical Engineers 1
 October 25, 2018 BIM 105 Probability ad Statistics for Biomedical Egieers 1 Populatio parameters ad Sample Statistics October 25, 2018 BIM 105 Probability ad Statistics for Biomedical Egieers 2 Ifereces
Stat 200 -Testing Summary Page 1
 Stat 00 -Testig Summary Page 1 Mathematicias are like Frechme; whatever you say to them, they traslate it ito their ow laguage ad forthwith it is somethig etirely differet Goethe 1 Large Sample Cofidece
Chapter 7 Student Lecture Notes 7-1
 Chapter 7 Studet Lecture otes 7-1 Basic Busiess Statistics (9 th Editio) Chapter 7 Samplig Distributios 24 Pretice-Hall, Ic. Chap 7-1 Chapter Topics Samplig Distributio of the Mea The Cetral Limit Theorem
BIOSTATISTICS. Lecture 5 Interval Estimations for Mean and Proportion. dr. Petr Nazarov
 Microarray Ceter BIOSTATISTICS Lecture 5 Iterval Estimatios for Mea ad Proportio dr. Petr Nazarov 15-03-013 petr.azarov@crp-sate.lu Lecture 5. Iterval estimatio for mea ad proportio OUTLINE Iterval estimatios
(7 One- and Two-Sample Estimation Problem )
") 34 Stat Lecture Notes (7 Oe- ad Two-Sample Estimatio Problem ) ( Book*: Chapter 8,pg65) Probability& Statistics for Egieers & Scietists By Walpole, Myers, Myers, Ye Estimatio 1 ) ( ˆ S P i i Poit estimate:
34 Stat Lecture Notes (7 Oe- ad Two-Sample Estimatio Problem ) ( Book*: Chapter 8,pg65) Probability& Statistics for Egieers & Scietists By Walpole, Myers, Myers, Ye Estimatio 1 ) ( ˆ S P i i Poit estimate:
Final Review. Fall 2013 Prof. Yao Xie, H. Milton Stewart School of Industrial Systems & Engineering Georgia Tech
 Fial Review Fall 2013 Prof. Yao Xie, yao.xie@isye.gatech.edu H. Milto Stewart School of Idustrial Systems & Egieerig Georgia Tech 1 Radom samplig model radom samples populatio radom samples: x 1,..., x
Class 27. Daniel B. Rowe, Ph.D. Department of Mathematics, Statistics, and Computer Science. Marquette University MATH 1700
 Class 7 Daiel B. Rowe, Ph.D. Departmet of Mathematics, Statistics, ad Computer Sciece Copyright 013 by D.B. Rowe 1 Ageda: Skip Recap Chapter 10.5 ad 10.6 Lecture Chapter 11.1-11. Review Chapters 9 ad 10
Statistics 20: Final Exam Solutions Summer Session 2007
 1. 20 poits Testig for Diabetes. Statistics 20: Fial Exam Solutios Summer Sessio 2007 (a) 3 poits Give estimates for the sesitivity of Test I ad of Test II. Solutio: 156 patiets out of total 223 patiets
2 1. The r.s., of size n2, from population 2 will be. 2 and 2. 2) The two populations are independent. This implies that all of the n1 n2
 The two populations are independent. This implies that all of the n1 n2") Chapter 8 Comparig Two Treatmets Iferece about Two Populatio Meas We wat to compare the meas of two populatios to see whether they differ. There are two situatios to cosider, as show i the followig examples:
Chapter 8 Comparig Two Treatmets Iferece about Two Populatio Meas We wat to compare the meas of two populatios to see whether they differ. There are two situatios to cosider, as show i the followig examples:
Chapters 5 and 13: REGRESSION AND CORRELATION. Univariate data: x, Bivariate data (x,y).
.") Chapters 5 ad 13: REGREION AND CORRELATION (ectios 5.5 ad 13.5 are omitted) Uivariate data: x, Bivariate data (x,y). Example: x: umber of years studets studied paish y: score o a proficiecy test For each
Chapters 5 ad 13: REGREION AND CORRELATION (ectios 5.5 ad 13.5 are omitted) Uivariate data: x, Bivariate data (x,y). Example: x: umber of years studets studied paish y: score o a proficiecy test For each
Confidence Level We want to estimate the true mean of a random variable X economically and with confidence.
 Cofidece Iterval 700 Samples Sample Mea 03 Cofidece Level 095 Margi of Error 0037 We wat to estimate the true mea of a radom variable X ecoomically ad with cofidece True Mea μ from the Etire Populatio
MATH 320: Probability and Statistics 9. Estimation and Testing of Parameters. Readings: Pruim, Chapter 4
 MATH 30: Probability ad Statistics 9. Estimatio ad Testig of Parameters Estimatio ad Testig of Parameters We have bee dealig situatios i which we have full kowledge of the distributio of a radom variable.
TABLES AND FORMULAS FOR MOORE Basic Practice of Statistics
 TABLES AND FORMULAS FOR MOORE Basic Practice of Statistics Explorig Data: Distributios Look for overall patter (shape, ceter, spread) ad deviatios (outliers). Mea (use a calculator): x = x 1 + x 2 + +
- E < p. ˆ p q ˆ E = q ˆ = 1 - p ˆ = sample proportion of x failures in a sample size of n. where. x n sample proportion. population proportion
 1 Chapter 7 ad 8 Review for Exam Chapter 7 Estimates ad Sample Sizes 2 Defiitio Cofidece Iterval (or Iterval Estimate) a rage (or a iterval) of values used to estimate the true value of the populatio parameter
UNIT 8: INTRODUCTION TO INTERVAL ESTIMATION
 STATISTICAL METHODS FOR BUSINESS UNIT 8: INTRODUCTION TO INTERVAL ESTIMATION 8..- Itroductio to iterval estimatio 8..- Cofidece itervals. Costructio ad characteristics 8.3.- Cofidece itervals for the mea
Chapter 22. Comparing Two Proportions. Copyright 2010 Pearson Education, Inc.
 Chapter 22 Comparig Two Proportios Copyright 2010 Pearso Educatio, Ic. Comparig Two Proportios Comparisos betwee two percetages are much more commo tha questios about isolated percetages. Ad they are more
Comparing Two Populations. Topic 15 - Two Sample Inference I. Comparing Two Means. Comparing Two Pop Means. Background Reading
 Topic 15 - Two Sample Iferece I STAT 511 Professor Bruce Craig Comparig Two Populatios Research ofte ivolves the compariso of two or more samples from differet populatios Graphical summaries provide visual
Sampling Error. Chapter 6 Student Lecture Notes 6-1. Business Statistics: A Decision-Making Approach, 6e. Chapter Goals
 Chapter 6 Studet Lecture Notes 6-1 Busiess Statistics: A Decisio-Makig Approach 6 th Editio Chapter 6 Itroductio to Samplig Distributios Chap 6-1 Chapter Goals After completig this chapter, you should
Agreement of CI and HT. Lecture 13 - Tests of Proportions. Example - Waiting Times
 Sigificace level vs. cofidece level Agreemet of CI ad HT Lecture 13 - Tests of Proportios Sta102 / BME102 Coli Rudel October 15, 2014 Cofidece itervals ad hypothesis tests (almost) always agree, as log
Statistical inference: example 1. Inferential Statistics
 Statistical iferece: example 1 Iferetial Statistics POPULATION SAMPLE A clothig store chai regularly buys from a supplier large quatities of a certai piece of clothig. Each item ca be classified either
Agenda: Recap. Lecture. Chapter 12. Homework. Chapt 12 #1, 2, 3 SAS Problems 3 & 4 by hand. Marquette University MATH 4740/MSCS 5740
 Ageda: Recap. Lecture. Chapter Homework. Chapt #,, 3 SAS Problems 3 & 4 by had. Copyright 06 by D.B. Rowe Recap. 6: Statistical Iferece: Procedures for μ -μ 6. Statistical Iferece Cocerig μ -μ Recall yes
Section 9.2. Tests About a Population Proportion 12/17/2014. Carrying Out a Significance Test H A N T. Parameters & Hypothesis
 Sectio 9.2 Tests About a Populatio Proportio P H A N T O M S Parameters Hypothesis Assess Coditios Name the Test Test Statistic (Calculate) Obtai P value Make a decisio State coclusio Sectio 9.2 Tests
MATH/STAT 352: Lecture 15
 MATH/STAT 352: Lecture 15 Sectios 5.2 ad 5.3. Large sample CI for a proportio ad small sample CI for a mea. 1 5.2: Cofidece Iterval for a Proportio Estimatig proportio of successes i a biomial experimet
MidtermII Review. Sta Fall Office Hours Wednesday 12:30-2:30pm Watch linear regression videos before lab on Thursday
 Aoucemets MidtermII Review Sta 101 - Fall 2016 Duke Uiversity, Departmet of Statistical Sciece Office Hours Wedesday 12:30-2:30pm Watch liear regressio videos before lab o Thursday Dr. Abrahamse Slides
Chapter 20. Comparing Two Proportions. BPS - 5th Ed. Chapter 20 1
 Chapter 0 Comparig Two Proportios BPS - 5th Ed. Chapter 0 Case Study Machie Reliability A study is performed to test of the reliability of products produced by two machies. Machie A produced 8 defective
Direction: This test is worth 150 points. You are required to complete this test within 55 minutes.
 Term Test 3 (Part A) November 1, 004 Name Math 6 Studet Number Directio: This test is worth 10 poits. You are required to complete this test withi miutes. I order to receive full credit, aswer each problem
Hypothesis Testing. Evaluation of Performance of Learned h. Issues. Trade-off Between Bias and Variance
 Hypothesis Testig Empirically evaluatig accuracy of hypotheses: importat activity i ML. Three questios: Give observed accuracy over a sample set, how well does this estimate apply over additioal samples?
Parameter, Statistic and Random Samples
 Parameter, Statistic ad Radom Samples A parameter is a umber that describes the populatio. It is a fixed umber, but i practice we do ot kow its value. A statistic is a fuctio of the sample data, i.e.,
Chapter 22. Comparing Two Proportions. Copyright 2010, 2007, 2004 Pearson Education, Inc.
 Chapter 22 Comparig Two Proportios Copyright 2010, 2007, 2004 Pearso Educatio, Ic. Comparig Two Proportios Read the first two paragraphs of pg 504. Comparisos betwee two percetages are much more commo
(6) Fundamental Sampling Distribution and Data Discription
 Fundamental Sampling Distribution and Data Discription") 34 Stat Lecture Notes (6) Fudametal Samplig Distributio ad Data Discriptio ( Book*: Chapter 8,pg5) Probability& Statistics for Egieers & Scietists By Walpole, Myers, Myers, Ye 8.1 Radom Samplig: Populatio:
34 Stat Lecture Notes (6) Fudametal Samplig Distributio ad Data Discriptio ( Book*: Chapter 8,pg5) Probability& Statistics for Egieers & Scietists By Walpole, Myers, Myers, Ye 8.1 Radom Samplig: Populatio:
TABLES AND FORMULAS FOR MOORE Basic Practice of Statistics
 TABLES AND FORMULAS FOR MOORE Basic Practice of Statistics Explorig Data: Distributios Look for overall patter (shape, ceter, spread) ad deviatios (outliers). Mea (use a calculator): x = x 1 + x 2 + +
Chapter 13: Tests of Hypothesis Section 13.1 Introduction
 Chapter 13: Tests of Hypothesis Sectio 13.1 Itroductio RECAP: Chapter 1 discussed the Likelihood Ratio Method as a geeral approach to fid good test procedures. Testig for the Normal Mea Example, discussed
Discrete Mathematics for CS Spring 2008 David Wagner Note 22
 CS 70 Discrete Mathematics for CS Sprig 2008 David Wager Note 22 I.I.D. Radom Variables Estimatig the bias of a coi Questio: We wat to estimate the proportio p of Democrats i the US populatio, by takig
Announcements. Unit 5: Inference for Categorical Data Lecture 1: Inference for a single proportion
 Housekeepig Aoucemets Uit 5: Iferece for Categorical Data Lecture 1: Iferece for a sigle proportio Statistics 101 Mie Çetikaya-Rudel PA 4 due Friday at 5pm (exteded) PS 6 due Thursday, Oct 30 October 23,
Expectation and Variance of a random variable
 Chapter 11 Expectatio ad Variace of a radom variable The aim of this lecture is to defie ad itroduce mathematical Expectatio ad variace of a fuctio of discrete & cotiuous radom variables ad the distributio
1 Inferential Methods for Correlation and Regression Analysis
 1 Iferetial Methods for Correlatio ad Regressio Aalysis I the chapter o Correlatio ad Regressio Aalysis tools for describig bivariate cotiuous data were itroduced. The sample Pearso Correlatio Coefficiet
April 18, 2017 CONFIDENCE INTERVALS AND HYPOTHESIS TESTING, UNDERGRADUATE MATH 526 STYLE
 April 18, 2017 CONFIDENCE INTERVALS AND HYPOTHESIS TESTING, UNDERGRADUATE MATH 526 STYLE TERRY SOO Abstract These otes are adapted from whe I taught Math 526 ad meat to give a quick itroductio to cofidece
MOST PEOPLE WOULD RATHER LIVE WITH A PROBLEM THEY CAN'T SOLVE, THAN ACCEPT A SOLUTION THEY CAN'T UNDERSTAND.
 XI-1 (1074) MOST PEOPLE WOULD RATHER LIVE WITH A PROBLEM THEY CAN'T SOLVE, THAN ACCEPT A SOLUTION THEY CAN'T UNDERSTAND. R. E. D. WOOLSEY AND H. S. SWANSON XI-2 (1075) STATISTICAL DECISION MAKING Advaced
Topic 9: Sampling Distributions of Estimators
 Topic 9: Samplig Distributios of Estimators Course 003, 2018 Page 0 Samplig distributios of estimators Sice our estimators are statistics (particular fuctios of radom variables), their distributio ca be
CHAPTER 8 FUNDAMENTAL SAMPLING DISTRIBUTIONS AND DATA DESCRIPTIONS. 8.1 Random Sampling. 8.2 Some Important Statistics
 CHAPTER 8 FUNDAMENTAL SAMPLING DISTRIBUTIONS AND DATA DESCRIPTIONS 8.1 Radom Samplig The basic idea of the statistical iferece is that we are allowed to draw ifereces or coclusios about a populatio based
Sampling Distributions, Z-Tests, Power
 Samplig Distributios, Z-Tests, Power We draw ifereces about populatio parameters from sample statistics Sample proportio approximates populatio proportio Sample mea approximates populatio mea Sample variace
Rule of probability. Let A and B be two events (sets of elementary events). 11. If P (AB) = P (A)P (B), then A and B are independent.
. 11. If P (AB) = P (A)P (B), then A and B are independent.") Percetile: the αth percetile of a populatio is the value x 0, such that P (X x 0 ) α% For example the 5th is the x 0, such that P (X x 0 ) 5% 05 Rule of probability Let A ad B be two evets (sets of elemetary
Percetile: the αth percetile of a populatio is the value x 0, such that P (X x 0 ) α% For example the 5th is the x 0, such that P (X x 0 ) 5% 05 Rule of probability Let A ad B be two evets (sets of elemetary
Read through these prior to coming to the test and follow them when you take your test.
 Math 143 Sprig 2012 Test 2 Iformatio 1 Test 2 will be give i class o Thursday April 5. Material Covered The test is cummulative, but will emphasize the recet material (Chapters 6 8, 10 11, ad Sectios 12.1
Econ 325 Notes on Point Estimator and Confidence Interval 1 By Hiro Kasahara
 Poit Estimator Eco 325 Notes o Poit Estimator ad Cofidece Iterval 1 By Hiro Kasahara Parameter, Estimator, ad Estimate The ormal probability desity fuctio is fully characterized by two costats: populatio
Sampling, Sampling Distribution and Normality
 4/17/11 Tools of Busiess Statistics Samplig, Samplig Distributio ad ormality Preseted by: Mahedra Adhi ugroho, M.Sc Descriptive statistics Collectig, presetig, ad describig data Iferetial statistics Drawig
Chapter 1 (Definitions)
") FINAL EXAM REVIEW Chapter 1 (Defiitios) Qualitative: Nomial: Ordial: Quatitative: Ordial: Iterval: Ratio: Observatioal Study: Desiged Experimet: Samplig: Cluster: Stratified: Systematic: Coveiece: Simple
FINAL EXAM REVIEW Chapter 1 (Defiitios) Qualitative: Nomial: Ordial: Quatitative: Ordial: Iterval: Ratio: Observatioal Study: Desiged Experimet: Samplig: Cluster: Stratified: Systematic: Coveiece: Simple
STATS 200: Introduction to Statistical Inference. Lecture 1: Course introduction and polling
 STATS 200: Itroductio to Statistical Iferece Lecture 1: Course itroductio ad pollig U.S. presidetial electio projectios by state (Source: fivethirtyeight.com, 25 September 2016) Pollig Let s try to uderstad
Module 1 Fundamentals in statistics
 Normal Distributio Repeated observatios that differ because of experimetal error ofte vary about some cetral value i a roughly symmetrical distributio i which small deviatios occur much more frequetly
Samples from Normal Populations with Known Variances
 Samples from Normal Populatios with Kow Variaces If the populatio variaces are kow to be σ 2 1 adσ2, the the 2 two-sided cofidece iterval for the differece of the populatio meas µ 1 µ 2 with cofidece level
A quick activity - Central Limit Theorem and Proportions. Lecture 21: Testing Proportions. Results from the GSS. Statistics and the General Population
 A quick activity - Cetral Limit Theorem ad Proportios Lecture 21: Testig Proportios Statistics 10 Coli Rudel Flip a coi 30 times this is goig to get loud! Record the umber of heads you obtaied ad calculate
Chapter 8: Estimating with Confidence
 Chapter 8: Estimatig with Cofidece Sectio 8.2 The Practice of Statistics, 4 th editio For AP* STARNES, YATES, MOORE Chapter 8 Estimatig with Cofidece 8.1 Cofidece Itervals: The Basics 8.2 8.3 Estimatig
If, for instance, we were required to test whether the population mean μ could be equal to a certain value μ
 STATISTICAL INFERENCE INTRODUCTION Statistical iferece is that brach of Statistics i which oe typically makes a statemet about a populatio based upo the results of a sample. I oesample testig, we essetially
Topic 9: Sampling Distributions of Estimators
 Topic 9: Samplig Distributios of Estimators Course 003, 2016 Page 0 Samplig distributios of estimators Sice our estimators are statistics (particular fuctios of radom variables), their distributio ca be
Topic 10: Introduction to Estimation
 Topic 0: Itroductio to Estimatio Jue, 0 Itroductio I the simplest possible terms, the goal of estimatio theory is to aswer the questio: What is that umber? What is the legth, the reactio rate, the fractio
STATISTICAL INFERENCE
 STATISTICAL INFERENCE POPULATION AND SAMPLE Populatio = all elemets of iterest Characterized by a distributio F with some parameter θ Sample = the data X 1,..., X, selected subset of the populatio = sample
Introduction to Econometrics (3 rd Updated Edition) Solutions to Odd- Numbered End- of- Chapter Exercises: Chapter 3
 Solutions to Odd- Numbered End- of- Chapter Exercises: Chapter 3") Itroductio to Ecoometrics (3 rd Updated Editio) by James H. Stock ad Mark W. Watso Solutios to Odd- Numbered Ed- of- Chapter Exercises: Chapter 3 (This versio August 17, 014) 015 Pearso Educatio, Ic. Stock/Watso
Itroductio to Ecoometrics (3 rd Updated Editio) by James H. Stock ad Mark W. Watso Solutios to Odd- Numbered Ed- of- Chapter Exercises: Chapter 3 (This versio August 17, 014) 015 Pearso Educatio, Ic. Stock/Watso
STAT431 Review. X = n. n )
") STAT43 Review I. Results related to ormal distributio Expected value ad variace. (a) E(aXbY) = aex bey, Var(aXbY) = a VarX b VarY provided X ad Y are idepedet. Normal distributios: (a) Z N(, ) (b) X N(µ,
STAT43 Review I. Results related to ormal distributio Expected value ad variace. (a) E(aXbY) = aex bey, Var(aXbY) = a VarX b VarY provided X ad Y are idepedet. Normal distributios: (a) Z N(, ) (b) X N(µ,
Sample Size Determination (Two or More Samples)
") Sample Sie Determiatio (Two or More Samples) STATGRAPHICS Rev. 963 Summary... Data Iput... Aalysis Summary... 5 Power Curve... 5 Calculatios... 6 Summary This procedure determies a suitable sample sie
Sample Sie Determiatio (Two or More Samples) STATGRAPHICS Rev. 963 Summary... Data Iput... Aalysis Summary... 5 Power Curve... 5 Calculatios... 6 Summary This procedure determies a suitable sample sie
Lecture 7: Non-parametric Comparison of Location. GENOME 560, Spring 2016 Doug Fowler, GS
 Lecture 7: No-parametric Compariso of Locatio GENOME 560, Sprig 2016 Doug Fowler, GS (dfowler@uw.edu) 1 Review How ca we set a cofidece iterval o a proportio? 2 Review How ca we set a cofidece iterval
STAC51: Categorical data Analysis
 STAC51: Categorical data Aalysis Mahida Samarakoo Jauary 28, 2016 Mahida Samarakoo STAC51: Categorical data Aalysis 1 / 35 Table of cotets Iferece for Proportios 1 Iferece for Proportios Mahida Samarakoo
Class 27. Daniel B. Rowe, Ph.D. Department of Mathematics, Statistics, and Computer Science. Marquette University MATH 1700
 Marquette Uiversity MATH 700 Class 7 Daiel B. Rowe, Ph.D. Departmet of Mathematics, Statistics, a Computer Sciece Copyright 07 by D.B. Rowe Marquette Uiversity MATH 700 Agea: Recap Chapter 0.-0.3 Lecture
Stat 421-SP2012 Interval Estimation Section
 Stat 41-SP01 Iterval Estimatio Sectio 11.1-11. We ow uderstad (Chapter 10) how to fid poit estimators of a ukow parameter. o However, a poit estimate does ot provide ay iformatio about the ucertaity (possible
Simple Random Sampling!
 Simple Radom Samplig! Professor Ro Fricker! Naval Postgraduate School! Moterey, Califoria! Readig:! 3/26/13 Scheaffer et al. chapter 4! 1 Goals for this Lecture! Defie simple radom samplig (SRS) ad discuss
Chapter two: Hypothesis testing
 : Hypothesis testig - Some basic cocepts: - Data: The raw material of statistics is data. For our purposes we may defie data as umbers. The two kids of umbers that we use i statistics are umbers that result
Hypothesis tests and confidence intervals
 Hypothesis tests ad cofidece itervals The 95% cofidece iterval for µ is the set of values, µ 0, such that the ull hypothesis H 0 : µ = µ 0 would ot be rejected by a two-sided test with α = 5%. The 95%
Recall the study where we estimated the difference between mean systolic blood pressure levels of users of oral contraceptives and non-users, x - y.
 Testig Statistical Hypotheses Recall the study where we estimated the differece betwee mea systolic blood pressure levels of users of oral cotraceptives ad o-users, x - y. Such studies are sometimes viewed
Formulas and Tables for Gerstman
 Formulas ad Tables for Gerstma Measuremet ad Study Desig Biostatistics is more tha a compilatio of computatioal techiques! Measuremet scales: quatitative, ordial, categorical Iformatio quality is primary
Data Analysis and Statistical Methods Statistics 651
 Data Aalysis ad Statistical Methods Statistics 651 http://www.stat.tamu.edu/~suhasii/teachig.html Suhasii Subba Rao Review of testig: Example The admistrator of a ursig home wats to do a time ad motio
SDS 321: Introduction to Probability and Statistics
 SDS 321: Itroductio to Probability ad Statistics Lecture 23: Cotiuous radom variables- Iequalities, CLT Puramrita Sarkar Departmet of Statistics ad Data Sciece The Uiversity of Texas at Austi www.cs.cmu.edu/
Exam II Review. CEE 3710 November 15, /16/2017. EXAM II Friday, November 17, in class. Open book and open notes.
 Exam II Review CEE 3710 November 15, 017 EXAM II Friday, November 17, i class. Ope book ad ope otes. Focus o material covered i Homeworks #5 #8, Note Packets #10 19 1 Exam II Topics **Will emphasize material
Statistics 300: Elementary Statistics
 Statistics 300: Elemetary Statistics Sectios 7-, 7-3, 7-4, 7-5 Parameter Estimatio Poit Estimate Best sigle value to use Questio What is the probability this estimate is the correct value? Parameter Estimatio
1 Constructing and Interpreting a Confidence Interval
 Itroductory Applied Ecoometrics EEP/IAS 118 Sprig 2014 WARM UP: Match the terms i the table with the correct formula: Adrew Crae-Droesch Sectio #6 5 March 2014 ˆ Let X be a radom variable with mea µ ad
Topic 9: Sampling Distributions of Estimators
 Topic 9: Samplig Distributios of Estimators Course 003, 2018 Page 0 Samplig distributios of estimators Sice our estimators are statistics (particular fuctios of radom variables), their distributio ca be
Background Information
 Egieerig 33 Gayheart 5-63 1 Beautif ul Homework 5-63 Suppose t h a t whe t h e ph of a c e r t a i c h e m i c a l compoud i s 5.00, t h e ph measured by a radomly s e l e c t e d begiig chemistry studet
Exam II Covers. STA 291 Lecture 19. Exam II Next Tuesday 5-7pm Memorial Hall (Same place as exam I) Makeup Exam 7:15pm 9:15pm Location CB 234
 Makeup Exam 7:15pm 9:15pm Location CB 234") STA 291 Lecture 19 Exam II Next Tuesday 5-7pm Memorial Hall (Same place as exam I) Makeup Exam 7:15pm 9:15pm Locatio CB 234 STA 291 - Lecture 19 1 Exam II Covers Chapter 9 10.1; 10.2; 10.3; 10.4; 10.6
STA 291 Lecture 19 Exam II Next Tuesday 5-7pm Memorial Hall (Same place as exam I) Makeup Exam 7:15pm 9:15pm Locatio CB 234 STA 291 - Lecture 19 1 Exam II Covers Chapter 9 10.1; 10.2; 10.3; 10.4; 10.6
PSYCHOLOGICAL RESEARCH (PYC 304-C) Lecture 9
 Lecture 9") Hypothesis testig PSYCHOLOGICAL RESEARCH (PYC 34-C Lecture 9 Statistical iferece is that brach of Statistics i which oe typically makes a statemet about a populatio based upo the results of a sample. I
Hypothesis testig PSYCHOLOGICAL RESEARCH (PYC 34-C Lecture 9 Statistical iferece is that brach of Statistics i which oe typically makes a statemet about a populatio based upo the results of a sample. I
Chapter 11: Asking and Answering Questions About the Difference of Two Proportions
 Chapter 11: Askig ad Aswerig Questios About the Differece of Two Proportios These otes reflect material from our text, Statistics, Learig from Data, First Editio, by Roxy Peck, published by CENGAGE Learig,
Direction: This test is worth 250 points. You are required to complete this test within 50 minutes.
 Term Test October 3, 003 Name Math 56 Studet Number Directio: This test is worth 50 poits. You are required to complete this test withi 50 miutes. I order to receive full credit, aswer each problem completely
STAT 350 Handout 19 Sampling Distribution, Central Limit Theorem (6.6)
") STAT 350 Hadout 9 Samplig Distributio, Cetral Limit Theorem (6.6) A radom sample is a sequece of radom variables X, X 2,, X that are idepedet ad idetically distributed. o This property is ofte abbreviated
STAT 350 Hadout 9 Samplig Distributio, Cetral Limit Theorem (6.6) A radom sample is a sequece of radom variables X, X 2,, X that are idepedet ad idetically distributed. o This property is ofte abbreviated
Statistical Inference About Means and Proportions With Two Populations
 Departmet of Quatitative Methods & Iformatio Systems Itroductio to Busiess Statistics QM 220 Chapter 10 Statistical Iferece About Meas ad Proportios With Two Populatios Fall 2010 Dr. Mohammad Zaial 1 Chapter
Lecture 3. Properties of Summary Statistics: Sampling Distribution
 Lecture 3 Properties of Summary Statistics: Samplig Distributio Mai Theme How ca we use math to justify that our umerical summaries from the sample are good summaries of the populatio? Lecture Summary
Confidence Interval for one population mean or one population proportion, continued. 1. Sample size estimation based on the large sample C.I.
 Cofidece Iterval for oe populatio mea or oe populatio proportio, cotiued 1. ample size estimatio based o the large sample C.I. for p ˆ(1 ˆ) ˆ(1 ˆ) From the iterval ˆ p p Z p ˆ, p Z p p L legh of your 100(1
Properties and Hypothesis Testing
 Chapter 3 Properties ad Hypothesis Testig 3.1 Types of data The regressio techiques developed i previous chapters ca be applied to three differet kids of data. 1. Cross-sectioal data. 2. Time series data.