Final Review. Fall 2013 Prof. Yao Xie, H. Milton Stewart School of Industrial Systems & Engineering Georgia Tech
|
|
|
- Clinton Bryan
- 5 years ago
- Views:
Transcription
1 Fial Review Fall 2013 Prof. Yao Xie, H. Milto Stewart School of Idustrial Systems & Egieerig Georgia Tech 1
2 Radom samplig model radom samples populatio radom samples: x 1,..., x For example, we use digital thermometer to measure body temperature for 5 times, we obtai a sequece. If we do this experimet the ext day, we get a differet sequece of measures. The result of the measuremet is a sequece of radom samples (also called data). 2
3 3

4 Descriptive statistics Quatitative values provides simple summaries about samples plot Histogram Box plot Stem & Leaf diagram 4
5 Numerical Data DESCRIPTIVE STATISTICS Categorical Data Normal Distributio Biomial Distributio RANDOM N( µ, σ 2 ) VARIABLES X ~Bi(,p) µ = X σ 2 = S 2 POINT ESTIMATION p = X STATISTICAL INFERENCE Cofidece Iterval (L( µ ), U( µ ) ) Hypothesis Testig H : µ = µ 0 0 Cofidece Iterval Hypothesis Testig (L( p ), U( p ) ) H : p = p 0 0 Cofidece Iterval Hypothesis Testig Cofidece Iterval Hypothesis Testig µ µ H : µ = µ p1 p2 H 0: p 2 1 = p INFERENCE ON MULTIPLE POPULATIONS ANOVA STATISTICAL MODELING Cotigecy Tables Liear Regressio Liear Regressio Logistic Regressio 5
6 Data summary Samples Sample mea Sample media 1) rak samples from smallest to largest x 1, x 2,, x 1 1 x = x + x2 + y 1, y 2,, y 1 + 2) odd umber of samples, media = eve umber of samples, media = (y ( 1)/2 + y ( 1)/2 ) / 2 1 x y (+1)/2 6
7 Sample rage = largest - smallest Sample variace Sample quartile : pth quartile is such that p- percet of samples are smaller tha upper quartile lower quartile x p S 2 = 1 1 i=1 ( x i x ) 2 Iter quartile rage (IQR) = upper quartile - lower quartile x p 7
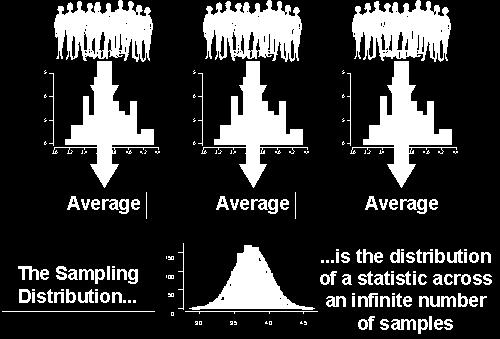
8 Samplig distributio Distributio of the statistics we come up (above) Samplig distributio extremely useful for determiig forms of cofidece iterval hypothesis test 8
9 Samplig distributio: summary Sample mea Sample variace Form X = 1 i=1 X i S 2 = 1 i=1 ( X i X) 2 sample i.i.d. ormal Kow variace X ~ N µ, σ 2 S 2 ( 1) σ 2 2 ~ χ 1 Ukow variace large, approximately ormal as above large, approximately ormal 9
10 Other commo samplig distributio Sample proportio ˆp = X Stadardized sample mea, kow variace Exact: Exact Exact ˆp ~ BIN(, p) Large sample: ˆp ~ N(p,p(1 p)) X µ σ 2 / X µ σ 2 / ~ N 0, 1 ( ) Stadardized sample mea, ukow variace X µ S 2 / X µ S 2 / ~ t 1 10
11 Two sample Differece i sample mea, kow variace Differece i sample mea, ukow (but idetical) variace, Proportio of sample variace ( X 1 X ) 2 ( µ 1 µ 2 ) σ σ 2 2 ~ N ( 0, 1 ) ( X 1 X ) 2 ( µ 1 µ ) 2 1 S p ~ t S 1 2 /σ 1 2 S 2 2 /σ 2 2 ~ F 1 1, 2 1 S p 2 = 1 ( ) 2 X 1i X 1 + X 2i X 2 i=1 1 i= ( ) 2 11
12 Statistical methods Poit estimator Cofidece iterval Hypothesis test Two sample test (two populatios) ANOVA (more tha two populatios) Liear regressio 12
13 Poit estimator Mea of estimator: ubiased Variace of estimator Mea Square Error (MSE) MSE = biase 2 + variace Method of fidig poit estimators method of momet maximum likelihood 13
14 Cofidece iterval Poit estimator: a sigle value for estimated parameter Cofidece iterval: a iterval such that true parameter lies i [a, b] cotais true parameter with probability the [a, b] is the 1 α cofidece iterval 1 α 14
15 Typical forms of k k = upper cuttig poit * variace of poit estimator width of cofidece iterval determied by sample size ad cofidece level 15 x σ z α /2, x + σ z α /2 + 1, 2 1, 2, t s x t s x α α ˆp z α /2 ˆp 1 ˆp ( ) /, ˆp z α /2 ˆp 1 ˆp ( ) / ( )
 16")
16 Tails etc 1z2 P1Z z2 z e 2 u2 du 0 t α, ν α Φ (z) z 0 α = 0.25 f 0.25, 1, 2 CDF Upper cuttig poit (also called percetage poit i textbook) 16
17 Forms of cofidece itervals Two- sided iterval [poit estimator - k, poit estimator + k] Oe- sided iterval [poit estimator + k, ifiity] or [- ifiity, poit estimator - k] k specifies width of cofidece iterval 17
18 Hypothesis test Use data to test two cotradictig statemets H 0 : ull hypothesis H 1 : alterative hypothesis Two approaches Fixed cofidece level Form: reject H 0 whe test statistic falls out of thresholds p- value probability of observig somethig more extreme tha data 18
19 Procedure of hypothesis test (sec ) 1. Set&&the&sigificace&level&(.01,&.05,&.1)& 2. Set&ull&ad&altera:ve&hypothesis& 3. Determie&other¶meters& 4. Decide&type&of&the&test& &&&&&&&&&C&test&for&mea&with&kow&variace&(zCtest)& &&&&&&&&&C&test&for&mea&with&ukow&variace&(tCtest)& &&C&test&for&sample&propor:o¶meter& 6. Use&data&available:&& &&&&&&&&C&perform&test&to&reach&a&decisio&& &&C&ad&report&pCvalue& 19
20 Summary: test for mea NullHypothesis H 0 : µ = µ 0 TestSta(s(c x Sigificacelevel:α Altera(ve* Hypothesis* H 1 : µ µ 0 KowVariace * H0*is*rejected*if x µ 0 > z α 2 σ / UkowVariace * H0*is*rejected*if x µ 0 > t α 2, 1 s / H 1 : µ > µ 0 x > µ 0 + z α σ / x > µ 0 + t α, 1 s / H 1 : µ < µ 0 x < µ 0 z α σ / x < µ 0 t α, 1 s / 20
21 Test for sample proportio NullHypothesis H 0 : p = p 0 Sigificacelevel:α TestSta(s(c ˆp p 0 p ( 0 1 p ) 0 / Altera(ve* Hypothesis* H0*is*rejected*if H 1 : p p 0 ˆp p 0 ( ) / > z α /2 p 0 1 p 0 21
22 Two sample test: mea For the followig hypothesis test H 0 : µ 1 µ 2 = Δ H 1 : µ 1 µ 2 Δ Reject H 0 whe X Y (µ 1 µ 2 ) S p 1/ 1 +1/ 2 > t α /2 22
23 Two-sample test: sample proportio For two-sided test, H 0 : p 1 = p 2 H 1 : p 1 p 2 reject H 0 whe ˆp 1 ˆp ( ) ˆp 1 ˆp > z α /2 23
")
24 Aalysis of variace Multiple populatios Aalyze differece i their meas We#would#reject#H 0 #if# F 0 > Fα, a 1, a( 1) 24
25 Liear regressio Simple liear regressio ε i Respose Regressor or Predictor Y i = β + β X i + ε i =1,2,, 0 1 i Itercept Slope Radom error 25
26 Fitted coefficiets S x x a i x i x2 2 a i 1 2 x i a a i 1 a x i b 2 b (11-10) S x y a 1y i y21x i x2 a i 1 a a i 1 a a x i b a a i 1 i 1 x i ay ia b a a b y i b (11-11) ˆ β 0 = y ˆ β1x 1 ˆβ = S S xy xx ˆ ˆ ˆ yi = β 0 + β1x i Fitted (estimated) regressio model 26
27 Model diagosis Plot residuals Use R ad read the output For simple ad multiple liear regressio: we are goig to rely o R to do the calculatios 27
28 Fially 28
29 Fially What statistics is about? Fit model usig data (e.g. distributios) Use model to make ifereces estimatio hypothesis testig predictio (e.g. usig liear regressio) Why model is useful? report fidigs from data systematically quatify ucertaity 29
30 30
Lecture 11 Simple Linear Regression
 Lecture 11 Simple Liear Regressio Fall 2013 Prof. Yao Xie, yao.xie@isye.gatech.edu H. Milto Stewart School of Idustrial Systems & Egieerig Georgia Tech Midterm 2 mea: 91.2 media: 93.75 std: 6.5 2 Meddicorp
TABLES AND FORMULAS FOR MOORE Basic Practice of Statistics
 TABLES AND FORMULAS FOR MOORE Basic Practice of Statistics Explorig Data: Distributios Look for overall patter (shape, ceter, spread) ad deviatios (outliers). Mea (use a calculator): x = x 1 + x 2 + +
TABLES AND FORMULAS FOR MOORE Basic Practice of Statistics
 TABLES AND FORMULAS FOR MOORE Basic Practice of Statistics Explorig Data: Distributios Look for overall patter (shape, ceter, spread) ad deviatios (outliers). Mea (use a calculator): x = x 1 + x 2 + +
MATH 320: Probability and Statistics 9. Estimation and Testing of Parameters. Readings: Pruim, Chapter 4
 MATH 30: Probability ad Statistics 9. Estimatio ad Testig of Parameters Estimatio ad Testig of Parameters We have bee dealig situatios i which we have full kowledge of the distributio of a radom variable.
Chapters 5 and 13: REGRESSION AND CORRELATION. Univariate data: x, Bivariate data (x,y).
.") Chapters 5 ad 13: REGREION AND CORRELATION (ectios 5.5 ad 13.5 are omitted) Uivariate data: x, Bivariate data (x,y). Example: x: umber of years studets studied paish y: score o a proficiecy test For each
Chapters 5 ad 13: REGREION AND CORRELATION (ectios 5.5 ad 13.5 are omitted) Uivariate data: x, Bivariate data (x,y). Example: x: umber of years studets studied paish y: score o a proficiecy test For each
1 Inferential Methods for Correlation and Regression Analysis
 1 Iferetial Methods for Correlatio ad Regressio Aalysis I the chapter o Correlatio ad Regressio Aalysis tools for describig bivariate cotiuous data were itroduced. The sample Pearso Correlatio Coefficiet
Sample Size Determination (Two or More Samples)
") Sample Sie Determiatio (Two or More Samples) STATGRAPHICS Rev. 963 Summary... Data Iput... Aalysis Summary... 5 Power Curve... 5 Calculatios... 6 Summary This procedure determies a suitable sample sie
Sample Sie Determiatio (Two or More Samples) STATGRAPHICS Rev. 963 Summary... Data Iput... Aalysis Summary... 5 Power Curve... 5 Calculatios... 6 Summary This procedure determies a suitable sample sie
Common Large/Small Sample Tests 1/55
 Commo Large/Small Sample Tests 1/55 Test of Hypothesis for the Mea (σ Kow) Covert sample result ( x) to a z value Hypothesis Tests for µ Cosider the test H :μ = μ H 1 :μ > μ σ Kow (Assume the populatio
Continuous Data that can take on any real number (time/length) based on sample data. Categorical data can only be named or categorised
 based on sample data. Categorical data can only be named or categorised") Questio 1. (Topics 1-3) A populatio cosists of all the members of a group about which you wat to draw a coclusio (Greek letters (μ, σ, Ν) are used) A sample is the portio of the populatio selected for
Questio 1. (Topics 1-3) A populatio cosists of all the members of a group about which you wat to draw a coclusio (Greek letters (μ, σ, Ν) are used) A sample is the portio of the populatio selected for
MOST PEOPLE WOULD RATHER LIVE WITH A PROBLEM THEY CAN'T SOLVE, THAN ACCEPT A SOLUTION THEY CAN'T UNDERSTAND.
 XI-1 (1074) MOST PEOPLE WOULD RATHER LIVE WITH A PROBLEM THEY CAN'T SOLVE, THAN ACCEPT A SOLUTION THEY CAN'T UNDERSTAND. R. E. D. WOOLSEY AND H. S. SWANSON XI-2 (1075) STATISTICAL DECISION MAKING Advaced
Describing the Relation between Two Variables
 Copyright 010 Pearso Educatio, Ic. Tables ad Formulas for Sulliva, Statistics: Iformed Decisios Usig Data 010 Pearso Educatio, Ic Chapter Orgaizig ad Summarizig Data Relative frequecy = frequecy sum of
Stat 200 -Testing Summary Page 1
 Stat 00 -Testig Summary Page 1 Mathematicias are like Frechme; whatever you say to them, they traslate it ito their ow laguage ad forthwith it is somethig etirely differet Goethe 1 Large Sample Cofidece
(all terms are scalars).the minimization is clearer in sum notation:
.the minimization is clearer in sum notation:") 7 Multiple liear regressio: with predictors) Depedet data set: y i i = 1, oe predictad, predictors x i,k i = 1,, k = 1, ' The forecast equatio is ŷ i = b + Use matrix otatio: k =1 b k x ik Y = y 1 y 1
7 Multiple liear regressio: with predictors) Depedet data set: y i i = 1, oe predictad, predictors x i,k i = 1,, k = 1, ' The forecast equatio is ŷ i = b + Use matrix otatio: k =1 b k x ik Y = y 1 y 1
Formulas and Tables for Gerstman
 Formulas ad Tables for Gerstma Measuremet ad Study Desig Biostatistics is more tha a compilatio of computatioal techiques! Measuremet scales: quatitative, ordial, categorical Iformatio quality is primary
Final Examination Solutions 17/6/2010
 The Islamic Uiversity of Gaza Faculty of Commerce epartmet of Ecoomics ad Political Scieces A Itroductio to Statistics Course (ECOE 30) Sprig Semester 009-00 Fial Eamiatio Solutios 7/6/00 Name: I: Istructor:
Class 23. Daniel B. Rowe, Ph.D. Department of Mathematics, Statistics, and Computer Science. Marquette University MATH 1700
 Class 23 Daiel B. Rowe, Ph.D. Departmet of Mathematics, Statistics, ad Computer Sciece Copyright 2017 by D.B. Rowe 1 Ageda: Recap Chapter 9.1 Lecture Chapter 9.2 Review Exam 6 Problem Solvig Sessio. 2
A quick activity - Central Limit Theorem and Proportions. Lecture 21: Testing Proportions. Results from the GSS. Statistics and the General Population
 A quick activity - Cetral Limit Theorem ad Proportios Lecture 21: Testig Proportios Statistics 10 Coli Rudel Flip a coi 30 times this is goig to get loud! Record the umber of heads you obtaied ad calculate
Important Formulas. Expectation: E (X) = Σ [X P(X)] = n p q σ = n p q. P(X) = n! X1! X 2! X 3! X k! p X. Chapter 6 The Normal Distribution.
![Important Formulas. Expectation: E (X) = Σ [X P(X)] = n p q σ = n p q. P(X) = n! X1! X 2! X 3! X k! p X. Chapter 6 The Normal Distribution.](/thumbs/96/128489792.jpg "Important Formulas. Expectation: E (X) = Σ [X P(X)] = n p q σ = n p q. P(X) = n! X1! X 2! X 3! X k! p X. Chapter 6 The Normal Distribution.") Importat Formulas Chapter 3 Data Descriptio Mea for idividual data: X = _ ΣX Mea for grouped data: X= _ Σf X m Stadard deviatio for a sample: _ s = Σ(X _ X ) or s = 1 (Σ X ) (Σ X ) ( 1) Stadard deviatio
Importat Formulas Chapter 3 Data Descriptio Mea for idividual data: X = _ ΣX Mea for grouped data: X= _ Σf X m Stadard deviatio for a sample: _ s = Σ(X _ X ) or s = 1 (Σ X ) (Σ X ) ( 1) Stadard deviatio
Statistical Inference (Chapter 10) Statistical inference = learn about a population based on the information provided by a sample.
 Statistical inference = learn about a population based on the information provided by a sample.") Statistical Iferece (Chapter 10) Statistical iferece = lear about a populatio based o the iformatio provided by a sample. Populatio: The set of all values of a radom variable X of iterest. Characterized
Statistical Iferece (Chapter 10) Statistical iferece = lear about a populatio based o the iformatio provided by a sample. Populatio: The set of all values of a radom variable X of iterest. Characterized
STATISTICAL INFERENCE
 STATISTICAL INFERENCE POPULATION AND SAMPLE Populatio = all elemets of iterest Characterized by a distributio F with some parameter θ Sample = the data X 1,..., X, selected subset of the populatio = sample
Topic 9: Sampling Distributions of Estimators
 Topic 9: Samplig Distributios of Estimators Course 003, 2016 Page 0 Samplig distributios of estimators Sice our estimators are statistics (particular fuctios of radom variables), their distributio ca be
1.010 Uncertainty in Engineering Fall 2008
 MIT OpeCourseWare http://ocw.mit.edu.00 Ucertaity i Egieerig Fall 2008 For iformatio about citig these materials or our Terms of Use, visit: http://ocw.mit.edu.terms. .00 - Brief Notes # 9 Poit ad Iterval
Correlation. Two variables: Which test? Relationship Between Two Numerical Variables. Two variables: Which test? Contingency table Grouped bar graph
 Correlatio Y Two variables: Which test? X Explaatory variable Respose variable Categorical Numerical Categorical Cotigecy table Cotigecy Logistic Grouped bar graph aalysis regressio Mosaic plot Numerical
TAMS24: Notations and Formulas
 TAMS4: Notatios ad Formulas Basic otatios ad defiitios X: radom variable stokastiska variabel Mea Vätevärde: µ = X = by Xiagfeg Yag kpx k, if X is discrete, xf Xxdx, if X is cotiuous Variace Varias: =
HYPOTHESIS TESTS FOR ONE POPULATION MEAN WORKSHEET MTH 1210, FALL 2018
 HYPOTHESIS TESTS FOR ONE POPULATION MEAN WORKSHEET MTH 1210, FALL 2018 We are resposible for 2 types of hypothesis tests that produce ifereces about the ukow populatio mea, µ, each of which has 3 possible
Topic 9: Sampling Distributions of Estimators
 Topic 9: Samplig Distributios of Estimators Course 003, 2018 Page 0 Samplig distributios of estimators Sice our estimators are statistics (particular fuctios of radom variables), their distributio ca be
STA Learning Objectives. Population Proportions. Module 10 Comparing Two Proportions. Upon completing this module, you should be able to:
 STA 2023 Module 10 Comparig Two Proportios Learig Objectives Upo completig this module, you should be able to: 1. Perform large-sample ifereces (hypothesis test ad cofidece itervals) to compare two populatio
Chapter 2 Descriptive Statistics
 Chapter 2 Descriptive Statistics Statistics Most commoly, statistics refers to umerical data. Statistics may also refer to the process of collectig, orgaizig, presetig, aalyzig ad iterpretig umerical data
University of California, Los Angeles Department of Statistics. Simple regression analysis
 Uiversity of Califoria, Los Ageles Departmet of Statistics Statistics 100C Istructor: Nicolas Christou Simple regressio aalysis Itroductio: Regressio aalysis is a statistical method aimig at discoverig
Stat 139 Homework 7 Solutions, Fall 2015
 Stat 139 Homework 7 Solutios, Fall 2015 Problem 1. I class we leared that the classical simple liear regressio model assumes the followig distributio of resposes: Y i = β 0 + β 1 X i + ɛ i, i = 1,...,,
Inferential Statistics. Inference Process. Inferential Statistics and Probability a Holistic Approach. Inference Process.
 Iferetial Statistics ad Probability a Holistic Approach Iferece Process Chapter 8 Poit Estimatio ad Cofidece Itervals This Course Material by Maurice Geraghty is licesed uder a Creative Commos Attributio-ShareAlike
Topic 9: Sampling Distributions of Estimators
 Topic 9: Samplig Distributios of Estimators Course 003, 2018 Page 0 Samplig distributios of estimators Sice our estimators are statistics (particular fuctios of radom variables), their distributio ca be
Introductory statistics
 CM9S: Machie Learig for Bioiformatics Lecture - 03/3/06 Itroductory statistics Lecturer: Sriram Sakararama Scribe: Sriram Sakararama We will provide a overview of statistical iferece focussig o the key
Chapter 1 (Definitions)
") FINAL EXAM REVIEW Chapter 1 (Defiitios) Qualitative: Nomial: Ordial: Quatitative: Ordial: Iterval: Ratio: Observatioal Study: Desiged Experimet: Samplig: Cluster: Stratified: Systematic: Coveiece: Simple
FINAL EXAM REVIEW Chapter 1 (Defiitios) Qualitative: Nomial: Ordial: Quatitative: Ordial: Iterval: Ratio: Observatioal Study: Desiged Experimet: Samplig: Cluster: Stratified: Systematic: Coveiece: Simple
Grant MacEwan University STAT 252 Dr. Karen Buro Formula Sheet
 Grat MacEwa Uiversity STAT 5 Dr. Kare Buro Formula Sheet Descriptive Statistics Sample Mea: x = x i i= Sample Variace: s = i= (x i x) = Σ i=x i (Σ i= x i) Sample Stadard Deviatio: s = Sample Variace =
Sampling Distributions, Z-Tests, Power
 Samplig Distributios, Z-Tests, Power We draw ifereces about populatio parameters from sample statistics Sample proportio approximates populatio proportio Sample mea approximates populatio mea Sample variace
Interval Estimation (Confidence Interval = C.I.): An interval estimate of some population parameter is an interval of the form (, ),
: An interval estimate of some population parameter is an interval of the form (, ),") Cofidece Iterval Estimatio Problems Suppose we have a populatio with some ukow parameter(s). Example: Normal(,) ad are parameters. We eed to draw coclusios (make ifereces) about the ukow parameters. We
Cofidece Iterval Estimatio Problems Suppose we have a populatio with some ukow parameter(s). Example: Normal(,) ad are parameters. We eed to draw coclusios (make ifereces) about the ukow parameters. We
Statistics 20: Final Exam Solutions Summer Session 2007
 1. 20 poits Testig for Diabetes. Statistics 20: Fial Exam Solutios Summer Sessio 2007 (a) 3 poits Give estimates for the sesitivity of Test I ad of Test II. Solutio: 156 patiets out of total 223 patiets
Tests of Hypotheses Based on a Single Sample (Devore Chapter Eight)
") Tests of Hypotheses Based o a Sigle Sample Devore Chapter Eight MATH-252-01: Probability ad Statistics II Sprig 2018 Cotets 1 Hypothesis Tests illustrated with z-tests 1 1.1 Overview of Hypothesis Testig..........
Tests of Hypotheses Based o a Sigle Sample Devore Chapter Eight MATH-252-01: Probability ad Statistics II Sprig 2018 Cotets 1 Hypothesis Tests illustrated with z-tests 1 1.1 Overview of Hypothesis Testig..........
Statistics Lecture 27. Final review. Administrative Notes. Outline. Experiments. Sampling and Surveys. Administrative Notes
 Admiistrative Notes s - Lecture 7 Fial review Fial Exam is Tuesday, May 0th (3-5pm Covers Chapters -8 ad 0 i textbook Brig ID cards to fial! Allowed: Calculators, double-sided 8.5 x cheat sheet Exam Rooms:
Linear Regression Models
 Liear Regressio Models Dr. Joh Mellor-Crummey Departmet of Computer Sciece Rice Uiversity johmc@cs.rice.edu COMP 528 Lecture 9 15 February 2005 Goals for Today Uderstad how to Use scatter diagrams to ispect
Logit regression Logit regression
 Logit regressio Logit regressio models the probability of Y= as the cumulative stadard logistic distributio fuctio, evaluated at z = β 0 + β X: Pr(Y = X) = F(β 0 + β X) F is the cumulative logistic distributio
MATH/STAT 352: Lecture 15
 MATH/STAT 352: Lecture 15 Sectios 5.2 ad 5.3. Large sample CI for a proportio ad small sample CI for a mea. 1 5.2: Cofidece Iterval for a Proportio Estimatig proportio of successes i a biomial experimet
Topic 10: Introduction to Estimation
 Topic 0: Itroductio to Estimatio Jue, 0 Itroductio I the simplest possible terms, the goal of estimatio theory is to aswer the questio: What is that umber? What is the legth, the reactio rate, the fractio
Parameter, Statistic and Random Samples
 Parameter, Statistic ad Radom Samples A parameter is a umber that describes the populatio. It is a fixed umber, but i practice we do ot kow its value. A statistic is a fuctio of the sample data, i.e.,
Agreement of CI and HT. Lecture 13 - Tests of Proportions. Example - Waiting Times
 Sigificace level vs. cofidece level Agreemet of CI ad HT Lecture 13 - Tests of Proportios Sta102 / BME102 Coli Rudel October 15, 2014 Cofidece itervals ad hypothesis tests (almost) always agree, as log
STATS 200: Introduction to Statistical Inference. Lecture 1: Course introduction and polling
 STATS 200: Itroductio to Statistical Iferece Lecture 1: Course itroductio ad pollig U.S. presidetial electio projectios by state (Source: fivethirtyeight.com, 25 September 2016) Pollig Let s try to uderstad
Statistics 300: Elementary Statistics
 Statistics 300: Elemetary Statistics Sectios 7-, 7-3, 7-4, 7-5 Parameter Estimatio Poit Estimate Best sigle value to use Questio What is the probability this estimate is the correct value? Parameter Estimatio
MBACATÓLICA. Quantitative Methods. Faculdade de Ciências Económicas e Empresariais UNIVERSIDADE CATÓLICA PORTUGUESA 9. SAMPLING DISTRIBUTIONS
 MBACATÓLICA Quatitative Methods Miguel Gouveia Mauel Leite Moteiro Faculdade de Ciêcias Ecoómicas e Empresariais UNIVERSIDADE CATÓLICA PORTUGUESA 9. SAMPLING DISTRIBUTIONS MBACatólica 006/07 Métodos Quatitativos
Parameter, Statistic and Random Samples
 Parameter, Statistic ad Radom Samples A parameter is a umber that describes the populatio. It is a fixed umber, but i practice we do ot kow its value. A statistic is a fuctio of the sample data, i.e.,
Properties and Hypothesis Testing
 Chapter 3 Properties ad Hypothesis Testig 3.1 Types of data The regressio techiques developed i previous chapters ca be applied to three differet kids of data. 1. Cross-sectioal data. 2. Time series data.
z is the upper tail critical value from the normal distribution
 Statistical Iferece drawig coclusios about a populatio parameter, based o a sample estimate. Populatio: GRE results for a ew eam format o the quatitative sectio Sample: =30 test scores Populatio Samplig
Open book and notes. 120 minutes. Cover page and six pages of exam. No calculators.
 IE 330 Seat # Ope book ad otes 120 miutes Cover page ad six pages of exam No calculators Score Fial Exam (example) Schmeiser Ope book ad otes No calculator 120 miutes 1 True or false (for each, 2 poits
INSTRUCTIONS (A) 1.22 (B) 0.74 (C) 4.93 (D) 1.18 (E) 2.43
 1.22 (B) 0.74 (C) 4.93 (D) 1.18 (E) 2.43") PAPER NO.: 444, 445 PAGE NO.: Page 1 of 1 INSTRUCTIONS I. You have bee provided with: a) the examiatio paper i two parts (PART A ad PART B), b) a multiple choice aswer sheet (for PART A), c) selected formulae
PAPER NO.: 444, 445 PAGE NO.: Page 1 of 1 INSTRUCTIONS I. You have bee provided with: a) the examiatio paper i two parts (PART A ad PART B), b) a multiple choice aswer sheet (for PART A), c) selected formulae
Introduction to Econometrics (3 rd Updated Edition) Solutions to Odd- Numbered End- of- Chapter Exercises: Chapter 3
 Solutions to Odd- Numbered End- of- Chapter Exercises: Chapter 3") Itroductio to Ecoometrics (3 rd Updated Editio) by James H. Stock ad Mark W. Watso Solutios to Odd- Numbered Ed- of- Chapter Exercises: Chapter 3 (This versio August 17, 014) 015 Pearso Educatio, Ic. Stock/Watso
Itroductio to Ecoometrics (3 rd Updated Editio) by James H. Stock ad Mark W. Watso Solutios to Odd- Numbered Ed- of- Chapter Exercises: Chapter 3 (This versio August 17, 014) 015 Pearso Educatio, Ic. Stock/Watso
Statistical Intervals for a Single Sample
 3/5/06 Applied Statistics ad Probability for Egieers Sixth Editio Douglas C. Motgomery George C. Ruger Chapter 8 Statistical Itervals for a Sigle Sample 8 CHAPTER OUTLINE 8- Cofidece Iterval o the Mea
Frequentist Inference
 Frequetist Iferece The topics of the ext three sectios are useful applicatios of the Cetral Limit Theorem. Without kowig aythig about the uderlyig distributio of a sequece of radom variables {X i }, for
11 Correlation and Regression
 11 Correlatio Regressio 11.1 Multivariate Data Ofte we look at data where several variables are recorded for the same idividuals or samplig uits. For example, at a coastal weather statio, we might record
- E < p. ˆ p q ˆ E = q ˆ = 1 - p ˆ = sample proportion of x failures in a sample size of n. where. x n sample proportion. population proportion
 1 Chapter 7 ad 8 Review for Exam Chapter 7 Estimates ad Sample Sizes 2 Defiitio Cofidece Iterval (or Iterval Estimate) a rage (or a iterval) of values used to estimate the true value of the populatio parameter
EXAMINATIONS OF THE ROYAL STATISTICAL SOCIETY
 EXAMINATIONS OF THE ROYAL STATISTICAL SOCIETY HIGHER CERTIFICATE IN STATISTICS, 017 MODULE 4 : Liear models Time allowed: Oe ad a half hours Cadidates should aswer THREE questios. Each questio carries
STA6938-Logistic Regression Model
 Dr. Yig Zhag STA6938-Logistic Regressio Model Topic -Simple (Uivariate) Logistic Regressio Model Outlies:. Itroductio. A Example-Does the liear regressio model always work? 3. Maximum Likelihood Curve
Statistical inference: example 1. Inferential Statistics
 Statistical iferece: example 1 Iferetial Statistics POPULATION SAMPLE A clothig store chai regularly buys from a supplier large quatities of a certai piece of clothig. Each item ca be classified either
[ ] ( ) ( ) [ ] ( ) 1 [ ] [ ] Sums of Random Variables Y = a 1 X 1 + a 2 X 2 + +a n X n The expected value of Y is:
![[ ] ( ) ( ) [ ] ( ) 1 [ ] [ ] Sums of Random Variables Y = a 1 X 1 + a 2 X 2 + +a n X n The expected value of Y is:](/thumbs/89/98900182.jpg "[ ] ( ) ( ) [ ] ( ) 1 [ ] [ ] Sums of Random Variables Y = a 1 X 1 + a 2 X 2 + +a n X n The expected value of Y is:") PROBABILITY FUNCTIONS A radom variable X has a probabilit associated with each of its possible values. The probabilit is termed a discrete probabilit if X ca assume ol discrete values, or X = x, x, x 3,,
PROBABILITY FUNCTIONS A radom variable X has a probabilit associated with each of its possible values. The probabilit is termed a discrete probabilit if X ca assume ol discrete values, or X = x, x, x 3,,
Worksheet 23 ( ) Introduction to Simple Linear Regression (continued)
 Introduction to Simple Linear Regression (continued)") Worksheet 3 ( 11.5-11.8) Itroductio to Simple Liear Regressio (cotiued) This worksheet is a cotiuatio of Discussio Sheet 3; please complete that discussio sheet first if you have ot already doe so. This
Worksheet 3 ( 11.5-11.8) Itroductio to Simple Liear Regressio (cotiued) This worksheet is a cotiuatio of Discussio Sheet 3; please complete that discussio sheet first if you have ot already doe so. This
(7 One- and Two-Sample Estimation Problem )
") 34 Stat Lecture Notes (7 Oe- ad Two-Sample Estimatio Problem ) ( Book*: Chapter 8,pg65) Probability& Statistics for Egieers & Scietists By Walpole, Myers, Myers, Ye Estimatio 1 ) ( ˆ S P i i Poit estimate:
34 Stat Lecture Notes (7 Oe- ad Two-Sample Estimatio Problem ) ( Book*: Chapter 8,pg65) Probability& Statistics for Egieers & Scietists By Walpole, Myers, Myers, Ye Estimatio 1 ) ( ˆ S P i i Poit estimate:
Linear Regression Analysis. Analysis of paired data and using a given value of one variable to predict the value of the other
 Liear Regressio Aalysis Aalysis of paired data ad usig a give value of oe variable to predict the value of the other 5 5 15 15 1 1 5 5 1 3 4 5 6 7 8 1 3 4 5 6 7 8 Liear Regressio Aalysis E: The chirp rate
STAC51: Categorical data Analysis
 STAC51: Categorical data Aalysis Mahida Samarakoo Jauary 28, 2016 Mahida Samarakoo STAC51: Categorical data Aalysis 1 / 35 Table of cotets Iferece for Proportios 1 Iferece for Proportios Mahida Samarakoo
Simple Linear Regression
 Simple Liear Regressio 1. Model ad Parameter Estimatio (a) Suppose our data cosist of a collectio of pairs (x i, y i ), where x i is a observed value of variable X ad y i is the correspodig observatio
Statistics 203 Introduction to Regression and Analysis of Variance Assignment #1 Solutions January 20, 2005
 Statistics 203 Itroductio to Regressio ad Aalysis of Variace Assigmet #1 Solutios Jauary 20, 2005 Q. 1) (MP 2.7) (a) Let x deote the hydrocarbo percetage, ad let y deote the oxyge purity. The simple liear
Big Picture. 5. Data, Estimates, and Models: quantifying the accuracy of estimates.
 5. Data, Estimates, ad Models: quatifyig the accuracy of estimates. 5. Estimatig a Normal Mea 5.2 The Distributio of the Normal Sample Mea 5.3 Normal data, cofidece iterval for, kow 5.4 Normal data, cofidece
Announcements. Unit 5: Inference for Categorical Data Lecture 1: Inference for a single proportion
 Housekeepig Aoucemets Uit 5: Iferece for Categorical Data Lecture 1: Iferece for a sigle proportio Statistics 101 Mie Çetikaya-Rudel PA 4 due Friday at 5pm (exteded) PS 6 due Thursday, Oct 30 October 23,
Resampling Methods. X (1/2), i.e., Pr (X i m) = 1/2. We order the data: X (1) X (2) X (n). Define the sample median: ( n.
, i.e., Pr (X i m) = 1/2. We order the data: X (1) X (2) X (n). Define the sample median: ( n.") Jauary 1, 2019 Resamplig Methods Motivatio We have so may estimators with the property θ θ d N 0, σ 2 We ca also write θ a N θ, σ 2 /, where a meas approximately distributed as Oce we have a cosistet estimator
Jauary 1, 2019 Resamplig Methods Motivatio We have so may estimators with the property θ θ d N 0, σ 2 We ca also write θ a N θ, σ 2 /, where a meas approximately distributed as Oce we have a cosistet estimator
MidtermII Review. Sta Fall Office Hours Wednesday 12:30-2:30pm Watch linear regression videos before lab on Thursday
 Aoucemets MidtermII Review Sta 101 - Fall 2016 Duke Uiversity, Departmet of Statistical Sciece Office Hours Wedesday 12:30-2:30pm Watch liear regressio videos before lab o Thursday Dr. Abrahamse Slides
Agenda: Recap. Lecture. Chapter 12. Homework. Chapt 12 #1, 2, 3 SAS Problems 3 & 4 by hand. Marquette University MATH 4740/MSCS 5740
 Ageda: Recap. Lecture. Chapter Homework. Chapt #,, 3 SAS Problems 3 & 4 by had. Copyright 06 by D.B. Rowe Recap. 6: Statistical Iferece: Procedures for μ -μ 6. Statistical Iferece Cocerig μ -μ Recall yes
UNIVERSITY OF TORONTO Faculty of Arts and Science APRIL/MAY 2009 EXAMINATIONS ECO220Y1Y PART 1 OF 2 SOLUTIONS
 PART of UNIVERSITY OF TORONTO Faculty of Arts ad Sciece APRIL/MAY 009 EAMINATIONS ECO0YY PART OF () The sample media is greater tha the sample mea whe there is. (B) () A radom variable is ormally distributed
ECONOMETRIC THEORY. MODULE XIII Lecture - 34 Asymptotic Theory and Stochastic Regressors
 ECONOMETRIC THEORY MODULE XIII Lecture - 34 Asymptotic Theory ad Stochastic Regressors Dr. Shalabh Departmet of Mathematics ad Statistics Idia Istitute of Techology Kapur Asymptotic theory The asymptotic
FACULTY OF MATHEMATICAL STUDIES MATHEMATICS FOR PART I ENGINEERING. Lectures
 FACULTY OF MATHEMATICAL STUDIES MATHEMATICS FOR PART I ENGINEERING Lectures MODULE 5 STATISTICS II. Mea ad stadard error of sample data. Biomial distributio. Normal distributio 4. Samplig 5. Cofidece itervals
Stat 319 Theory of Statistics (2) Exercises
 Exercises") Kig Saud Uiversity College of Sciece Statistics ad Operatios Research Departmet Stat 39 Theory of Statistics () Exercises Refereces:. Itroductio to Mathematical Statistics, Sixth Editio, by R. Hogg, J.
Kig Saud Uiversity College of Sciece Statistics ad Operatios Research Departmet Stat 39 Theory of Statistics () Exercises Refereces:. Itroductio to Mathematical Statistics, Sixth Editio, by R. Hogg, J.
STAT431 Review. X = n. n )
") STAT43 Review I. Results related to ormal distributio Expected value ad variace. (a) E(aXbY) = aex bey, Var(aXbY) = a VarX b VarY provided X ad Y are idepedet. Normal distributios: (a) Z N(, ) (b) X N(µ,
STAT43 Review I. Results related to ormal distributio Expected value ad variace. (a) E(aXbY) = aex bey, Var(aXbY) = a VarX b VarY provided X ad Y are idepedet. Normal distributios: (a) Z N(, ) (b) X N(µ,
Mathematical Notation Math Introduction to Applied Statistics
 Mathematical Notatio Math 113 - Itroductio to Applied Statistics Name : Use Word or WordPerfect to recreate the followig documets. Each article is worth 10 poits ad ca be prited ad give to the istructor
Class 27. Daniel B. Rowe, Ph.D. Department of Mathematics, Statistics, and Computer Science. Marquette University MATH 1700
 Class 7 Daiel B. Rowe, Ph.D. Departmet of Mathematics, Statistics, ad Computer Sciece Copyright 013 by D.B. Rowe 1 Ageda: Skip Recap Chapter 10.5 ad 10.6 Lecture Chapter 11.1-11. Review Chapters 9 ad 10
Hypothesis Testing. Evaluation of Performance of Learned h. Issues. Trade-off Between Bias and Variance
 Hypothesis Testig Empirically evaluatig accuracy of hypotheses: importat activity i ML. Three questios: Give observed accuracy over a sample set, how well does this estimate apply over additioal samples?
Regression. Correlation vs. regression. The parameters of linear regression. Regression assumes... Random sample. Y = α + β X.
 Regressio Correlatio vs. regressio Predicts Y from X Liear regressio assumes that the relatioship betwee X ad Y ca be described by a lie Regressio assumes... Radom sample Y is ormally distributed with
Lesson 2. Projects and Hand-ins. Hypothesis testing Chaptre 3. { } x=172.0 = 3.67
 Lesso 7--7 Chaptre 3 Projects ad Had-is Project I: latest ovember Project I: latest december Laboratio Measuremet systems aalysis I: latest december Project - are volutary. Laboratio is obligatory. Give
Chapter 20. Comparing Two Proportions. BPS - 5th Ed. Chapter 20 1
 Chapter 0 Comparig Two Proportios BPS - 5th Ed. Chapter 0 Case Study Machie Reliability A study is performed to test of the reliability of products produced by two machies. Machie A produced 8 defective
Economics 250 Assignment 1 Suggested Answers. 1. We have the following data set on the lengths (in minutes) of a sample of long-distance phone calls
 of a sample of long-distance phone calls") Ecoomics 250 Assigmet 1 Suggested Aswers 1. We have the followig data set o the legths (i miutes) of a sample of log-distace phoe calls 1 20 10 20 13 23 3 7 18 7 4 5 15 7 29 10 18 10 10 23 4 12 8 6 (1)
Ecoomics 250 Assigmet 1 Suggested Aswers 1. We have the followig data set o the legths (i miutes) of a sample of log-distace phoe calls 1 20 10 20 13 23 3 7 18 7 4 5 15 7 29 10 18 10 10 23 4 12 8 6 (1)
f(x i ; ) L(x; p) = i=1 To estimate the value of that maximizes L or equivalently ln L we will set =0, for i =1, 2,...,m p x i (1 p) 1 x i i=1
 L(x; p) = i=1 To estimate the value of that maximizes L or equivalently ln L we will set =0, for i =1, 2,...,m p x i (1 p) 1 x i i=1") Parameter Estimatio Samples from a probability distributio F () are: [,,..., ] T.Theprobabilitydistributio has a parameter vector [,,..., m ] T. Estimator: Statistic used to estimate ukow. Estimate: Observed
Parameter Estimatio Samples from a probability distributio F () are: [,,..., ] T.Theprobabilitydistributio has a parameter vector [,,..., m ] T. Estimator: Statistic used to estimate ukow. Estimate: Observed
MIT : Quantitative Reasoning and Statistical Methods for Planning I
 MIT 11.220 Sprig 06 Recitatio 4 March 16, 2006 MIT - 11.220: Quatitative Reasoig ad Statistical Methods for Plaig I Recitatio #4: Sprig 2006 Cofidece Itervals ad Hypothesis Testig I. Cofidece Iterval 1.
Lecture 5: Parametric Hypothesis Testing: Comparing Means. GENOME 560, Spring 2016 Doug Fowler, GS
 Lecture 5: Parametric Hypothesis Testig: Comparig Meas GENOME 560, Sprig 2016 Doug Fowler, GS (dfowler@uw.edu) 1 Review from last week What is a cofidece iterval? 2 Review from last week What is a cofidece
STA 4032 Final Exam Formula Sheet
 Chapter 2. Probability STA 4032 Fial Eam Formula Sheet Some Baic Probability Formula: (1) P (A B) = P (A) + P (B) P (A B). (2) P (A ) = 1 P (A) ( A i the complemet of A). (3) If S i a fiite ample pace
Comparing Two Populations. Topic 15 - Two Sample Inference I. Comparing Two Means. Comparing Two Pop Means. Background Reading
 Topic 15 - Two Sample Iferece I STAT 511 Professor Bruce Craig Comparig Two Populatios Research ofte ivolves the compariso of two or more samples from differet populatios Graphical summaries provide visual
Read through these prior to coming to the test and follow them when you take your test.
 Math 143 Sprig 2012 Test 2 Iformatio 1 Test 2 will be give i class o Thursday April 5. Material Covered The test is cummulative, but will emphasize the recet material (Chapters 6 8, 10 11, ad Sectios 12.1
Goodness-of-Fit Tests and Categorical Data Analysis (Devore Chapter Fourteen)
") Goodess-of-Fit Tests ad Categorical Data Aalysis (Devore Chapter Fourtee) MATH-252-01: Probability ad Statistics II Sprig 2019 Cotets 1 Chi-Squared Tests with Kow Probabilities 1 1.1 Chi-Squared Testig................
Goodess-of-Fit Tests ad Categorical Data Aalysis (Devore Chapter Fourtee) MATH-252-01: Probability ad Statistics II Sprig 2019 Cotets 1 Chi-Squared Tests with Kow Probabilities 1 1.1 Chi-Squared Testig................
3/3/2014. CDS M Phil Econometrics. Types of Relationships. Types of Relationships. Types of Relationships. Vijayamohanan Pillai N.
 3/3/04 CDS M Phil Old Least Squares (OLS) Vijayamohaa Pillai N CDS M Phil Vijayamoha CDS M Phil Vijayamoha Types of Relatioships Oly oe idepedet variable, Relatioship betwee ad is Liear relatioships Curviliear
Chapter 13: Tests of Hypothesis Section 13.1 Introduction
 Chapter 13: Tests of Hypothesis Sectio 13.1 Itroductio RECAP: Chapter 1 discussed the Likelihood Ratio Method as a geeral approach to fid good test procedures. Testig for the Normal Mea Example, discussed
Section 14. Simple linear regression.
 Sectio 14 Simple liear regressio. Let us look at the cigarette dataset from [1] (available to dowload from joural s website) ad []. The cigarette dataset cotais measuremets of tar, icotie, weight ad carbo
1 Models for Matched Pairs
 1 Models for Matched Pairs Matched pairs occur whe we aalyse samples such that for each measuremet i oe of the samples there is a measuremet i the other sample that directly relates to the measuremet i
Computing Confidence Intervals for Sample Data
 Computig Cofidece Itervals for Sample Data Topics Use of Statistics Sources of errors Accuracy, precisio, resolutio A mathematical model of errors Cofidece itervals For meas For variaces For proportios
7-1. Chapter 4. Part I. Sampling Distributions and Confidence Intervals
 7-1 Chapter 4 Part I. Samplig Distributios ad Cofidece Itervals 1 7- Sectio 1. Samplig Distributio 7-3 Usig Statistics Statistical Iferece: Predict ad forecast values of populatio parameters... Test hypotheses
Exam II Review. CEE 3710 November 15, /16/2017. EXAM II Friday, November 17, in class. Open book and open notes.
 Exam II Review CEE 3710 November 15, 017 EXAM II Friday, November 17, i class. Ope book ad ope otes. Focus o material covered i Homeworks #5 #8, Note Packets #10 19 1 Exam II Topics **Will emphasize material