University of Southampton Research Repository eprints Soton
|
|
|
- Marlene Stokes
- 5 years ago
- Views:
Transcription

1 University of Southampton Research Repository eprints Soton Copyright and Moral Rights for this thesis are retained by the author and/or other copyright owners. A copy can be downloaded for personal non-commercial research or study, without prior permission or charge. This thesis cannot be reproduced or quoted extensively from without first obtaining permission in writing from the copyright holder/s. The content must not be changed in any way or sold commercially in any format or medium without the formal permission of the copyright holders. When referring to this work, full bibliographic details including the author, title, awarding institution and date of the thesis must be given e.g. AUTHOR (year of submission) "Full thesis title", University of Southampton, name of the University School or Department, PhD Thesis, pagination
2 UNIVERSITY OF SOUTHAMPTON FACULTY OF ENGINEERING, SCIENCE AND MATHEMATICS OPTOELECTRONICS RESEARCH CENTRE FABRICATION AND APPLICATIONS OF LEAD-SILICATE GLASS HOLEY FIBRE FOR 1-1.5MICRONS: NONLINEARITY AND DISPERSION TRADE OFFS by Julie Leong Yeen Yeen Thesis for the degree of Doctor of Philosophy April 2007
3 UNIVERSITY OF SOUTHAMPTON ABSTRACT FACULTY OF ENGINEERING, SCIENCE AND MATHEMATICS OPTOELECTRONICS RESEARCH CENTRE Doctor of Philosophy FABRICATION AND APPLICATIONS OF LEAD-SILICATE GLASS HOLEY FIBRE FOR 1-1.5MICRONS: NONLINEARITY AND DISPERSION TRADE OFFS By Julie Leong Yeen Yeen This thesis describes the development of novel microstructured optical fibres (MOFs), namely holey optical fibres (HFs), based on a commercial highly nonlinear non-silica glass: lead silicate glass, for their specific incorporation in optical devices based on fibre nonlinearity and dispersive properties. For example, supercontinuum (SC) generation experiments using these structures are demonstrated. Together with the development of the novel fabrication techniques, the characterisation and applications of these fibres are presented, proving the advantages of HF technology in the implementation of highly nonlinear optical devices, as well as discussing their limitations. At the time of this study, soft glass HFs (SG-HFs) had just recently been identified as an alternative route towards extremely high nonlinearity HFs. Thus, very little was understood about the soft glass HF fabrication, and the factors that influence the optical properties of the HFs: propagation loss, fibre nonlinearity and dispersion. There had been little development towards SG-HF fabrication techniques that could be used to produce good quality fibres, nor the characterisation techniques that could be used to accurately measure the optical properties. Both the fabrication and characterisation techniques are essential for future SG-HF research and development, and for assessing what benefits SG-HFs may offer over their conventional counterparts and pure silica HFs in the small core, single mode regime. This research is targeted on the fabrication of HFs made by glasses other than silica, to further enhance fibre nonlinear effects and to tailor novel dispersion properties, such as anomalous dispersion in the visible and near-ir regions. This behaviour arises from the large contribution, in HFs, of the waveguide dispersion, to the total dispersion value. The use of soft glass with low softening temperatures (~420 0 C), has allowed the development of a novel fabrication technique for HF structured preforms: Extrusion, where a glass disc is forced through a die at elevated temperature near the softening point, whereby the die orifice determines the preform geometry. Wagon wheel (WW) structure was chosen as our design, where its microstructured region consists of three large air holes surrounding a very small core. We have established the maximum nonlinearity that can be achieved in this fibre at telecommunications wavelengths, and developed high nonlinearity fibre with dispersion-shifted characteristics suited for SC generation applications at 1.06 μm. Although the material loss in the soft glass is normally higher than its counterpart, silica, the massive nonlinear effects possible in HF made from the non-silica glass are counterbalanced by its high loss, of the order of few db/m. The complex structure, high nonlinearity SG-HFs are developed, aiming at shifting the zero dispersion wavelength (ZDW) to the 1.55 μm regime and offering an improved dispersion profile. A novel fibre fabrication approach: Structured Element Stacking Technique (SEST), which combined the best features of both extrusion and stacking and allows the production of the more complex preforms required to achieve good dispersion control in SG-HFs, is demonstrated. We demonstrated the fabrication of an SF57 SEST fibre with a ZDW within the C-band, a 3.2 db/m loss, and a γ value of 170 W -1 km -1. By taking the advantages of the zero dispersion of the HFs at 1 μm and 1.55 μm, the SC studies are carried out using these HFs (WW HFs and SEST HFs). Both of the fibre SC studies combined experimental and numerical results, and the simulations and experiments were in qualitative agreement. We observed a spectrum spanning over 1000nm by using just ~98 pj energy pulses in a 60cm piece of the WW HF. This demonstrated the advantage of SG-HFs in terms of compact devices and low power requirements.
4 List of Contents List of Contents List of Figures List of Tables Declaration of authorship Acknowledgments List of Abbreviations i vii xiv xvi xvii xix CHAPTER 1: Introduction to holey fibres 1.1 Background Motivation and objectives Organisation of the thesis References 16 CHAPTER 2: Holey Fibre (HF) 2.1 Introduction Guidance mechanisms Basic optical properties of MOFs Endlessly single-mode guidance Group velocity dispersion (GVD) Nonlinearity Applications Glass material choice Transmission and IR transmittance of the soft glasses Impact of OH content on IR transmission Refractive index of the glasses Material nonlinearity Material dispersion i
5 2.5.4 Viscosity Comparison of non-silica glasses as background material for HFs Non-silica glass based HF fabrication techniques State of the art: Examples of some significant fabricated non-silica HFs Conclusion: Why SF57 lead silicate glass is used? References 56 CHAPTER 3: HF optical properties measurement 3.1 Introduction General Experimental considerations Soft glass HF end preparation Launching light into soft glass HF Coupling from HF to the detector Mode profile Geometrical dimension of the fibre core Mode profile measurement Propagation loss Loss mechanism in small core extruded HFs Loss measurement Spot loss measurement Broadband loss measurement Effective mode area and nonlinearity Effective nonlinearity, γ, measurement Basic principle of the measurement approach Experimental setup Effective mode area measurement Dispersion Dispersion measurement Dispersion measurement for SEST HF at 1550nm Birefringence Birefringence measurement setup Basic principle of the measurement approach. 83 ii
6 3.8 Figure-of-merit (FOM) FOM for devices based on maximum useful fibre length FOM for compact device using 1m fibre length Conclusion References CHAPTER 4: Fabrication of simple structure soft glass HF 4.1 Introduction Fibre fabrication approach Preform making technique: Extrusion Principle of extrusion Extrusion apparatus Die characteristics Cleaning process Extrusion process parameters Defects of extruded elements Caning and fibre drawing Principle of fibre drawing Preform preparation before caning and fibre drawing Caning and fibre drawing process Bare/unclad Fibre fabrication WW HF design WW HF design targets WW HF fabrication scheme Results and discussion Extruded preforms Extrusion process parameter Defects of extruded elements Dimensional defects: die swell, taper and curvature Surface defects Extruded Cane Extruded HF Propagation loss 135 iii
7 Bare/ Unclad fibre Comparison of the loss spectral between the WW HF and the bulk glass WW HFs Effect of the core diameter on loss Effect of the die characteristic on the loss Effect of the fibre structure on the loss Effect of the defects and cleaning on the loss Effect of the temperature on the loss Conclusion Mode profile Nonlinearity Fibre design modeling and core size optimization Effective mode area and nonlinearity Dispersion Fibre design modelling Birefringence Figure-of-merit (FOM) for nonlinear performance Device based on maximum useful fibre length Compact devices using 1m fibre length Conclusion References. 161 CHAPTER 5: Fabrication of complex structure soft glass HF 5.1 Introduction Complex structure holey fibre design and modelling Fibre design target CAST and SEST design ring-element stacking SEST HF (1R-SEST) ring-element stacking SEST HF (2R-SEST) Complex structure HF fabrication Introduction SEST HF Fabrication scheme iv
8 5.3.3 Extrusion process and apparatus Die characteristics Results and discussion st experiment on 1-ring-element stacking technique: 1R-SEST Die design Extruded element Caning and structured element stacking R-SEST HF Characterisation nd experiment on improved 1-ring-element stacking technique: Improved 1R-SEST Die design Stacking preform Caning and stacking Improved 1R-SEST HF Characterisation Mode profile Propagation loss Mode area and Nonlinearity Dispersion rd experiment on 2-ring-element stacking technique: 2R-SEST R-SEST fibre th experiment on improved 2-ring-element stacking technique: 2+1 R-SEST Design and modelling Die design Extruded preform, caning and structured element stacking R-SEST Fibre Characterisation Conclusion References 216 v
9 CHAPTER 6: Non-silica glass high-nonlinearity dispersion-shifted HFs for efficient supercontinuum generation 6.1 Introduction Numerical model of the SC simulations Experiment setup Results and discussion SF57 WW HFs with ZDW at 1.06 μm SC experiment Comparison of simulations and experimental results SF57 SEST HFs with ZDWL at 1.55 μm SC experiment Phase matching modeling Comparison of simulations and experimental results Conclusion References CHAPTER 7: Conclusions and future directions References APPENDIX Appendix 1 : Measured refractive index data Appendix 2 (I) : Glass Disc Preparation 264 Appendix 2 (II) : Extrusion Process 265 Appendix 2 (III) : Cleaning Process: Glass disc and dies cleaning prior extrusion process Appendix 2 (IV) : Cleaning Process: Extruded preforms cleaning prior drawing. 268 Appendix 2 (V) : Annealing Appendix 3 : Other applications of the SEST HF List of Publications vi
10 List of Figures 1.1: The SEM images of (a), (b) index-guided fibre and (c), (d) optical bandgap guided fibre : Graph of the SF57 lead silicate bulk glass refractive index as a function of wavelength : Graph of the SF57 lead silicate bulk glass dispersion as a function of wavelength : Single material HF fabricated in 1973 by Kaiser and Astle [21] : Endlessly single-mode single material fibre fabricated in 1996 by Birks et al. [23] : A selection of large core and small core HFs examples fabricated in the ORC for particular applications : A selection of extruded small core non-silica HFs examples. (a) SF57 HFs, ORC [2-3], (b) SF6 HFs, Bath [27], (c) Tellurite HFs, Bath [7], (d) Improved SF57 HFs, ORC [4], (e) Bismuth oxide HFs, ORC [8] : A cross section of a HF with d, the hole diameter and Λ, the adjacent hole spacing : Transmission spectra of typical optical glasses: 1. pure silica glass, 2. Schott SF59 glass, 3. ORC in house tellurite glass, 4. ORC in house GLS glass [47] : Multiphonon edges for different glasses (this graph is provided by Dr H. Ebendorff- Heidepriem) : Bulk loss spectra of various glasses: SF57 lead silicate glass and bismuth oxide, measured using bulk samples of 1-30mm thickness and commercial spectrometers [14]. The inset shows the loss spectral in broader wavelengths : Relationship between refractive index n d and nonlinear refractive index n 2 of various optical glasses. (This graph was contributed by Dr. Xian Feng) : Material dispersion of a range of soft glasses. (This graph was contributed by Dr. T. M. Monro) : Temperature-viscosity curve of SF57 lead silicate glass. Inset: Viscosity of some other studied glasses: 1. tellurite glass, 2. Schott SF59 glass (lead borosilicate glass), 3. GLS glass, 4. pure silica glass (this graph is extracted from [47]) : The progress and versatility achieved to date in fabrication of highly nonlinear soft glass HFs : Progression of some significant non-silica HFs 53 vii
11 3.1: Scanning Electron Microscopy (SEM) images of the studied SF57 lead silicate HFs : Optical microscope images of some badly cleaved fibres. Note the imperfections around the holes and the cracks running between some of them : (a) Structure of an ASR (b) Definition of enclosed and triangular core diameter. The triangular core diameter is used for comparison with the ASR model [1] : (a) Definition of hexagonal core diameter for SEST HF (b) The diameter of the core is represented by the average of the 3 diameters. Note that the measurements in red are in pixel units and will then be converted into μm : Experimental setup for mode profile measurement : Some examples of mode profile of the studied HFs : Optical microscope images of the defects found in some extruded fibre preforms (these defects are in micron scale) : Optical microscope images of impurities (black particles) found in some extruded fibre preforms (these fine particles are in micron scale) : Spot/single wavelength loss measurement setup with ASE source : Spectral loss measurement setup with broadband white light source : A typical SPM spectrum generated by the propagation of a beat signal in the WW HF : Experimental setup of the nonlinear coefficient γ measurement : An example of phase shift vs. input power for a measured HF : Setup for dispersion characterization of SEST, based on interferometric techniques : Interference fringes in the spectrum obtained by OSA : SEM of the cross section of the WW HF and SEST HF : Experimental setup for beat length measurement using the wavelength scanning method : Scanned modulated spectral output from the OSA : The flow chart for the fabrication of the extruded HF : Schematic drawing of the ORC custom-designed extrusion apparatus : Parts and die for extrusion : The rough idea of surface quality of various dies fabricated through different techniques: conventional machine cutting and spark erosion (image provided by Dr. H. Ebendorff- Heidepriem) : The surface quality of dies fabricated through (a) the machine cutting technique without any coating and (b) the spark erosion technique where it is coated with dry lubricant, tungsten disulphide : Extrusion phases.102 viii
12 4.7: Schematic drawing of the ORC in house custom-designed fibre drawing tower : Schematic drawing of fibre drawing furnace : Assembly with one fused cane end : Ultrasonic drilled SF57 glass billet and unclad fibre machined cut stainless steel die : Unclad fibre extruded perform : A SEM image of a typical WW structured HF : Fabrication scheme of the extruded HFs : Extruded jacketing tube preform T : Extruded jacketing tube perform T : Extruded WW structured perform WW : Extruded WW structured perform WW : Defects found in T : A sketch of the tube T1 to point out where the defects are located : Defects found in T : A sketch of the tube T2 to point out where the defects are located : Defects found in WW : A sketch of the preform WW1 to point out where the defects are located : Defects accumulate beside the struts : Defects found in WW : A sketch of the preform WW2 to point out where the defects are located : High tension drawing will result in canes that have less curvature in their air lobes and long and thin struts : Loss spectrum of SF57 unclad fibre : Comparison of spectral curve for the 1.8μm core WW HF of ~2m and polished glass disc of thickness 33mm : Loss comparison between WW HF (F2) of different sizes : (a) Predicted mode profile of SF57 WW HF [9] showing modal field overlaps with the air holes within the HF which causes scattering loss due to surface imperfection and (b) typical measured WW HF loss versus core diameter at a wavelength of 1550nm for WW HFs F : The canes and the resulted end fibres. (a) Cane C1 and fibre F1 and (b) cane C2 and fibre F : (a) SEM image of the small core extruded SF57 HF (F3#3) with ~0.95 μm core and the enclosed area is the diameter of the circle that fits just inside the core region. (b) Measured mode profile for fibre F3#3 at core diameter of ~0.95 μm : Predicted mode profiles for fibre F3#3 of core diameter ~0.95 μm at (a) 1.06 μm and (b) 1.55 ix
13 μm : (a) SEM of the cross section of the extremely high nonlinearity WW HF (b) a circular solid core fibre surrounded by an air-cladding : Effective nonlinear coefficient at 1.55 μm and 1.06 μm (simulation performed by Dr. V. Finazzi) : Measured nonlinear phase shift as a function of input power for (a) F2#1 with D enclosed 1.2μm and (b) F2#3 with D enclosed 1.8μm at 1550nm : Curves of effective length for (a) F2#1 with D enclosed 1.2μm and (b) F2#3 with D enclosed 1.8μm at 1550nm and 1060nm : (a) Effective nonlinearity of ASRs and WW HFs as a function of triangular core diameter (b) Effective nonlinearity of simulated SEM of the real fibre structure and WW HFs as a function of core diameter : Simulated dispersion of bulk SF57 glass and HFs with different core diameters, using OFT by Dr. T. Monro : Simulated dispersion curves for bulk SF57 glass and HFs with different core diameters, using FEM by Dr. V. Finazzi : (a) Effective nonlinearity coefficient at 1.55 μm and 1.06 μm, and (b) zero-dispersion wavelength as a function of core diameter for our SF57 HF design. The lines F3#3 and F2#1 represent structures targeted and fabricated within our research : SEM of the cross-section of the WW HF with a beat length of ~3mm : Optical spectrum with removed spectral background : (a) SEM of the cross section of the extremely high nonlinearity WW HF (b) a circular solid core fibre surrounded by an air-cladding : Dispersion profiles of the WW HFs : (a) Calculated dispersion profile for pure silica HF [6] (b) Initial simulated dispersion profile of hexagonal stacking SF57 glass HF, showing the possibility of moving the ZDWL to 1550nm : Idealized SEST structures characterized by just 2 free-parameters, Λ is the hole spacing, and d is the hole size : Dispersion profiles for the idealised SEST HF, where the D <5ps/nm/km spanning from 1430nm to 1610nm is possible with an optimized structure (green curve) : (a) Dispersion profiles for the optimized SEST HF and the SF57 glass (Inset: an additional second ring of elements within the optimized SEST structure), (b) Predicted confinement loss of the idealised SEST HF for both 1-ring-element stacking and the 2-ring-element stacking x
14 designs at 1.55μm : Fabrication scheme of CAST fibres : Comparison of CAST and SEST HFs on the fibre drawing reduction ratio : Fabrication scheme of the SEST HFs : Sketch of extrusion set up and process for SEST preform fabrication : (a) 6-hole die set (b) 7-hole die set for SEST preform extrusion : Drawing of 6-pin-die and 7-pin-die for the 1 st experiment on 1-ring-element stacking 1R- SEST fibre fabrication : The schematic drawing for the die and the desirable geometry of the extruded element : (a) 14cm long of extruded jacketing tube of 12 mm OD/1.8mm ID, (b) cross sectional view of the jacketing tube, (c) jacketing tube with hexagonal inner : Extruded SF57 glass structured preforms (a) 6-hole preform, with hole size of ~ 1.0mm, hole spacing of ~3mm and diameter across the flat of ~9.2mm, (b) 7-hole preform, with hole size of ~ 1mm, hole spacing of ~2.2mm and diameter across the flat of ~9.0mm : The stack is tightly fitted inside the jacketing tube : Definition of measurement across the flat for the hexagonal elements is depicted by the red arrows : SEM of the 1R-SEST fibre : (a) IR image of the near-field pattern of 1R-SEST fibre when the light was launched into the fibre (b) SEM of 1R-SEST fibre : Drawing of 6-pin-die and 7-pin-die for the 2 st experiment on improved 1-ring-elementstacking Improved 1R-SEST fibre fabrication : Extruded SF57 glass structured preforms for 2 nd experiment, (a) 6-hole preform (b) 7-hole preform, for Improved 1R-SEST fibre fabrication : The evolution of the fibre structure from the start to the end of the pull : Definition of hexagonal core diameter for SEST HF. Note that the measurements in red are in pixel units and will then be converted into μm : Predicted and near-field profiles of HF# : SEST HF#1 seems to be effectively single mode from the simulation : The propagation loss at 1550nm vs the core diameter for Improved 1R-SEST HFs : Measured nonlinear phase shift as a function of input power for Improved 1R-SEST HF#3 with 2.4µm hexagonal core diameter : Effective nonlinearity coefficient at 1.55 µm as a function of core diameter with superposed measured data (Note that the SEST curve is calculated for the HF geometry corresponding to the fabricated fibre) : Dispersion profiles for the SEST HFs (inset: GVD at 1.55μm as a function of core diameter xi
15 for the SEST HFs) : Comparison between the dispersion profile of the WW HF and the fabricated SEST HF design : The evolution of the fibre structure from the start to the end of the pull : Optical micrograph of the 2R-SEST HF : 2+1 R-SEST structure with the labelled parameters, d1 and d : Development of SEST HFs :35: 2+1 R-SEST design with the optimised parameters :36: Dispersion profiles and predicted mode profile of the 2+1 R-SEST design : Drawing of (a) 18-pin-die and (b) 7-pin-die of the 2+1 R-SEST HF : The schematic drawing for the die and the desirable geometry of the 18-hole extruded element : The evolution of the 2+1 R-SEST fibre structure from the start to the end of the pull along the whole length : (a) SEM image of the 2+1 R-SEST HF with a missing inner hole (b) For the modeling purpose, the missing hole is included in the SEM image (c) The exact fibre structure is defined in black and white : (a) Predicted mode profile of the optimized 2+1 R-SEST HF at 1.55μm (b) predicted mode profiles of the exact 2+1 R-SEST HF at 1.55μm : Some basic optical properties of the 2+1 R-SEST HF based on the exact fibre SEM image : (a) The size of the 2+1 R-SEST fibre that has been scaled down to 80% (b) Some basic optical properties of the downscaled 80% 2+1 R-SEST fibre (c) The size of the 2+1 R- SEST fibre that has been scaled down to 60% (d) Some basic optical properties of the down scaled 60% 2+1 R-SEST fibre : Comparison of the power spectral density delivered into a SMF for various broadband light sources: ASE-source, incandescent lamp, SC source and SLEDs (this figure was extracted from [1]) : Schematic drawing of a typical experimental setup for SC generation using a femtosecond source and a short piece of highly nonlinear and dispersion tailored HF : Thorlabs 3-axis Microblock Flexure stage : (a) SEM image of the small core extruded WW HF, Fibre#1 with a core diameter of ~0.95 μm and the enclosed area is the diameter of the circle that fits just inside the core region. (b) Measured mode profile for the HF with a core diameter of ~0.95 μm at 1040nm xii
16 6.5: Optical properties of the WW HFs, Fibre#1 and Fibre #2: (a) spectral propagation loss for Fibre#1, spot loss measurement is conducted for Fibre #2, 2.5dB/m at 1550nm, (b) fibre effective nonlinearity at 1060nm and 1550nm and (c) dispersion : Simulated and experimental optical spectral at the output of the supercontinuum generation system for Fibre# : Simulated and experimental optical spectral at the output of the supercontinumm generation system for Fibre # : Dispersion curves for bulk glass and HFs with different core diameters : Schematic of the three stages of SC generation. (This diagram is extracted from [28]) : (a) SEM image of the extruded + stacked SEST HF, HF#1 with a core diameter of 4.2 μm (b) measured mode profile for SEST HF with a core diameter of 4.2 μm at 1040nm : Optical properties of the SEST HF, HF#1: (a) fibre effective nonlinearity at 1550nm and (c) dispersion over a wavelength range : The evolution of the SC as a function of launched pulse power after 1.02m of the SEST HF#1 with the zero dispersion at about 1550nm : An approximate dispersion profile of the SEST HF# : (a) Phase mismatch for the 1.55μm soliton of the SEST HF#1 (b) Phase matching for the SEST HF#1 assuming 25% coupling efficiency xiii
17 List of Tables 1.1: Measured values of refractive index n and nonlinear coefficient n 2 for several optical glasses at the optical wavelength λmeas : Time line of the optical fibre and MOF/holey fibre (HF) development : Optical properties, refractive indices and ZDW of different glasses. (The data was extracted from [14]) : D mat for different glasses at the two proposed pump wavelengths (1.06 and 1.55 μm) : Comparison of different optical glasses as background material : Comparison of the above practical techniques used in making HFs : Optical and thermal properties of SF57 lead silicate : The list of measured birefringence properties : A summary of the optical property measurements performed on both the WW HFs and SEST HFs shows the summary of the extrusion parameters for various tubes and WW extruded at different conditions shows the quality of the tubes and WW extruded under different conditions. (refer to table 4.4 for the extrusion conditions) : The summary of defects found in jacketing tubes under different extrusion conditions : The summary of defects found in the structured preforms : A summary of 3 cane samples (C1, C2 and C3) drawn : The dimensions and structural features of 3 WW HFs : F1,F2 and F3, measured from the SEM images : The ratio of struts length: struts thickness for fibres F1, F2, F3 and WW die : Fabrication conditions and loss properties of WW HFs extruded fibres. The propagation loss measurement was taken using a laser diode and whitelight source : The relationship between types of dies used with the loss of the fibre : SEM images, IR images of the near-field pattern of various core size WW HFs (sample from F2) : Comparison between the theoretical predictions and the measured results for the effective mode area and nonlinearity of the WW HFs. 148 xiv
18 4.12: Comparison between the measurement and modelling results : FOMs for silica, bismuth oxide, tellurite and lead silicate glass fibres : Comparison of WW, CAST and SEST HFs : Comparison between the properties of the initial CAST AND SEST HF designs : Dimensions of the original die and the extruded preforms : The dies and the structural features of the extruded elements and canes for 1R-SEST fibre fabrication : The dies and the structural features of the extruded elements and canes for Improved 1R- SEST fibre fabrication : Types of Improved 1R-SEST fibre : SEM images and IR images of the near-field pattern of various core sizes of improved 1-ring stacked element SEST : Improved 1R-SEST HFs and bare fibre losses : The results on the measurement and modelling of the fibre nonlinearity and effective mode area : The dies and the structural features of the extruded elements and canes for the 2+1 R-SEST design : List of selection for fibre/pump combination for SC generation : Parameters of the fs pump sources used in this study : List of WW HFs used for the SC generation experiment with pumping wavelength at ~1.06μm : List of SEST HF used for the SC generation experiment with pumping wavelength at ~1.55μm : The list of SEST HF#1 optical properties. 241 xv
19 Declaration of Authorship I, Julie Yeen Yeen Leong, declare that the thesis entitled " Fabrication and applications of lead-silicate glass holey fibre for 1-1.5microns: nonlinearity and dispersion trade offs" and the work presented in the thesis are both my own, and have been generated by me as the result of my own original research. I confirm that: this work was done wholly or mainly while in candidature for a research degree at this University; where any part of this thesis has previously been submitted for a degree or any other qualification at this University or any other institution, this has been clearly stated; where I have consulted the published work of others, this is always clearly attributed; where I have quoted from the work of others, the source is always given. With the exception of such quotations, this thesis is entirely my own work; I have acknowledged all main sources of help; where the thesis is based on work done by myself jointly with others, I have made clear exactly what was done by others and what I have contributed myself; I have published as part of Ph.D. work some of the research material contained within this thesis as journal and conference papers (see List of Publications). Signed:.. Date:. xvi
20 ACKNOWLEDGEMENTS This thesis marks the end of my long journey in obtaining my graduate degree in Optoelectronics. It is the product of many years of work, procrastination, changing minds and opinions, and a substantial amount of external assistance. This thesis would not appear in its present form without the kind assistance and support of the following individuals and organizations. Therefore, my last remaining task is to acknowledge all those people that have contributed to the work described in this thesis. This is an impossible task, given the many people that have helped to design, implement, apply, criticize, sponsor and evangelize the work. I am going to try anyway, and if your name is not listed, rest assured that my gratitude is not less than for those listed below. It is a pleasure to extend my sincere gratitude and appreciation to many people who have made this thesis possible. Firstly, a very special thank to my Ph.D. supervisor, Prof. Dave Richardson. I could not have imagined having a better advisor and mentor for my PhD, and without his knowledge, perceptiveness and cracking-of-the-whip, I would never have finished my thesis. It is difficult to overstate my gratitude to Prof. Dave Richardson, who has in every way been available as a resource, be it emotionally, socially, scholarly, or administratively. Throughout my thesis-writing period, he provided encouragement, sound advice, good teaching, and lots of good ideas. I would have been lost without his guidance. His timely comments were invaluable throughout. My overwhelming thanks go to my second supervisor, Dr. Xian Feng for the enthusiasm and inspiration, which was always there for me when I needed it. This thesis would not have been possible without the kind support, the trenchant critiques, the probing questions, and the remarkable patience of him. I cannot thank him enough. Simply put: Dr. Xian Feng rocks! His expertise in optical fibre fabrication and novel glasses improved my research skills and prepared me for future challenges. The road to my graduate degree has been long and winding, so I would also like to thank some people from the early days. Prof. Tanya Monro and Dr. H. Ebendorff- Heidepriem, were among those who kept me going at the beginning. They gave me the confidence and support, where I learned to believe in my future, my work and myself. I couldn't have made it without these sisters. xvii
21 Much thanks also to Dr. Eleanor Tarbox for the supervision that supervisors do not have time for, and for most of the proof-reading, and for being friends. She was a lifesaver, dropping everything at a moments notice to cross out, slash, comment, etc. with the eye of a knowledgeable technical scientific writer. Her work proved to be crucial in keeping much of the journalistic style out of this work. From the staff, Eveline Smith, Heather Spencer, Jenny Morley and some others deserve a special mention for their general support, care and attention, and for assisting me in many different ways. I am indebted to my colleagues, both past and present, from the Optoelectronics Research Centre (ORC), supported me in my research work. I want to thank them for all their help, support, interest, valuable hints and gave me a good head start to embark in this research area. Especially I am obliged to Roger Moore, Ken Frampton and Kenton Knight for the engineering support; Dr. Periklis Petropoulos, Symeon Asimakis, Dr. Jonathan Price, Dr. Andy Piper, Dr. Marco Petrovich and Dr. Wei Loh for their help in the holey fibres characterisations and productive scientific discussions; and Dr. Vittoria Finazzi, Francesco Poletti and Dr. Peter Horak for their computing expertise, excellent simulation and modelling work. I would also like to acknowledge the Malaysian government (MOSTE) and Universiti Tun Hussein Onn Malaysia (UTHM) for the scholarship during my years of research. I have lucky enough to have the support of many good friends. Life would not have been the same without my friends: Dr. Chong Yeng Leong, Kok Swee Leong, and those others who wanted to remain anonymous. I am grateful to them for helping me get through the difficult times, and for all the emotional support, camaraderie, entertainment, and caring they provided. Lastly, and most importantly, I wish to thank my parents in Malaysia, Leong Kok Chung and Lee Beng Aie. They bore me, raised me, supported me, taught me, and loved me. I am forever indebted to them for their understanding, endless patience and encouragement when it was most required. A big thank also dedicated to my elder sister, Angeline and brother, David, for their love and absolute confidence in me. Not forgetting, I would like to give my special thanks to Dr. Cheong Jun Yau, who shared my happiness and made me happy, and also for some very special moments when the going was tough. To them I dedicate this thesis. Julie xviii
22 List of abbreviations λ Λ γ σ η α c A eff AFF ASE ASR CAST CF d ESM FEM FOM fs FTIR FWM GVD HF HNL-DSF HNL-HF ID LIDAR LMA-HF MCVD MOF Optical wavelength Adjacent hole spacing, pitch Effective nonlinearity Tension Viscosity Confinement loss Effective mode area Air-filling fraction Amplified spontaneous emission Air suspended rod Capillary-stacking-technique Conventional fibre Hole diameter Effectively single mode Finite element method Figure-of-merit Femtosecond Fourier Transform Infrared Spectroscopy Four wave mixing Group velocity dispersion Holey fibre Highly nonlinear dispersion-shifted silica fibre Highly nonlinear HF Inner diameter Light detection and ranging Large mode area holey fibre Chemical vapour deposition process Microstructured fibre xix
23 MTIR n 2 NA n cl n co Nd:YAG n eff NIR NL OCT OD OFT OVD PBG PBGF PC PCF r RF RT SC SEM SEST SG-HF WW SM SMA-HF SPM SS SSFS V VAD V eff XPM Modified total internal reflection Kerr nonlinear coefficient for the glass Numerical aperture Cladding index Core index Neodymium-doped yttrium aluminum garnet Effective refractive index Near infrared Nonlinear Optical coherence tomography Outer diameter Orthogonal function technique Outside vapour deposition process Photonic bandgap guiding Photonic bandgap fibre Photonic crystals Photonic crystal fibre Core radius Radio frequency Room temperature Supercontinuum Scanning electron microscopy Structured-element-stacking Soft glass holey fibre Wagon Wheel Single mode Small mode area holey fibre Self phase modulation Stainless steel Soliton-self-frequency shift Normalised frequency Vapour phase axial deposition Effective normalised frequency Cross phase modulation xx
24 ZDW ZDWs Zero dispersion wavelength Zero dispersion wavelengths xxi
25 To succeed... you need to find something to hold on to, something to motivate you, something to inspire you. Tony Dorsett
26 CHAPTER 1 Introduction to holey fibres 1.1 Background Over the past 36 years, since the first development of low loss silica optical fibres (20dB/km at the He-Ne laser wavelength of 633nm) in 1970 by Corning Glass Works in the United States [1], conventional optical fibres have revolutionised communications and have become a vital means for many technologies, from medical imaging and sensing to high power applications, such as laser cutting, welding and machining in manufacturing, to active devices such as fibre lasers and amplifiers. Since then, major improvements have been made both in terms of glass manufacturing and in terms of optics applications. Here, it should be noted that conventional silica fibre has a pure silica cladding and a germania doped core, in order to have sufficient index contrast between core and cladding for guiding. The doping enhances the fibre attenuation (pure silica has the lowest theoretical loss, 0.15dB/km at 1.55mm). In recent years, a new class of optical fibre, known collectively as microstructured fibre (MOF) has emerged [2-7]. These fibres guide light by means of an arrangement of air holes running along the entire fibre length. MOF can be made entirely from a single material, as it does not rely on dopants for guidance. The vast majority of microstructured fibres (MOFs) produced to date are silica/air MOFs that contain air holes embedded in pure silica glass [2-7]. Although the first single material MOF was fabricated back in the early 1970 s by Kaiser et al. at Bell labs [8-9], the development of MOFs was actually triggered in 1996 by the discovery and demonstration of a new type of optical waveguide based on single material (pure silica) with single mode (SM) guidance over an extended wavelength range [2]. From then onwards, they have attracted enormous interest due to their spectrally unique
 (b) (c) (d) Figure 1.")


27 CHAPTER 1 Introduction to holey fibres 2 optical properties and a design flexibility that is not possible in conventional solid optical fibres. This opens up more diverse potential applications in telecommunications, metrology, biomedicine and the military fields among others. (a) (b) (c) (d) Figure 1.1: The SEM images of (a), (b) index-guided fibre and (c), (d) optical bandgap guided fibre. MOFs can be grouped into two distinct categories, defined by the light guiding mechanisms in the fibres (See the two typical examples of these fibres that are shown in Figure 1.1): (1) index-guided MOFs, which guide light due to the principle of modified total internal reflection (MTIR), are also known as holey fibres (HFs). This mechanism is similar to the way in which conventional step-index fibres guide light, but the wavelength scale features in a HF lead to a strongly wavelength dependent cladding index. The air holes along the fibre act to lower the effective refractive index in the cladding region, and so the light is confined to the solid core, which has a relatively higher index. The basic operation of index-guided MOFs does not rely on the periodicity of the holey array. Even the randomly arranged holey cladding can still work for this type of MOFs [10]. (2) Photonic bandgap guiding (PBG) MOFs, which guide light due to the photonic bandgap effect and the frequencies located in the bandgap are trapped in the core and cannot leak through the cladding [4-7]. This type of
28 CHAPTER 1 Introduction to holey fibres 3 periodic lattice is analogous to the lattice of a crystal, but with the lattice constants at the scales of the optical wavelengths. This is the origin of photonic crystals (PC). Photonic bandgap guiding can only happen in the optical fibre with a low-index core (say air) and a photonic crystal cladding. However, please note that photonic bandgap fibres (PBGFs) are only discussed briefly and not considered in any detail in the work presented in this thesis. Additionally, the so-called photonic crystal fibre (PCF) should be a MOF with a photonic crystal cladding and a high-index core or a low-index core. And scientifically, a high-index core with a PC cladding should have both index-guiding and bandgap guiding mechanisms involved, but the former is dominant. In this thesis, I will only focus on the index-guiding HFs. In contrast to the conventional fibres (CFs), HFs can be made from a single material type, which can eliminate the problems induced by the core/cladding interface of the two different glasses type, such as finding materials that are both thermally and chemically compatible, and that also possess a sufficiently large refractive index difference. The design flexibility of the HFs is based on the freedom in the specification of size, shape and the hole arrangement combined with the flexibility in the properties of the solid material. The effective refractive index of the cladding can vary strongly as a function of the wavelength of light guided by the fibre. In addition, the typical methods of HF fabrication are extremely flexible and thus permit a wide range of fibre geometries to be envisaged. As a result of these two main factors, a whole host of novel and unique optical properties, which are impossible to achieve in CFs is enabled, such as endlessly single mode guidance [11], anomalous dispersion at wavelengths down to 560nm and large normal dispersion at 1550nm for silica HFs. Dispersion and form birefringence are two properties that can depend strongly on the cladding configuration, particularly when the hole-to-hole separation is small. Also, HFs can have mode areas ranging across three orders of magnitude by scaling the dimensions of the features within the fibre structure [12]. The large mode area HFs (LMA-HFs), where Λ, the adjacent hole spacing, is larger
29 CHAPTER 1 Introduction to holey fibres 4 than the wavelength (Λ 5μm), allow high power transmission systems and high power lasers [13-16], whereas at the other extreme, small mode area HFs (SMA-HFs) with features in the wavelength-scale (Λ 3μm), have a large nonlinearity which can be used for devices based on nonlinear effects, such as wavelength conversion, all optical switching, pulse compression, supercontinuum (SC) generation and soliton formation [17-22]. Note that the modes of all single-material HFs are leaky modes because the core index is the same as that beyond the finite holey cladding, and for some designs, this can lead to significant confinement loss [23]. One of the most promising practical applications of HF technology is the opportunity to develop fibres with an extremely high optical nonlinearity per unit length, with a nonlinearity of times greater than in CFs [24], which is again not possible by using standard optical fibre technology. Modest optical powers within such small core highly nonlinear HFs (HNL-HFs) can induce significant nonlinear effects. The nonlinear effects can be used for a wide range of optical processing applications in various areas from medical to metrology, military and telecommunication among others, and the device examples include wavelength converters, parametric amplifiers, SC sources and switches. They are attractive candidates for applications in future high-capacity, all-optical networks. Consequently, it is generally desirable to develop fibres with high values of effective nonlinearity (γ) per unit length in order to reduce the physical length and/or required operating powers, and to maximize the operating bandwidth of many such devices. Early device demonstration of pure silica HNL-HFs were reported in 2001 and 2002 and concerned 2R regeneration and optical thresholding at 1550nm [17, 25]. Even though silica glass does not possess an intrinsically high nonlinearity, the combination of small core sizes and high numerical aperture (NA) in HNL-HFs can result in tight mode confinement within the core and high optical sensitivities even for modest powers. The measurement commonly used for determining the fibre nonlinearity is the effective nonlinearity (γ), and it is defined as [26]: γ=2πn 2 /λa eff 1.1 where n 2 is the material nonlinear coefficient, A eff is the effective mode area and λ is
30 CHAPTER 1 Introduction to holey fibres 5 the optical wavelength. n 2 is defined from n(i) = n 0 + n 2 I, where n(i) is the total refractive index of the material, and I is the optical intensity (W/m 2 ) of the incident beam, respectively, applied with the laser beam. The n 2 for the pure silica is 2.2x10⁻²⁰ m 2 /W. Conventional single mode step index fibres, e.g. standard Corning SMF28 fibre has γ=1w -1 km -1. By decreasing the core size and increasing the germanium concentration in the core of the conventional silica step index fibres (which acts to increase the n 2 ), values of γ as large as 20W -1 km -1 have been achieved [27]. Both modifications act to confine light more tightly within the fibre core, and thus increase the γ by reducing the A eff. However, with the CF designs, the NA that can be achieved limits the nonlinearity of the fibre. In contrast, with HF technology, significantly larger NA than CFs can be produced because the cladding region can be mostly comprised of air. To date, silica HFs with A eff as small as 1.5μm 2 at 1550nm have been demonstrated, corresponding to γ~70w -1 km -1 [19]. This is 70 times higher than in standard telecommunication fibre and 3.5 times greater than the highest reported nonlinearity in the CFs. SMA-HFs can also exhibit a range of novel dispersive properties. In SMA- HFs, the waveguide contribution to the chromatic fibre dispersion can be large, in particular for small Λ and large air-filling fraction (AFF). This allows the dispersion to be tailored to suit the demands for a range of nonlinear applications. By modifying the fibre profile, it is possible to control both the magnitude and sign of the dispersion profiles of relevance for nonlinear device applications, such as extremely high values of anomalous and normal dispersion at 1550nm [28], anomalous dispersion at short wavelengths [29, 30], broadband dispersion-flattening [31] and multiple zero dispersion wavelengths (ZDWs) [32]. These unusual dispersion properties can be utilised in a variety of ways. For example, by decreasing the Λ and increasing the relative hole size d/λ of a silica HF, the zero dispersion wavelength (ZDW) can be shifted to shorter wavelengths down to 560nm [21]. SMA-HFs can also exhibit anomalous dispersion down to 550nm which has made soliton generation in the near- IR and visible spectrum possible for the first time [30]. Shifting the ZDW to regimes where there are convenient high power laser sources (Ti:sapphire at 800nm, Yb-fibre at 1000nm, Nd:YAG at 1060nm, erbium-doped fibre lasers at 1550nm and Tm-fibre at 2000nm), also allows the development of efficient SC sources [20, 33-38], which
31 CHAPTER 1 Introduction to holey fibres 6 are particularly attractive for a host of applications such as DWDM transmitters [39], optical coherence tomography (OCT) [40], optical frequency metrology [41], spectroscopy [42], ultra-precise optical clock, high power with low-noise source for device characterisation and etc. It is also possible to design HNL-HFs with normal dispersion at 1550nm [28] as fibres with low values of normal dispersion are advantageous for optical thresholding devices based on self phase modulation (SPM) [17] and wavelength converters based on cross phase modulation (XPM)[18], since small normal dispersion reduces the impact of coherence degradation in a nonlinear fibre device. Also, parametric oscillators and wavelength converters based on four wave mixing (FWM) require small normal dispersion to achieve efficient phase matching [9, 43]. In addition to the value, the slope of the dispersion is crucial, where ultra-flat dispersion at the wavelength range of interest enhances the useful spectral bandwidth of the nonlinear devices [37, 44]. SMA-HFs offer a way of creating highly birefringent fibres by asymmetric core/cladding structures, which is of interest for stable operation of nonlinear devices. In particular for small Λ and large d/λ, any slight deviation from the symmetry will result in considerable birefringence. This type of birefringence is known as form birefringence and can be large if the index contrast between the core-cladding region is high and also if the core and cladding features are similar in scale to the wavelength of light. Highly birefringent HFs have been produced using different hole sizes and/or asymmetric hole arrangement [17, 45-50] and beat lengths down to 0.3mm have been achieved [45, 46]. In contrast to the CFs, the birefringence of HFs increases towards longer wavelengths as a result of the strong wavelength dependence of the cladding refractive index, which raises the core-cladding index difference [51]. Moreover, as I mentioned above, using HF technology, based on the high index-contrast between the core and cladding in HF, which arises from high indexcontrast between glass (for silica n=1.44 at 1550nm) and air (n=1), almost all the light can be confined within the core area and an extremely small guiding mode area for the fundamental mode can be achieved. This design is useful despite the fact that pure silica glass is not intrinsically high in nonlinearity and the maximum achievable γ so far is ~70W -1 km -1 in a pure silica HF [19]. However, choosing a glass with a higher
32 CHAPTER 1 Introduction to holey fibres 7 refractive index (n) than silica and a nonlinear refractive index (n 2 ), the effective mode area A eff (in Equation 1.1) can be further reduced and the effective nonlinearity γ can be greatly enhanced with the decrease of the A eff and the increase of n 2. Non-silica glasses, including heavy metal oxide (lead oxide or bismuth oxide) containing glasses, tellurite glasses, and chalcogenide glasses etc, have times higher Kerr (note that the nonlinear effect hereafter means Kerr nonlinear effect) nonlinear coefficients (χ (3) and n 2 = f(χ (3) )) than that of pure silica, have gained popularity for HF production recently [52-61]. Combining together the high nonlinearity of soft glasses and the available HF technology, it should be feasible to develop HFs with extremely high effective nonlinearity and achieve the novel nonlinear fibre devices based on the consequent HFs. In addition, soft glasses also offer benefits in terms of transmission wavelengths, enabling access up to the mid-ir. Obviously, high nonlinearity non-silica glasses are potential materials for nonlinear devices. Despite their promise, non-silica glass fibres have yet to find widespread application owing to the difficulty in fabricating low loss single mode soft glass fibres using conventional fibre fabrication techniques (at the time when I first started the research). In [66], Monro et al., for the first time, showed how HF technology may be used as a powerful solution for producing single mode soft glass fibres (SG-HFs). HF technology offers single material fibre designs to avoid core/cladding interface problems and this should potentially allow low loss fibres to be drawn from a wide range of novel soft glasses. In addition, the HF geometry also dramatically increases the range of possible optical properties, mainly enhanced nonlinearity and interesting dispersion properties. Comparatively, non-silica glasses possess much lower processing temperature than silica glass. As a result, the low-temperature processing approaches for making fibre preforms and drawing fibre can be adapted for fabricating non-silica glass fibres. The extrusion technique has been developed for fabrication of structured non-silica glass preforms [52-58]. This approach simplifies the fabrication process, especially in the small core, high NA regime, where the structured preforms can be produced in one step without labour-intensive stacking. The first extruded HF demonstrating
33 CHAPTER 1 Introduction to holey fibres 8 single mode guidance and nonlinear enhancement was reported in [34], based on a non-silica material, i.e. commercially available Schott SF57 lead silicate glass. High effective nonlinearity γ of ~550W -1 km -1 and small effective mode area A eff of 3.0±0.3μm 2 were achieved at the wavelength of 1550nm. This γ is 550 times larger than conventional single mode silica (SMF28) fibre, while this A eff is ~30 times smaller than the single mode silica fibre. 1.2 Motivation and objectives To date, most HF device applications are concentrated on the use of small core silica HFs, which have around ~50-70 times of the nonlinearity of standard telecommunication single mode fibres (SMF28). The SMA-HFs can have high values of nonlinearity per unit length and therefore nonlinear optical devices based on these fibres can be much shorter in length and operate at lower power levels than devices based on conventional fibre types. Thus, this has reduced the typical power length product requirements of such devices to the 10W.m level. By choosing soft glasses with several hundred times more nonlinearity than the standard CFs as the background material for the fibres, it should ultimately allow sub-meter or sub-watt devices to be realised. Thus, non-silica HFs have the huge potential for practical nonlinear fibre devices for a variety of application areas including future high capacity optical communication systems, medicine, metrology and spectroscopy etc. For most nonlinear fibre applications, control of the fibre dispersion is as important as achieving the maximum possible nonlinearity per unit length. The use of HF technology provides this unique opportunity by varying the hole diameter and hole-to-hole spacing. By using non-silica glasses as the background material for the HFs, the difference in the material dispersion of soft glasses allows a broader range of fibre dispersion profiles to be achieved than is possible with conventional fibre technology. The aim of this project is to develop a highly nonlinear non-silica glass HFs
34 CHAPTER 1 Introduction to holey fibres 9 with tailorable dispersion properties, focussing in particular on the use of the type SF57, a commercial lead silicate soft glass, which possesses interesting nonlinear properties and which is an easy glass to work with. The simple-structured HFs ( in this thesis, the fibres are named as Wagon Wheel (WW) HFs) are targeted to achieve ZD at a wavelength of 1060nm for broadband soliton and SC generation applications, while the complex-structured HFs (here we named these fibres as structured-elementstacking (SEST) HFs) are targeted to achieve ZD at a wavelength of 1550nm with a flattened dispersion profile. This particular wavelength is of great interest for nonlinear applications in telecommunications such as wavelength conversion, alloptical regeneration etc. There are two main requirements for fibres in nonlinear devices: (1) Firstly, the fibre should have nonlinearity per unit length as high as possible to allow the development of compact devices using short fibre lengths and operating at low input powers, (2) Secondly, the other requirement is dispersion management to meet the demands of a certain nonlinear device. At the start of this project (July, 2003), SG-HFs had just recently been identified as an alternative route towards extremely high nonlinearity SMA-HFs, with the publication of just a few papers detailing the fabrication and characterisation of such SG-HFs [54, 55]. This demonstrated the huge potential that SG-HFs could offer in terms of small mode area, single mode regime, with very high nonlinearities for making compact nonlinear devices with low operating power, in which CF and silica HF techniques are limited by the ability to reliably create high core-cladding index contrast that leads to very tight mode confinement. However, highly nonlinear SG- HFs commonly exhibit higher losses than their silica counterparts due to higher losses of the bulk glasses itself, also due to the fact that the fabrication development of the SG-HFs is still at its infancy. At 1550nm, the ultimate loss limit for pure silica has been found to be 0.14dB/km [69], whereas the standard fibres exhibit losses of 0.20dB/km and, to date, the lowest loss obtained in HFs is 0.28dB/km [70]. Typically, the losses of SG-HFs fabricated to date are in the range of 2-5dB/m [52-61]. However, with the very high nonlinearities of these fibres, it is predicted that they will decrease the required fibre lengths to 1m, and thus a loss value below 1dB/m can be tolerated. To achieve higher nonlinearity, we moved to glasses with a higher refractive
35 CHAPTER 1 Introduction to holey fibres 10 index than silica so that it is possible to access material nonlinearities that are orders of magnitude larger than that of silica. Some examples are shown in Table 1.1. The Schott lead-silicate glass, SF57 was chosen as it is a stable glass to work with for the extrusion processes. It has a n of 1.81 at 1550 nm, and n 2 of 4.1x10⁻¹⁹ m 2 /W, which is 20 times more nonlinear than silica (n=1.44 and n 2 = (2.2x10⁻²⁰ m 2 /W) (refer to Chapter 2.5 for further SF57 glass information). Table 1.1: Measured values of refractive index n and nonlinear coefficient n 2 for several optical glasses at the optical wavelength λmeas. Glass n n 2 (m 2 /W) λmeas (μm) Refs. Silica x [26] SF x [62] SF x [62] SF x [52] As 2 S x [63] Tellurite ~2 ~5.0 x [64] GLS x [65] GLSO x10-18 ~1.5 [65] In addition, nonlinear effects are highly sensitive to the dispersive properties of the SG-HFs. So the ability to tailor dispersion, combined with the extremely small mode areas that can be achieved in HFs, leads to the possibility of realising highly efficient nonlinear processes, particularly SC generation, where the conversion of a single wavelength into a broad spectrum occurs as a result of complex interplay between a whole host of nonlinear effects [67, 68]. This cascade process can be used to generate a broad, flat, continuum spanning from UV to IR wavelengths by engineering the dispersion to optimise the nonlinear effects for a given pumped wavelength. Generally, SC generation requires flat and ZD at various laser source wavelengths. The SC process exploits the high peak powers available from modelocked femtosecond or picosecond lasers such as neodymium-doped yttrium aluminum garnet (Nd:YAG), that provides a pumping wavelength at ~1060nm, erbium-doped fibre lasers, which provide a pumping wavelength at ~1550nm and others which have been discussed in the earlier section. Both the demands of high nonlinearity and dispersion management can be met by using SG-HFs with small cores and a high air-filling fraction. The wavelength-scale features and high index
36 CHAPTER 1 Introduction to holey fibres 11 contrast in these fibres allow the tailoring of the fibre properties over a broad range, which is not possible with conventional fibres. Figure 1.2 shows the wavelength dependence of refractive index, i.e., dispersion, of SF57 bulk glass. The graph of the dispersion over a wavelength range, μm, for a SF57 bulk glass is illustrated in Figure 1.3, that was generated using the Sellmeier equation, which expresses the refractive index as a function of the optical wavelength. The generalized Sellmeier equation is: n = A0 + A1 λμ + A2λ μ + A3λ μ + A4λ μ + A5λ μ where λ μ is the wavelength in microns, n is the linear refractive index and A are the Sellmeier coefficients for certain optical glasses. Using this Sellmeier fit, the material dispersion can be evaluated over a broad wavelength range. For each glass considered, the measured (linear) refractive index data is fitted by a generalized Sellmeier equation. Both the raw refractive data and the (fitted) Sellmeier coefficients for SF57 glass is given in Appendix 1. From Figure 1.3, it is seen that the ZDW of the bulk SF57 glass is at 1970nm and the dispersion is anomalous at the wavelengths larger than 1970nm. The material dispersions are about -250ps/nm/km and - 50ps/nm/km at 1060nm and 1550nm respectively. In my study, the high nonlinearity HFs to be fabricated are targeted to achieve ZDW at both the wavelengths of 1060nm and 1550nm. In order to achieve these ZDs in the near infrared regime, large waveguide dispersion is necessary to compensate for the large normal material dispersion. This can be attained by using HFs with small cores and large air/glass index contrast. Figure 1.2: Graph of the SF57 lead silicate bulk glass refractive index as a function of wavelength.
37 CHAPTER 1 Introduction to holey fibres 12 Figure 1.3: Graph of the SF57 lead silicate bulk glass dispersion as a function of wavelength. The vast majority of HF preforms produced to date have been fabricated using the conventional stacking technique where capillary tubes are stacked in a hexagonal configuration, and the central capillary can then be replaced with a solid glass rod, which eventually forms the fibre core. This stacked fibre type offers large freedom in structural design such as high complexity and periodic geometry and thus in the engineering of dispersion. The drawback of stacking is that the preform fabrication is labour-intensive. In recent years, the use of soft glass with low softening temperatures (~420 0 C) has allowed the development of a novel fabrication technique for HF structured preforms: Extrusion. Extrusion is a method for producing a section of workpiece by forcing a billet to flow through a die, and the die orifice determines the preform geometry. This technique is commonly used for manufacturing metal, polymer and glass workpieces. During extrusion, the material should have plastic-like deformability. For glass, the extrusion can only be done within the viscosity range of poise [71], where the glass shows the Newtonian or quasi-newtonian flow behaviour. Extrusion is a controlled and reproducible approach for fabricating glass preforms with complex structures and good surface quality. Furthermore the complex structured preforms for HFs can be simply produced by extrusion without stacking from tens to hundreds of capillaries. Extrusion can also be used to produce structures that could not be made with the capillary stacking method, i.e. SMA-HFs with a very high air filling fraction that are ideally suited for exploring nonlinear effects. Thus, a significantly broader range of properties should be accessible in extruded HFs.
38 CHAPTER 1 Introduction to holey fibres 13 However, due to the mechanical limit of the die materials, the extrusion technique is currently still not able to directly fabricate a glass preform with multiple rings (>3 rings). Hence, a combination of both capillary stacking and the extrusion approach should offer a practical route towards many-hole SG-HFs. In summary, the objectives within my research presented here are thus threefold: (1) To attempt to enhance the fibre fabrication technique in order to reduce the fibre loss, at the same time, increase the effective nonlinear length of the fibre. (2) To use the novel HF fabrication technique, namely extrusion to produce the structured preforms that can be potentially drawn into fibres which can achieve the maximum possible γ for SF57 SMA_HFs by using air-suspendedcore structure. (3) To attempt the dispersion control of the SG-HFs for telecommunications and SC generation applications by extending and improving the previous extrusion technology. In order to fulfil these objectives, it is also essential to be able to accurately characterise the important optical design properties of HFs such as fibre mode profile, propagation loss, γ, effective mode area, birefringence and dispersion in order to enable comparative studies with other relevant fibres and also to validate these with theoretical modelling techniques developed by my colleagues. 1.3 Organisation of the thesis This report is an accumulation of the work I have performed during my PhD study, showing the various tasks I have performed along with some of the results obtained in the extruded highly nonlinear HFs development. I have organised the thesis by firstly providing a fundamental overview of the area of HFs, especially on the highly nonlinear HFs, their basic optical properties and unique optical features, by comparing them with CF and comparing silica HFs with non-silica based HFs. The
39 CHAPTER 1 Introduction to holey fibres 14 motivation and objectives of this research are also stated here. This thesis is accordingly divided into 6 chapters as follows:- Chapter 2 includes the reviews of the history of HF development, the HF guidance mechanisms, HF optical properties such as endlessly single-mode guidance, group velocity dispersion, nonlinearity and its application in various fields especially SC generation. In addition, this chapter also describes the current state-of-the-art nonsilica preform fabrication techniques, i.e. capillary stacking, extrusion, drilling and casting. Knowledge gained of the key issues and the key physical parameters during the HF fabrication are also discussed here. Lastly, this chapter summarises the review of the glass material choice, glass issues, optical properties and thermal properties, in terms of the fibre fabrication, emphasising studies on the lead silicate Schott SF57 glass. Chapter 3 describes the principles behind the characterisation techniques used in the measurement of HF optical properties, which includes the measurements for propagation loss, mode profile, nonlinearity, group velocity dispersion and birefringence. Methods to determine the figure of merit (FOM) of the highly nonlinear small core HFs are also discussed. Chapter 4 focuses upon the fabrication technique of the simple structure SF57 WW HFs, designed to achieve maximum γ with reduced loss at 1060nm. The dispersion characteristics of this highly nonlinear small core HF design can also be manipulated to create fibres with a ZDW at 1060nm. The overview of the general fabrication approach such as the extrusion parameters namely the speed of extrusion, pressure and time etc, are discussed. Defects in the extruded jacketing tube and structured preform are examined. Practical issues during fibre fabrication are also described. Chapter 5 describes the fabrication of the complex structure SF57 SEST HFs. The aim of this new structure is to achieve ZDW at the telecommunication wavelength, 1550nm. Taking into consideration that the WW HFs offer extremely high nonlinearities but allow for only relatively limited dispersion control around
40 CHAPTER 1 Introduction to holey fibres nm, it is therefore concluded that a design of a far more complex arrangement of air holes than a simple air-suspended core (WW HF design) is required for dispersion management in a HF. However, the fabrication of soft glass multi-ring HFs by a stacking method is proven to be problematic due to the glass fragility. The extrusion technique is also not suited to fabricating this type of structure in one step, due to the many small holes that are required in such a structure. Hence, we developed an alternative fabrication approach which combined the best features of both extrusion and stacking techniques to allow the production of the more complex preforms required to achieve good dispersion control in the soft glass HFs. The development of the SEST HFs is presented in this chapter, describing the trials that were performed in order to achieve the optimised SEST structure. Chapter 6 explores the limits of nonlinearity and dispersion control in SF57 lead-silicate based HFs for SC generation applications. The combination of HF technology and non silica soft glasses can potentially be used to exploit the fibre nonlinearity and achieve broad SC generation in the near infrared (NIR) region. The fundamental material properties of non-silica soft glasses can enhance SC generation across the wavelengths of interest. The ZDW of the fibre is strongly dependent on the choice of material, and one particularly attractive option is to shift the fibre zero dispersion to 1.0 and 1.5µm, to offer the potential to use Nd:glass fs lasers and erbium-doped fibre lasers respectively to generate the SC and allowing synergy with NIR nonlinear application work. Our focus has been on establishing the maximum nonlinearity that can be achieved in these fibres at telecommunications wavelengths, and to develop high nonlinearity fibres with dispersion-shifted characteristics suited for SC generation applications at 1.06 μm and 1.55μm. This chapter is devoted to the SC studies we carried out using the two types of fibres produced (WW HFs (Chapter 4) and SEST HFs (Chapter 5)). We present both experiments and numerical simulations and discuss how the properties of each of the fibres affected the broadened spectra. This thesis ends with Chapter 7, which is the conclusion and future directions with regard to my work throughout my PhD and also serves to map out the ideas that can be carried out in the future.
41 CHAPTER 1 Introduction to holey fibres References 1. F. P. Kapron, D. B. Keck, and R. D. Maurer, Radiation losses in glass optical waveguides, Appl. Phys. Lett. 17(10), (November 1970). 2. J. C. Knight, T. A. Birks, P. St. J. Russell and D. M. Atkin, All-silica single-mode photonic crystal fibre, Opt. Lett. 21, (1996). 3. T. M. Monro, D. J. Richardson, Holey optical fibres: Fundamental properties and device applications, C.R. Phys. 4, (2003). 4. J. C. Knight, Photonic crystal fibres, Nature 424, (2003). 5. Philip St. J. Russell, Photonic crystal fibres, Science 299, pp (2003). 6. R. F. Cregan, B. J. Mangan, J. C. Knight, T. A. Birks, P. St. J. Russell, P. J. Roberts, and D. C. Allan, Single mode photonic band gap guidance of light in air, Science 285, (September 1999). 7. C. M. Smith, N. Ventkataraman, M. T. Galagher, D. Muller, J. A. West, N. F. Borelli, D. C. Allan, K. W. Koch, Low-loss hollow-core silica/air photonic bandgap fibre, Nature 424, (2003). 8. P. Kaiser, E. A. J. Marcatili, and S. E. Miller, A new optical fibre, The Bell Syst. Tech. J. 52(2), (February 1973). 9. P. Kaiser and H. W. Astle, Low-loss single-material fibres made from pure fused Silica, The Bell Syst. Tech. J. 53(6), (July-August 1974). 10. T. M. Monro, P. J. Bennett, N. G. R. Broderick, and D. J. Richardson, Holey fibres with random cladding distributions, Opt. Lett. 25(4), (February 2000). 11. T. A. Birks, J. C. Knight and P. St. J. Russell, Endlessly single-mode photonic crystal fibre, Opt. Lett. 22, (1997) 12. T. M. Monro, D. J. Richardson, N. G. R. Broderick, and P. J. Bennett, "Holey optical fibres: An efficient modal model," J. Lightwave Technol. 17, (1999). 13. J.C. Baggett, T.M. Monro, K. Furusawa, D.J. Richardson, Comparative study of large-mode holey and conventional fibres, Opt. Lett. 26, (1999).
42 CHAPTER 1 Introduction to holey fibres J.C. Baggett, T.M. Monro, K. Furusawa, V. Finazzi, D.J. Richardson, Understanding bending losses in holey optical fibres, Opt. Commun. 227, pp (2003). 15. K. Furusawa, A. Malinowski, J.H.V. Price, T.M.Monro, J.K. Sahu, J.Nilsson, D.J. Richardson, Cladding pumped ytterbium-doped fibre laser with holey inner and outer cladding, Opt. Express 9, pp (2001). 16. J. Limpert, T. Schreiber, S. Nolte, H. Zellmer, A. Tunnermann, R. Iliew, F. Lederer, J. Broeng, G. Vienne, A. Petersson, C. Jacobsen, High-power air-clad large-mode-area photonic crystal fibre laser, Opt. Express 11, pp (2003). 17. J.H. Lee, P.C. Teh, Z. Yusoff, M. Ibsen, W. Belardi, T.M. Monro, D.J. Richardson, A holey fibre-based non-linear thresholding device for optical CDMA receiver performance enhancement, IEEE Photon. Technol. Lett. 14, pp (2002). 18. J.H. Lee, Z. Yusoff, W. Belardi, M. Ibsen, T.M. Monro, D.J. Richardson, "A tunable WDM wavelength converter based on cross-phase modulation effects in normal dispersion holey fibre," IEEE Photonics Technology Letters 15, pp (2003). 19. J.H. Lee, W. Belardi, K. Furusawa, P. Petropoulos, Z. Yusoff, T.M. Monro, D.J. Richardson, "Four-wave mixing based 10-Gb/s tunable wavelength conversion using a holey fibre with a high SBS threshold," IEEE Photonics Technology Letters 15, pp (2003). 20. J.K. Ranka, R.S. Windeler, A.J. Stentz, "Visible continuum generation in air-silica microstructure optical fibres with anomalous dispersion at 800 nm," Optics Letters 25, pp (2000). 21. J.C. Knight, J. Arriaga, T.A. Birks, A. Ortigosa-Blanch, W.J. Wadsworth, P. Russell, "Anomalous dispersion in photonic crystal fibre," IEEE Photonics Technology Letters 12, pp (2000). 22. J.H.V. Price, T.M. Monro, K. Furusawa, W. Belardi, J.C. Baggett, S. Coyle, C. Netti, J.J. Baumberg, R. Paschotta, D.J. Richardson, "UV generation in a pure-silica holey fibre," Applied Physics B-Lasers and Optics 77, pp (2003). 23. T.P. White, R.C. McPhedran, C.M. de Sterke, L.C. Botten, and M.J. Steel, "Confinement losses in microstructured optical fibres," Opt. Lett. 26, (2001). 24. N.G.R. Broderick, T.M. Monro, P.J. Bennett, D.J. Richardson, Nonlinearity in holey optical fibres: measurement and future opportunities, Opt. Lett. 24, (1999).
43 CHAPTER 1 Introduction to holey fibres P. Petropoulos, T.M. Monro, W. Belardi, K. Furusawa, J.H. Lee, D.J. Richardson, "2R-regenerative all-optical switch based on a highly nonlinear holey fibre," Optics Letters 26, pp (2001). 26. G. P. Agrawal, Nonlinear Fibre Optics, 2nd ed. (Academic Press, Inc., 1995). 27. T. Okuno, M. Onishi, T. Kashiwada, S. Ishikawa, and M. Nichimura. Silica-based functional fibres with enhanced nonlinearity and their applications, IEEE Quantum Electron 5, (1999). 28. T. A. Birks, D. Mogilevstev, J. Knight, and P. S. Russell, Dispersion compensation using single-material fibres, IEEE Phot. Techn. Lett. 11, (1999). 29. D. Mogilevstev, T.A. Birks, and P. St. J. Russell, Group-velocity dispersion in photonic crystal fibres, Opt. Lett. 23, (1998). 30. J.C. Knight, J. Arriaga, T.A. Birks, A. Ortigosa-Blanch, W.J. Wadsworth, and P.St.J Russell, Anomalous dispersion in photonic crystal fibre, IEEE Photon. Technol. Lett. 12, (2000). 31. A. Ferrando, E. Silvestre, and P. Andres, Designing the properties of dispersion-flattened photonic crystal fibre, Opt. Express 9, 687 (2001). 32. K. M. Hilligsøe, T. Andersen, H. Paulsen, C. Nielsen, K. Mølmer, S. Keiding, R. Kristiansen, K. Hansen, and J. Larsen, "Supercontinuum generation in a photonic crystal fibre with two zero dispersion wavelengths," Opt. Express 12, (2004). 33. W.J. Wadsworth, A. Ortigosa-Blanch, J.C. Knight, T.A. Birks, T.P.M. Man, P.S. Russell, "Supercontinuum generation in photonic crystal fibres and optical fibre tapers: a novel light source," Journal of the Optical Society of America B-Optical Physics 19, pp (2002). 34. S. Coen, A.H.L Chau, R. Leonhardt, J.D. Harvey, J.C. Knight, W.J. Wadsworth, P.S.J. Russell, "Supercontinuum generation by stimulated Raman scattering and parametric four-wave mixing in photonic crystal fibres," Journal of the Optical Society of America B-Optical Physics 19, pp (2002). 35. A. Ortigosa-Blanch, J.C. Knight, P.S.J. Russell, "Pulse breaking and supercontinuum generation with 200-fs pump pulses in photonic crystal fibres," Journal of the Optical Society of America B-Optical Physics 19, pp (2002).
44 CHAPTER 1 Introduction to holey fibres J.M. Dudley, L. Provino, N. Grossard, H. Maillotte, R.S. Windeler, B.J. Eggleton, S. Coen, "Supercontinuum generation in air-silica microstructured fibres with nanosecond and femtosecond pulse pumping," Journal of the Optical Society of America B-Optical Physics 19, pp (2002). 37. T. Yamamoto, H. Kubota, S. Kawanishi, M. Tanaka, S. Yamaguchi, "Supercontinuum generation at 1.55 mu m in a dispersion-flattened polarization-maintaining photonic crystal fibre," Optics Express 11, pp (2003). 38. M. Lehtonen, G. Genty, H. Ludvigsen, M. Kaivola, "Supercontinuum generation in a highly birefringent microstructured fibre," Applied Physics Letters 82, pp (2003). 39. Z. Yusoff, P.C. Teh, P. Petropoulos, K. Furusawa, W. Belardi, T.M. Monro, D. Richardson, 24 channels x 10GHz spectrally sliced pulse source based on spectral broadening in a highly nonlinear holey fibre, Proc. Optical Fibre Communications Conference (OFC 2003), Atlanta, Georgia, 2003, paper FH3 40. I. Hartl, X.D. Li, C. Chudoba, R.K. Ghanta, T.H. Ko, J.G. Fujimoto, J.K. Ranka, R.S. Windeler, "Ultrahigh-resolution optical coherence tomography using continuum generation in an air-silica microstructure optical fibre," Optics Letters 26, pp (2001). 41. R. Holzwarth, T. Udem, T.W. Hansch, J.C. Knight, W.J. Wadsworth, P.S.J. Russell, Optical frequency synthesizer for precision spectroscopy, Phys. Rev. Lett. 85, pp , H. Kano, H. Hamaguchi, "Characterization of a supercontinuum generated from a photonic crystal fibre and its application to coherent Raman spectroscopy," Optics Letters 28, pp (2003). 43. J.E. Sharping, M. Fiorentino, P. Kumar, R.S. Windeler, "Optical parametric oscillator based on four-wave mixing in microstructure fibre," Optics Letters 27, pp (2002). 44. K.P. Hansen, "Dispersion flattened hybrid-core nonlinear photonic crystal fibre," Optics Express 11, pp (2003). 45. K. Furusawa, T.M. Monro, P. Petropoulos, D.J. Richardson, "Modelocked laser based on ytterbium doped holey fibre," Electronics Letters 37, pp (2001). 46. J.H.V. Price, K. Furusawa, T.M. Monro, L. Lefort, D.J. Richardson, "Tunable, femtosecond pulse source operating in the range mu m based on an Yb3+-doped holey fibre amplifier," Journal of the Optical Society of America B-Optical Physics 19, pp (2002).
45 CHAPTER 1 Introduction to holey fibres T.P. Hansen, J. Broeng, S.E.B. Libori, E. Knudsen, A. Bjarklev, J.R. Jensen, H. Simonsen, "Highly birefringent index-guiding photonic crystal fibres," IEEE Photonics Technology Letters 13, pp (2001). 48. A. Ortigosa-Blanch, J.C. Knight, W.J. Wadsworth, J. Arriaga, B.J. Mangan, T.A. Birks, P.S.J. Russell, "Highly birefringent photonic crystal fibres," Optics Letters 25, pp (2000). 49. K. Suzuki, H. Kubota, S. Kawanishi, M. Tanaka, M. Fujita, "Optical properties of a low-loss polarization-maintaining photonic crystal fibre," Optics Express 9, pp (2001). 50. G. Millot, A. Sauter, J.M. Dudley, L. Provino, R.S. Windeler, "Polarization mode dispersion and vectorial modulational instability in airsilica microstructure fibre," Optics Letters 27, pp (2002). 51. A. Peyrilloux, T. Chartier, A. Hideur, L. Berthelot, G. Melin, S. Lempereur, D. Pagnoux, P. Roy, "Theoretical and experimental study of the birefringence of a photonic crystal fibre," Journal of Lightwave Technology 21, pp (2003). 52. V.V.R.K. Kumar, A.K. George, W.H. Reeves, J.C. Knight, P.S. Russell, F.G. Omenetto, A.J. Taylor, "Extruded soft glass photonic crystal fibre for ultrabroad supercontinuum generation," Optics Express 10, pp , (2002). 53. V.V.R.K. Kumar, A.K. George, J.C. Knight, P.S. Russell, "Tellurite photonic crystal fibre," Optics Express 11, pp (2003). 54. K.M. Kiang, K. Frampton, T.M. Monro, R. Moore, J. Tucknott, D.W. Hewak, D. J. Richardson, Extruded singlemode non-silica glass holey optical fibres, Electron. Lett. 38, pp (2002). 55. T.M. Monro, K.M. Kiang, J.H. Lee, K. Frampton, Z. Yusoff, R. Moore, J. Tucknott, D.W. Hewak, H.N. Rutt, D.J. Richardson, High nonlinearity extruded single-mode holey optical fibres, Proc. Optical Fibre Communications Conference (OFC 2002), Anaheim, California, 2002, postdeadline paper FA P. Petropoulos, T.M. Monro, H. Ebendroff-Heidepriem, K, Frampton, R.C. Moore, H.N. Rutt, D.J. Richardson, Soliton-self-frequency-shift effects and pulse compression in anomalously dispersive high nonlinearity lead silicate holey fibre, Proc. Optical Fibre Communications Conference (OFC 2003), Atlanta, Georgia, 2003, postdeadline paper PD P. Petropoulos, H. Ebendorff-Heidepriem, V. Finazzi, R.C. Moore, K. Frampton, D.J. Richardson, T.M. Monro, "Highly nonlinear and anomalously dispersive lead silicate glass holey fibres," Optics Express 11, pp (2003).
46 CHAPTER 1 Introduction to holey fibres H. Ebendroff-Heidepriem, P. Petropoulos, V, Finazzi, K. Frampton, R.C. Moore, D.J. Richardson, T.M. Monro, Highly nonlinear bismuth-oxidebased glass holey fibre, Proc. Optical Fibre Communication Conference (OFC 2004), Los Angeles, California, 2004, paper ThA4 59. J. Y. Y. Leong, S. Asimakis, F. Poletti, P. Petropoulos, X. Feng, R. Moore, K. Frampton, T. M. Monro, H. Ebendorff-Heidepriem, W. Loh, and D. J. Richardson, Towards zero dispersion highly nonlinear lead silicate glass holey fibres at 1550nm by structured-element-stacking, presented at the European Conference in Optical Communication, Glasgow, United Kingdom, Sep.2005, paper Th4.4.5 (Postdeadline). 60. J. Y. Y. Leong, S. Asimakis, F. Poletti, P. Petropoulos, X. Feng, R. Moore, K. Frampton, T. M. Monro, H. Ebendorff-Heidepriem, W. Loh, and D. J. Richardson, Nonlinearity and Dispersion Control in Small Core Lead Silicate Holey Fibres by Structured Element Stacking, presented at the Optical Fibre Communication Conference, Anaheim, California, U.S.A., 5-10 Mar. 2006, paper OTuH X. Feng, T.M. Monro, P. Petropoulos, V. Finazzi, D. Hewak, "Solid microstructured optical fibre," Optics Express 11, pp (2003). 62. S. R. Friberg and P. W. Smith, "Nonlinear Optical-Glasses for Ultrafast Optical Switches," IEEE J. Quantum Electron 23, (1987). 63. M. Asobe, Nonlinear Optical Properties of Chalcogenide glass fibres and their application to all-optical switching, Opt. Fibre Tech. 3(2), (April 1997). 64. J.S. Wang, E.M. Vogel, E. Snitzer, Tellurite glass: a new candidate for fibre devices, Opt. Mater. 3, pp (1994). 65. J. Requejo-Isidro, A. K. Mairaj, V. Pruneri, D. W. Hewak, M. C. Netti, and J. J. Baumberg, Self refractive non-linearities in chalcogenide based glasses, J.Non-Cryst. 317(3), ( March 2003). 66. T.M. Monro, Y.D. West, D. W. Hewak, N. G. R. Broderick and D.J.Richardson, Chalcogenide holey fibres, Electron. Lett. 36, (2000). 67. J.Hermann, U.Griebner, N.Zhavoronkov, A.Husakou, D.Nickel, J.C.Knight, W.J. Wadsworth, P.St.J. Russell, and G.Korn, Experimental evidence for supercontinuum generation by fission of higher-order solitons in photonic fibres, Phys. Rev. Lett. 88, (2002). 68. A.V.Husakou and J.Hermann, Supercontinuum generation, four-wave mixing, and fission of higher-order solitions in photonic-crystal fibres, J. Opt. Soc. Am. B 19, (2002).
47 CHAPTER 1 Introduction to holey fibres K. Tajima, J. Zhou, K. Kurokawa, and K. Nakajima, Low water peak photonic crystal fibres, ECOC 2003, Rimmi, Italy, 42-43, Postdeadline paper Th M. Saito, H. Yamaguchi, A. Kakiuchida, J. Ikushima, K. Ohsono, and Y. Kurosawa, Limit of the Rayleigh scattering loss in silica fiber, Appl. Phys. Lett. 83, (2003). 71. X. Feng, A. K. Mairaj, D. W. Hewak et al., "Nonsilica glasses for holey fibres," J. Lightwave Technol. 23 (6), , (2005).
48 CHAPTER 2 Holey Fibre (HF) 2.1 Introduction Photonic crystal fibres (PCFs), also known as microstructured optical fibres (MOFs) or holey fibres (HFs), are a class of microstructured fibre which possess a solid core surrounded by a cladding region that is defined by a fine array of air holes that extend along the full fibre length. It should be noted that, since the field is still relatively young, and also because different researchers have developed their own preferences, some different terms of fibre description may appear in research papers, reference books and other publications. However, throughout this thesis, we will use the term Holey Fibre (HF) as our choice of general term describing the index guiding optical fibre. HFs are typically made of a single material, usually pure silica with refractive index, n=1.5, but now, non-silica HFs that are made of soft glass or polymer have been developed [1-10]. HFs guide light through a modified form of total internal reflection since the volume average index in the solid core region of the fibre is greater than that of the surrounding microstructured cladding. The advent of HF technology has enabled the design and fabrication of optical fibres with unique and enabling optical properties, opening a diverse range of new scientific and technological opportunities [11, 12]. The air-filled holey cladding leads to unique guidance properties such as photonic bandgaps at optical wavelengths, a very large core with endlessly single mode guidance, high nonlinearity, supercontinuum generation and soliton effects, polarization maintenance and high birefringence. Design opportunities for dispersion management arise and promise various novel applications. These unique optical properties, for example, endlessly single mode guidance [13], result directly from the way that the guided mode experiences the
49 CHAPTER 2 Holey Fibre (HF) 24 microstructured cladding region. In a conventional fibre, this is, to first order, independent of wavelength. However, in an HF, the large index contrast between glass and air and the small structural dimensions combine to make the effective cladding index strongly wavelength dependent. Moreover, the large index contrast itself allows for more extreme values of numerical aperture (NA) than can be achieved by using conventional doped fibre technology. The structural design space for HFs is also very rich and these factors combined ensure that HFs can have a substantially broader range of optical properties than conventional optical fibres. Also, compared to the conventional fibre, there is more flexibility in the fabrication of HFs with specific optical properties. HFs based on new materials such as polymer and soft glass are currently being developed; good transparency in the infrared (IR) and a greater spectral range should be obtainable using these materials. Thus, the introduction of these new materials to HFs offers an alternative approach for realising practical fibres in various wavelength ranges [14], especially the mid-infrared (mid- IR) region for soft glasses. In 1970, the first low loss silica fibre with the loss value of 20dB/km at μm was fabricated by the researchers in Corning [15, 16]. In the 1970 s, the first single-mode HF was produced by Kaiser et al. (Bell labs) [17, 18]. As shown in Figure 2.1, the fibre consists of a small diameter rod supported on a thin, polished plate in the centre of a larger diameter jacketing tube and it is made from pure fused quartz. This is indeed an air-suspended core fibre. The aim of developing this kind of fibre was to achieve fibre attenuation as low as the material attenuation of pure silica, because there was only a single material involved in this kind of fibre. The idea of single-material fibre indeed could challenge the conventional silica core/cladding fibres. Unfortunately, the measurement showed that this single-material fibre had relatively high loss (2.5dB/km at ~1.1μm [19]), which was mainly due to the residual contamination during the fabrication, and no significant progress was made after those studies. However, in less than a decade, the attenuation of conventional core/cladding silica fibres, based on the modified chemical vapour deposition (MCVD) technique, was rapidly decreased to 4dB/km at μm in 1973 [20] and 0.2dB/km at 1.55μm in 1979 [21], which was very close to the theoretical predicted value (0.15dB/km in silica fibre). Consequently, this type of single-material fibres has
![CHAPTER 2 Holey Fibre (HF) 25 vanished completely. Figure 2.1: Single material HF fabricated in 1973 by Kaiser and Astle [21]. The PCF, i.e., the fibre with a periodically arranged photonic crystal cladding was firstly proposed by Birks in the ORC in 1995 [23] and was then successfully fabricated by Knight et al.](/docs-images/93/112354489/images/50-0.jpg "in 1996 (see Figure 2.2) [13]. The fibre possessed unique optical properties which cannot be obtained by conventional fibre designs.")

50 CHAPTER 2 Holey Fibre (HF) 25 vanished completely. Figure 2.1: Single material HF fabricated in 1973 by Kaiser and Astle [21]. The PCF, i.e., the fibre with a periodically arranged photonic crystal cladding was firstly proposed by Birks in the ORC in 1995 [23] and was then successfully fabricated by Knight et al. in 1996 (see Figure 2.2) [13]. The fibre possessed unique optical properties which cannot be obtained by conventional fibre designs. With a strong demand for high performance optical fibre, the importance of HFs has become widely recognised in recent years. Since then, the explosive growth of interest in silica HFs was fueled by the many unusual, novel and useful optical properties exhibited by many newly designed HFs, many of which are impossible to achieve using conventional optical fibres. Silica HF development is now at the state of art as the technology is now maturing. To date, the lowest propagation loss of 0.28dB/km (at 1.55μm) [24, 25] was achieved in an index-guided silica holey fibre. Good reproducibility is attained through well controlled fibre fabrication, a wide range of optical properties is clearly understood and a broad range of devices for high power delivery, supercontinuum generation, optical switches etc have been demonstrated [26]. A selection of HFs has been fabricated in the ORC, as shown in Figure 2.3. Figure 2.2: Endlessly single-mode single material fibre fabricated in 1996 by Knight et al. [13].
![CHAPTER 2 Holey Fibre (HF) 26 To date, most of the HFs were fabricated from silica glass, although recently non-silica HFs (soft glasses [27-28, 1-9] and polymer [10]) have been fabricated.](/docs-images/93/112354489/images/51-0.jpg "Soft glasses offer a range of properties that are not possible in silica such as high IR transmittance, high material nonlinearity and large rare-earth solubility, which makes them attractive")

51 CHAPTER 2 Holey Fibre (HF) 26 To date, most of the HFs were fabricated from silica glass, although recently non-silica HFs (soft glasses [27-28, 1-9] and polymer [10]) have been fabricated. Soft glasses offer a range of properties that are not possible in silica such as high IR transmittance, high material nonlinearity and large rare-earth solubility, which makes them attractive materials for optical fibres. The fabrication of soft glass HF has been demonstrated for lead silicate glasses [2-5, 9, 27-28], heavy metal oxide glasses [7-9, 29] and lanthanum-gallium-sulphide glass [1]. The material nonlinearity of soft glasses [30] can be more than one order of magnitude larger than that of silica [5]. The combination of highly nonlinear glass composition and small core, high NA HF geometry allows a further dramatic increase of the fibre nonlinearity. This has made the soft glass HFs particularly promising for nonlinear applications at various technologically interesting wavelength ranges. Table 2.1 summarises the time line of the development of the MOF/HF. Figure 2.3: A selection of large core and small core HFs examples fabricated in the ORC for particular applications.
 SF57 HFs, ORC [2-3], (b) SF6 HFs, Bath [27], (c) Tellurite HFs, Bath [7], (d) Improved SF57 HFs, ORC [4], (e) Bismuth oxide HFs, ORC [8]. Table 2.")
.")
 is introduced. 1979 The loss of single mode doped silica fibre was reduced to 0.2 db/km @ 1.55 μm.")
![1995 Concept of fibres with photonic crystal cladding proposed by Birks [23]. 1996 First working fused silica HF by Knight.](/docs-images/93/112354489/images/52-3.jpg "2000 First non-silica HF using Chalcogenide glass was fabricated.")
![[1] 2001 First polymer HF was fabricated [10] 2002 First extruded single mode SF57 soft glass HF was developed (Figure 2.4a) [2-3].](/docs-images/93/112354489/images/52-4.jpg "Extruded SF6 HF for supercontinuum generation was developed (Figure 2.4b) [27]. 2003 Extruded SF57 HF with nonlinearity of γ=640w -1 km -1 at 1550nm was fabricated (Figure 2.")
52 CHAPTER 2 Holey Fibre (HF) 27 (a) (b) (c) (d) (e) Figure 2.4: A selection of extruded small core non-silica HFs examples. (a) SF57 HFs, ORC [2-3], (b) SF6 HFs, Bath [27], (c) Tellurite HFs, Bath [7], (d) Improved SF57 HFs, ORC [4], (e) Bismuth oxide HFs, ORC [8]. Table 2.1: Time line of the MOF/HF development Year Achievement 1973 Single mode doped silica fibre ( μm). Outside vapour deposition process (OVD) introduced. First example of MOF/HF was fabricated by Kaiser Pure silica structured fibre was fabricated (3 1.1 μm). Single material MOFs were proposed as a low loss approach to doped core fibres. Chemical vapour deposition process (MCVD) was introduced Vapour phase axial deposition (VAD) is introduced The loss of single mode doped silica fibre was reduced to μm Concept of fibres with photonic crystal cladding proposed by Birks [23] First working fused silica HF by Knight First non-silica HF using Chalcogenide glass was fabricated. [1] 2001 First polymer HF was fabricated [10] 2002 First extruded single mode SF57 soft glass HF was developed (Figure 2.4a) [2-3]. Extruded SF6 HF for supercontinuum generation was developed (Figure 2.4b) [27] Extruded SF57 HF with nonlinearity of γ=640w -1 km -1 at 1550nm was fabricated (Figure 2.4d) [5]. Soho HF, first solid core-cladding of non-silica MOF was fabricated [6]. Extruded Tellurite HF with min loss of 2.3dB/m at 1055m was developed (Figure 2.4c) [7]. Extruded Bismuth HF with higher refractive index was developed Extruded Bismuth HF with very high nonlinearity of γ=1100w -1 km -1 at 1550nm was fabricated (Figure 2.4e) [8]. Extruded SF57 HF with very high nonlinearity and low loss, 2dB/m achieved [9].
![CHAPTER 2 Holey Fibre (HF) 28 Tellurite HF with very low loss, 0.18dB/m with nonlinearity of γ=675w -1 km -1 at 1550nm was reported [31].](/docs-images/93/112354489/images/53-0.jpg "2005 Extruded one dimensional Bragg fibre was fabricated [ 32 ] Extruded SF57 HF with record nonlinearity of γ=1860w -1 km -1 at 1550nm and ZD at ~1µm was fabricated (Figure 2.4d) [33].")
53 CHAPTER 2 Holey Fibre (HF) 28 Tellurite HF with very low loss, 0.18dB/m with nonlinearity of γ=675w -1 km -1 at 1550nm was reported [31] Extruded one dimensional Bragg fibre was fabricated [ 32 ] Extruded SF57 HF with record nonlinearity of γ=1860w -1 km -1 at 1550nm and ZD at ~1µm was fabricated (Figure 2.4d) [33]. Stacking Chalcogenide glass HFs were fabricated. [34] Extruded and stacking SF57 HF (SEST) with nonlinearity of γ=170w -1 km -1 at 1550nm and ZD at ~1550nm was fabricated [35]. 2.2 Guidance mechanisms Light in MOFs can be guided by two different guidance mechanisms, which are the average-index effect and the photonic bandgap effect. The hole diameter (d), the adjacent hole spacing, pitch (Λ) and their ratio d/λ, are the critical design parameters used to specify the structure of an HF and they are typically on the dimension scale of the wavelength of light λ [13] as illustrated in Figure 2.5. Figure 2.5: A cross section of a HF with d, the hole diameter and Λ, the adjacent hole spacing. Historically, the initial name used for MOF is Photonic crystal fibre (PCF). PCF is the general definition for both classes (index guided and photonic bandgap guided) because its periodic arrangement of the holes of the cladding region is an example of a photonic crystal [13]. To distinguish the two guidance mechanisms, the index-guiding fibres are generally called holey fibre (HF) because their operation does not depend on the fibres periodic lattice, while the fibre that guides light using the photonic bandgap effect is addressed as photonic bandgap fibre (PBGF).
54 CHAPTER 2 Holey Fibre (HF) 29 In contrast to the conventional fibres in which different materials are used to provide an index boundary between the core and cladding, HFs are made of a single material. The average index effect HFs possess a solid core and surrounding air holes that serve as index decreasing elements (as in Figure 2.5). In another words, the effective refractive index of the cladding region is lower than that of the solid core due to the presence of the air holes. Thus, light is basically guided by a modified form of total internal reflection. It should, though, be noted that a periodic structure is not required in order to obtain guidance by average index effects [11, 12]. This is why light can also be guided by randomly distributed air holes in the cladding [36]. There is another class of microstructured fibre in which the periodic arrangement of air holes is required to ensure light guidance. This type of fibre is referred to as PBGF as discuss earlier on. In PBGFs, the periodic arrangement of holes in the cladding region of the fibre leads to the formation of a photonic band gap in the transverse plane of the fibre. Frequencies within this band gap cannot propagate in the cladding and are thus confined to propagate within the core which itself acts as a defect in the periodic structure [23, 37]. These PBGFs can be designed to have transmission windows centred at near-infrared wavelengths [23]. Our research focuses upon the HFs that guide light by means of the average index mechanism. 2.3 Basic optical properties of HFs Endlessly single-mode guidance The most notable of all the unusual optical properties of HFs is the ability of a HF to guide a single mode at all wavelengths, a phenomenon known as endlessly single mode guidance, which can be explained here via an analogy with step index fibres.
55 CHAPTER 2 Holey Fibre (HF) 30 In a conventional optical fibre, the light propagation is due to total internal reflection at the core-cladding interface. The light travels through the core by constantly reflecting from the cladding because the refractive index of the core is higher than that of the cladding. In a conventional step index fibre of core radius r, core index n co and cladding index n cl, the normalised frequency V is used to determine the number of guided modes in a fibre. For the fibre to be single-moded, the V value must be less than [38]. V = 2πr/λ (n 2 co-n 2 cl) 2.1 Since, for conventional single mode fibres, the core and cladding indices are only weakly wavelength dependent, conventional fibres are multimode for light of short wavelength, λ. Contrary to conventional fibres, the first interesting property found in HFs was endlessly single mode guidance [13]. The HFs cladding thus contains discrete and periodic changes of refractive index profile across the fibre cross section. Birks et al. introduced the effective index model where the complex air-glass cladding structure is regarded as a medium with an effective refractive index, n eff, and then the entire structure is approximated as a step index fibre, to which an exact analytical solution exists [13]. V eff = 2πΛ/λ (n 2 eff) (2.2) It is demonstrated that the effective normalised frequency, V eff can always be below a certain value (V eff <2.405) and the appropriately designed HF can thus always be single-moded regardless of the operating wavelength, λ. This can be explained as follows: as the wavelength decreases, the overlap between the mode and the cladding region decreases, thus the effective cladding index decreases and the normalised frequency V eff is kept almost constant. This dispersion behaviour counteracts the explicit dependence of V eff on wavelength, λ, and so extends the single mode range.
56 CHAPTER 2 Holey Fibre (HF) Group velocity dispersion (GVD) For most nonlinear fibre applications, control of the fibre dispersion is more important than achieving the maximum possible nonlinearity per unit length, and here, again, the use of HF technology provides unique opportunities. The small core dimensions possible in HFs with a high cladding air-fill fraction result in a strong wavelength dependence of the effective cladding index which affects both the magnitude and spectral profile of the waveguide dispersion. This can be used to control the total fibre dispersion over extended wavelength ranges compared to conventional solid fibres. For example, in silica glass HFs it is possible to achieve anomalous dispersion at visible wavelengths, i.e. at wavelengths much shorter than the material zero dispersion wavelength (ZDW), allowing soliton formation at wavelengths shorter than 600nm (note that the material ZDW for silica is 1300nm) [7]. Mogilevstev et al. showed that HFs can exhibit novel dispersion properties such as zero-dispersion wavelengths (ZDWs) below 1.28μm using fused silica HFs [39]. The non-silica HFs technology is still in its infancy, thus the range of dispersion properties possible in the non-silica HFs is still being researched, and only just starting to be understood. Similar benefits in terms of controlling the dispersion properties of fibres at wavelengths of technological interest can be obtained in soft glass HFs. For many applications, the sign and magnitude of the fibre dispersion are as critical to device functionality and performance as the magnitude of the nonlinearity. In particular, anomalous dispersion is required to make use of soliton effects whereas near-zero dispersion is crucial for supercontinuum generation [4]. Most nonlinear soft glasses have highly normal material dispersion at 1550nm (refer to Figure 2.10). Fortunately, the HF geometry affects the waveguide dispersion drastically, allowing the highly normal material dispersion to be overcome. Kumar et al. showed that it is possible to achieve near zero dispersion at 1550nm by using commercially available Schott Glass SF6 (lead silicate glass) [27] and, by extending to smaller core design and a higher nonlinearity glass (SF57, another lead silicate glass), it is possible to operate in the anomalous dispersion region, even though the material dispersion is even higher for SF57 [2]. It should be appreciated that the material ZDW for SF57
57 CHAPTER 2 Holey Fibre (HF) 32 glass is ~1.97 μm; yet, it is possible to use the large waveguide dispersion available in SF57 HFs to obtain fibres with ZDWs shifted by more than 1000nm to allow efficient SC generation when pumped at wavelengths around 1μm [33]. Recently, we successful demonstrated a SF57 lead silicate HF that has a ZDW lies around 1550nm[35], and more over, it is single moded at that wavelength, in contrast to other silica HFs [35] that produced SC using 800nm pump sources, which had ZDWs around 800nm [ 40] Nonlinearity Nonlinear effects in fibre can be used for a wide range of optical processing applications in telecommunications and beyond. Consequently, there is a great interest in developing fibres with high effective nonlinearity per unit length in order to reduce device lengths and the associated optical power requirements for fibre-based nonlinear devices. There are three main classes of physical effects that are caused by optical fibre nonlinearity: stimulated Brillouin scattering (SBS), stimulated Raman scattering (SRS) and optical Kerr effects [41]. The optical Kerr effect, which is the refractive index change that occurs due to high light intensities, leads to various secondary effects such as self phase modulation (SPM), Cross phase modulation(xpm) and four wave mixing (FWM) [37,41]. Small core, large NA, HFs are of interest in this research work. The development of these fibres has allowed the realization of fibres with a high effective nonlinearity per unit length. Arguably one of the most exciting prospects for microstructured fibre technology is the development of fibres with large values of optical nonlinearity per unit length,γ, γ = 2πn 2 /(λa eff ) 2.3
58 CHAPTER 2 Holey Fibre (HF) 33 where n 2 is the Kerr nonlinear coefficient for the glass, A eff is the effective mode area and λ is the optical wavelength. Fibres with a small core dimension and a cladding with a large air fill fraction allow for extremely tight mode confinement, i.e. small effective area, and hence a high value of γ [30]. For example, standard SMF28 fibre has an A eff of ~90μm 2 at 1550nm, and since n 2 of silica is ~2.2x10⁻²⁰ m 2 /W, γ is of order of 1 W -1 km -1. In conventional step-index fibres, this value has been increased to 20 W -1 km -1 by decreasing the core size and increasing the germanium concentration in the core [42]. In small core HFs, tight mode confinement is provided by the large index contrast between air and glass, and to date, the pure silica HFs that equate A eff ~1.3μm 2 with values of γ=70w -1 km -1 at 1550nm, which is ~3.5 times greater than the highest reported nonlinearity in CFs, have been demonstrated [43]. This is close to the ultimate limit that can be achieved in silica, restricted by the nonlinear refractive index n 2 of this glass and the minimum achievable effective area [44]. This shows that even though silica glass does not possess a high intrinsic material nonlinearity, the combination of small core sizes and high NA in these fibres leads to tight mode confinement and high optical sensitivities even for modest power [41]. The nonlinearity that can be achieved in any fibre is limited by the mode confinement of a fibre. Significantly higher values of γ can be achieved by combining tight mode confinement with the use of non-silica glasses with greater intrinsic material nonlinearity coefficients than silica. In order to achieve higher values of γ, materials with larger values of n 2 are particularly promising candidates. The n 2 of soft glasses can be more than an order of magnitude larger than that of silica. Examples of suitable glasses that have been used to make HFs include chalcogenide [1], tellurite [7, 31], bismuth-oxide [8] and lead silicate glasses [2-5, 9, 27-28]. It has been shown that it is possible to extend HF fabrication techniques to such glasses and the SF57 lead silicate HFs with a record nonlinearity of γ=1860w -1 km -1 [33], which is more than 1800 times larger than the standard single mode silica fibre (SMF), have been demonstrated. In short, the emergence of HF technology is particularly enabling in terms of making fibres in these more exotic glasses since it allows fibres to be made from just a single material, eliminating the need for two thermally and chemically compatible glasses with sufficient index mismatch to form the fibre core and cladding.
59 CHAPTER 2 Holey Fibre (HF) Applications HFs with extremely small solid glass cores and very high air-filling fractions not only display unusual chromatic dispersion but also yield very high optical intensities per unit power. Thus one of the most successful applications of HFs is to nonlinear optics, where high effective nonlinearities, together with excellent control of chromatic dispersion, are essential for efficient devices. The high effective nonlinearity allows us to readily access various nonlinear optical effects and the following nonlinear devices have been demonstrated by many groups around the world: all optical switching, Raman amplification, parametric devices, soliton generation and the most popular application, SC generation. Due to the possibilities of reduced power requirement and/or device lengths for these HF-based devices, the first three devices listed above could be very attractive for signal processing for future optical networks whilst soliton effects that can be realised over a broad spectral range are also useful for ultrashort pulse application. Another dramatic example is SC generation. SC generation is a formation of broad continuous spectra through propagation of ultrashort (femto or pico second range) high power pulses through nonlinear media due to a range of interconnected nonlinear effects such as SPM, SRS, phase matching and solitons. It was first observed in 1970 [45] and has been studied extensively in many different materials. The main application for SC generation is a broadband fibre lamp source. The SC source offers great prospects for the development of a novel source which has the spectral width of a tungsten lamp and the brightness of a laser. The spectrum of SC turns out to consist of millions of individual frequencies, precisely separated by the repetition rate of the pump laser. This frequency comb can be used to measure optical frequency to an accuracy of one part in 5.1x10⁻¹⁶ [12]. The huge bandwidth together with the high spectral brightness of the supercontinuum source makes it ideal for all sorts of spectroscopy [12]. Measurements that used to take hours and involve counting individual photons can now be made in a fraction of a second [12]. Besides, using light that emerges from a microscopic aperture it is uniquely easy to perform spectroscopy with very high spatial resolution [12]. Besides spectroscopy, supercontinua also can be applied in the areas of metrology, imaging, microscopy and
60 CHAPTER 2 Holey Fibre (HF) 35 telecommunications [12]. Our study focuses upon the SC generation using our in-house fabricated highly nonlinear soft glass HFs. Therefore, in this section, we will pay more emphasis on SC applications. The combination of microstructured fibre technology and soft glasses can potentially be used to exploit the fibre nonlinearity and achieve broad SC generation in the near IR region. By controlling the generated SC spectrum it is anticipated that a single laser source capable of serving a range of near IR applications could be realised. Moreover, non-silica soft glass HFs promise to offer nonlinear fibre devices with unprecedented low operating powers (1-10mW) and short devices lengths (0.1-1m). The phenomenon of SC generation in HFs relies on high intensity pulses from a laser being converted into an extremely broad spectrum by non-linear processes. The generation of the ultrabroad SC is achieved by pumping the fibre at a wavelength near to the ZDW of the fibre. Highly nonlinear HFs can exhibit a range of novel dispersive properties with modifications of the fibre design allowing application specific control of the magnitude, slope and sign of the dispersion. Shifting the ZDW to the regimes where there are convenient sources, allows the generation of efficient SC sources. Silica HFs have been demonstrated to generate broadband SC light when pumped with short pulses at around 800nm [40]. Results on SC generation in HFs have previously been presented with pumping in the anomalous dispersion regime or at the zero dispersion wavelengths in both the visible and the infrared wavelength range [40]. Most experiments utilize femtosecond pumping as this results in spectacularly broad spectra. Picosecond pumping yields more narrow spectra but does so with far cheaper lasers. Mode-locked femtosecond lasers such as titanium-doped sapphire (Ti:Sapphire) (800nm), neodymium-doped ytterium aluminium garnet (Nd:YAG) (1060nm) or picosecond pulsed lasers such as fibre lasers are commonly used as the source. Recently, SC generation in soft glass HFs has attracted the attention of researchers; for example Kumar et al. has successfully fabricated an extruded soft glass HF with zero dispersion at 1550nm [27]. An ultrabroad supercontinuum spanning at least 350nm to 2200nm has been demonstrated using a 1550nm ultrafast
61 CHAPTER 2 Holey Fibre (HF) 36 pump source [27]. Soft glass is used because it has higher nonlinearity than that attainable in comparable silica fibres and also has high IR transmittance. A broadband IR SC generation ranging from 2.1µm to 3.2µm has been demonstrated in a chalcogenide (As 2 Se 3 ) glass HF under 100 femtosecond (fs) 2.5µm pumping [46], indicating the promise to extend the HF based nonlinear applications to mid-ir region by using IR transparent glasses as the background material rather than silica. Of particular interest is that IR SC generation can be utilised as the broadband light sources, which are demanded for the applications such as LIDAR and optical spectroscopy. As highly nonlinear soft glass HF technology becomes increasingly mature, numerous applications within the area of nonlinear devices such as all-optical switches, wavelength converters and supercontinuum generators may be expected. The many unique features of this new class of HFs will most likely make them key components not only in future telecommunication systems, but also within area such as medical and metrology, and beyond Glass material choice The key factor responsible for the novel optical properties of HFs is the combination of the wavelength-scaled features of the microstructured cladding and the large index contrast between the air and the background material. Compared to the conventionally used silica glass as the background material of the HF, non-silica glasses such as chalcogenide glasses, tellurite glasses and other heavy-metal-oxide (HMO) glasses, offer numerous interesting opportunities for many HF types due to their substantially different and unique material properties. A significant example is: moving to soft glass with a higher refractive index than silica, it is possible to access material nonlinearities that are orders of magnitude larger than that of silica. Thus non-silica glass HF was proposed as a noteworthy candidate for highly nonlinear applications. Investigations of the fibre s nonlinear and dispersive properties will help to establish its suitability, or otherwise, as a temporally agile, frequency selective source.
62 CHAPTER 2 Holey Fibre (HF) 37 In order to investigate the feasibility of using soft glass HFs for producing nonlinear devices, especially for visible-nir SC generation, we begin by reviewing the glass properties required for realising such fibres. SC generation at visible-nir wavelengths requires the use of a highly nonlinear optical medium with high visible/nir transparency. Extending current HF technology developed from silica to non-silica soft glass based work at visible-nir wavelength (~ μm) to mid-ir wavelengths (>2 μm), necessitates developing a detailed understanding of the relationship between the glass composition and the optical properties, such as for example the position of the transmission spectral window, multiphonon absorption edge and the magnitude of the nonlinear refractive index, in order to select a suitable glass for the fibres Transmission and IR transmittance of the soft glasses Figure 2.6 shows the measured transmission spectra of commercial Schott SF59 glass, tellurite glass and the in-house GLS glass compared with pure silica glass. Pure silica glass is extremely promising for the optical applications from the ultraviolet (UV) region (<0.4 μm) to NIR region as it possesses high transparency from 250 to 2500nm. Chalcosulfide glass can be highly transparent up to 9 μm, indicating its promising potential in the mid-ir region (3-10 μm). Tellurite glass can essentially satisfy the requirements for the applications from 1.0 to 3.0 μm. High-lead silicate glass (Schott SF59) shows inferior transmission in the visible region ( μm) to silica, and also in the mid-ir region compared to chalcosulfide glass and tellurite glass, so that their applications can only be limited within the NIR range ( μm), however this wavelength range is already adequate for NIR nonlinear device application.
63 CHAPTER 2 Holey Fibre (HF) 38 Figure 2.6: Transmission spectra of typical optical glasses: 1. pure silica glass, 2. Schott SF59 glass, 3. ORC in house tellurite glass, 4. ORC in house GLS glass [47] The absorption of a solid in the long wavelength limit is known as the multiphonon or IR absorption edge and arises from inner molecule or lattice vibrations. A simple Hooke s law mass on spring model predicts that the multiphonon absorption edge will shift towards longer wavelengths if heavier atoms are introduced into the glass network or if chemical bonds are weakened. The multiphonon absorption edges of several glasses are shown in Figure 2.7 [14]. Note that due to the strong Si-O bonding, the oxide containing SiO 2 cannot be transparent at the wavelengths longer than 5 μm, whilst glasses containing any oxide cannot be transparent at the wavelengths longer than ~ 8 μm. 10 loss (db/m = 10 4 mm -1 ) silica Bi PbGe NaZnTe PbBiGa LiTiTe ZBLAN GLSO GLS As2S wavelength (nm) Figure 2.7: Multiphonon edges for different glasses (this graph is provided by Dr H. Ebendorff-Heidepriem)
64 CHAPTER 2 Holey Fibre (HF) Impact of OH content on IR transmission As mentioned above, the loss of bulk glass and fibres can be much higher than the theoretical loss due to impurities. In particular, OH and SH groups can decrease drastically the IR transparency at wavelengths shorter than the fundamental limit given by the multiphonon edge. In addition to the phonon losses, extrinsic losses due to scattering and impurity absorption affect the glass transmission below the intrinsic maximum transmission wavelength. In oxide glasses, the OH bands are very broad ranging over the whole mid-ir range as follow: In the IR region, OH groups result in three absorption bands: The strongest absorption is caused by 1-2 intense bands in the range µm (Figures 2.8). These bands are due to fundamental O-H vibrations (ν 0 ) of free OH groups and OH groups bonded more or less to nearby hydrogen atoms. The tail of these bands can extend down to ~1500nm. The band at ~2300nm (Figure 2.8) is due to combination (ν 0 +ν 1 ) of the fundamental vibration of free OH groups (ν 0 ) with the fundamental network vibration (ν 1 ). The sharp band at nm (Figure 2.8) is the overtone of the fundamental vibration of free OH groups (2ν 0 ). In particular, oxide glasses can contain high OH contents. Oxide glasses readily incorporate OH impurities, which can result in losses of more than 1000 db/m at certain wavelengths as shown in Figure 2.8. Dehydration techniques such as addition of fluoride and dry/reactive gas treatment can decrease the OH loss substantially. For example, fluoride glasses are generally less susceptible to OH impurities, and dehydration can then decrease the OH loss to as low as db/m [14].
65 CHAPTER 2 Holey Fibre (HF) SF57 Bi-high-OH Bi-low-OH loss [db/m] wavelength (nm) Figure 2.8: Bulk loss spectra of various glasses: SF57 lead silicate glass and bismuth oxide, measured using bulk samples of 1-30mm thickness and commercial spectrometers [14]. The inset shows the loss spectrum in broader wavelengths Refractive index of the glasses Material nonlinearity One of the main reasons why HFs have unique optical properties such as endlessly single-moded guidance, photonic bandgap, dispersion flattening and high nonlinearities, is the large contrast of refractive indices between the background material (glass) and the air. The high nonlinear index of the background material is also one of the contributors in achieving high effective nonlinearity in small core HFs. The total refractive index of a material, n(i), for a given wavelength of the light λ, can be written as [41]: n(i) = n 0 +n 2 I 2.4 I= P/A eff (W/m 2 ) 2.5 where n 0 is the linear refractive index, n 2 is the nonlinear refractive index, I is the optical intensity of the incident beam, P is the power carried by a mode in an optical fibre and A eff is the effective area.
 formula [46] is a semi-empirical relationship which was found to relate n 2 and the Abbe number ν d and n d (d: the d line of helium at 587.")
66 CHAPTER 2 Holey Fibre (HF) 41 A number of authors have proposed empirical relations between the nonlinear index and linear dispersion parameters. The Boling-Glass-Owyong (BGO) formula [46] is a semi-empirical relationship which was found to relate n 2 and the Abbe number ν d and n d (d: the d line of helium at 587.6nm), that has been already demonstrated to match the measured value very well [46]. The formula has already been converted into SI unit, n 2 (10-3 m 2 /W)= n ( nd 1) ( nd + 2) ( nd + 2) ( nd 1) ν d 1 / 2 d [ ] 6nd 68 ν where c is the light speed in vacuum (3 x10 8 m/s). This BGO equation was applied to calculate n 2 for all the commercial Schott optical glasses, and other optical glasses [47]. Please be noted that, however, the BGO rule is just an empirical relationship and consequently can only be used as a rough indication of those materials with high values of n 2 and accurate values of n 2 can only be obtained from experiments, which may also have been performed at different wavelengths for different glasses. Figure 2.9 summarizes the relation between the linear refractive index n and nonlinear refractive index n 2 in various optical glasses. SF57 Figure 2.9: Relationship between refractive index n d and nonlinear refractive index n 2 of various optical glasses. (This graph was contributed by Dr. Xian Feng).
67 CHAPTER 2 Holey Fibre (HF) 42 From the graph shown, we can see that soft glasses have a higher nonlinear refractive index and orders of magnitude higher nonlinear refractive index compared with the silica glass. From a material chemistry point of view, n d and n 2 are both attributed to the polarizability and the hyperpolarizabilty of the constituent chemical ions. In conventional silicate glasses, network modifiers increase the number of the non-bridging oxygen atoms, which are more polarisable than the bridging oxygen atoms in the Si-O network, thus inducing a modest increase of the nonlinearity. Therefore, the hyperpolarizability of the constituent metal ions is usually the cause of high nonlinearity for the glasses with heavy-metal cations [47]. For instance, the lone 6s electron pairs of the lead ions in PbO glasses are explained to be the cause of the high linear and nonlinear refractive index [48]. It can be seen that introducing heavy atoms (i.e. heavy metal compounds) or ions with a large ionic radius (i.e. using chalcogen elements S, Se and Te to replace oxygen), which both act to increase the polarizibility of the components in the glass matrix, also increases the nonlinear index n 2. In short, one can obtain a large n 2 by maximizing the linear refractive index n 0 in the wavelength range of interest. Here, we show the tendency of n 2 versus n d relation, which is sufficient in the essential requirement to seek the optical glasses with the highest nonlinear refractive index n Material dispersion Although a remarkable degree of dispersion management can be achieved using extremely high mode confinement in HF structures, for applications such as SC generation that depend on the dispersion over broad wavelength ranges, dispersion management is a delicate balance between fibre design, material properties and an inherently favourable material dispersion is important. For example, in order to be suitable for efficiently SC, fibres that have a zero in the group velocity dispersion at the desired pump wavelength are required. For this reason, it is necessary to explore the range of material dispersion properties that are found in soft glasses. Zero dispersion can be achieved by balancing the material dispersion (V mat ) with the
68 CHAPTER 2 Holey Fibre (HF) 43 waveguide dispersion (V wg ) at the pump wavelength to achieve zero net dispersion (V mat + V wg = 0). The difference in the material dispersion of soft glasses allows a broader range of fibre dispersion profiles to be achieved than are possible with conventional fibre technology. To calculate the material dispersion, it is necessary to have measured refractive index data over a broad range of wavelengths. This data is currently available just for a limited range of materials and they are evaluated by Dr. T. M. Monro. The glasses chosen are: LLF1 (a commercially available Schott glass), SF6 (ditto), SF57 (ditto), Bismuth oxide glass (by the Asahi Glass Co.) and Gallium Lanthanum Sulphide Oxide (GLSO, made in house at the ORC). Please note that the transparency windows vary for each glass, and these choices can be chosen according to the desired application operational range. Figure 2.10: Material dispersion of a range of soft glasses. (This graph was contributed by Dr. T. M. Monro) For each glass considered, the measured (linear) refractive index data is fitted to a generalized Sellmeier equation [49]. Both the raw refractive data and the (fitted) Sellmeier coefficients for SF57 lead silicate glass are given in Appendix 1. Using these Sellmeier equation fits, the D mat for several glasses mentioned earlier is
69 CHAPTER 2 Holey Fibre (HF) 44 evaluated over a broad wavelength range and the results are shown in Figure Note that the results presented in Figure 2.10 indicate that the D mat becomes more normal for the higher index glasses (for all wavelengths). The linear and nonlinear indices of different glasses are listed in Table 2.2. Heavy metal oxide glasses (lead-silicate, bismuth-oxide, tellurite) have linear indices in the range of , nonlinear indices that are ~10 times higher than silica, material ZDWs of 2-3 μm, and multiphonon absorption edge of ~3.5 μm. Chalcogenide glasses (GLS, As 2 S 3 ), linear indices of , nonlinear indices significantly greater than those of the oxide glasses, and ZDWs larger than 4 μm. The values of D mat at the pump wavelengths of interest for this study have been extracted from Figure 2.10 and are shown in the Table 2.2 below. These results are discussed further in Chapter 4 and Chapter 5, when work on the waveguide contribution to the overall dispersion is presented. Some examples of D mat for each material at the two proposed pump wavelengths shown in Table 2.3. Table 2.2: Optical properties, refractive indices and ZDW of different glasses. (The data was extracted from [14]) glass type glass main components n 0 (at µm) n 2 (m 2 /W) ZDW (µm) Refs. silica silica SiO (0.6) lead silicate SF57 SiO 2 -PbO 1.84 (0.6) ,49 bismuth Bi Bi 2 O 3 -SiO (1.5) ,54 tellurite ZnTe TeO 2 -ZnO ~2.0 ~ ,56 chalcogenide GLS Ga 2 S 3 -La 2 S (0.6) ~500-50,57,58 GLSO Ga 2 S 3 -La 2 S 3 -La 2 O (1.5)
70 CHAPTER 2 Holey Fibre (HF) 45 Table 2.3: D mat for different glasses at the two proposed pump wavelengths (1.06 and 1.55 μm) Glass material D MAT (1.06μm) [ps/nm/km] D MAT (1.55μm) [ps/nm/km] SF Bi (1310) GLS Viscosity The viscosity of a glass must be known in order to assess its suitability for preform extrusion (viscosity range of ~ poise) and fibre drawing (viscosity range of ~ poise). Figure 2.11 shows the measured viscosity curve for SF57 lead silicate glass. The viscosity data has been extrapolated from to 10 4 dpa.s, by using the Vogel-Fulcher-Tammann (VFT) equation [60]. From the graph in Figure 2.11, it is seen that SF57 lead silicate glass exhibits a quite steep temperature-viscosity curve and has a narrow operating temperature range (<50 0 C) for fibre drawing. The lead silicate SF57 glass is grouped under short glass which has a quite steep viscosity curve, which makes great demands on the temperature control of the fabrication process. Essentially, in order to minimize the effect of the temperature gradient on the holey cladding of the preform and to avoid phase separation and thermal crystallisation of the glass at high temperature, we must maintain the fibre drawing temperature close to the viscosity range of ~ poise. For extrusion, the temperature used is normally close to the viscosity range of ~ poise. The low softening temperature of SF57 glass, which is about C allows the utilization of the extrusion technique for fibre fabrication. The viscosity curve of pure silica glass is also illustrated in the inset of Figure 2.11, according to [47]. It is seen that non-silica glasses typically have steep viscosity curves and the operating range for fibre drawing is less than C, while pure silica

71 CHAPTER 2 Holey Fibre (HF) 46 glass has flat viscosity curve and the operating temperature range for fibre drawing is as wide as C. Therefore, the processing temperature suitable for drawing nonsilica glass HFs is indeed much narrower than silica HFs. SF57 Figure 2.11: temperature-viscosity curve of SF57 lead silicate glass. Inset: Viscosity of some other studied glasses: 1. tellurite glass, 2. Schott SF59 glass (lead borosilicate glass), 3. GLS glass, 4. pure silica glass (this graph is extracted from [47]) Comparison of non-silica glasses as background material for HFs Table 2.4 summarizes the optical and thermal properties of the three main studied non-silica glasses. The thermal properties, such as viscosity, indicate that it is more difficult to fabricate non-silica glass HF than silica HF due to the typical steep viscosity curves of the soft glasses and narrow operating temperature range for fibre drawing (<50 0 C). However, for some particular applications which silica HF cannot achieve, such as extremely high nonlinear applications from 1 to 4 μm and mid-ir laser power delivery, non-silica glass based HFs have the absolute advantages over silica HF.
72 CHAPTER 2 Holey Fibre (HF) 47 Table 2.4: Comparison of different optical glasses as background material. Glass properties Lead silicate Glasses Chalcogenide Glasses Pure Silica Glass Optical properties Refractive Index n (or higher) (or higher) 1.46 Transmission μm μm μm Refractive index, n (or higher) (or higher) 1.46 Nonlinear refractive index, n 2 Tens of times higher than pure silica glass ~100 times higher than pure silica glass 2.2 x m 2 /W Material zero dispersion wavelength 2.0 μm 4.64 μm (GLSO) 1.3 μm Fibre Attenuation μm, lowest at μm high OH content μm, lower at mid-ir region low OH content μm Thermal properties Operating temperature range for fibre drawing (viscosity) <50 o C <50 o C >500 o C Based on the above study, it can be seen that heavy metal oxide and chalcogenide based glasses are promising candidates for developing mid-ir nonlinear HFs. The chalcogenide glasses possess advantages over the heavy metal oxide glass systems in terms of higher n 2 and longer wavelength multiphonon absorption edges. However, the toxicity, chemical durability and thermal stability of the heavy metal oxide based glasses are typically superior to those of the chalcogenide based glasses. Additionally, one of the most challenging issues in the development of the chalcogenide glasses in the past decades is the very narrow glass forming region of chalcogenide glasses itself. It is extremely difficult to find one pair of glass compositions as the core and the cladding with the suitable index-contrast, the sufficiently small thermal mismatch and good thermal stability [47]. Therefore, the
73 CHAPTER 2 Holey Fibre (HF) 48 concept of single-material based HFs appears particularly suitable for chalcogenide glass based optical fibres. For HFs based on commercial lead silicate glasses, they can only cover within the range between μm, due to the narrow transmission windows and the relatively high fibre attenuation. However, since the glasses are commercially available and have the outstanding quality-to-cost ratio, it is worth developing commercial high-index oxide glass based HFs for cheap and short fibre devices but with sufficiently excellent optical performance [47]. As a brief conclusion for the glass selection, we believe that heavy-metal oxide glasses especially lead silicate glass have adequate properties meeting the requirements in achieving visible-nir devices, and are technologically the best developed candidates for immediate experiments. Chalcogenide glasses are very promising for a broad range of mid IR applications in the future. 2.6 Non-silica glass based HF fabrication techniques Although soft glasses are clearly having the potential for making into novel nonlinear devices, they have not yet found widespread application due to the difficulty in fabricating low loss single mode fibres using the conventional techniques. However, the emergence of HF fabrication technology is particularly enabling for soft glasses as it eliminates the need for two thermally, chemically and optically compatible glasses to form the fibre core and cladding as required for conventional step-index fibres. HF technology thus provides a simple and convenient route to realizing fibres in high nonlinearity glasses that otherwise might not be able to be drawn into fibre form. Now, low loss HFs have been drawn from a wide range of novel glasses. Recent work at the ORC, University of Southampton, has led to successful fabrication of the first soft glass HF [1]. Recent progress in extruded bismuth oxide based glasses also has been particularly noteworthy [8], and we have also reported lead-silicate HFs (Schott SF57 glass) using extrusion [2-5, 9, 33], and the stacking technique [28]. An As-Se MOF has been reported that generated IR supercontinuum extending from μm using 2.5 μm pumping [46].
74 CHAPTER 2 Holey Fibre (HF) 49 A brief review of fabrication technology is studied in order to establish appropriate fibre geometry for the design optimization described in the later Chapter 4 and 5. The key in HF fabrication is the making of the macroscopic structure of the fibre preform. Table 2.5 summarizes the approaches that have been used so far. There are few practical techniques in manufacturing soft glass HFs and they will be briefly discussed here. A. Capillary stacking Stacking is the main method for fabrication of silica HFs and can also be used for non-silica HFs. This approach was developed by Russell et al. [12, 13]. The first capillary stacking non-silica HFs were made by Monro et al using Ga-La-sulphide glass [1]. In this approach, capillaries and rods are stacked along in an appropriately designed lattice. This stacked fibre type offers large freedom in structural design such as high complexity and periodic geometry and thus in the tailoring of dispersion and the number of guided modes. Thus far, fabrication via the stacking technique has been a highly labour intensive and time consuming process; also it is necessary to fabricate the stacking elements using other fabrication methods such as drilling, extrusion, or rotational casting. B. Extrusion Soft glasses exhibit far lower processing temperatures than silica, (for example each of the above glasses exhibits low softening temperatures of ~500 o C as opposed to ~2000 o C for silica), which enables the use of extrusion for fibre preform manufacture. The first extruded HF was produced by T. Monro et al. [2,3] in The extrusion technique has already proven versatility and been successfully applied to making microstructured holey preforms for various soft glass HFs [1-9, 27] and polymer HFs [10]. Under high pressure (typically N/cm 2 ) and high temperature (corresponding to the viscosity range between poise), glass can be extruded through a structured die and the preform, with the die design, will be fabricated. This technique is suitable for short glass (glass with short temperature operating range) fibre fabrication, or glasses that have high tendency in crystallization [61-63]. Microstructured preforms, rod and tubes fabricated in this way are reproducible and good dimensional control can be achieved. In contrast to stacking, extrusion allows the fabrication of the structured preform in one step. This fabrication
75 CHAPTER 2 Holey Fibre (HF) 50 is less labour intensive, and more efficient and economic. The feasibility of this approach for very small core high NA HFs fabrication has been proven in the ORC, for example, WW structured preforms of 3 large air holes surrounding a small core that is supported by three long and thin struts. WW can be extruded in a very high airfilling fraction which leads to extremely high nonlinearity. Note that this type of preform cannot be fabricated by conventional methods such as capillaries stacking and moulding [64]. There is also no interface between the core and holes in WW design. There are only a few drawbacks of this approach: extrusion requires an additional thermal cycle in the fabrication process, which can be critical for glasses with lower crystallization stability, also it is technically difficult to fabricate the glass preforms with very complex microstructure (> 3 rings of holes) due to the thermomechanical strength of the die material and the thermal deformation of the glass preform [47]. Also, the attenuation of the resulting HF will be increased due to the contamination from the surface of the die. C. Ultrasonic drilling Drilling is yet another straightforward but time consuming approach to manufacture complex HFs. This technique was first introduced by Yablonovitch, who initially used drilling in fabricating the world s first man-made photonic bandgap crystal [64]. With a numerically controlled drilling machine, the parameters such as the sizes, distribution, and the angles of the holey arrays can be precisely drilled in the block of glass material. This particular approach is suitable for fabricating highly dimensional precision multi-hole microstructured preforms in one step. So far, a drilled preform with 18 holes has been successfully made in the ORC [47] via ultrasonic drilling and with the assistance of a micrometer for precise alignment, which resulted the drilled holes in the preforms being precisely located with deviation less than 20μm/cm along the axial position and less than 20μm along the radial direction on the preform [47]. The drawbacks are surface roughness and a potential for low yield by risk of cracking. Surface roughness of the drilled preforms can be largely improved by the fire polishing process during fibre pulling or by chemical etching prior to fibre drawing [47].


76 CHAPTER 2 Holey Fibre (HF) 51 Table 2.5: Comparison of the above practical techniques used in making HFs Fabrication approach example Capillaries stacking Extrusion Ultrasonic drilling Structure Particular lattice of air holes Structure Hole to hole pitch, Λ variation Hole size, d Advantages Large geometric flexibility Complex microstructured Single moded and dispersion profile tailorable Core isolated by thin and long struts Core size Suitable for small core HF with extremely high air filling fraction Very high nonlinearity attainable Intricate profiles in one step No interface between core and holes This approach is proven versatile for different compound glasses Issues Labour intensive Additional thermal cycle Particular lattice of air holes Hole to hole pitch, Λ Hole size, d Suitable for high dimensional precision microstructure. Structured perform in a step time intensive potential for low yield Surface roughness Achievement >100 holes [47] 18 holes [35] 18 holes [47] Examples [1, 35] [1-9, 27] [47] D. Casting Very recently, casting has been demonstrated to be a useful method to fabricate HF preforms [31]. Just as with drilling, casting allows high dimensional precision, and also a high air-filling fraction is possible. However, the achievable preform geometry is limited. So far, the combination of extrusion and stacking as well as drilling and stacking has been used for lead silicate glasses [35]. More details will be in Chapter 5.

77 CHAPTER 2 Holey Fibre (HF) State of the art: Examples of some significant fabricated non-silica HFs Recent progress in small core highly nonlinear soft glass HFs has been particularly noteworthy. Figure 2.12 demonstrates the progress and versatility achieved to date in the fabrication of soft glass HFs. The fibres were made from commercial lead silicate glasses SF6 and SF57, from tellurite glasses and from a bismuth-oxide glass. In all fibres, the core is isolated from the outer solid glass region by long thin struts, which reduces confinement loss to negligible levels. The progress achieved to date demonstrates that high quality structures can be defined in a range of glasses: lead silicate glass HF: SF57 HF (by ORC, U.K.)[4, 5, 28, 33, 35] and SF6 HF (by Bath, U.K.)[27], Bismuth silicate HF (by ORC, U.K.)[8, 29] and Tellurite HF (by NTT, Japan)[31]. Figure 2.12: the progress and versatility achieved to date in fabrication of highly nonlinear soft glass HFs Figure 2.13 summarizes the results on nonlinear fibres achieved so far. For lead silicate SF57 fibre, we obtained a record nonlinearity (1860 W -1 km -1 ) and also comparatively low loss of 2dB/m at 1.5um. The fibre exhibits anomalous dispersion at 1.5um, which enabled Raman soliton generation and soliton self-frequency shift and also ZD at ~1µm. This, in turn, enabled broadband SC generation with low input

78 CHAPTER 2 Holey Fibre (HF) 53 power. Another lead silicate HF demonstrated by Kumar from the University of Bath exhibits multi-mode guidance and has the ZD at 1.5um, which has resulted in SC generation at 1.5um. The loss is 4dB/m. Recently, Mori from NTT Japan has demonstrated a cast tellurite fibre with effective nonlinearity of 675 W -1 km -1 and very low-loss of 0.4dB/m (Please note that the low loss is partly due to low loss of the bulk glass). We reported on bismuth-oxide glass HF with the loss of ~3dB/m, slightly larger than our lead silicate fibres (SF57) due to higher bulk glass loss. For the fibre with smallest core, we have obtained the highest nonlinearity of a HF to date. Like our lead silicate fibres, the bismuth fibres demonstrate Raman soliton generation. For all the soft glass HFs produced, the ZDWs are smaller than 1.5um despite the fact that the bulk glasses have zero dispersion at wavelengths larger than 1.9um. The higher fibre losses of the soft glass HFs compared with silica HFs can be readily tolerated in compact devices using 1m or less fibre lengths. Figure 2.13: Progression of some significant non-silica HFs 2.8 Conclusion: Why SF57 lead silicate glass is used? Lead silicate glasses are excellent materials for highly nonlinear HFs due to their suitable combination of properties. Of all the aforementioned high index glass

79 CHAPTER 2 Holey Fibre (HF) 54 types in Section 2.5, lead silicate glasses offer the highest thermal and crystallization stability and exhibit the least steep viscosity-temperature curves making them particularly attractive for HF fabrication although it is to be appreciated that their intrinsic material nonlinearity is lower than that of chalcogenide and some heavy metal oxide glasses [65]. Schott SF57, a lead silicate glass, is the glass we have focused on in this work, exhibits the highest nonlinearity among the commercially available lead silicate glasses after SF59 glass (SF59 has a higher nonlinearity, but it is not in production anymore at the time of this study). The high lead concentration of this glass leads to the large linear refractive index of 1.81 at 1.55 μm and large nonlinear refractive index of 4.1x10⁻¹⁹ m 2 /W (as measured at 1.06 μm [49]). Although much higher than silica, losses in bulk SF57 can be as low as 0.3 db/m at 1.55 μm [49]. The optical and thermal properties of SF57 are shown in Table 2.6. Table 2.6: Optical and thermal properties of SF57 lead silicate The glass also exhibits low softening temperatures of C [66], which allows the use of extrusion as an alternative fibre preform fabrication technology [27,1-10]. As well as being simpler and less labor intensive than the more
80 CHAPTER 2 Holey Fibre (HF) 55 conventional stacking technique developed for silica HFs, extrusion readily allows the implementation of structures with high air content claddings as required for high nonlinearity fibre fabrication and, at the same time, offers good reproducibility of the preform geometry compared with the most typically used stacking technique in silica HFs. The ZDW for the bulk glass is 1970nm. Similar to the dispersion controlling mechanism in silica HFs, by introducing wavelength-scale microstructure into the fibre cladding, the total dispersion of SF57 glass based HFs is anticipated to be tailored to near-zero or anomalous regimes anywhere within the entire wavelength range, from its Urbach edge to the wavelengths slightly less than its material ZDW, particularly, for some most commonly used wavelengths, i.e., 1.06μm (Nd:YAG) and 1.55μm (telecom and EDF), etc. In conclusion, we believe that lead silicate glasses, particularly SF57 glass has the required and adequate properties to achieve visible-nir devices, and are the best developed material to be used in this study.
81 CHAPTER 2 Holey Fibre (HF) References 1. T.M. Monro, Y.D. West, D. W. Hewak, N. G. R. Broderick and D.J.Richardson, Chalcogenide holey fibres, Electron. Lett. 36, (2000). 2. K. M. Kiang, K. Frampton, T. M. Monro, R. Moore, J. Tucknott, D. W. Hewak, D. J. Richardson, and H. N. Rutt, "Extruded singlemode non-silica glass holey optical fibres," Electron. Lett. 38, (2002). 3. T. M. Monro, K. M. Kiang, J. H. Lee, K. Frampton, Z. Yusoff, R. Moore, J. Tucknott, D. W. Hewak, H. N. Rutt, and D. J. Richardson, "High nonlinearity extruded single-mode holey optical fibres," presented at OFC 2002, Anaheim, California, March 2002, paper FA1-1 (Postdeadline). 4. H. Ebendorff-Heidepriem, P. Petropoulos, R. Moore, K. Frampton, D. J. Richardson, and T. M. Monro, "Fabrication and optical properties of lead silicate glass holey fibres" J. Non-Crystalline Solids, , (2004). 5. P. Petropoulos, T. M. Monro, H. Ebendorff-Heidepriem, K. Frampton, R. C. Moore, and D. J. Richardson, Highly nonlinear and anomalously dispersive lead silicate glass holey fibres, Opt. Express 11, (2003). 6. X. Feng, T. M. Monro, P. Petropoulos, V. Finazzi, and D. Hewak, "Solid microstructured optical fibre," Opt. Express 11, (2003). 7. V. Kumar, A. K. George, J. C. Knight, and P. S. Russell, "Tellurite photonic crystal fibre," Opt. Express 11, (2003). 8. H. Ebendorff-Heidepriem, P. Petropoulos, V. Finazzi, K. Frampton, R. Moore, D. J. Richardson, and T. M. Monro, "Highly nonlinear bismuthoxide-based glass holey fibre," presented at OFC 2004, Los Angeles, California, paper ThA4. 9. H. Ebendorff-Heidepriem, P. Petropoulos, V. Finazzi, S. Asimakis, J. Leong, F. Koizumi, K. Frampton, R. Moore, D. J. Richardson, and T. M. Monro, "Heavy metal oxide holey fibres with high nonlinearity," OFC M. A. van Eijkelenborg, M. C. J. Large, A. Argyros, J. Zagari, S. Manos, N. A. Issa, I. Bassett, S. Fleming, R. C. McPhedran, C. M. de Sterke and N. A. P. Nicorovici, Microstructured Polymer Optical Fibre, Opt. Express 9, (2001).
82 CHAPTER 2 Holey Fibre (HF) J. C. Knight, Photonic Crystal fibres, Nature 424, (2003). 12. Philip St. J. Russell, Photonic crystal fibres, Science 299, (2003). 13. J. C. Knight, T. A. Birks, P. St. J. Russell and D. M. Atkin, All-silica single-mode photonic crystal fibre, Opt. Lett. 21, (1996). 14. J.H.V.Price, T.M.Monro, H.Ebendorff-Heidepriem, F.Poletti, V.Finazzi, J.Y.Y.Leong, P.Petropoulos, J.C.Flanagan, G.Brambilla, X.Feng, D.J.Richardson, Mid-IR supercontinuum generation in non-silica glass fibres, Photonics West San Jose, California, Jan 2006 (Invited). 15. T. M. Monro, Communications Revolution. New Technology for Communications, Two chapters for 'Impact Science' to complement lecture course 'International Science School 2001', Sydney, 1-14 Jul F. P. Kapron, D. B. Keck, and R. D. Maurer, Radiation losses in glass optical Waveguides, Appl. Phys. Lett., 17(10), (November 1970). 17. P. Kaiser, E. A. J. Marcatili, and S. E. Miller, A new optical fibre, The Bell Syst. Tech. J., 52(2), , February P. Kaiser and H. W. Astle, Low-loss single-material Fibres made from pure fused Silica, The Bell Syst. Tech. J., 53(6), (July-August 1974). 19. P. Kaiser, A. R. Tynes, A. H. Cherin, and A. D. Pearson, Loss measurements of unclad optical fibres In Topical meeting on integrated optics-guided waves, materials and devices, pages , Las Vegas, Nevada, February Optical Society of America. Paper WA D. B. Keck, R. D. Maurer, and P. C. Schultz, On the ultimate lower limit of attenuation in glass optical waveguides, Appl. Phys. Lett., 22(7), (April 1973). 21. T. Miya, Y. Terunuma, T. Hosaka, and T. Miyashita, Ultimate low-loss single-mode fibre at 1:55 μm, Electron. Lett., 15(4), (February 1979). 22. T. Li, Advances in optical fibre communications: an historical perspective, IEEE J. Sel. Areas Commun., 1(3), (April 1983). 23. T. A. Birks, P. J. Roberts, P. St. J. Russell, D. M. Atkins, and T. J. Shepherd, Full 2-D photonic bandgaps in silica/air structures, Electron. Lett., 31(22), (October 1995).
83 CHAPTER 2 Holey Fibre (HF) K. Tajima, M. Ohashi, K. Shiraki, T.Tatede, and S.S.Shibata, Low Rayleigh Scattering P 2 O 5 -F-SiO 2 glasses, J. Lightwave Tech, 10, (1992). 25. K. Tajima, J. Zhou, K. Kurokawa, and K. Nakajima, Low water peak photonic crystal fibres, ECOC 2003, Rimmi, Italy, 42-43, Postdeadline paper Th J. C. Baggett, Bending losses in large mode area holey fibres, PhD Thesis, University of Southampton (June 2004). 27. V. V. Ravi Kanth Kumar, A. K. George, W. H. Reeves, J. C. Knight, P. St. J. Russell, F. G. Omenetto, A. J. Taylor, Extruded soft glass photonic crystal fibre for ultrabroad supercontinuum generation, Opt. Express 10, (2002). 28. J. Y. Y. Leong, S. Asimakis, F. Poletti, P. Petropoulos, X. Feng, R. Moore, K. Frampton, T. M. Monro, H. Ebendorff-Heidepriem, W. Loh, and D. J. Richardson, Nonlinearity and Dispersion Control in Small Core Lead Silicate Holey Fibres by Structured Element Stacking, presented at the Optical Fibre Communication Conference, Anaheim, California, U.S.A., 5-10 Mar. 2006, paper OTuH Heike Ebendorff-Heidepriem, P. Petropoulos, S. Asimakis, V. Finazzi, R. C. Moore, K. Frampton, F. Koizumi, D. J. Richardson, and T. M. Monro, Bismuth glass holey fibres with high nonlinearity, Opt. Express, vol.12, no.21, (2004). 30. S. R. Friberg and P. W. Smith, "Nonlinear Optical-Glasses for Ultrafast Optical Switches," IEEE J. Quantum Electron. 23, (1987). 31. A.Mori, K. Shikano, K, Enbutsu, K. Oikawa, K. Naganuma, M. Kato, S. Aozasa, 1.5μm band zero-disperison shifted Tellurite photonic crystal fibre with a nonlinearity coefficient of 675W -1 km -1, ECOC X.Feng, T.M.Monro, P.Petropoulos, V.Finazzi, D.J.Richardson, Extruded single-mode high-index-core one-dimensional microstructured optical fibre with high index-contrast for highly nonlinear optical devices, Applied Physics Letters 87, pp (2005). 33. J.Y.Y.Leong, P.Petropoulos, S.Asimakis, H.Ebendorff-Heidepriem, R.C.Moore, K.Frampton, V.Finazzi, X.Feng, J.H.V.Price, T.M.Monro, D.J.Richardson, A lead silicate holey with y=1860 W -1 km -1 at 1550 nm, OFC 2005 Anaheim, 6-11 Mar 2005, PDP22 (Postdeadline). 34. Laurent Brilland, Fréderic Smektala, Gilles Renversez, Thierry Chartier, Johan Troles, Thanh Nguyen, Nicholas Traynor, and Achille Monteville, Fabrication of complex structures of Holey Fibres in Chalcogenide glass, Optics Express 14 (3), pp , (2006).
84 CHAPTER 2 Holey Fibre (HF) J. Y. Y. Leong, S. Asimakis, F. Poletti, P. Petropoulos, X. Feng, R. Moore, K. Frampton, T. M. Monro, H. Ebendorff-Heidepriem, W. Loh, and D. J. Richardson, Towards zero dispersion highly nonlinear lead silicate glass holey fibres at 1550nm by structured-element-stacking, presented at the European Conference in Optical Communication, Glasgow, United Kingdom, Sep.2005, paper Th4.4.5 (Postdeadline). 36. T. M. Monro, P. J. Bennett, N. G. R. Broderick, and D. J. Richardson, Holey fibres with random cladding distributions, Opt. Lett., 25(4), (February 2000). 37. R. F. Cregan, B. J. Mangan, J. C. Knight, T. A. Birks, P. St. J. Russell, P. J. Roberts, and D. C. Allan. Single, mode photonic band gap guidance of light in air, Science 285, (September 1999). 38. W. Snyder and J. D. Love, Optical Waveguide Theory, Chapman and Hall, D. Mogilevtsev, T. A. Birks, and P. St. J. Russell, Group-velocity dispersion in photonic crystal fibres, Opt. Lett., 23(21), (November 1998). 40. J. H. V. Price, W. Belardi, T. M. Monro, A. Malinowski, A. Piper, and D. J. Richardson, "Soliton transmission and supercontinuum generation in holey fibre, using a diode pumped Ytterbium fibre source," Opt. Express 10, (2002). 41. G. P. Agrawal, Nonlinear Fibre Optics, 2nd ed. (Academic Press, Inc., 1995). 42. T. Okuno, M. Onishi, T.Kashiwada, S. Ishikawa, M. Nishimura, Silicabased functional fibres with enhanced nonlinearity and their applications, IEEE J. Sel. Top. Quantum, 5, (1999). 43. J. H. Lee, W. Belardi, K. Furusawa, P. Petropoulos, Z. Yusoff, T. M. Monro, and D. J. Richardson, "Four-wave mixing based 10-Gb/s tunable wavelength conversion using a holey fibre with a high SBS threshold," IEEE Photon. Technol. Lett. 15, (2003). 44. M. Asobe, Nonlinear Optical Properties of Chalcogenide glass fibres and their application to all-optical switching, Opt. Fibre Tech. 3(2), (April 1997). 45. R. R. Alfano and S. L. Shapiro, "Emission in the region 4000 to 7000 Å via four-photon coupling in glass", Phys. Rev. Lett. 24, No. 11, pp (1970). 46. L.B. Shaw, P.A. Thielen, F.H. Kung et al., IR Supercontinuum Generation in As-Se Photonic Crystal Fibre, Conference on Advanced Solid State Lasers (ASSL), Technical Digest, Paper TuC5, 2005.
85 CHAPTER 2 Holey Fibre (HF) X. Feng, A. K. Mairaj, D. W. Hewak et al., "Nonsilica glasses for holey fibres," J. Lightwave Technol. 23 (6), , (2005). 48. I.Thomazeau, J. Etchepare, G.Grilliaon and A.Migus, Electronic nonlinear optical susceptibilities of silicate glasses, Opt Lett. 10, (1985). 49. Schott Glass Catalogue, Y.D. West, T. Schweizer, D.J. Brady, D.W. Hewak, Gallium Lanthanum Sulphide Fibres for Infrared Transmission, Fibre and Integrated Optics 19, pp (2000). 51. R. Adair, L.L. Chase, S.A. Payne, Nonlinear refractive-index measurements of glasses using three-wave frequency mixing, J. Opt. Soc. Am. B 4, pp (1987). 52. K. Tajima, Viscosity of silica glass, in Properties, processing and applications of glass and rare earth-doped glasses for optical fibres, published by The Institution of Electrical Engineers, pp (1998). 53. Data from Asahi Glass Co. 54. K. Kikuchi, K. Taira, N. Sugimoto, Highly nonlinear bismuth oxidebased glass fibres for all-optical signal processing, Electron. Lett. 38, pp (2002). 55. J.S. Wang, E.M. Vogel, E. Snitzer, Tellurite glass: a new candidate for fibre devices, Opt. Mater. 3, pp (1994). 56. R. Adair, L.L. Chase, S.A. Payne, Nonlinear refractive-index measurements of glasses using three-wave frequency mixing, J. Opt. Soc. Am. B 4, pp (1987). 57. D.J. Brady, T. Schweizer, J. Wang, D.W. Hewak, Minimum loss predictions and measurements in gallium lanthanum sulphide based glasses and fibre, J. Non-Cryst. Solids 242, pp (1998). 58. D.J. Brady, J. Wang, D.W. Hewak, Viscosity of silica glass, in Properties, processing and applications of glass and rare earth-doped glasses for optical fibres, published by The Institution of Electrical Engineers, pp (1998). 59. J. Requejo-Isidro, A. K. Mairaj, V. Pruneri et al., "Self refractive nonlinearities in chalcogenide based glasses," J. Non-Cryst. Solids 317 (3), (2003). 60. Werner Vogel, Glass Chemistry, 2 nd Edition, Springer-Verlag Berlin Heidelberg, 416 (1994).
86 CHAPTER 2 Holey Fibre (HF) E. Roeder, Extrusion of Glass, J.Non-Crys. Solid, 5, (1971). 62. E. Roeder, Flow of glass during extrusion, J.Non-Crys. Solid, 7, (1972). 63. E. Roeder, W.Egel-Hess, Extrusion for complicated inner profiles of glass, Glasstech.Ber. 60, (1978). 64. E. Yablonovitch, T.J. Gmitter, K.M.Leung, Photonic band structure: the face-entered-cubic case employing nonspherical atoms, Phys. Rev. Lett. 67, (1991). 65. E. M. Vogel, M. J. Weber, and D. M. Krol, "Nonlinear Optical Phenomena in Glass," Phys. Chem. Glasses 32, (1991). 66. S. Fujino, H. Ijiri, F. Shimizu, and K. Morinaga, "Measurement of viscosity of multi-component glasses in the wide range for fibre drawing," J. Jpn. Inst. Met. 62, (1998).
87 CHAPTER 3 HF optical properties measurement 3.1 Introduction HFs exhibit some unique features compared to those of the standard optical fibres. In particular, the introduction of the air-holes allows new degrees of freedom to manipulate the modal, dispersive and nonlinear properties of the fibre. For instance, HFs can be designed to guide light in a single transverse mode in the near-uv to nearinfrared wavelength range for silica based HFs and up to the mid-infrared for some soft glass based HFs and with variable core sizes. In addition, the arrangement and size of air-holes allow for tailoring of the waveguide dispersion of HFs. Thus, the zero-dispersion wavelength can be pushed into the visible region of the optical spectrum by using silica based HFs. It is also possible to manufacture HFs that exhibit very low dispersion values over a broad wavelength range. Furthermore, glass HFs can be fabricated with an extremely small core down to 1µm, thus enhancing considerably the nonlinear optical processes along the fibre. Moreover, high amounts of the birefringence can be introduced in the core to maintain the polarization of the light travelling along the fibre. Propagation losses of the HFs are however an order of magnitude larger than in conventional optical fibres due to various phenomena. Presently, this limits their practical use as a transmission medium. It is very important to be able to characterize accurately the optical properties of these fibres, as it may have a strong impact on the use of a particular HF. Such a task may become difficult, or impractical, in the case of small core HFs using standard measurement techniques. Indeed, the length of fibre required and the coupling of the light into this type of fibre may prevent the use of the conventional techniques, thus requiring the development of new or improved techniques that are particularly suitable for the characterization of the HFs.
88 CHAPTER 3 HF optical properties measurement General Experimental considerations Comprehensive characterisations have been conducted to identify the optical properties, such as the mode profile, propagation loss, effective nonlinearity and dispersion, for a range of our studied highly nonlinear small core soft glass HFs (see Figure 3.1). The measurement tasks become more difficult, or impractical, in the case of small core HFs using standard measurement techniques, compared to the case of conventional fibres. Figure 3.1: Scanning Electron Microscopy (SEM) images of the studied SF57 lead silicate HFs Soft glass HF end preparation A. Cleaving The quality of the HF cleave at the output end is very critical, especially in experiments requiring the measurement of radial power distribution. The quality of the HF cleave at the input end will essentially determine the percentage of power coupled into the test fibre from the source, which could be an incoherent source such as a tungsten halogen lamp or an ASE broadband source or a laser source. In the absence of a proper commercial fibre-cleaving tool for soft glass HF, we employ a simple silica/ceramic cleaver or a disposable scalpel for scribing the uncoated fibre, while placed along a finger tip, and then pulling it with certain tensions to obtain a good cleave.


89 CHAPTER 3 HF optical properties measurement 64 The quality of the HF end cut could be assessed either by illuminating it with a white light source, and observing it under a microscope, or by coupling in laser light and observing the radiation pattern on a monitor. A circularly symmetric and uniform pattern essentially implies a good cleave. To simplify the fibre end checking task, we normally just observe the cleaved end from the side and its cross-section with an eyepiece. If the end is smooth and shining, it means that there is a good cleave. HFs offers remarkable optical properties, however they have some undesirable mechanical properties too. The struts or bridges between the air holes are thin and prone to breakage, especially given the brittle nature of soft glass. Ordinary step index fibres are generally cleaved by a scratch and break process, which produces a clean surface due to the tendency of silica glass to shear in large places /planes when stressed. HFs, especially soft glass based, e.g. lead silica glass, on the other hand, tend to crack around the holes and lose chunks of glass as the fibre pieces are separated. Figure 3.2 shows some optical microscope images of examples of bad cleaved fibres cross-sections. The cleaves were obtained from the scratch and break process over the course of the experiments. It is seen that the scratched fibres have pits where glasses have pulled away. Using this method, it is also difficult to obtain clean surfaces. This is illustrated in Figure 3.2. When observed under an optical microscope, it shows a wedge shaped void or mound trailing way from each hole, pointing away from where the fibre had been scribed. While surface defects in the cladding were presumed to be tolerable, these gouges frequently spread into the core region where they would interfere with the coupling of the light, so many cleaves have to be attempted before a good fibre face is produced. Figure 3.2: Optical microscope images of some badly cleaved fibres. Note the imperfections around the holes and the cracks running between some of them.
90 CHAPTER 3 HF optical properties measurement 65 B. Polishing No attempt was made to polish the fibre face, as the shavings so produced might enter the air holes and change their effective indices. C. Cladding light removing Since light can be totally internally reflected at the holey cladding-core interface, light launched at the input end may also be guided along the cladding. It is very important to strip out the light guided in the cladding. Cladding mode strippers can be used to accomplished this mission by applying a few drops of an index matching liquid (which has a refractive index very close to, but slightly higher than the cladding) on both of the input and output ends of the test fibre. Since most of the soft glasses have a refractive index 1.8, another alternative other than the index matching liquid is used. For the soft glass SF57 fibre, we use a dark black solution called graphite adhesive to strip off the light from cladding mode. This will then attenuate the light propagating in the cladding. D. Splicing No attempt was made to splice the soft glass SF57 HFs, but a splicing experiment was demonstrated on the bismuth glass HFs [1]. Using a conventional mechanical cleaver and a fusion splicer, bismuth glass HF with 2.6 μm triangle core (A eff ~ 2.7 μm 2 ) was spliced to a silica SMF28 patchcord with A eff = 14-15μm 2. Due to the much lower melting temperature of the bismuth glass relative to silica glass, very small values for the fusion time and current were used. The splices achieved were mechanically strong, especially with respect to applied strain in the axial direction. Although the total splicing loss achieved to date is still quite high 5.8 db, it can largely be accounted for by individual mode-mismatches at the various buffer fibre interfaces (minimum 3.8 db, without taking into account the mismatch in the mode shape) and an additional 0.1 db due to Fresnel reflection at the bismuth glass HF / silica fibre interface. Splicing job on the SF57 lead silicate glass HF will be performed in the future work.
91 CHAPTER 3 HF optical properties measurement Launching light into soft glass HF There are mainly two different input launch conditions that are used in the measurement of HF characteristics. An overfilled launch was used in launching the light into the test fibre. The lenses are chosen such that the launched spot at the fibre end has a greater NA than that of the fibre NA and the spot size is greater than the core diameter Coupling from HF to the detector When coupling light from the test HF to the detector, care should be taken that the light emerging from the HF illuminates about 70% of the detector area around the centre. This avoids any non-uniformities present in the detector surface and also will reduce the intensity level on the detector, hence reducing the problem of saturation. 3.3 Mode profile WW HFs guide light in a very small solid glass core, surrounded by a microstructured cladding formed by 3 large air lobes. The properties of the core closely resemble those of a rod of glass suspended in air, named air suspended rod (ASR), resulting in strong confinement of light and, correspondingly, a large nonlinear coefficient. ASR is the fundamental limit for air/glass microstructures (refer to 3.3). SEST HFs guide light in a fairly small solid glass core, surrounded by a microstructured cladding of a hexagonal arrangement of effectively 4 rings of holes (48 holes in total). The fundamental mode exhibits the near hexagonal symmetry of the fibre core (refer to 3.1).

92 CHAPTER 3 HF optical properties measurement Geometrical dimension of the fibre core The core of the WW preform and the WW cane are circular in shape but when the assembled preform is drawn into fibres, the core of the fibres becomes triangularly shaped due to the glass surface tension during the fibre drawing. To derive a core diameter for a triangular core shape, a method referenced from H. Ebendorff- Heidepriem et al. [1] is followed (refer to Figure 3.3): 1. The enclosed core diameter, which is the diameter of the circle that fits just inside the core region, is determined (red circle). 2. A triangular shape that circumvents the enclosed core, which is nicely fitted inside the core region (blue triangle), is determined. 3. The diameter of the circle (blue circle), which has the same area as the triangle, is defined as the triangular core diameter. The relationship between the enclosed core diameter, D enclosed and the triangular core diameter, D triangular can be defined as: D triangular = 3/ π 3 x D enclosed = x D enclosed 3.3 Air surrounding the rod glass rod (a) (b) Figure 3.3: (a) Structure of a ASR (b) Definition of enclosed and triangular core diameter. The triangular core diameter is used for comparison with the ASR model [1]. With the SEST design, we were able to fabricate soft glass HFs with an hexagonal arrangement of effectively 4 rings of holes (48 holes in total). SEST HF
.")

93 CHAPTER 3 HF optical properties measurement 68 exhibits the near hexagonal symmetry of the fibre core. The measurement of the core diameter is the measurement of the diameter of the circle that fits in the core region, as displayed in Figure 3.3 (a). To derive a useful core diameter from the triangular fibre core shape, we employed the following method. The 3 diameters across the holes that fit just inside the hexagonal core region, as depicted in Figure 3.4, are determined. The diameter of the core is represented by the average of the 3 diameters as shown below. Figure 3.4: (a) Definition of hexagonal core diameter for SEST HF (b) The diameter of the core is represented by the average of the 3 diameters. Note that the measurements in red are in pixel units and will then be converted into μm. For example: A1= 2.46μm, A2= 2.72μm, A3=2.51μm and the average core diameter= 2.56μm Mode profile measurement In order to check on the guided modes of the HFs at particular wavelengths, two laser sources were used in conducting these measurements. A Nd:YLF source was used to get the mode profile of WW HFs at 1040nm while an EDFA source was used for checking the mode/modes of SEST HF at 1550nm. The experimental set up for the mode profile measurement is demonstrated in Figure 3.5. A beam at 1040nm was launched directly into the holey fibre under test (HFUT), and the expected near field images were observed by using an infrared charge coupled device (CCD)
94 CHAPTER 3 HF optical properties measurement 69 camera. Some examples of the near field images for the measured fibres are shown in Figure 3.6. Figure 3.5: Experimental setup for mode profile measurement Figure 3.6: Some examples of mode profile of the studied HFs 3.4 Propagation loss Loss mechanism in small core extruded HFs [2]: The total losses of optical fibres can be written as a sum of different factors α(λ) = α uv + α IR + α s + α IM + α c 3.1 where α uv, α IR and α s are the losses due to the electronic transitions in the ultraviolet, multi-phonon absorption in the infrared and scattering losses respectively. α IM and α c denote the losses induced by the impurities (hydroxyl groups or transition metal ions etc) and confinement losses respectively.

95 CHAPTER 3 HF optical properties measurement 70 The scattering mechanisms that occur within the HFs are more complicated than in conventional fibres. In addition to the Rayleigh scattering, that originates from nanometer-scale refractive index inhomogeneities inside the glass due to its random molecular structure, perturbations to the guided modes can result from any fluctuations in the fibre geometry along the length. In particular, a longitudinal variation of the structure promotes modal coupling to high-order, or radiation modes, resulting in excess losses [3]. Scattering loss is a term that is usually used to refer to Rayleigh scattering in optical fibres, but the other mechanisms such as imperfections, can also lead to scattering losses. Examples of such imperfections in extruded nonsilica HFs are bubbles, defects (shown in Figure 3.7) and diameter variations, which can cause coupling to the radiation modes. The fabricated HFs may be multi-moded and higher order modes may suffer from excess losses due to their core confinement [3]. Therefore, any modal coupling to higher order modes in this fibre effectively contributes to the total losses, which may take the form of coupling to radiation modes in single mode waveguides. Figure 3.7: Optical microscope images of the defects found in some extruded fibre preforms (these defects are in micron scale). The loss induced by impurities has yet to be investigated in detail. So far, we have observed some traces of black particles present in the extruded SF57 and bismuth oxide preforms (this is depicted in Figure 3.8) and the presence of the hydroxyl ions has been a significant problem for fibre loss. Therefore, a substantially different approach needs to be considered in order to reduce the fibre loss.
96 CHAPTER 3 HF optical properties measurement 71 Figure 3.8: Optical microscope images of impurities (black particles) found in some extruded fibre preforms (these fine particles are in micron scale). Confinement losses are the most unique loss mechanism in HFs [4], which arises from the fact that the HF has a single material design where the core of the HFs has the same refractive index as the region beyond the finite holey cladding. Hence, the modes within the HFs are inherently leaky. Although this fibre supports only leaky modes, it is possible to design a lower loss fibre. This can be done by ensuring that the supporting struts are long and fine enough that they act purely as structural members that isolate the core from the external environment. The fibres can be effectively single mode over a broad range of wavelengths since the confinement losses associated with any higher order modes are significantly higher than that of the fundamental mode [4] Loss measurement Loss is one of the key parameters for the fabrication of efficient optical fibres. There are quite a few different loss measurement methods, such as cut-back for optical fibre, Fabry-Perot [5], prism coupling method [6], insertion loss method, OTDR method [7,8] and many others. In this work, the cut-back method was used since it is an internationally recognised reference test method and it offers the highest measurement accuracy. Propagation loss in fibre is usually measured by the cut-back method. A broadband light source or a laser source can be used, this depends on the applications. In SF57 bare fibres and HFs loss measurement, both sources (a laser diode at 1550nm and a tungsten halogen lamp (a white light broadband source)) were used. The
97 CHAPTER 3 HF optical properties measurement 72 experimental set up for both the spot loss measurement and the broadband loss measurement are shown in Figure 3.10 and Figure 3.11 respectively Spot loss measurement Figure 3.10 is the schematic diagram for a single wavelength loss measurement setup. For spot loss measurement, a laser diode at 1550nm operating wavelength is used. The light is launched into the core of the HFUT through free space coupling. The input coupling lens is usually of focal length 3.1mm, NA=0.68. The light emitted from the other end of the fibre is collected by a large area thermal detector and the resulting signal powers are recorded. The detector end of the fibre is then cut-back by a known length, cleaved and reinserted in the detector assembly without disturbing the launch conditions. To get accurate results, usually the fibre end will be cleaved a few times to maximise the detected signal, at the same time optimise the cleaved end. The transmitted power through this short length of fibre is again recorded to provide a reference level from which to calculate the single wavelength attenuation of the fibre under test. The spot loss of the fibre at a certain wavelength is calculated as follows:- Loss (db/m) = 10 log 10 (P2/P1)/cut-back length (m) 3.2 where, P1 is the initial output power and P2 is the output power after cut-back and the cut-back length is measured in units of meter. Please note that, the process has to be repeated for >3 times for a higher accuracy reading. Figure 3.10: Spot/single wavelength loss measurement setup with ASE source
98 CHAPTER 3 HF optical properties measurement Broadband loss measurement Figure 3.11 illustrates the spectral loss measurement setup. For the measurement of the HFs broadband loss in the near IR region, a tungsten halogen lamp (0.25 μm -2.5 μm) is used as the white light broadband source, which is advantageous since it covers the wide spectral loss of the HF. The white light is coupled into the core of HFUT through a x50 objective lens. The other end of the HFUT is then connected to a fibre SMA connector which is connected to the detector of an optical spectrum analyzer (OSA). It can be used to record the transmission spectra from 350nm-1750nm. The power transmitted is recorded as a function of wavelength. The detector end of the fibre is then cut back by a known length and the cleaved end is reinserted in the detector assembly without disturbing the launch conditions. The transmitted power through this short length of fibre is again recorded as a function of wavelength. The spectral loss of the fibre is calculated using the same Equation 3.2. Note: It is very important to make sure all the light in the cladding modes is totally stripped off in order to get accurate results. We coat a layer of graphite adhesive on the soft glass HF in order to remove the cladding light. Figure 3.11: Spectral loss measurement setup with broadband white light source
99 CHAPTER 3 HF optical properties measurement Effective mode area and nonlinearity Effective nonlinearity, γ, measurement Basic principle of the measurement approach Several approaches for measuring the nonlinearity of a fibre have been proposed, typically those are based on measuring the n 2, and exploit different nonlinear effects, such as self-phase modulation, modulation instability and a technique based on four wave mixing [9]. Here, we measured the effective nonlinear coefficient, γ, for the WW HFs and the SEST HFs using the Boskovich method [10]. This method is based on the measurement of the nonlinear phase shift induced through the SPM effect with a continuous wave, dual-frequency optical beat signal propagating through the fibre. If the dispersion is neglected, the linear expression linking the nonlinear phase shift of the beat signal propagating along the fibre under test and the launched power is shown below [10]: Φ SPM = 2 ω c 0 n A 2 eff L eff P in 3.4 n A 2 γ α 3.5 eff where P in is the input power of the signal, L eff is the effective length of the fibre, ω 0 is the central frequency of operation and c is the speed of light. Since the nonlinear coefficient is proportional to the ratio n 2 / A eff, γ can be determined via the experimentally measured SPM generated phase shift at different average power levels. The effective length, which determines the nonlinear interaction length, can be written as follow: L eff = [1-e -αl ] / α 3.6
100 CHAPTER 3 HF optical properties measurement 75 α(m -1 )=ln 10 [loss(db/m)/10] = 0.23 x loss (db/m) 3.7 where α is the loss coefficient in m -1, based on a natural logarithm, and is converted from loss in unit db/m, based on logarithm to the base 10, in equation 3.7. The SPM induced phase shift can be measured in the spectral domain using a OSA as the electrical field is a periodic function in time and thus it has a discrete spectrum, consisting of harmonics of the beat frequency, as shown in Figure The intensity ratio between the signal and the first sideband gives the nonlinear phase shift. Spectral sidebands arise due to SPM in the high nonlinearity HF I 0 Power [db] -40 I Wavelength [nm] Figure 3.12: A typical SPM spectrum generated by the propagation of a beat signal in the WW HF From [10], by taking the Fourier transform of the equation that exhibits the evolution of the electric field of the beat signal; we can analytically get the intensity ratio in terms of Bessel functions: I I ( φspm /2) + J1 ( φspm /2) 2 ( φ /2) + J ( φ /2) J 0 = J 1 2 SPM 2 SPM
101 CHAPTER 3 HF optical properties measurement 76 where I 0, I 1 are the intensities of the zero and first order harmonics and J n is the Bessel function of the nth order [10]. The nonlinear phase shift for a launched signal power P in can be readily determined from the intensity ratio shown in the spectral domain of the OSA Experimental setup Figure 3.13: Experimental setup of the nonlinear coefficient γ measurement The experimental setup for the measurement of the nonlinear coefficient is shown in Figure Two continuous wave (CW), tuneable distributed-feedback lasers were used to provide the beat signal which was amplified with a high power EDFA. The operating wavelength of the lasers was chosen to be approximately 1563 nm since the EDFA provides a better noise figure and a higher gain at this wavelength. The wavelength separation between the two signals was chosen to be around 0.2 nm so as to minimise the effect of dispersion [10], while the optical power from the two signals was adjusted so that the EDFA was driven into saturation. In this way, an optimum signal-to-noise ratio of approximately 50 db was obtained. Identical polarizations were achieved for the two frequencies by adjusting the polarisation controllers, PC1 and PC2. The amplified beat-frequency signal was then
102 CHAPTER 3 HF optical properties measurement 77 free-space coupled into a short piece of the HFUT, which is typically about 1-3 meters long depending on the fibre loss, after passing through a variable attenuator. The attenuator was formed by a combination of a λ/2 waveplate and a polariser where the input power of the fibre is controlled by the rotation of the waveplate. Since all the HFs exhibited some birefringent behaviour, the polariser had to be adjusted so that the input signal was aligned on the primary polarisation axis of the HF under test. Polarisation extinction ratios for the HFs studied were of the order of 6-9 db. The ratio between the first and zero-order harmonics for different input powers was recorded by monitoring the launched power and the output spectrum power. With the ratio obtained, the corresponding phase shift was calculated using equation 3.8. It was pointed out that a small nonlinear phase shift of ~0.08 rad was subtracted from the measured phase shift. This was done to compensate for the nonlinear phase shift induced by the amplifier prior to propagation through the fibre. By plotting the phase shift against the input power and then substituting its gradient into the Equation 3.8, the nonlinear coefficient can be determined from the slope of the linear fit. An example is shown in the Figure 3.14 below:
103 CHAPTER 3 HF optical properties measurement 78 Nonlinearity of SHF069 (1.8core) Phase Shift (rad) Input power(mw) Phase Shift vs Input Power Best Fit Figure 3.14: An example of phase shift vs. input power for a measured HF - Fibre length: 12 m - Fibre Attenuation: 2.0 db/m - Effective length: m - Attenuation coefficient = m -1 - For P launched = 900mW, P fibre_output = mw - attenuation_coefficient * fibre_length Thus, P input = P fibre_output / e and P input = mw - Coupling Efficiency = (15.24 %) - Φ spm = 2 x γ x L eff x (coupling_efficiency x P launched ) - Nonlinearity of EDFA: Φ EDFA = rad (I 0 / I 1 = db) γ = 404 ± 21 W -1 km -1
104 CHAPTER 3 HF optical properties measurement Effective mode area measurement The effective mode areas of the WW HFs can be determined using 3 methods: A. In the first experiment, the intensity (electric field) information from the measured HF mode profiles (near field images), that were captured by CCD camera were extracted. The data of the measured HFs cross sections (X, Y) was then well interpolated by a Gaussian fit. From the fitting, the expected spot waist (W) can be determined because, as we can see from the Equations 3.9 and 3.10 below, c=w. The mode area for this Gaussian beam is πw 2 [11]. Electric field equation, 2 2 E exp (x y ) 2 w = o 3.9 E(x, y) + Gaussian fit equation, G 2 2 (x + b ) 2 c = a exp 3.10 Some preliminary measurements have been conducted using this technique on SF57 WW HF with a triangular core but the results are not promising. More measurements will be investigated in the future using this approach in order to get a reliable A eff measured from mode profiles. B. The second method is based on modelling, which is performed by my colleagues, Dr. V. Finazzi and Francesco Poletti, using the finite element method (FEM) from commercial software named FEMLAB. C. The third approach to obtain the measured mode area is to calculate it from Equation 3.5 via measured γ. The effective area for the HFs can be retrieved from the equation if other parameters are known. 3.6 Dispersion HFs are a rapidly emerging fibre technology which, because of the increased
105 CHAPTER 3 HF optical properties measurement 80 range of fabrication parameters compared to standard fibres, can be designed and fabricated with a dispersion property beyond those previously possible. With the HF technology, it is now possible to exploit soliton and supercontinuum (SC) effects within sources operating in the visible to near infrared (NIR) up to mid-infrared (mid- IR) regions of the spectrum [12-13]. The dispersion value of the highly nonlinear fibre (HNLF) is a critical parameter for the efficient spectral broadening of the signal, and hence for the proper operation of the regenerator. While several different techniques can be used for the dispersion characterization, a relatively long piece of fibre, usually in the order of km is required; especially if accurate results are to be obtained. However, for nonconventional HNLF, particularly in the case of HFs, only a few meters of length are necessary Dispersion measurement Dispersion measurement for SEST HF at 1550nm To perform this measurement, alternative methods, based on interferometric techniques, have been developed at the ORC by Asimakis et al. [14, 15]. The setup used for the dispersion characterization is depicted in Figure M 1 M 2 HNLF ASE EDFA BS 1 L 1 L 2 BS 2 OSA Figure 3.15: Setup for dispersion characterization of SEST, based on interferometric techniques.
106 CHAPTER 3 HF optical properties measurement 81 Light from a broadband light source (in our case the ASE from an EDFA) is split with a beam splitter (BS1). Light is coupled into, and propagates through the holey fibre under test via a lens (L1) on the first arm of the interferometer. On the second arm, light propagates freely, covering a tunable path length which can be adjusted by the positions of the mirrors (M1 and M2). Light from each arm interferes with each other after BS2 before being directed into an Optical Spectrum Analyzer (OSA). Interference fringes superimposed onto the broad spectrum of the ASE should be observed provided that the path length in the second arm is adequately adjusted. After this a clear interference scheme can be obtained by artificially subtracting the ASE from the spectrum. Using the spectral distance of successive peaks, the group delay as a function of frequency can be calculated as: ( ) Φ( ) dφ ω δ ω 2π τ( ω ) = = dω δω ωi ω i where ω i is the frequency of the i th peak, andω = ( ωi + ω i + 1)/2. The delay is fitted to a polynomial curve. The derivative of the fit yields the dispersion dτ / dλ. Figure 3.16 is the example of the spectrum obtained from the OSA, when a measurement was carried out on a 2m span of lead silicate SF57 HF. 2,00E+04 1,50E+04 1,00E+04 5,00E+03 0,00E Figure 3.16: Interference fringes in the spectrum obtained by OSA.


107 CHAPTER 3 HF optical properties measurement Birefringence HFs can potentially be made very highly birefringent. Small core HFs offer an approach for producing highly birefringent fibres via asymmetric core/cladding structures. This type of birefringence is known as form birefringence and can be increased if the index contrast between the core-cladding is high and if the corecladding features are on the light wavelength scale. Minor imperfections in the fibre structure can lead to high form birefringence in small core HFs. Various asymmetric cladding geometries have successfully created highly birefringent small core HFs. An example of which, is a small elliptical core silica HF made in ORC [16] that has a beat length of 0.44mm, which is 10 times less than conventional high birefringence optical fibre of about 4mm [16]. Conversely, the form birefringence is typically low in large mode area single mode fibres with minor imperfections, in which the beat length is of the order of 3-5m at 1060nm [16]. Thus, this example shows that this effect decreases as the fibre core increases and the hole size decreases Birefringence measurement setup Figure 3.17: SEM of the cross section of the WW HF and SEST HF
108 CHAPTER 3 HF optical properties measurement 83 Figure 3.18: Experimental setup for beat length measurement using the wavelength scanning method. Figure 3.17 shows the type of HFs sample used in this measurement. As can be seen in the figure, the core has a quite symmetric shape (>2 fold symmetry), but due to the very small core size and high core-clad index difference, it is directly linked to a high value of birefringence in the fibre. Figure 3.18 shows the experimental setup for the beat length measurement using the wavelength scanning method. This wavelength dependent method has been used in measuring the beat length of HFs as most of the direct birefringence measurement methods of conventional fibre failed [17]. A broadband ASE source (Yb 3+ ), with a spectrum span from 1030nm-1120nm, was used for the WW HF measurement while an EDFA source was used in the SEST HF measurement. Since the light from the ASE source is randomly polarised, a polarizer was used to polarise the light launched into the HFUT. The input polarizer was used to ensure that the light polarization at the fibre input was aligned at 45 0 to the principal axis of the test fibre. The fixed length L of the test fibre was laid flat to avoid bending effects. A second polarizer, which acts as a polarisation analyser, was placed at the output end with its principal axis aligned at 45 0 to the axis of the fibre, and the output is scanned through an OSA in small steps. Figure 3.19 depicts the scanned modulated spectral output from the OSA Basic principle of the measurement approach Beat length is usually used as the figure of merit in quantifying the birefringence of a fibre. The wavelength interval Δλ for one complete cycle of
109 CHAPTER 3 HF optical properties measurement 84 polarisation evolution is related to the physical beat length L b (λ). Δλ is the spacing of the modulation (the wavelength separation between the 2 adjacent peaks in the modulation spectrum). The beat length of a fibre can be calculated through this equation [11]: Δλ L b = L 3.12 λ o where L is the length of the HFUT, λ 0 is the operating wavelength between the 2 peaks. The group birefringence, B is the group index difference between 2 polarisation modes and it is related to the beat length by the equation below [1]: λ B = 3.13 L b From the OSA modulated spectrum, the fibre beat length and a group birefringence is calculated from the equation respectively Normalised Intensity wavelength (nm) Figure 3.19: Scanned modulated spectral output from the OSA. Table 3.1: The list of measured birefringence properties Sample F2#1(1.2μm core) L(mm) 960 Δλ (nm) 3.4 λ 0 (nm) 1060 L b (mm) 3.08
110 CHAPTER 3 HF optical properties measurement 85 For example, a 96cm HF was used in conducting the birefringence measurement. From the modulated spectral output shown in Figure 3.19, we can measure the operating wavelength between the 2 peaks, Δλ, as 3.4nm. Based on Equation 3.12 and 3.13, we can obtain the beat length and group birefringence of the measured fibre. 3.4 nm L b = 960mm. = 3.08mm 1060 nm 3.8 Figure-of-merit (FOM) The FOM considerations are referred to H. Ebendorff-Heidepriem et al. [1]. The evaluation of nonlinear (NL) performance of a fibre is generally based on the power-length-product to create NL effects. Take for example a NL phase shift φ, φ = 2 x γ x P in x L eff, 3.14 where γ is the effective NL coefficient, P in is the input power and L eff is the effective fibre length, which determines the NL interactive length. L eff = [1-exp(-α x L)]/α, 3.15 where α is the fibre loss coefficient, α = -ln T/L, 3.16 and T is the fibre transmission related to the output power P out and input power by T=P out /P in. The fibre loss in db/m is related to α by fibre loss in db/m = 10 / x α. 3.17
111 CHAPTER 3 HF optical properties measurement 86 γ and α, in equation (3.14 and 3.15) respectively, are the fibre-specific parameters which determine the NL phase shift. Therefore, the product of γ x L eff is a useful FOM as it takes into account both effective nonlinearity and fibre loss. A high value of FOM indicates that a larger NL effect (e.g. NL phase shift) can be achieved within a certain input power or a smaller power is required for a certain NL effect. Depending on the requirements of different device types, different fibre lengths are set and thus different FOMs will be identified. Here, we have identified two different fibre lengths and thus two different FOMs. For example, there are: a. devices based on maximum useful fibre length and, b. compact devices using 1 m or less fibre length FOM for devices based on maximum useful fibre length The benefit of such devices is the minimization of the power requirements by maximizing the fibre length. Here we define L * as the maximum useful fibre length for which L * eff = 0.9 L*. For longer fibre lengths (i.e. L eff < 0.9 L), the difference between the effective fibre length and the real fibre length results in a degradation of the NL performance [18]. Using Equations 3.15 and 3.16, L * corresponds to a fibre transmission of T * = as described in the following: Replacing L * and L * eff = 0.9 L* in Equation 3.15, we obtain: L * eff = [1 exp( α L* )] / α = 0.9 L * 3.18 α = ln T * / L * 3.19 L * = ln T * / α 3.20 Replacing α and L * in Equation 3.18 results in: [1 exp( ( ln T * / L * ) L * )] / α = 0.9 ( ln T * / α) 3.21 exp( ( ln T * / L * ) L * ) = exp(+ ln T * ) = T * 3.22
112 CHAPTER 3 HF optical properties measurement 87 Multiplying Equation 3.21 with α and using Equation 3.22 gives: [1 T * ] = 0.9 ( ln T * ) 3.23 Rearrangement of equation 3.23 gives: 0.9 ln T * T * = The solution for this equation is T * = To obtain L * eff, use equations 3.15, 3.21, 3.22 and T * = L * eff = (1 T* ) / α = / α 3.25 Based on Equations 3.14 and 3.25, the FOM, γ L * eff is: γ x L * eff = (1 T* ) x γ/α = γ/α = Δ φ / (2 P in ), which indicates that γ/α serves as a FOM for the NL performance provided that fibres with lengths relating to identical fibre transmission values are compared to each other. In other words, fibres with the same ratio L eff /L are compared to each other FOM for compact device using 1m fibre length In compact devices, the real fibre length is of the order of 1 m or shorter. Therefore, the real fibre length is fixed to 1m when evaluating the nonlinear performance of compact devices. The FOM is then: γ x L eff,1m = [1-exp(- α x 1m)] x γ/α = φ /(2 x P in ) It is noteworthy that for fibre losses < 10 db/m. the term [1-exp(- α x 1m)] is significantly smaller than 1 and hence the term γ / α is not a useful FOM under this condition. Since the main focus of this study is on the HF for supercontinuum (SC) compact devices, we will pay more attention to FOM for compact device using 1m
113 CHAPTER 3 HF optical properties measurement 88 although only tens of centimetres of our soft glass HF (WW and SEST HFs) is already sufficient to generate an efficient SC generation (Refer to Chapter 6 for more details) Conclusion This chapter demonstrated the measurement techniques for the main optical properties of the small core soft glass HFs: the mode profile, the propagation loss, the effective nonlinearity coefficient, γ, the dispersion and the birefringence. Table 3.2 is the list of measurements we have performed on the studied HFs: WW and SEST HFs, and the results of the measurements will be discussed thoroughly later, in Chapter 4 and 5 respectively. The mode profile of the both studied fibres was conducted by launching certain wavelength of laser source into them and checking on the near field images of the HFs. The propagation loss of the small core HFs is measured by the cut-back method. Both single wavelength/spot and spectral loss measurements were performed. Both sets of results from these measurements were compared to assess on the measurement accuracy. The effective nonlinearity of the small core HFs is measured by using the Boskovich method [10], which is based on the measurement of the nonlinear phase shift induced through the SPM effect with a continuous wave, dual-frequency optical beat signal propagating through the fibre. The effective mode area of the HFs can be calculated using Equation 3.5. Alternatively, it can be determined based on the modelling process.
114 CHAPTER 3 HF optical properties measurement 89 The dispersion value of the highly nonlinear fibre (HNLF) is a critical parameter for the efficient spectral broadening of the signal, and hence for the proper operation of the regenerator. Dispersion measurement based on the interferometric technique has been developed in the ORC by Asimakis et al. [14,15], and it has been used in measuring these highly nonlinear soft glass HFs. Small core HFs offer an approach for producing highly birefringent fibres via asymmetric core/cladding structures and highly birefringent HF is a promising medium for efficient supercontinuum generation. We conducted the wavelength scanning method to generate a modulated spectrum and, from this, the beat length of the fibres was calculated by using the Equation Table 3.2: A summary of the optical property measurements performed on both the WW HFs and SEST HFs. Type of optical property WW HF SEST HF characterisation Loss Spot measurement White light measurement Nonlinearity Effective nonlinearity Coeff. (γ) Effective mode area (A eff ) Birefringence FOM Last but not least, the proper FOM for our highly nonlinear soft glass HFs is discussed. Depending on the requirements of different device types, different fibre
115 CHAPTER 3 HF optical properties measurement 90 lengths are set and thus different FOMs will be identified. Here, we have identified two different fibre lengths and thus two different FOMs: a) devices based on maximum useful fibre length and, b) compact devices using 1 m or less fibre length. Since the main focus of this work is on the HF for nonlinear compact devices, mainly SC, therefore the discussion will pay more attention to compact devices using 1m fibre length.
116 CHAPTER 3 HF optical properties measurement References 1. H. Ebendorff-Heidepriem, P. Petropoulos, S. Asimakis, V. Finazzi, R. Moore, K. Frampton, F. Koizumi, D. Richardson, and T. Monro, "Bismuth glass holey fibers with high nonlinearity," Opt. Express 12, (2004). 2. S. S. Walker, Rapid modelling and estimation of total spectral loss in optical fibers, J.Lightwave. Tech. 4, pp (1996). 3. K. Furusawa, Development of rare earth doped microstructured optical fibres, PhD Thesis, University of Southampton (2003). 4. V. Finazzi, T. M. Monro, D. J. Richardson, Small-core silica holey fibers: nonlinearity and confinement loss trade-offs, J. Opt. Soc. Am. B, 20, (2003). 5. S. R. Mallinson, "Wavelength-selective filters for single-mode fiber WDM systems using Fabry-Perot interferometers," Appl. Opt. 26, 430 (1987). 6. Y. Okamura, S. Yoshinaka, and S. Yamamoto, "Measuring mode propagation losses of integrated optical waveguides: a simple method," Appl. Opt. 22, 3892 (1983). 7. Kapron F. P., Adams B. P., Thomas E. A., Peters J. W., Fiber-optic reflection measurements using OCWR and OTDR techniques, Journal Of Lightwave Technology, 7(8), (Aug 1989). 8. Blanchard P., Zongo P.H., Facq P., Accurate reflectance and optical fiber backscatter parameter measurements using an OTDR, Electronics Letters, 26(25), , (Dec ). 9. B. Batagelj, P. Ritosa, M. Vidmar, S. Tomazic, Noninterferometric measurement schemes for determination of single mode optical fiber nonlinear coefficient: a comparative study, Advanced Optoelectronics and Lasers, 2005, Proceedings of CAOL 2005, part. 2, , Sept A. Boskovich, S.V. Chernikov, J.R. Taylor, L. Gruner-Nielsen, and O.A. Levring, Direct continuous-wave measurement of n 2 in various types of telecommunication fiber at 1.55 µm, Opt. Lett., 21, (1996). 11. G. P. Agrawal, Nonlinear Fiber Optics, 2nd ed. (Academic Press, Inc., 1995).
117 CHAPTER 3 HF optical properties measurement J. H. V. Price, W. Belardi, T. M. Monro, A. Malinowski, A. Piper, and D. J. Richardson, "Soliton transmission and supercontinuum generation in holey fiber, using a diode pumped Ytterbium fiber source," Opt. Express 10, (2002). 13. J.H.V.Price, T.M.Monro, H.Ebendorff-Heidepriem, F.Poletti, V.Finazzi, J.Y.Y.Leong, P.Petropoulos, J.C.Flanagan, G.Brambilla, X.Feng, D.J.Richardson, Mid-IR supercontinuum generation in non-silica glass fibers, Photonics West San Jose, California, Jan 2006 (Invited). 14. S.Asimakis, P.Petropoulos, F.Poletti, J.Y.Y.Leong, H.Ebendorff- Heidepriem, R.C.Moore, K.E.Frampton, X.Feng, W.H.Loh, T.M.Monro, D.J.Richardson, Efficient four-wave-mixing at 1.55 microns in a shortlength dispersion shifted lead silicate holey fibre, ECOC 2006 Cannes, Sept S.Asimakis, P.Petropoulos, F.Poletti, J.Y.Y.Leong, R.C.Moore, K.E.Frampton, X.Feng, W.H.Loh, D.J.Richardson, Towards efficient and broadband four-wave-mixing using short-length dispersion tailored lead silicate holey fibers, Opt. Express, 15, pp (2007). 16. J. C. Baggett, Bending losses in large mode area holey fibres, PhD Thesis, University of Southampton (June 2004). 17. A. Ortigosa-Blanch, J. C. Knight, W. J. Wadsworth, J. Arriaga, B. J. Mangan, T. A Birks, and P. St. J. Russell, Highly birefringent photonic crystal fibers, Opt. Lett. 25, (2000). 18. P. Petropoulos, T. M. Monro, H. Ebendorff-Heidepriem, K. Frampton, R. C. Moore, and D. J. Richardson, Highly nonlinear and anomalously dispersive lead silicate glass holey fibers, Opt. Express 11, (2003).
118 CHAPTER 4 Fabrication of simple structure soft glass HF 4.1 Introduction This chapter concerns the design, characterisation and particularly the fabrication of simple structure soft glass HFs with small cores, for nonlinear device applications. There are several distinctly different opportunities offered by small core soft glass HFs, compared with conventional fibres (CFs) and silica HFs: unique dispersion properties [1-7] and extremely high nonlinearity [4-9]. To date, most work on HFs has focussed solely on silica glass. However, recently, the use of some exotic non-silica glasses (for example, tellurite, lead silicate, bismuth silicate and chalcogenide glasses), has provided optical properties that are not available in silica such as mid-ir transmission, and high values of refractive index and nonlinearity. Therefore, these so called soft glasses have opened up a route to even higher nonlinear fibres [9]. Chalcogenide glasses, for example, exhibit more than 2 orders of magnitude higher nonlinear refractive index than silica, and recently a very high nonlinearity conventional fibre (CF) of γ=1000 W -1 km -1 has been reported [7]. The CF with the highest nonlinearity of γ=1360 W -1 km -1 that is made from a bismuth-oxide glass is also reported [10]. However due to the conventional solid cladding, the dispersion of these waveguides was dominated by the high normal material dispersion of the glasses, which can be detrimental for device functionality and performance. In contrast, the strong waveguiding properties of HFs allow to overcome the large normal material dispersion of high index glasses. Thus, in this work, we seek to combine the advantages of the HF technology with high nonlinearity glass to achieve a record nonlinearity for a HF. The initial phase of HFs fabrication is to make a preform of glass from which a fibre can be drawn. A structured preform could potentially be synthesised by a
119 CHAPTER 4 Fabrication of simple structure soft glass HF 94 variety of methods such as the sol-gel methods, or be fabricated by the most commonly used method to date which is by stacking glass capillaries. Practical techniques that have been used in manufacturing the macroscopic structure of nonsilica HF preforms are capillary stacking, ultrasonic drilling, build in casting and extrusion. To date, most reported research on preform fabrication techniques for nonsilica HFs is by extrusion. Extrusion offers a controlled and reproducible approach for fabricating complex structured preforms with a good surface quality. In addition, extrusion can be used to produce structures that could not be created with the capillary stacking approaches, and so a significantly broader range of properties should be accessible in extruded HFs. The extrusion approach was first applied in polymer HF preform production [11], and this alternative approach has been recently extended to the soft glasses such as tellurite [12-13], lead silicate [4-6,9,14-15], bismuth silicate [7] and chalcogenide glasses [16]. In addition, by avoiding stacking, fewer interfaces are involved. Single material HF designs also avoid core/cladding interface problems, and so should potentially allow low-loss fibres to be drawn from an extruded HF preform. In this research project, the HF preforms will be prepared from a bulk material by using extrusion. Schott SF57, a commercial lead silicate glass that we have focused on in this chapter, exhibits the highest nonlinearity among the commercially available lead silicate glasses. This is an attractive material for nonlinear devices. It shows a high material nonlinearity and at the same time, exhibits good mechanical, chemical and thermal stability that allows for an easy fibre fabrication process. Like many soft glasses, SF57 has a low processing temperature of ~520 0 C (note that the softening temperature for silica glass is C) and so it is possible to extrude the HF preform directly from the bulk glass. Aside from being simpler and less labour intensive than the more conventional stacking technique developed for silica HFs, extrusion readily allows the implementation of structures with high air content claddings as required for high nonlinearity fibre fabrication. Of all the aforementioned high index soft glass types, lead silicate glasses offer the highest thermal and crystallization stability and exhibits the least steep viscosity-temperature curves making them particularly attractive for HF fabrication. However, it must be appreciated that their intrinsic material nonlinearity is lower than that of chalcogenide and heavy metal oxide glasses [17].
120 CHAPTER 4 Fabrication of simple structure soft glass HF 95 The objective of this work is to explore the limits of nonlinearity and dispersion control in lead-silicate based microstructured fibres, at the same time minimizing the loss of these soft glass HFs. Our focus has been on establishing the maximum nonlinearity that can be achieved in these fibres at telecommunications wavelengths, and to develop high nonlinearity fibres with dispersion-shifted characteristics suited for SC generation applications at 1.06 μm. In this chapter, preform fabrication involves extruding jacketing tubes and also the structured preforms. Good dimensional control and surface finish of preforms can be achieved through the optimization of the extrusion parameters such as temperatures, pressure and die design. In later sections, practical issues related to the preparation of preforms are described as it is necessary to correctly prepare the structure which has a direct influence on the optical fibre s performance. The optical characteristics of the fabricated WW HFs are also discussed in Sections Fibre fabrication approach Preform making technique: Extrusion Figure 4.1 depicts the flow chart for the fabrication of the extruded HF. Each step in the flow chart will be explained in detail in the following sections. Figure 4.1: The flow chart for the fabrication of the extruded HF
121 CHAPTER 4 Fabrication of simple structure soft glass HF Principle of extrusion For bare fibre and HF fabrication, different shaped glass elements (rods, tubes, WW preforms, structured elements) are required. In this work, we used the extrusion technique for the fabrication of these shaped elements from bulk glass billets, which were obtained from glass blocks by ultrasonic drilling (please refer to Appendix 2(I)). In the extrusion process, the glass billet and the stainless steel die are placed within a stainless steel body, and this assembly is heated up to near the glass softening temperature. Then, by applying pressure, the glass is forced through the die and the shaped glass element emerges from the die, whereby the die exit geometry determines the glass element geometry. Figure 4.2: Schematic drawing of the ORC custom-designed extrusion apparatus Before extrusion can take place, it should be ensured that the glass billet and all parts (die, sleeve, stainless steel (SS) sheet, graphite sheet and piston (see figure 4.3)) are well assembled within the parent body. Referring to Figure 4.2, the sleeve is first inserted into the body; followed by the glass billet, and then the SS sheet and graphite sheet. The piston is the last to be added in the assembly.
122 CHAPTER 4 Fabrication of simple structure soft glass HF 97 Generally, there are four main parameters: temperature, pressure, the viscosity (η) and the surface tension (σ) of the glass, involve in the extrusion process. During the extrusion process, the SF57 glass billet is heated up near to the glass softening temperature (520 0 C), or temperatures that are corresponding to the glass viscosity range of poise, where the solid glass billet makes the transition into viscoelastic flow. Then pressure is applied to press the softened glass through the die at elevated temperatures near the softening point. The geometry of the extruded preform will be determined by the exit structure of the die. Once the optimum die geometry and process parameters have been established, good reproducibility in the preform geometry can be achieved. The advantage of this extrusion method is that the preform for the microstructured fibre can be produced without the need for stacking which is not only very labour intensive but also inferior in reproducibility. Good dimensional control and surface finish of preforms can be achieved through the optimization of the extrusion parameters such as temperatures, pressure and die design. The size, shape and quality of an extruded glass element depend on a variety of factors. die characteristics (material, surface roughness, exit geometry and size) process parameters (speed, temperature, pressure) glass type The impact of these factors on the extruded glass and their mutual relationships are described in the later sections Extrusion apparatus Figure 4.2 shows a custom designed extrusion apparatus, comprising of an oil based hydraulic press and a high temperature furnace, providing up to ~15 tons of force with the maximum operating temperature of C, which was used in extruding different shaped glass elements (rods, tubes, WW performs). The system gives a reasonable pressure control where the pressure can be changed during extrusion in order to obtain a targeted speed. More detailed explanations about the procedure for the extrusion process are given in Appendix 2 (II).


123 CHAPTER 4 Fabrication of simple structure soft glass HF 98 Figure 4.3 shows the parts and dies that are used for extruding the jacketing tube and structured preforms. Sleeve tube die core tube die nozzle WW die core WW die nozzle SF57 glass disc Stainless steel sheet graphite sheet piston Figure 4.3: Parts and die for extrusion The extrusion set-up basically consists of 4 main parts, which are: a. Rig- for applying pressure on the melted glass and it provides up to ~15 tons of force. b. Furnace- the heating elements have an operating temperature up to C. c. Glass billet- glass billet of certain surface tension, σ and viscosity, η is heated at the corresponding glass viscosity range of poise where the solid glass exhibits viscoelastic flow so that the preform with the desired

124 CHAPTER 4 Fabrication of simple structure soft glass HF 99 microstructure can be produced after the glass flow is extruded through the structured die. d. Die- The geometry of the extruded preform will be determined by the exit structure of the die. The quality of the extruded preform will be determined by the die characteristic in terms of the die material, surface roughness and design Die characteristics For all the previous work done on extrusion, the dies used were made of stainless steel 303, which is composed of 70%Fe-18%Cr-10%Ni. This die material is chosen because it is cheap and has good machining ability. Besides that, stainless steel has high thermal stability temperature, which is up to ~700 0 C compared to SF57 soft glass, which has a softening temperature at C. Figure 4.4: The rough idea of surface quality of various dies fabricated through different techniques: conventional machine cutting and spark erosion (image provided by Dr. H. Ebendorff-Heidepriem) In this work, dies of two different fabricated types were used: machined fabricated type and eroded and dry lubricant coated type as shown in Figure 4.4. Normally, dies are produced using conventional metal cutting machines, but this approach is not suitable for fabricating dies of a complex and intricate structure, although it is still manageable for WW design. Another alternative approach is spark erosion, which is a modern machining technique that machines two electrically conductive materials using electrical discharges, or sparks. During this process, a spark is generated from an electrode to a work piece. With each electric discharge, a

125 CHAPTER 4 Fabrication of simple structure soft glass HF 100 minute metal particle is eroded from the work piece at the location of the smallest gap between the two objects. In the case of dies required for WW preform extrusion, spark erosion is cheap, less labour intensive and the dimensions of the die design can be readily altered. However, spark erosion does not produce a completely smooth surface but a slightly rough, indented one and its surface is rougher (lots of voids) compared with the die fabricated from conventional machining. Furthermore, WW preforms extruded through the eroded dies contain a large number of grains at the inner surface of the preform walls, as observed in the earliest work on SF57 lead silicate glass extrusion. Therefore, in order to decrease the friction between glass and die, a good surface finishing for eroded dies is needed. There are several ways to overcome this problem, such as coating with dry lubricant, honing (mechanical polishing), use of another die material such as M333-steel (86%Fe-14%Cr) or nickel. Nickel helps in lowering the friction between the glass and the die, and thus provides a better surface finish. In this work, we coated the eroded dies with the dry lubricant, tungsten disulphide, because this method is fairly economical and it is believed to give a better surface finish compared to honing and the use of M333-steel or nickel dies (see Figure 4.5). As a result, less die swell occurred which led to better geometry preservation. Furthermore, extrusion at a low temperature at a certain speed can be applied and this results in less formation of crystals. (a) (b) Figure 4.5: The surface quality of dies fabricated through (a) the machine cutting technique without any coating and (b) the spark erosion technique where it is coated with dry lubricant, tungsten disulphide Cleaning process Cleaning the glass billets and the extrusion dies is crucial in order to avoid
126 CHAPTER 4 Fabrication of simple structure soft glass HF 101 contaminants that might be incorporated into the extruded preforms (such as chemicals used in eroded dies). An eroded die is made by eroding the stainless steel using chemicals. This can subsequently cause defects in the preforms due to the elevated temperature in the extrusion rig, where residues within a preform can be burnt and some elements can be diffused into the glass, which will increase the loss in the fibre and subsequently affect the performance and physical strength of the end fibre. Generally, the dies are cleaned with detergent combined with a heating application, while the glass billet is cleaned with methanol. Both, the glass billet and the dies are cleaned in an ultrasonic bath. Detailed descriptions of the procedure for cleaning glass discs and dies, prior extrusion process, is attached in Appendix 2 (III). Note: for the coated die, another cleaning process is applied Extrusion process parameters Basically, an extrusion process consists of 4 main stages as illustrated in Figure 4.6. The extrusion process was monitored by measuring the speed of the ram movement (extrusion speed), which is affected by temperature, pressure and die characteristics (material, surface roughness, exit geometry and size). From the graph, we can see: 1 st stage: The glass in the die is heated up to the softening temperature extrusion speed is constant. 2 nd stage: Pressure applied. The melted glass is filling the die at higher extrusion speed. 3 rd stage: The glass starts to come out from the die exit and the extrusion speed drops rapidly until a certain level, if the temperature and pressure remain constant, the speed shows a more or less pronounced decrease with time. 4 th stage: Towards the end of the extrusion, the glass in the dead zone is forced into the die and the process encounters significant decrease in extrusion speed until all glass has been extruded.
127 CHAPTER 4 Fabrication of simple structure soft glass HF Speed (mm/min) Time (min) Figure 4.6: Extrusion phases The extrusion speed is a very important process parameter. As described above it affects the shape and size of the extruded glass element. A slow speed results in a small die swell and, in case of WW preforms, core and wall start to emerge from the die exit at the same time. In contrast, a fast extrusion speed results in larger die swell and the occurrence of a taper is more likely unless the speed is maintained by active control. In addition to geometrical changes, the extrusion speed appears to affect the surface quality of the extruded glass. There exists a slight tendency that glass elements that have been extruded with a slow speed exhibit more surface defects than glass elements extruded at a faster speed. The requirements on the extrusion speed differ for jacketing tubes and glass elements that are used as preforms for caning. Jacketing tubes have to fit exactly to the canes over a certain tube length and this makes great demands on the tube geometry. They should exhibit identical dimensions over 150 mm length (i.e. no taper), precise ID (i.e. precise die swell) and curvature of flats as small as possible. On the other hand, the requirements on the surface quality are less strict, since they do not form the waveguiding region. According to these demands, a slow extrusion speed and, preferably, active speed control to maintain a certain speed is desired. For cane preforms, taper and die swell can be tolerated to a larger extent compared with
128 CHAPTER 4 Fabrication of simple structure soft glass HF 103 jacketing tubes, since the OD of the cane is controlled during caning by the tractor speed. Note also that 1 mm of preform results in about 100 mm of cane. On the other hand, the demands on surface quality and curvature are high. A smooth surface and the absence of surface defects are of great importance to minimize the propagation loss in the final fibre. To meet the demands for surface quality and curvature, different speeds are necessary. A fast speed will result in better surface quality, whereas a low speed will minimize the curvature. This demonstrates that for each preform type, an optimum range for extrusion speed exists Defects of extruded elements A. Dimensional defects: die swell, taper and curvature The quality of the extruded elements can be determined by their size and shape in terms of the deviation of the extruded elements from their die exit geometries. A low quality preform tends to have die swell and is often tapered at the ends. Curvature will also present in preform structural bending and preform geometries that involve flats. Die swell: Die Swell, more correctly called Extrudate Swell, is a result of the viscoelastic properties of a material. Die swell is the radial expansion or reduction of the glass structures with respect to the corresponding die dimensions. Because of the extrudate swell, the optimal die geometry and final shape of extruded elements are not easily determined. Thus producing elements of complicated geometry is difficult. The origin of die swell is the friction of the glass melt at the die wall. Within the die, the glass melt exhibits laminar flow behaviour with complete sticking of the glass melt at the die wall. Such flow behaviour is characterized by a parabolic speed profile. At the die exit, this parabolic profile within the die channel is converted into a box-type profile within the emerging glass element. As a consequence, the preform geometry deviates from the die exit geometry [18-21]. Taper: All extrusions typically exhibit a degree of a taper. Taper refers to the
129 CHAPTER 4 Fabrication of simple structure soft glass HF 104 variation of the glass element in size along its length, for example a difference in OD for both ends of an extruded element. Curvature: Curvature is the amount by which a geometric object deviates from being flat or straight. For example, glass elements whose shape involves flats, e.g. an hexagonal outer or inner shape, can demonstrate a curvature of these flats. B. Surface defects One of the major contributions to the loss in these extruded HFs is due to the presence of defects in the fibre. To date, extrusion of soft glass HFs is still at an early stage of development. The first SF57 glass WW fibre produced by H. Ebendorff- Heidepriem et al, [9, 22], which has the smallest core 1.7μm, exhibits an average loss of ~9dB/m with several localised sections with losses ranging from 5 to 18dB/m which were found along the length of the fibre drawn. These large variations of loss values indicate localised losses, possibly due to the surface defects, i.e. bubbles, grains, crystals, imprint and striats, in the preform [9]. Those defects are undesirable and ways of decreasing defects are still in the research stage Caning and fibre drawing After the extrusion process, the next step in the process of producing HFs is to convert the extruded preforms into hair-thin fibres. This is done in an operation called fibre drawing. Basically, there are two types of drawing approaches, the single step fibre drawing and the two step fibre drawing. Depending on the final dimensions of the structure in the fibre, either one of these two approaches will be used. In the single step approach, the preform is directly drawn into a fibre. Fibres with relatively large scale structures can be pulled directly from preforms on a fibre drawing tower. In the two step method, a structured cane is drawn first from a structured preform, and is then pulled again after jacketing with another tube. This approach is particularly effective for obtaining the small structures with core OD of less than 2μm.
130 CHAPTER 4 Fabrication of simple structure soft glass HF Principle of fibre drawing All extruded preforms, irrespective of design, are scaled down into optical fibre using a fibre drawing tower with induction heating. The configuration of the fibre drawing tower is first outlined and it is illustrated in Figure 4.7 and 4.8. The limits and practical ranges of the fibre draw parameters available on the tower are also discussed. The ORC custom-designed fibre-drawing tower shown in Figure 4.5 is mainly used for soft glass HF fabrication. It possesses very rapid heating and cooling rates, which is up to C/min from room temperature (RT) to C; and also various furnace atmospheres (argon Ar, nitrogen N 2, and oxygen O 2 ) can be selected when drawing fibres based on different glasses. The assembled fibre perform is clamped by a chuck onto a motorised stage so that the feed speed, V f can be accurately controlled. Note that, fibres are prone to break when using high speed. As shown in Figure 4.7, the preform is lowered centrally inside a radio frequency (RF) induction element furnace with a hot zone temperature of C. Pure gases (N 2 :O 2 =70:30) are injected into the furnace to provide a clean and dry atmosphere. A stainless steel susceptor is used and the temperature of the heating zone at the bottom of the susceptor is measured. As the tip of the preform enters the hot zone, tightly controlled temperatures approaching ~750 0 C will soften the tip of the preform. Once the softening point of the preform tip is reached, gravity takes over and allows a molten gob to drop by its own weight until it has been stretched into a thin strand. The drop is collected from the bottom of the furnace and the fibre drawing process starts after the elongated preform end is taken up by a fibre drum at the bottom of the tower, which controls the draw speed, V d. The drawn fibre is then respooled and wound on a winding drum. During the draw, the preform is heated at the optimum temperature to achieve an ideal drawing tension. Draw speeds depend on the size of fibre to be drawn. Depending of the degree of down-scaling, we distinguish between caning, i.e. fabrication of canes with 1-2 mm OD, and fibre drawing, i.e. fabrication of fibres with OD < 400 µm. The cane is drawn using a tractor to employ the drawing force, whereas the fibre is spooled on a rotating drum.
131 CHAPTER 4 Fabrication of simple structure soft glass HF 106 The furnace temperature control provides moderate relative accuracy. A stable fibre drawing process needs a very good relative temperature stability of the furnace because the viscosity of a glass depends exponentially on the temperature. Any temporal temperature variations will lead to fibre diameter fluctuations due to resultant changes in the fibre tension. A laser-based diameter gauge is placed at the bottom of the furnace and it is used to monitor the diameter and the concentricity of the fibre. The typical diameter fluctuation observed for soft glass HFs drawn on this ORC custom-designed fibre-drawing tower is ±1μm (depends on drawing parameters such as drawing speed and temperatures applied). The actual value of the drawn fibre diameter is compared to the targeted diameter. If the diameter of the fibre increases above its target, the drawing speed is increased and vice versa. Figure 4.7: Schematic drawing of the ORC in house custom-designed fibre drawing tower Note that: the quartz glass body and susceptor of the furnace are dismantled and reassembled frequently for different drawing temperatures, thus the reproducibility of the furnace temperature measurement is ±10 0, which makes it a challenge to cane and
132 CHAPTER 4 Fabrication of simple structure soft glass HF 107 draw glasses of a steep viscosity curve like SF57. (The viscosity curve of SF57 and other soft glasses is explained in Chapter 2, Section 2.5.4). Figure 4.8: Schematic drawing of fibre drawing furnace Preform preparation before caning and fibre drawing Extruded glass elements required several treatments before the caning process and fibre drawing could be performed. A. Annealing The extruded elements were annealed at the transition temperature (420 0 C for SF57 glass) for an hour and slowly cooled to room temperature in order to remove any thermal stresses due to the fast cooling during extrusion. The fibre/cane will break during the drawing or caning process if the preform is highly stressed. (Please refer to Appendix 2(V) for further details).
133 CHAPTER 4 Fabrication of simple structure soft glass HF 108 B. Cutting The maximum usable preform length for the drawing tower was 150mm. Now, with the use of an extension chuck, the usable preform length can be increased. However, the extruded preforms will usually have slight bends at one end and they need to be sawn off. It is important to note that the sawing should be done without applying sawing liquid (lubricant) as very fine glass particles will be trapped inside the holes, which are very difficult to remove by normal cleaning procedures. Furthermore, WW preforms are too fragile to be cleaned intensively. C. Cleaning Again, cleaning of the fibre preforms is an important step in fibre fabrication. This is to prevent the incorporation of residuals into the glass. Outer and inner surface impurities can diffuse into the glass due to the elevated temperature in the fibre drawing furnace and, hence, localized defects occur in the end fibre which will lead to scattering loss. In this project, so far, four HFs with core diameter less than 2μm have been fabricated. The cut glass elements were not cleaned in the first attempt. For further improvement of the surface quality, the cut glass elements were cleaned for the rest of the attempts. The glass elements were first ultrasonically cleaned. Detergent solution was used to assist the removal of fine impurities/particles within the inner and outer surface of the glass elements. Unfortunately, WW preforms will have some slight cracks on the ends when they are cleaned in an ultrasonic bath with detergent solution. The ph value of the ultrasonic bath content was checked and it was >7. This implies that most glasses especially lead silicate glass will have reaction with alkaline and with the use of ultrasonic bath, it will enhance the reaction and lead to glass cracking. Thus, it is advice to clean the preforms ultrasonically without the use of the detergent solution. This will help to prevent the cracks occur on the glass preforms. The procedure for cleaning glass preforms (the jacketing tube and the structured preform) is shown in Appendix 2 (IV).
134 CHAPTER 4 Fabrication of simple structure soft glass HF Caning and fibre drawing process Caning is the next step after preform extrusion in the extruded HF fabrication scheme. For a small scale features HF, the structured preform is first reduced in scale on a fibre drawing tower into a smaller scale preform called a cane. Before caning, it is wise to anneal the structured preform to ensure more stable fibre drawing process. The bent part of the structured preform was cut to give the maximum usable length. In this caning process, no internal pressure was applied and the structured preform was caned down to a typical OD of about 1.7mm or any OD range that could fit into the extruded jacketing tube. Cleaning plays a crucial role in preform caning as it helps to eliminate fine particles that are trapped at the inner and outer preform s surfaces. In the fibre drawing process, furnace temperature, preform feed speed, draw speed and the use of pressure/vacuum within the preform determines the size and shape of the features in the final fibre. The drawing process has now developed to a degree where the cladding configuration can be controlled relatively well by careful choice of the process parameters. The maximum length of preform that can be used in this soft glass fibre drawing furnace is ~150mm. The bent part of the preform is sawn off and the cane is then inserted into the jacketing tube with one of the cane s ends fused/sealed as in Figure 4.9. This serves to build up pressure within the cane in order to retain the geometry of the structure. The assembly with the fused end is clamped on a chuck. It is important to make sure that both of the cane ends are not sealed because gas will trap inside the cane and it will explode if the temperature is too high. The temperature was ramped up to ~735 0 C. The furnace uses RF induction heating. The tip of the preform was heated and formed into a gob when it melted. At this point, it was important to make sure that the neckdown was concentric, and a smaller drop was preferred for the drop to be well centered into the cold finger. Vacuum was applied only after the neckdown for a full collapse between the tube and the cane by removing the air from the small gap (reducing the pressure of the preform). If a vacuum is applied too early, it will suck the cane up from the assembly preform. High pressure in the cane pushed it outward while the jacketing tube was


135 CHAPTER 4 Fabrication of simple structure soft glass HF 110 pushed inward; this gave a good interface between the tube and cane. Figure 4.9: Assembly with one fused cane end Bare/unclad Fibre fabrication Unclad fibre is a heavily multimode solid fibre without a core. The unclad fibre fabrication process is preformed under almost identical conditions to the WW HFs fabrication process because we wish to keep both of the processes under the same extrusion and fibre drawing conditions as possible for comparative purposes. Figure 4.10: Ultrasonic drilled SF57 glass billet and unclad fibre machined cut stainless steel die. To study the impact of the microstructure and thermal treatments of the fibre fabrication (extrusion, canning, fibre drawing) on the fibre loss, we drew unclad and unstructured fibres (so called bare-fibres) from extruded rods made from the same batch of SF57 material used to produce our HFs. The rod preforms were extruded at a temperature of C and glass pressure of 155.2bar. An oil pressure of 20bar was applied during the extrusion process. The extrusion speed was maintained at 0.2-
 of 125μm. Figure 4.11: Unclad fibre extruded perform 4.3")

136 CHAPTER 4 Fabrication of simple structure soft glass HF mm/min through out the process. Machined cut dies were used in this extrusion, as shown in Figure The unclad fibre extruded glass element as depicted in Figure 4.11 was then drawn into fibres of nominal outer diameter (OD) of 125μm. Figure 4.11: Unclad fibre extruded perform 4.3 WW HF design WW HF design targets WW HF is a HF where its microstructured region consists of three large air holes surrounding a very small core. The air suspended core is supported by three long and fine struts as demonstrated in Figure The targeted optical properties for these WW designed HFs are high effective nonlinearity (small effective area), low confinement loss, single mode or essentially single-mode guidance and near zero dispersion at 1060nm. There are different trade-offs between these optical properties and the design that best satisfies all the research requirements will be ascertained. Figure 4.12: A SEM image of a typical WW structured HF
137 CHAPTER 4 Fabrication of simple structure soft glass HF 112 A. High effective nonlinearity (γ>100w -1 km -1 )/small effective mode area The requirement of γ>100w -1 km -1 is set because the maximum effective nonlinearity that can be achieved in silica HF is ~60 W -1 km -1 [8]. Effective mode area A eff and effective nonlinearity γ of a fibre at wavelength λ are related via the equation 1.1, γ = 2πn 2 / (λ A eff ). From the equation, we know that in order to achieve ultimate nonlinear coefficient, we must either use glass of higher n 2 (in this case, SF57 glass is used) or the effective mode area must be decreased in order to pursue tight mode confinement. The combination of the wavelength scale features and large air holes will lead to tight mode confinement. WW HFs have the following advantages compared with other HF designs where HFs with large relative hole size and very small cores can be readily produced. These designs allow high index difference between the core and the air-filled cladding and resulted in extremely high fibre nonlinearity due to tight mode confinement. B. Low confinement loss (α c <0.1dB/m) The requirement of the confinement loss, α c <0.1dB/m is fixed in order to have a confinement loss that is less than the intrinsic material loss. The confinement loss is the most unique loss mechanism in HFs, which arises from the fact that the HF has a single material design where the core of the HFs has the same refractive index as the region beyond the finite holey cladding. Hence, the modes within the HFs are inherently leaky. Although this fibre supports only leaky modes, it is possible to design a lower loss fibre by ensuring that the supporting struts are long and fine enough so that they act purely as structural members that isolate the core from the external environment [23]. In the WW HFs, the structural parameter that can be varied is the core size, which is adjusted by scaling the microstructured region. The relative hole size or air filling fraction is limited by the struts length and the thickness required to ensure low confinement loss [22]. The downscaling of the microstructure allows high effective nonlinearity but generally worsens the fibre confinement. C. Zero or near zero dispersion (±5ps/nm/km) The dispersion characteristics of non-silica HFs can be manipulated to create fibre having zero, low or anomalous dispersion at IR wavelengths. Combining these features with small mode field areas results in outstanding nonlinear HFs, for instance
138 CHAPTER 4 Fabrication of simple structure soft glass HF 113 WW HFs. The air filled cladding of WW HFs results in strong wavelength dependence in the characteristics of the fibre and is responsible for the large waveguide dispersion possible in such fibres. The waveguide dispersion can be used to compensate the large material dispersion in the SF57 lead silicate glass and proper manipulated design will lead to zero dispersion at the targeted wavelength. In order to tailor the SF57 WW fibre s ZDW to 1060nm from the bulk glass material ZDW of 1970nm, a small WW HF core is needed. D. Single mode (SM) or effectively single mode guidance (ESM) Effectively single mode (ESM) guidance is achieved when the fibre is multimoded but the higher order modes exhibit very high values of confinement loss. Fibres can be ESM over a broad range of wavelengths since the confinement losses associated with any higher order modes are significantly higher than that of the fundamental mode. For WW design, which is comparable to the air suspended rod structure (ASR), the single modality can be achieved when reducing the scale of the microstructure to a certain value. Practically, the WW HFs will be SM or ESM for the core size at 1.8μm, or below, according to the experimental observations. Note that, as the scale of the structure is reduced, the coupling efficiency will degrade and the birefringence of the fibre will increase WW HF fabrication scheme The three-step procedure we use for the fabrication of our soft glass small-core HFs has been previously reported in [4-7,9], and consists of (1) two extrusion procedures for the fabrication of preform elements (core preform and an outer jacket tube), (2) caning of the core preform, and finally (3) drawing of the assembled preform into fibre.
139 CHAPTER 4 Fabrication of simple structure soft glass HF 114 Figure 4.13: Fabrication scheme of the extruded HFs Basically, the extruded WW HFs are made in 3 main steps. Firstly, a block of cylindrical shaped glass of outer diameter (OD) =30mm and height=30mm is cut out from a block of SF57 bulk glass by ultrasonic drilling. The structured preform and the jacketing tube are then to be extruded. Secondly, the structured preform, which has an OD of about *16mm, is annealed and then drawn on a fibre drawing tower into a smaller scale fibre, called a cane, of about *1.6mm OD. The jacketing tube is extruded with OD of *10mm and inner diameter (ID) of about ~*1.6mm (preferable the same as the cane size). It is important to make sure that the cane is tightly fitted to the inner hole of the jacketing tube. Finally, the annealed cane is inserted within the extruded jacketing tube and the assembly is again drawn down to an end fibre. Hundreds of meters of fibre can be drawn in this way with our typical preform length of 15cm. The fabrication scheme of the extruded HFs is shown in Figure * The dimensions of the OD and ID will be different depending on the die designs.
 of OD=10mm, ID=1.7mm with machined die b. Jacketing tube (T2) of OD=10mm, ID=1.7mm with machined die c. Jacketing tube (T3) of OD=10mm, ID=1.1mm with machined die d.")
 The aim was to extrude straight and long jacketing tubes with an OD of 10mm and ID of 2mm. Figure 4.14 illustrates the outcome of sample T1.")

140 CHAPTER 4 Fabrication of simple structure soft glass HF Results and discussion Extruded preforms This is the list of the extruded WW elements I have made during my thesis work: a. Jacketing tube (T1) of OD=10mm, ID=1.7mm with machined die b. Jacketing tube (T2) of OD=10mm, ID=1.7mm with machined die c. Jacketing tube (T3) of OD=10mm, ID=1.1mm with machined die d. WW preform (WW1) of OD=15mm with machined die e. WW preform (WW2) of OD=15mm with eroded and coated die f. WW preform (WW3) of OD=15mm with machined die A. Extrusion of jacketing tubes (T1 and T2) The aim was to extrude straight and long jacketing tubes with an OD of 10mm and ID of 2mm. Figure 4.14 illustrates the outcome of sample T1. On the whole, the tube can be considered straight with a little bending of 1 mm at the start of the extrusion. The overall length of the jacketing tube preform is 20.9cm and weighs 94.23g. The OD is about 10.42mm while the ID is around 1.67mm-1.77mm. The ID of the tube determines the dimension of the cane to be used and is drawn from a WW structured preform. Figure 4.14: Extruded jacketing tube preform T1 A cross-sectional view and a side view of the extruded jacketing tube T2 are shown in Figure From the Figure 4.15, we can see that the tube T2 is quite straight with 2mm bending at the start of extrusion. The overall length of the tube preform is 20.6cm and the weight is 94.01g. The OD is mm while the ID

141 CHAPTER 4 Fabrication of simple structure soft glass HF 116 is about 1.67mm. The OD of the cane should preferably be the same as the ID of the tube. It is important to make sure that the cane is tightly fitted to the hole, in order to get a good collapse between the cane and tube during fibre drawing. Figure 4.15: Extruded jacketing tube perform T2 B. Extrusion of structured preforms (WW1 and WW2) Two structured preforms that extruded with the same conditions except regarding the quality of the extrusion dies. The first sample (WW1) was extruded using machine cut stainless steel dies while the second trial (WW2) was extruded using coated eroded stainless steel dies (refer to Figure 4.5). The aim of these trials was to extrude a wagon wheel (WW) structured preform with OD = ~ 15mm. The WW structure comprises a central solid core supported by three long thin membranes, and this transverse structure extends along the preform length. Figure 4.16 illustrates the outcome of sample WW1. On the whole, the WW1 preform can be considered straight with a slight bending of 1 mm at the start of extrusion. The overall length of the WW1 preform is 19.2cm and it weighs 96.03g. The OD is about mm. The core diameter is ~1.55mm while the wall thickness is ~2mm. The length of the struts is ~5mm and the thickness of the struts is ~0.22mm.


142 CHAPTER 4 Fabrication of simple structure soft glass HF 117 Figure 4.16: Extruded WW structured perform WW1 Figure 4.17 illustrates the outcome of the sample WW2 in cross-sectional view and side view. We can see that the preform WW2 is quite straight with 0.5mm bending at the starting of extrusion. The overall length of the WW2 preform is 17.5cm and it weighs 92.04g. The OD is about mm. The core diameter is ~1.52mm while the wall thickness is ~2mm. The length of the struts is ~5mm and the thickness of the struts is ~0.4mm. Figure 4.17: Extruded WW structured perform WW Extrusion process parameter Table 4.1 shows the summary of the extrusion parameters for various tubes and WW extruded at different conditions. Extrusion process parameter such as temperature and pressure alter directly the glass viscosity and thus the extrusion speed. The die characteristics determine the friction of the glass melt at the die wall, for instance, the friction increases with smaller size of the die exit, and thus a lower viscosity is needed to overcome the higher friction. Therefore, WW preform extrusion through the die of very fine slot widths (350μm each) requires a higher temperature or
143 CHAPTER 4 Fabrication of simple structure soft glass HF 118 a lower viscosity than rod extrusion through a die of a circular exit of OD=10mm. Friction between glass-die also decreased by using coated dies (dry lubricant, WS 2 ), thus for the same extrusion speed, lower temperature is applied and this approach does help in decreasing the tendency of crystallisation. Lower extrusion speed will take a longer time but produces straighter and non tapered preforms while higher extrusion speed accelerates the extrusion process but produces preforms of smaller core and thinner struts. Table 4.1 shows the summary of the extrusion parameters for various tubes and WW extruded at different conditions. Sample Temp ( o C) Glass pressure Extrusion speed extrusion time overall length Z1 (body) Z2 (bar) (mm/min) (min) (cm) Machined die Tube #1 (T1) ~0.3 ~ Tube #2 (T2) ~ *Machined die Tube #3 (T3) ~ Tube #4 (T4) ~ Machined die WW #1 (WW1) ~ WW #3 (WW3) ~ eroded and coated die WW #2 (WW2) ~ WW #4(WW4) * * * *
144 CHAPTER 4 Fabrication of simple structure soft glass HF Defects of extruded elements Dimensional defects: die swell, taper and curvature Table 4.2 shows the summary of the quality in terms of die swell and taper for the tubes and WWs extruded under different conditions. From the data shown, it can be concluded that: A. Die swell: With the increment in the difference between the maximum speed in the centre of the die channel and the average extrusion speed, the die swell increases with increasing extrusion speed. E.g.: T1 with 0.3 mm/min extrusion speed has more die swell compared with T2 that was extruded at the speed of 0.2 mm/min. Die swell becomes more pronounced with the decreasing die exit size. Eg: T3 and T4 that were extruded through a smaller die exit size (ID=1.1mm) have a larger die swell compare to T1 and T2 which were extruded with a larger die exit (ID=2mm). Die surface quality also contributes to the effect of die swell. Preforms that were extruded through the die that was coated with dry lubricant exhibit lower die swell than preforms that were extruded from the machined cut die. See examples WW2 and WW1. This is because the dry lubricant results in a decrease of the friction between the melted glass and the die wall, thus decreasing the die swell phenomena. B. Taper: The size of the extruded element becomes increasingly smaller as the extrusion speed decreases with time. This can be shown where an extruded preform will have larger OD at the start of extrusion and smaller OD at the end of extrusion. WW preforms with more intricate inner structures are more sensitive to tapering compared with the jacketing tubes.
145 CHAPTER 4 Fabrication of simple structure soft glass HF 120 Table 4.2 shows the quality of the tubes and WW extruded under different conditions. (Refer to table 4.4 for the extrusion conditions) Sample OD (mm) ID(mm) surface quality preform of glass straightness Machined die 10 2 surface of die smooth Tube #1 (T1) Tube #2 (T2) *Machined die less rough very straight slight bending at the start(~1mm) rough straight slight bending at the start(~1.5mm) surface of die smooth *Tube #3 (T3) *Tube #4 (T4) Machined die rough very straight slight bending at the start(~0.5mm) rough very straight slight bending at the start(~0.5mm) 1.4 (core) surface of die smooth WW #1 (WW1) WW #3 (WW3) rough quite straight eroded and (core) coated WW #2 (WW2) WW#4 (WW4) * * Dimension of the tube dies: - OD of die: 10.0mm - ID of die: 2.0mm * - ID of die: =1.1mm Dimension of WW dies: - OD of die: 15.6mm - OD of core: 1.5mm smoother but with large bubbles on surface surface of die smooth after coating with WS 2 smoother but with large bubbles on surface smoother but with large bubbles on surface slight bending at the start quite straight slight bending at the start quite straight slight bending at the start quite straight slight bending at the start


146 CHAPTER 4 Fabrication of simple structure soft glass HF Surface defects The quality of the extruded glass samples in terms of surface defects and bubbles was examined using an optical microscope and localised defects were found at the inner and outer surfaces of the preform walls. Here I will show the occurrence of various types of defects in a few selected jacketing tubes and WW performs I have fabricated. A. Jacketing tube There were fewer defects found in the jacketing tubes compared with the structured performs. It is because less glass and die interface is involved during the extrusion process. Sample T1 The defects found were as shown in Figure Three large bubbles and a row of tiny bubbles that stretch about 1cm can be seen at the end part of the extrusion. A sketch of the whole tube T1 is shown in Figure 4.19 in order to point out where the defects are located. Bubble-1 Bubble-2 Bubble-3 Black particle on surface imprint scratches Figure 4.18: defects found in T1


147 CHAPTER 4 Fabrication of simple structure soft glass HF 122 Figure 4.19: A sketch of the tube T1 to point out where the defects are located. Sample T2 Hardly any defects are evident on this tube except two stretches of tiny bubbles (~2cm) from the end of extrusion. Some defects found are shown in Figure Figure 4.21 shows a sketch of the whole tube T2 pointing out where the defects are located. Bubble Black particle imprint/bubble Figure 4.20: Defects found in T2 Figure 4.21: A sketch of the tube T2 to point out where the defects are located.


148 CHAPTER 4 Fabrication of simple structure soft glass HF 123 B. WW structured preform There were more defects found in the structured preform compared to the jacketing tubes. The defects found were imprints, bubbles, black particles, and scratches. The number of defects in the coated dies preform was fewer compared with the uncoated dies preform. Sample WW1 WW1 was extruded using the machine-made stainless steel dies. The defects found were as shown in Figure Tiny bubbles were accumulating beside the struts (refer to Figure 4.24) and bubbles were more on the end of extrusion as compared to the starting point of extrusion. There were several randomly scattered particles along the preform. A sketch of the whole WW preform is shown in Figure 4.23 in order to point out where the defects are located. Black particle -1 Black particle -2 imprint A stretch of black particles Bubble Bubble Figure 4.22: Defects found in WW1
149 CHAPTER 4 Fabrication of simple structure soft glass HF 124 Figure 4.23: A sketch of the preform WW1 to point out where the defects are located. Figure 4.24: Defects accumulate beside the struts Sample WW2 WW2 was extruded using an eroded stainless steel die. The defects found were less and are as shown in Figure Tiny bubbles were again accumulating beside the struts (refer to Figure 4.24) and bubbles were more on the end of extrusion as compared to the starting point of extrusion. The grain density also increased from the start to the end of extrusion. There were several randomly distributed scattering particles along the preform, as shown in Figure Patches of stain-like black particles with a few big bubbles were also noted in the middle of the preform. This might be because the air bubbles that are trapped inside the body burst due to overheating.
150 CHAPTER 4 Fabrication of simple structure soft glass HF 125 Stretch of bubbles Stretch of black particles imprint Bubble and stain Black particle stains Stretches of bubbles Figure 4.25: Defects found in WW2 a b The core out before the struts means the temp. is too hot! a = mm b = mm a = mm b = mm a = mm b = mm a = mm b = mm a = mm b = mm a = mm b = mm End of extrusion oooooooooooooooooooooooooooooooooooooo 0.5 mm 0.5 mm 0.5 mm Start of extrusion 0 2 cm 4 cm 6 cm 8 cm 9 cm 12 cm 15 cm 17.5 cm Figure 4.26: A sketch of the preform WW2 to point out where the defects are located. C. Discussion From table 4.3 and 4.4, we can see that the extrusion speed does affect the surface quality of a preform. There exists a tendency that glass elements that are extruded with a slow speed show more surface defects than the glass elements extruded at a faster speed because at lower speed, there is more friction between the glass and die.
151 CHAPTER 4 Fabrication of simple structure soft glass HF 126 Glass elements extruded from a coated die shows less defects compared to those glass elements that extruded from a machined die. This is clearly shown in preforms WW1 and WW2. The coated die helps in decreasing the friction between the melted glass and the die wall. More work is needed to identify the cause of defects in a preform and further improvement in the preform fabrication is envisaged to decrease defects and eventually the loss of the end fibre. Table 4.3 and 4.4 show the summaries of defects for jacketing tubes and structured preforms. Table 4.3: The summary of defects found in jacketing tubes under different extrusion conditions Sample Temperature ( o C) Glass Extrusion Surface Defects Z1 Z2 Pressure (bar) speed (mm/min) quality T less rough -no significant defects observed -Tiny bubbles at the end - a stretch of tiny bubbles at the end of extrusion T rough - 2 rows of tiny stretch bubbles at the end of extrusion T rough - a stretch of big bubbles at the middle part of extrusion T rough - a stretch of big bubbles at the middle part of extrusion
152 CHAPTER 4 Fabrication of simple structure soft glass HF 127 Table 4.4: The summary of defects found in the structured preforms Sample Temperature ( o C) Z1 Z2 Glass Pressure (bar) Extrusion speed (mm/min) Surface quality Defects WW Rough - tiny bubbles accumulate beside the struts - More bubbles at the ending point compared to the start of the extrusion -several randomly distributed scattering particles WW Less rough WW3 and WW4 are not included in this table. -more bubbles are on the end of the extrusion -randomly distributed scattering particles -big bubbles with a stretch of stains towards the end of extrusion (eroded particles) might be due to the explosion of trapped air Extruded Cane In this caning process, no internal pressure was applied and the structured preform was caned down to a typical OD of about 1.7mm or any OD range that could fit into the extruded jacketing tube. Cleaning is playing a crucial role in preform caning as it helps to eliminate fine particles that are trapped at the inner and outer preform s surfaces. WW1 preform
153 CHAPTER 4 Fabrication of simple structure soft glass HF 128 was not ultrasonically cleaned before caning as at first, we thought that the ultrasonic bath might be too strong and harsh for fragile WW preforms. WW2 and WW3 were cleaned ultrasonically and this resulted in brighter and shinier preforms (improved surface quality). The cross sectional SEM and optical microscope images of cane C1, C2 and C3 along with their structural features are listed in Table 4.5. C1 exhibits a core supported by 3 thin and long struts. It has a quite asymmetric and elliptical structure where its 3 struts are not of the same length (one of the struts is slightly shorter) and the 3 angles are slightly different from C2 and C3 have symmetrical and rounded structures where their 3 struts are well positioned at difference. The 3 struts of each C2 and C3 are of quite similar length. C2 which was caned from WW2, that was extruded through an eroded and coated die shows shorter and thicker struts compared with C1; both C1 and C2 were caned under the same conditions. From Table 4.5, we can see that the machined die WW preforms WW1 and WW3 resulted in canes C1 and C3 that had long and fine struts. The better geometry preservation for C2 and C3 is due to some alterations in the caning process, where: a. Preforms WW2 and WW3 were held by a chuck during caning. This means that the holes at the top of the WW preforms were blocked. Pressure is built up inside the preforms when the glass assembly is necking at the bottom part of the preforms, which leads to air trapped in the holes. Furthermore, temperature gradients within the preforms are reduced because no air flows inside the preforms. b. For C3, the geometrical structure is very symmetrical and round. This is due to the increase of drawing tension during caning. At the beginning of the caning process, the cane was elliptically shaped, and slowly, the cane evolves to a circular cane structure as the drawing tension is increased (Figure 4.27). High tension drawing will result in canes that have less curvature in the air lobes and long and thin struts (Figure 4.27). However, if the tension is too high, it will lead to cane or struts breakage, as SF57 glass is very fragile and is not strong enough to withstand the high tension.
, C2 (from WW2) and C3 (from WW3)) are listed in Table 4.5. Starting of caning desired cane Decreasing tension Figure 4.")
154 CHAPTER 4 Fabrication of simple structure soft glass HF 129 In conclusion, the end products of these caning processes show good results in retaining the WW structures and good reproducibility. A summary of 3 cane samples (C1 (from WW1), C2 (from WW2) and C3 (from WW3)) are listed in Table 4.5. Starting of caning desired cane Decreasing tension Figure 4.27: High tension drawing will result in canes that have less curvature in their air lobes and long and thin struts.
155 CHAPTER 4 Fabrication of simple structure soft glass HF 130 Table 4.5: A summary of 3 cane samples (C1, C2 and C3) drawn sample Image Preform anneal C1 (X4 objective) -machined die Cane OD = 1.7mm for C1, OD= 0.8mm for C2 Core Strut Strut Wall OD Length thickness thickness (μm) (μm) (μm) (μm) annealed na comment Quite Asymm. Preform was held by wires C2 (X4 objective) - eroded and coated die annealed na Symm. Preform was held by chuck. No air flow inside the preform and the pressure is built up inside it. *C3 (X4 objective) - machined die annealed Very Symm. Preform was held by chuck Going for a smaller cane size in order to achieve a smaller core * C3 parameters were measured from the SEM image while C1 and C2 measurements were taken from optical microscope image
156 CHAPTER 4 Fabrication of simple structure soft glass HF Extruded HF In this research work, HFs with core diameters in the range of μm were produced from 3 different assemblies. The core diameter was adjusted during the fibre drawing by an appropriate choice of the external fibre diameter. Note that, the ratio between core size and fibre diameter can be changed via the choice of jacketing geometry and corresponding cane size, which allows the fibre diameter for a certain core size to be set to the desired value. The fibres, F1, F2 and F3, were made from annealed canes and jacketing tubes. Good drawing stability was achieved for these fibres (there was a decrease in the number of fibres breaking during drawing). The details of the fabricated fibres are summarised in Table 4.6. The dimensions of the structural features within the HFs were measured from the SEM images of the fibres.visual inspection through an optical microscope indicates that the cross-sectional profile of the samples remained essentially unchanged over meters length of fibre. The core is suspended by three long and fine supporting struts. These supporting struts allow the solid core region to guide light by being optically isolated from the outer cladding region. The core diameter is around μm and the struts are about 3-5μm long. From Table 4.7, we can see that Fibres F1, that were fabricated from the machined die extruded preform, show longer struts length and thinner struts wall ( high ratio value, >20) compared with the fibres made from the dry lubricant coated die extruded preform, F2 (low ratio value, <20). In Table 4.6, we can see that some fibres broke easily during the drawing of fibres with very fine structures (core diameter < 1μm). This is because: 1. In order to achieve fibres with core diameter less than 1μm, the drum speed has to be increased rapidly, which leads to the phenomenon of fibre breakage, as the SF57 glass is too fragile to withstand the high drawing speed. Therefore, the fibre drawing process should be refined for a good drawing stability. 2. During the fibre drawing of very small core fibres, very high tension was applied in order to preserve the fibre geometry. However, high drawing tension will result to fibre breakage. Thus, good control on the drawing tension is required for a stable fibre drawing.

 0.204 0.208 0.207 stability stable Cane annealed annealed #2 3 0 ± 5 148 23.1 1.638 6.24 6.17 6.00 0.234 0.")
157 CHAPTER 4 Fabrication of simple structure soft glass HF 132 Table 4.6: The dimensions and structural features of 3 WW HFs : F1,F2 and F3, measured from the SEM images sample image Band no F1 Vacuum (mbar) (absolute) Avg OD (μm) OD (μm) Core enclosed (μm) fibre Strut length (μm) #1 4 0 ± Strut Thickness (μm) stability stable Cane annealed annealed #2 3 0 ± Broke once # ±

 Strut Thickness (μm) 0.29 0.26 0.")
158 CHAPTER 4 Fabrication of simple structure soft glass HF 133 #4 1 none sample image Band no F2 Vacuum (mbar) (absolute) Avg OD (μm) OD (μm) Core enclosed (μm) fibre # ± Strut length (μm) Strut Thickness (μm) stability Broke once Cane annealed annealed # ± Broke once

 Strut Thickness (nm) 92.")
159 CHAPTER 4 Fabrication of simple structure soft glass HF 134 # ± sample image Band no Vacuum (mbar) (absolute) Avg OD (μm) OD (μm) Core enclosed (μm) fibre F3 # ± Strut length (μm) Strut Thickness (nm) stability Broke many times Cane annealed annealed
160 CHAPTER 4 Fabrication of simple structure soft glass HF 135 Overall, the 3 HFs, made from different preforms, show good geometry microstructures with 3 long and fine struts. This shows that by using this approach, excellent reproducibility is obtained. Table 4.7: The ratio of struts length: struts thickness for fibres F1, F2, F3 and WW die ratio length thickness core OD unit (length/thickness) Fibre F μm μm μm μm F2 F3 Machined WW die μm μm μm μm μm μm Propagation loss Bare/ Unclad fibre The cut-back method of loss measurement was performed on the unclad fibre. A tungsten halogen lamp, which has a spectral range of 250nm-2.5μm was used as the broadband light source and an optical spectrum analyser was used to record the transmission spectra from nm. A long length of unclad fibre was used (~15m) and 6 cutbacks were performed along the measurement. The graph in Figure 4.28 illustrates the propagation loss of the unclad fibre based on Schott SF57 glass. It is clear that the unclad fibre loss for SF57 glass is quite
161 CHAPTER 4 Fabrication of simple structure soft glass HF 136 low. It exhibits the lowest attenuation values between 1000nm and 1300nm (~0.3dB/m), and increases to a value of ~0.75dB/m at 1550nm due to the overtone of the fundamental vibration of the hydrogen bonding at 3-3.5μm. Unclad fibre is fabricated to determine the impact of the microstructure on the propagation loss. The unclad fibre was made from the same glass batch. The average loss of the unclad fibre is under 2dB/m from 700nm to 1600nm and there is an OH peak present at 1440nm. Note that the loss of bulk SF57 at 1550nm is 1.6dB/m from the Schott catalogue [24] (The bulk glass loss is different from one batch to another). From the Table 4.8, we can see that higher loss is measured for the extruded HFs as compared to the unclad fibre. This is likely to be due to the surface imperfections within the structured preform Loss (db/m) W avelength(nm ) Figure 4.28: Loss spectrum of SF57 unclad fibre Comparison of the loss spectra between the WW HF and the bulk glass An experiment on measuring the loss of a polished glass disc (similar to those glass discs use in preforms extrusions) was performed using Fourier Transform Infrared Spectroscopy (FTIR). The loss result of the polished glass FTIR loss measurement is compared with the loss result of the WW HF in Figure The loss curve of the polished glass disc is adjusted such that the bulk glass has the same loss as the WW HF at 1200nm. From the graph, it is noticeable that both bulk glass and the WW HF share the same characteristic (the curves look similar). The OH peak for
162 CHAPTER 4 Fabrication of simple structure soft glass HF 137 both cases is about the same, which is ~2dB/m loss. This shows that not much water is incorporated into the glass during extrusion, annealing, caning and the fibre drawing process. Thus, we can say that additional hydroxyl ions are not the major contributor of fibre loss. Therefore, SF57 glass is the one of the suitable choices for achieving low loss non-silica HFs μm core WW HF polished glass disc (d=33mm) background adjusted to the fibre's one 7 loss (db/m) wavelength (nm) Figure 4.29: Comparison of spectral curve for the 1.8μm core WW HF of ~2m and polished glass disc of thickness 33mm WW HFs The optical micrographs shown in Table 4.6 show bright guided light transmitted through the cores of the F1, F2 and F3 fibres. This proved that the extruded HFs are guiding light but with a certain loss. The starting lengths of the measured HFs were 2-3 metres and each cutback length was m, whilst for the unclad fibre, >10 metres was used and cut back lengths were ~1m each. This is to ensure that the difference of the transmission spectra (output power for spot measurement) before and after the cutback was dominated by the removal length of the fibre rather than other variability such as the quality of the cleaved fibre ends. The power measurement at a given cutback length was repeated at least 3 times for 3 different cleaves to reduce the random errors in the measurement.
163 CHAPTER 4 Fabrication of simple structure soft glass HF Loss (db/m) μm core 1.4μm core_try1 1.8μm core 1.4μm core_try2 bare fibre 1.2μm spot measurement 1.4μm spot measurement 1.8μm spot measurement Wavelength(nm) Figure 4.30: Loss comparison between WW HF (F2) of different sizes Table 4.8: Fabrication conditions and loss properties of WW HFs extruded fibres. The propagation loss measurement was taken using a laser diode and whitelight source. fibre sample sample enclosed core Spot loss broadband loss comment no. no. diameter (μm) at 1550nm(dB/m) at 1550nm(dB/m) unclad fibre 125 na 0.8 machined die ultrasonic cleaning F1 ww WW machined die no ultrasonic cleaning cane C no internal pressure Cane oval shaped fibre F1#1 1.4 na na broke once F1# na F1# na F1# na eroded and coated F2 ww WW die ultrasonic cleaning cane C internal pressure fibre F2# ± fibre breakage F2#2 1.4(before break) 2.53± (after break) na *3.2 F2# ± F3 ww WW3 na machined die ultrasonic cleaning cane C internal pressure fibre F3# na na many breakage F3# na during drawing F3# na high tension * from second drop
164 CHAPTER 4 Fabrication of simple structure soft glass HF 139 Loss for each tested WW HF sample and unclad fibre is listed in Table 4.8 and the spectral loss curves for F2 (for different bands of different core sizes) and unclad fibre are illustrated in Figure We can clearly notice that all the WW HFs have higher losses than the unclad fibre, which is ~0.8dB/m at 1550nm. The lowest loss range is between 1000nm-1300nm and the water peak is at ~1440nm Effect of the core diameter on loss For small core HFs, the principal cause of loss is typically introduced by the surface roughness at the core/air interface. The effect of surface roughness at the air/glass boundary becomes more significant as the core size is reduced, which can increase the loss as a result of enhancing scattering [22]. Since the modal field overlaps with the air holes of the WW fibre, as depicted in Figure 4.31(a), structured fibres will have higher loss due to surface imperfections at the air/glass interface around the core. The decrease of fibre loss with increasing core size for WW HFs F1 and F2 shows that the impact of the surface imperfections becomes more pronounced as the core size is reduced. Figure 4.31(b) shows the typical measured WW HF loss versus core diameter at a wavelength of 1550nm for fibres F2, which have core sizes of 1.2μm, 1.4μm and 1.85μm respectively Fibre loss (db/km) (a) (b) Core diameter (μm) Figure 4.31: (a) Predicted mode profile of SF57 WW HF [9] showing modal field overlap with the air holes within the HF which causes scattering loss due to surface imperfection and (b) typical measured WW HF loss versus core diameter at a wavelength of 1550nm for WW HFs F2

165 CHAPTER 4 Fabrication of simple structure soft glass HF Effect of the die characteristic on the loss Table 4.9 illustrates the relationship between the types of dies used with the loss of the fibre. The WW HF F2 exhibits the lowest loss which is ~2dB/m at 1550nm, compared with F1, even though it has smaller core sizes then F1. The WW2 preform was extruded through a dry lubricant coated die which offers a smoother and better extruded preform surface quality as it decrease the friction between the glass and die as discussed in section Furthermore, lower temperatures are required during extrusion through the coated die at a fixed speed, thus the preforms have less tendency to crystallisation. Through visual inspection with naked eyes using intense white light and under an optical microscope, WW2 exhibits less scattering flaws compared with preforms extruded through machined dies which results in a rougher preform surface (refer to the preform defects in Figure 4.22 for machined die, Figure 4.25 for eroded and coated die). Further investigations are still required to explore and establish the impact in quantitative terms of the coated dies in producing low loss HFs. Table 4.9: The relationship between types of dies used with the loss of the fibre SF57 Die Loss at 1550nm (db/m) Enclosed core size (μm) WW fibre 2.7 [22] 1.7 WW fibre Machined only 2.0 (lowest loss in WW HF) 1.8 Bare fibre Eroded and coated Machined only

![A modest increase in the structure scale can lead to dramatic improvements in the confinement of the mode without compromising the achievable effective nonlinearity significantly [25].](/docs-images/93/112354489/images/166-2.jpg "The cane of WW1 was drawn without internal pressure, which leads to an oval-shaped distorted cane C1 that might lead to increased confinement loss compared to the cane of WW2 which has a very")
166 CHAPTER 4 Fabrication of simple structure soft glass HF Effect of the fibre structure on the loss As discussed in Section 4.3.1, HFs made from a single material are inherently leaky since the core refractive index is the same as the index beyond the finite core region, so they can exhibit high confinement losses. A modest increase in the structure scale can lead to dramatic improvements in the confinement of the mode without compromising the achievable effective nonlinearity significantly [25]. The cane of WW1 was drawn without internal pressure, which leads to an oval-shaped distorted cane C1 that might lead to increased confinement loss compared to the cane of WW2 which has a very symmetrical circular shaped cane resulting from using an extension chuck that give internal pressure to the WW perform during caning (see Figure 4.32) (a) (b) Figure 4.32: The canes and the resulted end fibres. (a) Cane C1 and fibre F1 and (b) cane C2 and fibre F Effect of the defects and cleaning on the loss Fibre F1 exhibits exceptionally high loss compared with Fibre F2. The range of losses in F1 is very big, with a difference of more than 2dB/m. The large variations of loss values of F1 indicates localised losses present in the fibre itself, possibly due to defects along the preforms like bubbles and unwanted particles (section ).
167 CHAPTER 4 Fabrication of simple structure soft glass HF 142 Furthermore, the fact that extruded WW1 preform was not cleaned ultrasonically prior to the caning process is believed to have contributed to the higher degree of surface contamination and deposition of fine particles inside the WW preform. Besides using coated dies, the WW2 preform was ultrasonically cleaned before the caning process. Ultrasonic cleaning helps to eliminate unwanted particles on the preform surface which will greatly decrease the amount of defects in a fibre. It is believed that lower loss fibres can be produced in the future with a proper and systematic fabrication process Effect of the temperature on the loss Referring to Figure 4.30, the loss values of F2 (different core sizes) from both different loss measurement approaches are in agreement except for the 1.4μm core fibre which showed a higher loss (3.2dB/m) than the loss of the fibre measured via spot measurement at a similar core size (2.53dB/m). The main difference of these 2 fibres was the fibre part with higher loss was made from the second drop after the fibre broke during the fibre drawing process. To restart the pull, slightly higher temperature was applied to decrease the tension and thus to allow drawing of a fibre with smaller OD without breakage. From here, we can say that higher temperature may increase the loss of the fibre due to some thermally induced effects. Besides, from the graph, it is clearly seen that the spectral loss of the 1.4μm core fibre is different from other loss spectra. The uncertainty in the result of the 1.4 um core fibre of the broadband loss measurement might be due to Rayleigh scattering due to the inhomogeneity in the structural geometry along the fibre after breakage Conclusion In short, we managed to produce low loss lead silicate WW HFs, at about 2dB/m at 1550 nm. The fibre loss was reduced via experimental optimisation of the fabrication process. The contamination of the preform was reduced by cleaning the extruded elements ultrasonically prior fibre drawing while the preform surface quality
168 CHAPTER 4 Fabrication of simple structure soft glass HF 143 was improved by using dry lubricant coated dies during the extrusion process. Further investigations will be done to improve the fabrication process in order to reduce the fibre losses to values nearer to the unclad fibre. However even at the 2dB/m level, those fibres are usable for characterisation and device demonstrations Mode profile For our calculations we first studied the modal characteristics of the HF waveguide. Single transverse mode operation is a pre-requisite for most applications. However, because of the extremely high NA of these HFs, single mode operation is not always rigorously obtained. Nevertheless, many HFs can be effectively single mode over a broad range of wavelengths since the confinement losses associated with any higher order modes supported theoretically by the structure are significantly higher than those of the fundamental mode. For our specific design single mode operation can be achieved when reducing the scale of the microstructure beyond a certain value. Practically, for this type of HF, single mode or effectively single mode operation was obtained for a core diameter of 1.8 μm or less at μm (Nd:YLF laser). Note that when specifying core diameters for our fibres we are referring to the diameter of the circle that just fits within the triangular core region as illustrated in Figure 4.33(a). The fundamental modes of our fibres reflect the triangular symmetry of the fibre core as illustrated in Figure 4.34 where we plot the theoretical fundamental mode-profiles at wavelengths of both 1 μm and 1.55 μm for a fibre with a ~0.95 μm core diameter (F3#3). These calculations were performed using a commercial beam propagation package based on a core geometry as extracted from an SEM image of the fibre. For both wavelengths, the predicted profile of the guided mode has a triangular shape. The predicted effective mode areas are 0.84 μm 2 at 1.06 μm and 1.1 μm 2 at 1.55 μm.
169 CHAPTER 4 Fabrication of simple structure soft glass HF 144 (a) (b) Figure 4.33: (a) SEM image of the small core extruded SF57 HF (F3#3) with ~0.95 μm core and the enclosed area is given by the area of the circle that fits just inside the core region. (b) Measured mode profile for fibre F3#3 at core diameter of ~0.95 μm Figure 4.34: Predicted mode profiles for fibre F3#3 of core diameter ~0.95 μm at (a) 1.06 μm and (b) 1.55 μm. We have studied closely the properties and supercontinuum generation performance of two HFs with core diameters of 0.95±0.05 and 1.30±0.05 μm (denoted F3#3 and F2#1 respectively).the spatial mode guidance characteristic of F3#3 and F2#1 at μm (Nd:YLF laser) were first investigated by imaging the near-field of the guided mode from the output end of the HF onto an infrared CCD camera. At this wavelength, the measured fundamental mode profile for both fibres has a triangular shape (Figure 4.33(b)), which is in good agreement with the predicted mode profile (Figure 4.34). It can be concluded that robust SM guidance is observed for both fibres at μm, and consequently for all wavelengths longer than μm.
.")
 Fundamental mode observed : single moded 1.4 (F2#2) Fundamental mode observed : single moded 1.")

![of a bismuth-oxide HF with a γ of 1100 W -1 km -1 [7], and a step-index bismuth-oxide glass fibre, (made from](/docs-images/93/112354489/images/170-5.jpg "an even more nonlinear glass composition), exhibiting a γ value of 1360 W -1 km -1, and at a lower loss of")
170 CHAPTER 4 Fabrication of simple structure soft glass HF 145 Table 4.10: SEM images, IR images of the near-field pattern of various core size WW HFs (sample from F2). Enclosed core diameter (μm) SEM image Near field image comment 1.2 (F2#1) Fundamental mode observed : single moded 1.4 (F2#2) Fundamental mode observed : single moded 1.8 (F2#3) Fundamental mode observed : single moded Nonlinearity Recent progress in bismuth-oxide based glasses has been particularly noteworthy with reports of a bismuth-oxide HF with a γ of 1100 W -1 km -1 [7], and a step-index bismuth-oxide glass fibre, (made from an even more nonlinear glass composition), exhibiting a γ value of 1360 W -1 km -1, and at a lower loss of ~1dB/m [4-5]. The latter number represents the current state-of-the-art to the best of our knowledge in terms maximum reported fibre nonlinearity for a soft glass CF.
171 CHAPTER 4 Fabrication of simple structure soft glass HF 146 Here we describe our recent progress in lead-silicate glass HF fabrication. Previously, my colleague, Dr. H. Ebendroff-Heidepriem fabricated a lead-silicate (Schott SF57 glass) HF with γ=640 W -1 km -1 [9]. By improving our fabrication process, and optimizing our fibre design, we have now achieved a value of γ=1860 W - 1 km -1 at 1.55 μm and at the same time improved fibre losses. This γ value approaches the ultimate limit for this material and represents the highest value of nonlinearity yet reported for a fibre Fibre design modeling and core size optimization Before starting any fabrication work we performed an initial assessment of how the nonlinear and dispersive properties of high nonlinearity lead silicate fibres vary with core structure. We assumed a similar geometric WW fibre design to that adopted in our earlier work in SF57 [9, 22] and bismuth-oxide HFs [7]. WW fibres are readily fabricated through the three step preform extrusion technique discussed in Section 4.3.2, where a small core is supported by three fine and long struts (see Figure 4.35(a)). This high-na design closely resembles the ASR structure - an idealized configuration of a circular glass core surrounded by air as illustrated in Figure 4.35(b). Consequently, we used an ASR model in our initial studies to help us establish the range of core dimensions that we should target in our initial fabrication attempts to realize high nonlinearity dispersion shifted fibres. It is however to be appreciated that our three-strut WW design, which naturally results in a triangular shaped core, gives slightly increased values of A eff and increased confinement losses compared to an ASR of the same geometric area. Therefore, in order to refine our findings we repeated our calculations after fibre fabrication using scanning electron microscopy (SEM) images of the actual fibres fabricated. It is the results of these refined calculations on real structures that are presented in later sub-sections of 4.4.6
172 CHAPTER 4 Fabrication of simple structure soft glass HF 147 Air surrounding the rod glass rod (a) (b) Figure 4.35: (a) SEM of the cross section of the extremely high nonlinearity WW HF (b) a circular solid core fibre surrounded by an air-cladding 7000 Effective nonlinearity coefficient (W -1 km -1 ) predicted at 1.06μm predicted at 1.55μm Core diameter (μm) Figure 4.36: Effective nonlinear coefficient at 1.55 μm and 1.06 μm (simulation performed by Dr. V. Finazzi) Figure 4.36 shows a prediction of the effective nonlinearity, γ, of an SF57 HF as a function of the core diameter calculated at 1.06 and 1.55 μm. These calculations were performed using a commercial full-vector modal solver, FEMLAB, based on the Finite Element Method (FEM). The figure shows that the effective nonlinearity can be drastically enhanced by decreasing the core diameter due to the tighter mode confinement. The nonlinearity increases up to the point that the core becomes too small to confine the mode tightly. For diameters below this critical diameter the effective nonlinearity decreases rapidly as the mode spreads progressively further out of the core and into the air. The highest limit on fibre nonlinearity at 1.55 μm is nearly
173 CHAPTER 4 Fabrication of simple structure soft glass HF W -1 km -1 for enclosed core HFs with core diameters in the range μm. It should be noted that higher values of effective nonlinearity can be achieved at shorter wavelengths due to a combination of the 1/λ wavelength of γ, and the fact that shorter wavelengths can be confined to the core down to smaller core dimensions Effective mode area and nonlinearity Table 4.11 summarizes the measurements and modelling results on the effective mode area and the WW HF nonlinearity. The experimental tests were performed to determine the γ and the A eff of the HFs while ASR modelling was simulated for comparison between the theoretical predictions and the measured results. The measurements were performed using the Boskovich method [26], which is the standard nonlinearity measurement technique for small core fibre as discussed in detail in Section Table 4.11: Comparison between the theoretical predictions and the measured results for the effective mode area and nonlinearity of the WW HFs. fabricated WW HFs ASR model Simulation performed on real fibre D enclosed D triangular nonlinearity measurement predicted predicted (μm) (μm) γ (W -1 km -1 ) Aeff (μm 2 ) γ (W -1 km -1 ) γ (W -1 km -1 ) not not fabricated fabricated ± na na *1.7[13] ± na ± na note that all the γ and Aeff values are measured and predicted at 1550nm * SF57 WW HF made by Dr. H. Ebendorff-Heidepriem [9]
174 CHAPTER 4 Fabrication of simple structure soft glass HF 149 Nonlinearity of SHF069 (1.8core) Phase vs Input power Phase Shift (rad) Phase Shift (rad) Input power(mw) Phase Shift vs Input Power Best Fit 99% Confidence Intervals Input Power (mw) Phase shift vs Input power Best Fit (a)nonlinear measurement for D enclosed 1.8μm (b)nonlinear measurement for D enclosed 1.2μm Figure 4.37: Measured nonlinear phase shift as a function of input power for (a) F2#1 with D enclosed 1.2μm and (b) F2#3 with D enclosed 1.8μm at 1550nm eff. fibre length (m) eff. length 1550 (m) eff. length 1060(m) eff. fibre length (m) length of fibre (m) vs eff. Length 1550 (m) length of fibre (m) vs eff. Length 1060(m) fibre length (m) (a) Leff curve for D enclosed 1.8μm fibre length (m) (b) Leff curve for D enclosed 1.2μm Figure 4.38: Curves of effective length for (a) F2#1 with D enclosed 1.2μm and (b) F2#3 with D enclosed 1.8μm at 1550nm and 1060nm In Figure 4.37 (a) and (b)., the nonlinear phase shift is plotted as a function of input power for WW HFs (F2) of D enclosed 1.2μm and 1.8μm respectively. For the fibre with D enclosed 1.8μm, about 12metres of test fibre was used during the measurement, although the effective length is ~ 2.16m, as shown in Figure The effective lengths of the HFs were calculated using equation 3.6. The coupling efficiency was quite low, ~15%. For the fibre with D enclosed 1.2μm, a shorter length of fibre, about 0.78m of HF was used with a L eff =0.62m. The best coupling efficiency we managed to get with this fibre was 12.42%. From the slope of the linear fit and taking account of the L eff of the test fibres, an average value of γ was estimated to be γ = 598 ± 31 W -1 km -1 for D enclosed 1.2μm and γ = 404 ± 21 W -1 km -1 for D enclosed 1.8μm.
175 CHAPTER 4 Fabrication of simple structure soft glass HF 150 From the graph shown in Figure 4.39(a), the measured γ for both fibres are low compared with the predicted values (the ASR γ curve was modelled by Dr. V. Finazzi). In contrast, the previous SF57 WW HFs of D enclosed 1.7μm [9], agreed well with the ASR modelled curves with n 2 =35x10-20 m 2 /W. Note that n 2 measured by Friberg is 41x10-20 m 2 /W [27]. γ(1/w.km) (a) ASR with n 2 = 41x10-20 m 2 /W ASR with n 2 = 35x10-20 m 2 /W 1.7μm core measured [ ] F2#1 1.2μm core measured F2#3 1.8μm core measured F3#3 0.9μm core measured Effective nonlinearity coefficient (W -1 km -1 ) (b) predicted at 1.06μm predicted at 1.55μm experiment value at 1.55μm for F3# core diameter (μm) Core diameter (μm) Figure 4.39: (a) Effective nonlinearity of ASRs and WW HFs as a function of triangular core diameter (b) Effective nonlinearity of simulated SEM of the real fibre structure and WW HFs as a function of core diameter Fibre F3 #3, which has a core diameter of 0.9μm, is close to the peak of the nonlinearity curve that corresponds to 1.55 μm in Figure 4.39(b). Note that, we targeted a diameter of ~1μm as this provides a reasonable trade-off in terms of nonlinearity and ease and efficiency of coupling into the fibre. Refer to Figure 4.39 (b), we had estimated a γ value of 1860W -1 km -1 for fibre F3#3 with a core diameter of 0.9μm, which to the best of our knowledge is the highest nonlinearity value ever reported for an optical fibre at this wavelength. This number is in fact slightly higher (~10%) than we anticipated theoretically, and we estimate it to be within ~10% of the maximum value possible in this glass. The performance of a nonlinear device depends both on the effective nonlinearity and the effective length of the fibre [7]. The latter is determined by the fibre propagation loss. Although the soft glass HFs we present herein have much higher losses than state-of-the-art silica based highly nonlinear fibres, their effective
176 CHAPTER 4 Fabrication of simple structure soft glass HF 151 nonlinearity is also much higher (by almost two orders of magnitude). It follows that the required fibre length to implement a nonlinear device for practical power levels can thus be reduced considerably relative to high nonlinearity silica fibres. Therefore, the real potential of soft glass HFs is for the realisation of short length nonlinear devices operating at low power levels. The use of a short fibre length is significant in that it offers several important performance benefits including reduced sensitivity to external perturbations, reduced susceptibility to dispersion variation along the device length, and reduced device latency as required for example in devices such as alloptical demultiplexers, clock recovery systems and logic gates Dispersion For most nonlinear fibre applications control of the fibre dispersion is more important than achieving the maximum possible nonlinearity per unit length, and here again the use of HF technology provides unique opportunities. The small core dimensions possible in HFs with a high cladding air-fill fraction result in a strong wavelength dependence of the effective cladding index which affects both the magnitude and spectral profile of the waveguide dispersion. This can be used to control the total fibre dispersion over extended wavelength ranges compared to conventional solid fibres. For example, in silica glass HFs it is possible to achieve anomalous dispersion at visible wavelengths, i.e. at wavelengths much shorter than the material ZDW, allowing soliton formation at wavelengths shorter than 600nm [1]. Similar benefits in terms of controlling the dispersion properties of fibres at wavelengths of technological interest can be obtained in soft glass HFs. The material ZDW for SF57 glass is ~1.97 μm yet as we show in this section, it is possible to use the large waveguide dispersion available in SF57 HFs to obtain fibres with ZDWs shifted by more than 1000nm to allow efficient SC when pumped at wavelengths around 1μm.
177 CHAPTER 4 Fabrication of simple structure soft glass HF Fibre design modelling Refering to Figure 4.41, for SF57 lead silicate glass, the bulk glass has a large normal material dispersion at wavelength <1970nm. The air-filled region and small core of the HFs is responsible for the large waveguide dispersion possible. The strong waveguide properties of the HFs can be used to dominate the large (normal) material dispersion of lead silicate glass to provide fibre with overall anomalous dispersion at wavelengths below 1μm and flexibility in terms of the dispersion profiles is therefore possiblely much bigger in HFs than in conventional fibres. Changing the design of the microstructure (hole sizes, core size) strongly influences the waveguide dispersion and it is possible to design WW HFs with ZDWs in the visible wavelength ranges. The group velocity dispersions of these WW HFs were calculated by Dr. T. Monro from the index profile of the fibres using an orthogonal function technique (OFT). The modeling results, shown in Figure 4.40, shows that at a given wavelength, the dispersion of the fibre increases with decreasing core size due to enhanced waveguide dispersion, and thus zero dispersion values are shifted to a shorter wavelength. Based on the modelling results, SF57 WW HFs with core size smaller than 1.5μm, are anticipated to enable zero dispersion at 1060nm with very high fibre nonlinearity. Therefore, the potential of using such fibres in supercontinuum generation at the commonly available fs-laser pumping source wavelengths become apparent, since they can effectively lower the power and length demands of the nonlinear devices. When we did a comparison between the OFT and the finite element method (FEM) (calculated by Dr. V. Finazzi), we noticed that OFT (Figure 4.40) behaves very well when applied to large scale structures, but it is "challenged" when dealing with high refractive index contrasts and small core fibre structures. The two methods were compared with the calculation of an air-suspended rod made of SF57 with similar sizes. The solution by FEM is much closer to the exact one than the solution by the orthogonal function technique. Thus we concluded that the predictions found by FEM in the case of the WW fibres are more reliable than the one found via the orthogonal function method.
178 CHAPTER 4 Fabrication of simple structure soft glass HF D (ps/nm/km) SF 57WW: core ODc=1.2um SF57WW: core ODc=1.7um SF57WW: core ODc=2.0um SF57WW: core ODc=2.7um SF57 material dispersion wavelength (nm) Figure 4.40: Simulated dispersion of bulk SF57 glass and HFs with different core diameters, using OFT by Dr. T. Monro. In order to assess the dependence of the fibre dispersion characteristics on the HF core diameter more accurately, we evaluated the group velocity dispersion of a range of HFs with different core dimensions using an FEM-code, adopting the refractive index profile of the real fibre. The results of our calculations are summarized in Figure 4.41 where we plot the corresponding dispersion curves for different core diameters. The waveguide dispersion is seen to have a more and more pronounced effect on the shape of the overall fibre dispersion curve as the core dimension is reduced. The plots show that a fibre with a core diameter of ~ 1.3 μm results in a ZDW at 1.06 μm (Note however that the dispersion slope is still quite high at this wavelength, ~1ps/nm 2.km). From Figure 4.42, it is seen that this fibre exhibits γ = ~2000 W -1 km -1 at this wavelength, a factor of 3 or so less than the maximum possible nonlinearity is achievable with such fibres at this wavelength. HFs with diameters around 1.3μm thus appear well suited for nonlinear fibre optics applications such as supercontinuum generation around 1 μm, where the combination of high effective nonlinearity and low values of chromatic dispersion are essential to realise power-efficient nonlinear devices.
179 CHAPTER 4 Fabrication of simple structure soft glass HF 154 Dispersion (ps/nm/km) um 0.7 um 1.0 um 1.10 um 1.20 um 1.30 um 1.40 um SF57 bulk glass Wavelength (um) Figure 4.41: Simulated dispersion curves for bulk SF57 glass and HFs with different core diameters, using FEM by Dr. V. Finazzi Effective nonlinearity coefficient (W -1 km -1 ) (a) F3#3 F2# μm experiment 1.55 μm Zero-dispersion wavelength (μm) 1.3 (b) F3#3 F2# Core diameter (μm) Core diameter (μm) Figure 4.42: (a) Effective nonlinearity coefficient at 1.55 μm and 1.06 μm, and (b) zero-dispersion wavelength as a function of core diameter for our SF57 HF design. The lines F3#3 and F2#1 represent structures targeted and fabricated within our research. At present, we have no ready way to measure the dispersion profile of short lengths of our fibres around 1 μm, so we rely on our spectral broadening/sc experiments to confirm that these HFs have a low dispersion in the 1 μm range (this will be discussed further in Chapter 6)
, but due to very fine core size and high core-clad index difference, it is directly linked to a high value of birefringence in the fibre")
180 CHAPTER 4 Fabrication of simple structure soft glass HF Birefringence Figure 4.43 is the fibre sample with core size of 1.2μm (F2#1) used in this measurement. As can be seen in Figure 4.43, the core has a quite symmetric shape (>2 fold symmetry), but due to very fine core size and high core-clad index difference, it is directly linked to a high value of birefringence in the fibre and short beat length, which is about 3mm at 1060nm. The fibre length used is 96cm. Figure 4.43: SEM of the cross section of the WW HF with a beat length of ~3mm Normalised Intensity wavelength (nm) Figure 4.44: Optical spectrum with removed spectral background This measurement was performed using the wavelength scanning method. This wavelength dependence method has been used in measuring the beat length of HFs as most direct birefringence measurement methods of conventional fibre failed [28]. The result of the scan from 1050nm to 1070nm is shown in Figure 4.44, showing a clear polarisation beating for the WW HF of length 96cm.
181 CHAPTER 4 Fabrication of simple structure soft glass HF 156 Table 4.12: Comparison between the measurement and modelling results Sample L(mm) Δλ (nm) λ 0 (nm) L b (mm) B(x10-3 ) F2#1(1.2μm core) Preliminary modelling (Dr. V. Finazzi) ~ Here, we obtained a fairly high birefringence fibre, which shows a beat length of 3.08mm and group birefringence of 0.28x10⁻³ at 1060nm. The measurement result is in reasonable agreement with the preliminary simulation result by Dr. V. Finazzi, who predicted a beat length of about 2.2mm. The discrepancy between theory and experimental results might be due to the effect of possible additional stress birefringence during fibre fabrication, although form birefringence is dominant in the structure. For smaller core HFs, the beat length of less than 1mm should be expected. Note that this WW HF shows lower values of birefringence compared with typical small core silica HFs. This is primarily due to the more symmetrical core and structure of the WW HF Figure-of-merit (FOM) for nonlinear performance To date, it is accepted that higher γ can be achieved within the highly nonlinear soft glass HFs than in silica HFs, standard silica fibres and highly nonlinear dispersion-shifted silica fibres (HNL-DSF); and that the fibre based nonlinear device length can be significantly shortened by using highly nonlinear soft glass HFs. The highest nonlinearity achievable to date within the soft glass HFs is of γ value of 1860W -1 km -1 at 1550nm [4-5] (i.e. A eff =1.39μm 2 assuming n 2 ~ 41x10-20 m 2 /W measured by Friberg [27]). However, there are several drawbacks in the highly nonlinear small core soft glass HFs compared to standard silica fibres (SMF-28) and highly nonlinear dispersion-shifted silica fibres (HNL-DSF): interface issues and losses. The losses are
182 CHAPTER 4 Fabrication of simple structure soft glass HF 157 in particular a severe factor since the useful fibre nonlinearity is determined by the product of the nonlinearity and the effective device length. Apart from the dispersion properties, which make the most impact for most nonlinear applications; one possible way to evaluate the soft glass fibre for nonlinear device applications, is to define a new figure of merit (FOM) for highly nonlinear soft glass HFs, since the effective length is ultimately limited by the attenuation length (i.e. α -1 ). Referring to Chapter 3, Section 3.8, γ and α are the fibre-specific parameters which determine the nonlinear phase shift. Thus, the product γ L eff is a useful FOM since it takes into account both effective nonlinearity and fibre loss. Higher FOM values indicate that a larger nonlinear effect can be achieved with a certain input power, or a smaller power is required for a certain device length. Based on the requirements for different device types, we have identified two different fibre length regimes and thus two different FOMs according to Dr. H. Ebendorff-Heidepriem s work in [7]. Since the main focus of this work is on the HF for nonlinear compact devices, mainly SC, therefore the discussion will pay more attention to compact devices using 1m fibre length Device based on maximum useful fibre length Here we define L * as the maximum useful fibre length for which L * eff = 0.9 L *. From Table 4.13, the highest FOM γ L * eff is achieved with standard silica fibre. However, the necessary fibre length of ~4.7 km is not suitable for practical devices. This demonstrates that γ L * eff or simply γ/α are not useful FOMs for fibres having maximum useful fibre lengths longer than practical fibre lengths. For fibres with higher losses and thus shorter L *, the SF57 lead silicate glass HF with very high fibre nonlinearity and low loss of 1 db/m can compete with the silica HFs.
183 CHAPTER 4 Fabrication of simple structure soft glass HF Compact devices using 1m fibre length The FOMs for silica HFs, standard silica fibre, HNL-DSF, nonlinear bismuth oxide WW HFs, tellurite HFs and SF57 lead silicate WW HFs, are listed in Table The γ and α values for the silica HFs fibre refer to two fibres that have been demonstrated recently. The γ and α values for the SF57 glass HF refer to measured values. The anticipated decrease of the fibre loss also takes into account realistic fabrication improvements such as die design and better surface finish. From the comparison of the FOM values, it can be concluded that SF57 lead silicate glass HFs, despite a current loss of ~2dB/m, demonstrate better performance than the best silica HF in terms of higher γ x L eff,1m values. This can be explained by the fact that for shorter fibre lengths of 1m, the drastic increase in nonlinearity clearly outweighs the decrease of the effective fibre length due to higher propagation loss. It is noteworthy that for fibre lengths <1m, the decrease of the effective fibre length becomes less pronounced and hence the NL coefficient dominates the FOM. This shows that for compact devices 1 m, higher fibre losses of 2 db/m can be easily tolerated. The distinctly higher FOM values of SF57 clearly indicate that lower powers are required to obtain a certain NL effect even for short fibre lengths of <1m. From Table 4.13, we can clearly see that SF57 lead silicate WW HF with 0.9μm core diameter and 2.5dB/m loss, achieved the highest FOM value compared to the best silica HFs, standard silica fibre, HNL-DSF fibres and other soft glass HFs from [29-31] and [7,13]. For comparison, we also included the anticipated values of γ and α for the lead silicate WW HFs. The estimation of the γ values is based on the ASR model using the smallest WW fibre core size achieved. The anticipated value of fibre loss also decreases when further fabrication improvements (i.e. cleaning and die surface finish) is taken into account. With the maximum value of nonlinearity coefficient in the lead silicate WW HF, 1860W -1 km -1 and anticipated reduced loss of 1dB/m, we estimated the FOM values will be greatly increased to Besides that, compared to other soft glass HFs such as the tellurite and bismuth HFs, it is possible for SF57 WW HFs to have ZDW at 1060nm at reasonable core sizes. This is because the SF57 glass has a lower refractive index than both tellurite and bismuth glass, thus
184 CHAPTER 4 Fabrication of simple structure soft glass HF 159 leads to lower material dispersion than these two glasses. Less waveguide dispersion is needed to compensate the material dispersion of the SF57 to get net GVD at 1060nm. Table 4.13: FOMs for silica, bismuth oxide, tellurite and lead silicate glass fibres Glass Comment Fibre Parameters (a) (b) Fibre γ Loss α L* γxl* eff γ/α L eff, 1m γxl eff,1m Type (W -1 km -1 ) (db/m) (km -1 ) (m) (W -1 ) (W -1 ) (m) (10-3 W -1 ) Silica Standard Fibre CF HNL-DSF [29] Silica HF [30] [31] Anticipated γ and α values Bismuth [7] Tellurite [13] Lead Silicate WW HF (SF57) 1.2μm core measured 0.9μm core measured [4,5] Measured γ for 0.9μm core and anticipated α Measured γ for 0.9μm core and anticipated α Conclusion We have used extrusion techniques to fabricate low loss small-core HFs with an extremely high effective nonlinearity in lead silicate glass (SF57). The fibres we have fabricated exhibit an effective nonlinearity of 1860 W -1 km -1, which is the highest value reported to date for a fibre at 1550nm. By carefully tailoring the size of the microstructure we achieved a ZDW of ~1 µm, which make our fibres extremely useful for SC generation applications at that wavelength. By reducing contamination and roughness of the preform surface, we
185 CHAPTER 4 Fabrication of simple structure soft glass HF 160 gradually reduced the fibre losses to as low as 2 db/m at 1550 nm for some ranges of WW structural HFs. Further surface refinement and the use of glasses with lower bulk loss is envisaged to reduce the HF losses down to <1 db/m. The nonlinearity of the HFs is enhanced further by decreasing the core size. The higher dispersion of the lead silicate HFs promises zero-dispersion at 1060 nm combined with very high nonlinearity. These results demonstrate that SF57 lead silicate is indeed a promising component for the development of compact nonlinear devices operating at low powers and offering appropriate dispersion. Based on the requirements for different device types, we have identified two different fibre length regimes and thus two different FOMs according to Dr. H. Ebendorff-Heidepriem s work in [7]: (a) Device based on maximum useful fibre length (b) Compact devices using 1m fibre length. We focused more on the FOM for compact devices using 1m fibre length, as our work is on producing HF for nonlinear compact device application, i.e. SC. For such devices, all SF57 glass WW HFs even those with ~3dB/m exhibit clearly better performance (higher γ L eff,1m values) than the best silica HF. This is due to the fact that for shorter fibre lengths 1 m the drastic increase of the nonlinearity clearly outweighs the decrease of the effective fibre length due to higher propagation loss. In short, for compact devices 1 m, higher fibre losses of 2 db/m can be easily tolerated. This shows that the distinctly higher FOM values of SF57 HFs clearly indicate that lower powers are required to obtain a certain NL effect even for short fibre length of <1m and it can compete with the silica HFs for compact and low power nonlinear devices.
186 CHAPTER 4 Fabrication of simple structure soft glass HF References 1. J.C. Knight, J. Arriaga, T.A. Birks, A. Ortigosa-Blanch, W.J. Wadsworth, P. Russell, "Anomalous dispersion in photonic crystal fibre," IEEE Photonics Technology Letters 12, pp (2000). 2. T. A. Birks, D. Mogilevstev, J. Knight, and P. S. Russell, Dispersion compensation using single-material fibres, IEEE Phot. Techn. Lett. 11, (1999). 3. A. Ferrando, E. Silvestre, and P. Andres, Designing the properties of dispersion-flattened photonic crystal fibre, Opt. Express 9, 687 (2001). 4. J.Y.Y.Leong, P.Petropoulos, S.Asimakis, H.Ebendorff-Heidepriem, R.C.Moore, K.Frampton, V.Finazzi, X.Feng, J.H.V.Price, T.M.Monro, D.J.Richardson, A lead silicate holey with y=1860 W -1 km -1 at 1550 nm, OFC 2005 Anaheim 6-11 Mar 2005 PDP22 (Postdeadline). 5. J.Y.Y.Leong, P.Petropoulos, J.H.V.Price, H.Ebendorff-Heidepriem, S.Asimakis, R.Moore, K.Frampton, V.Finazzi, X.Feng, T.M.Monro, D.J.Richardson, High nonlinearity dispersion-shifted lead-silicate holey fibres for efficient 1 micron pumped supercontinuum generation, Journal of Lightwave Technology 24, pp (2006). 6. J.Y.Y.Leong, H.Ebendorff-Heidepriem, S.Asimakis, P.Petropoulos, V.Finazzi, D.J.Richardson, T.M.Monro, Development of Highly Nonlinear Extruded Lead Silicate Holey, Advances in Glass and Optical Materials: Proceedings of the 107th Annual Meeting of The American Ceramic Society, Baltimore, Maryland, USA 2005, Ceramic Transactions, Volume 173, pp. 1-9 (2006). 7. H. Ebendorff-Heidepriem, P. Petropoulos, S. Asimakis, V. Finazzi, R. Moore, K. Frampton, F. Koizumi, D. Richardson, and T. Monro, "Bismuth glass holey fibres with high nonlinearity," Opt. Express 12, (2004). 8. J.H. Lee, P.C. Teh, Z. Yusoff, M. Ibsen, W. Belardi, T.M. Monro, D.J. Richardson, A holey fibre-based non-linear thresholding device for optical CDMA receiver performance enhancement, IEEE Photon. Technol. Lett. 14, pp (2002). 9. P. Petropoulos, T.M. Monro, H. Ebendorff-Heidepriem, K. Frampton, R.C. Moore, and D.J. Richardson, Highly nonlinear and anomalously dispersive lead silicate glass holey fibres, Opt. Express 11, (2003).
187 CHAPTER 4 Fabrication of simple structure soft glass HF Sugimoto, T. Nagashima, T. Hasegawa, S. Ohara, K. Taira, and K. Kikuchi, "Bismuth-based optical fiber with nonlinear coefficient of 1360 W-1 km-1," presented at OFC 2004, Los Angeles, California, USA, 2004, paper PDP M. A. van Eijkelenborg, M. C. J. Large, A. Argyros, J. Zagari, S. Manos, N. A. Issa, I. Bassett, S. Fleming, R. C. McPhedran, C. M. de Sterke and N. A. P. Nicorovici, Microstructured Polymer Optical Fibre, Opt. Express 9, (2001). 12. V. Kumar, A. K. George, J. C. Knight, and P. St. J. Russell, "Tellurite photonic crystal fibre," Opt. Express 11, (2003). 13. Mori, A., Shikano, K., Enbutsu, W., Oikawa, K., Naganuma, K., Kato, M. & Aozasa, S. 1.5 µm band zero-dispersion shifted tellurite photonic crystal fibre with a nonlinear coefficient of 675 W -1 km -1, ECOC 2004, Stockholm, Sweden, 5-9 Sep 2004, paper Th K. M. Kiang, K. Frampton, T. M. Monro, R. Moore, J. Tucknott, D. W. Hewak, D.J. Richardson, and H. N. Rutt, "Extruded single-mode nonsilica glass holey optical fibres," Electronics Letters 38, pp (2002). 15. V. V. Ravi Kanth Kumar, A. K. George, W. H. Reeves, J. C. Knight, P. St. J. Russell, F. G. Omenetto, A. J. Taylor, Extruded soft glass photonic crystal fibre for ultrabroad supercontinuum generation, Opt. Express 10, (2002). 16. T.M. Monro, Y.D. West, D. W. Hewak, N. G. R. Broderick and D.J.Richardson, Chalcogenide holey fibres, Electron. Lett. 36, (2000). 17. E. M. Vogel, M. J. Weber, and D. M. Krol, "Nonlinear Optical Phenomena in Glass," Phys. Chem. Glasses 32, (1991). 18. W. Egel-Hess, E. Roeder, Extrusion of glass melts Influence of wall friction effects on the die swell phenomenon, Glastech. Ber. 62, (1989). 19. E. Roeder, Extrusion of Glass, J.Non-Crys. Solid 5, (1971). 20. E. Roeder, Flow behaviour of glass during extrusion, J.Non-Crys. Solid 7, (1972). 21. E. Roeder, W.Egel-Hess, Extrusion for complicated inner profiles of glass, Glasstech. Ber. 60, (1987). 22. H. Ebendorff-Heidepriem, P. Petropoulos, R. Moore, K. Frampton, D. J. Richardson, and T. M. Monro, "Fabrication and optical properties of lead silicate glass holey fibres" J. Non-Crystalline Solids , (2004).
188 CHAPTER 4 Fabrication of simple structure soft glass HF T. M. Monro, K. M. Kiang, J. H. Lee, K. Frampton, Z. Yusoff, R. Moore, J. Tucknott, D. W. Hewak, H. N. Rutt, and D. J. Richardson, "High nonlinearity extruded single-mode holey optical fibres," presented at OFC 2002, Anaheim, California, March 2002, paper FA1-1 (Postdeadline). 24. Schott Glass Catalogue, V. Finazzi, T. M. Monro and D. J. Richardson, Small-core silica holey fibres: nonlinearity and confinement loss trade-offs, J. Opt. Soc. Am. B 20, (2003). 26. A. Boskovich, S.V. Chernikov, J.R. Taylor, L. Gruner-Nielsen, and O.A. Levring, Direct continuous-wave measurement of n 2 in various types of telecommunication fibre at 1.55 µm, Opt. Lett. 21, (1996). 27. S. R. Friberg and P. W. Smith, "Nonlinear Optical-Glasses for Ultrafast Optical Switches," IEEE J. Quantum Electron. 23, (1987). 28. A. Ortigosa-Blanch, J. C. Knight, W. J. Wadsworth, J. Arriaga, B. J. Mangan, T. A Birks, and P. St. J. Russell, Highly birefringent photonic crystal fibres, Opt. Lett. 25, (2000). 29. T. Okuno, M. Onishi, T. Kashiwada, S. Ishikawa, M. Nishimura, Silicabased functional fibres with enhanced nonlinearity and their applications, IEEE J. Sel. Topics Quant. Electron. 5, (1999). 30. A. Boskovich, S.V. Chernikov, J.R. Taylor, L. Gruner-Nielsen, O.A. Levring, Direct continuous-wave measurement of n(2) in various types of telecommunication fibre at 1.5μm, Opt. Lett. 21, (1996). 31. S. Ohara, N. Sugimoto, K. Ochiai, H. Hayashi, Y. Fukasawa, T. Hirose, M. Reyes, Extra-broadband and highly efficient short length Bi 2 O 3 -based EDF, OFC 2003, Atlanta, Georgia, Mar 2003, paper FB8.
189 CHAPTER 5 Fabrication of complex structure soft glass HF 5.1 Introduction From the previous Chapter 4, we focused efforts on maximizing the γ value by fabricating soft glass fibres with a small core supported by three fine struts depicted in Figure 5.1 (a). By making these struts sufficiently thin and long the waveguide properties of these structures become very similar to those of a circular solid core fibre surrounded by an air-cladding as shown in Figure 5.1 (b). These suspended-core HFs offer very large nonlinearities but allow for only relatively limited dispersion control around 1.55μm. The aim of this project is to develop a new class of highly nonlinear HFs, with better dispersion management characteristics, using Schott SF57 lead silicate glass. The targets for such fibres are high effective nonlinearity, low confinement loss, single-mode or effectively single-mode guidance, near-zero dispersion and flattened dispersion slope at 1550 nm. From Figure 5.2, it is noticeable that it will be a challenging task to control the fibre dispersion and, at the same time, shift the ZDW of the WW HF to longer wavelengths, i.e. 1550nm, due to its very sensitive and steep dispersion profile at that particular wavelength range. In the WW HF, as discussed in Chapter 4, the only structural parameter that can be varied is the core size, which is adjusted by scaling the microstructured region. The relative hole size or air-filling fraction is limited by the strut length and thickness required to ensure low confinement loss. Referring to Figure 5.2, it is clear that, to achieve zero dispersion in the C-band, a very fine core (with a diameter of <0.7μm) is needed for appropriate waveguide dispersion to counteract the large normal material dispersion. Obviously, this will not only complicate the small core WW HF fabrication process, but the sensitivity and the steepness of the WW HF dispersion profile at 1550nm will also increase the complication of dispersion management. Furthermore, the WW HF with ZDW in the C-band will be heavily multimoded.
190 CHAPTER 5 Fabrication of complex structure soft glass HF 165 Air surrounding the rod glass rod (a) (b) Figure 5.1: (a) SEM of the cross section of the extremely high nonlinearity WW HF (b) a circular solid core fibre surrounded by an air-cladding Dispersion (ps/nm/km) μm core WW HF 0.7 μm core WW HF 0.8 μm core WW HF 0.9 μm core WW HF 1.0 μm core WW HF 1.1 μm core WW HF 1.2 μm core WW HF Wavelength (μm) Figure 5.2: Dispersion profiles of the WW HFs The control of the dispersion is a critical issue for the majority of nonlinear device applications and therefore fibre designs that allow a trade-off in nonlinearity for improved dispersion control (whilst maintaining single mode operation) are of great technological interest. Generally, these designs require far more complex arrangements of air holes than a simple air-suspended core. More complex air hole arrangements such as a hexagonal lattice in silica HFs is needed for control of the holey cladding, so that it has a sufficient waveguide dispersion to compensate for the normal material dispersion at 1970nm, at the same time it provides a flattened dispersion profile. It is currently difficult to achieve this kind of holey cladding by extrusion alone due to the complexity of the die-design required, or by simple capillary stacking. However, improvements in glass extrusion technology now allow the production of more complex preform stacking elements, providing far greater
191 CHAPTER 5 Fabrication of complex structure soft glass HF 166 possibilities for producing dispersion tailored soft glass HFs. In this project, we describe some alternative fabrication approaches which we refer to as the hexagonally capillary-stacking-technique (CAST) and Structured Element Stacking Technique (SEST), which combine the best features of both extrusion and stacking and allow the production of the more complex preforms required to achieve good dispersion control in soft glass HFs. Three approaches have been used to produce high nonlinearity soft glass HFs. One is the fabrication of the so-called WW HF, whereby the structured preform is made directly using the extrusion technique. The feasibility of this approach for the fabrication of small-core high-na HFs has been proven at the ORC by the demonstration of low-loss, high nonlinearity WW fibres made from lead silicate glass with anomalous or zero dispersion in the near infrared region [1-5]. This fibre type has been discussed in detail in Chapter 4. The second approach is the stacking of capillaries to produce the structured preform for the CAST fibre. This approach is widely used for silica HFs but had not been used at the start of this project for the fabrication of small-core soft glass microstructured fibres with air holes. The third approach for soft glass HF fabrication combines the extrusion of structured elements with the stacking technique to produce the SEST fibre. The characteristics and advantages of each HF type are summarized in Table 5.1. The structured preform of the WW fibre is produced directly in one step using the extrusion technique. In contrast, the fabrication of the structured preforms of the CAST and SEST fibres is much more labour-intensive. Three extrusions, two canings and one stacking process are required. Since considerably fewer elements have to be stacked for the SEST preform, the stacking process is simplified for this fibre type and thus it is less labour-intensive compared with the CAST preform. The WW fibre type has the following advantages. HFs with large relative hole size and very small cores can be readily produced, which allows extremely high fibre nonlinearity. This is difficult to achieve using the stacking approach. However, the stacked fibre type offers larger freedom in the structural design and thus in the tailoring of dispersion profiles and the number of guided modes.

192 CHAPTER 5 Fabrication of complex structure soft glass HF 167 Table 5.1: Comparison of WW, CAST and SEST HFs Both WW and SEST fibres have the advantage that the core region and its directly surrounding holes are parts of one extruded glass element. By contrast, in the CAST fibre, the core rod and surrounding capillaries are separate elements and thus an interface between the core and the first ring of holes exists in the preform and possibly in the final fibre. This chapter is structured as follows. The next section describes the design and modelling of the two fibre designs CAST and particularly SEST. Section 5.3 describes the SEST fabrication technique employed to produce the fibres. Fabrication and characterization of different types of SEST HFs is described in detail in Section 4. In addition, we report on the progress in controlling the die designs to improve the preform quality. Finally, conclusions and future prospects of SF57 glass SEST HFs are given in Section 5.
193 CHAPTER 5 Fabrication of complex structure soft glass HF Complex structure holey fibre design and modelling Fibre design target Generally, a design of a far more complex arrangement of air holes than a simple air-suspended core is required for dispersion management of a HF. From the history of pure silica HF design, we found that with the hexagonal-stacking design, it allows far greater freedom in HF dispersion management; at the same time providing a flattened dispersion profile with a ZDW shifted to the 1550nm regime (Figure 5.3 (a)) [6]. This idea was then applied to the hexagonal-capillary-stacking soft glass HF and it showed a promising result where it was possible to shift the ZDW of the SF57 glass HF from 1970nm (material ZDW) to the C-band regime with an improved dispersion profile (Figure 5.3 (b)). This idea prompted us to come up with novel soft glass HF fabrication approaches, which we named CAST and SEST. A (b) um core, suspended core HF Dispersion (ps/nm/km) g= 1860W -1 Km um core WW HF (a) Wavelength (um) Figure 5.3: (a) Calculated dispersion profile for pure silica HF [6] (b) Initial simulated dispersion profile of hexagonal stacking SF57 glass HF, showing the possibility of moving the ZDW to 1550nm. The highly nonlinear complex structure soft glass HF design targets, for an optical wavelength λ of 1550nm are: A. High effective nonlinearity (γ>100w -1 km -1 )/small effective mode area The requirement of γ>100w -1 km -1 is set because the maximum effective nonlinearity that can be achieved in silica HF is ~60 W -1 km -1.
194 CHAPTER 5 Fabrication of complex structure soft glass HF 169 B. Low confinement loss (α c <0.1dB/m) The requirement of the confinement loss, α c <0.1dB/m is fixed in order to have a confinement loss that is less than the intrinsic material loss. Confinement loss can always be decreased by increasing the extent of the cladding region. However for stacking designs, ideally, a limited number of rings of air holes or elements (SEST) is required to ease the fabrication process. C. Zero or near zero dispersion (±5ps/nm/km) Like the single modality behaviour, the dispersion of the fibre can be tailored by acting on the size and arrangement of air holes in the stacking designs. ZDW in the C-band regime, with a flattened dispersion profile required for highly nonlinear HFs for their use in telecommunication nonlinear devices. D. Single mode (SM) or effectively single mode guidance (ESM) For the stacking designs according to the hole-to-hole spacing Λ, there is a maximum d/λ ratio for which the fibre is SM. Also, the smaller the Λ, the higher this maximum d/λ ratio. ESM guidance is achieved when the fibre is multimoded but the higher order modes exhibit very high values of confinement loss CAST and SEST design We started our initial research of SF57 HF for highly nonlinear applications in telecommunications by firstly considering the hexagonally CAST and SEST designs as shown in Table 5.1, and comparing them to the WW design. The microstructured region of the WW fibre consists of 3 large air holes surrounding a small core. The airsuspended core is supported by three fine struts. In contrast, the CAST and SEST fibres contain a hexagonal arrangement of air holes, whereby the CAST fibre has a regular lattice and the SEST fibre has a modified lattice (see sketches in Table 5.1). Before starting any fabrication work, we performed an initial assessment of both CAST and SEST designs. The details of the HF modelling process discussed in this chapter were courtesy of Francesco Poletti. We first exploited our previous study
195 CHAPTER 5 Fabrication of complex structure soft glass HF 170 on highly nonlinear silica holey fibres in order to choose an initial SF57 HF design [6-7]. Both of the CAST and SEST designs were characterised by two main parameters, hole size d and hole-to-hole spacing Λ. In this case, the hexagonal CAST design, with interstitials, was characterised by Λ= 1.3μm and d/λ=0.53 with 5-rings of holes while the SEST design was characterised by Λ= μm and d/λ=0.48 with 1- element holes (effectively 4 rings of air-holes). Here, we have identified both the CAST and SEST designs that fulfil the project targets. The comparison between both designs is performed, in order to ascertain the design that best satisfies all the requirements for fabrication. The SEST design is similar to the CAST design but with a different (more spread) holey cladding region. Table 5.2 summarises the predicted fibre properties at 1550nm for both CAST and SEST fibre. In conventional fibres, the fibre becomes single mode as the core size is reduced, and, for a given core size, as the numerical aperture (i.e. the core/cladding refractive index contrast) is reduced. Thus, in order to ensure SM or at least ESM guidance in holey fibres, we need to decrease the hole-to-hole spacing Λ (which is equivalent to decreasing the core size) and/or the d/λ ratio (which corresponds to decreasing the numerical aperture). Note that the confinement loss significantly increases when decreasing Λ, thus more rings of holes might be required, and the achievable effective nonlinearity is reduced when decreasing d/λ. Also, we need to verify that single mode guidance can be achieved along with near-zero dispersion. In order to continue this survey, we again take advantage of our previous studies on small-core silica holey fibres, which indicate that when 2 or more rings of air holes are present, the nonlinear and dispersive properties of the fibre are remarkably constant [8]. Note also that if a holey fibre structure is single mode when 2 rings of air holes are present, it will be single mode when more rings are added to the structure. Therefore, we analyse structures comprised of >2 rings of holes only, and eventually analyse the reasonable number of rings necessary to achieve low confinement loss for the cases that satisfy the zero dispersion/single modality requirements. In this case, we employed COMSOL MULTIPHYSICS (COMSOL), a commercial Finite Element Method modeling package, which can accurately represent the large refractive index contrast present in high nonlinear soft glass HFs and a full vector method is required.


 d/λ (μm) Calculated confinement loss (db/m) A eff (μm 2 ) γ (W -1 km -1 ) D <5 ps/nm/km span")
196 CHAPTER 5 Fabrication of complex structure soft glass HF 171 The modelling process was preformed by Francesco Poletti. Here, we found that the CAST design, comprised of 5 rings of air holes with interstitials, is sufficient to reduce the confinement loss to 0.003dB/m, whereas the SEST design with 1 ring element holes (effectively 4 rings of air-holes) exhibits an impractically high confinement loss of 20dB/m. Therefore, another additional ring of element holes is necessary to lower the confinement loss to dB/m, which is below the SF57 glass material loss (see the details in Table 5.2). Table 5.2: Comparison between the properties of the initial CAST and SEST HF designs HF type Ring of holes Λ (μm) d/λ (μm) Calculated confinement loss (db/m) A eff (μm 2 ) γ (W -1 km -1 ) D <5 ps/nm/km 1550nm (nm) CAST ~90 SEST Eff ~180 Eff ~180 From Table 5.2, we also can see that, despite the larger extent of the cladding region, the confinement loss for SEST HF is larger with respect to the CAST case, due to the presence of wider glass bridges in the former. The main impact of the different cladding arrangement is on the dispersion values, which is the most sensitive
197 CHAPTER 5 Fabrication of complex structure soft glass HF 172 of the optical properties. From the table, our results show that it is possible for both CAST and SEST HFs to overcome the material dispersion (1970nm) and have a flattened dispersion profile at 1550nm regime with D <5 ps/nm/km over a wavelength range spanning >100nm, and a γ value >500W -1 km -1 i.e. about 25% of the maximum possible in SF57 glass, at a reasonably low confinement loss. However, both the structures are ESM ring-element stacking SEST HF (1R-SEST) For many telecommunications applications, a fibre with as low and flat a dispersion profile as possible within the C-band is required. In order to identify fibre designs providing near-zero, flat dispersion at 1.55 μm, we employed an inverse design procedure similar to that previously applied to the optimization of dispersionflattened high nonlinearity silica fibres [7,9]. We restricted our studies to simple idealized SEST structures characterized by just 2 free-parameters, as depicted in Figure 5.4, where Λ is the hole spacing, and d is the hole size. The distance between the 6 outer holes and the boundaries of each stacked element was kept constant and equal to Λ/2. The Nelder-Mead Simplex Method was then employed to minimize the objective function defined by Obj= D slope + k. D where k= and D and Dslope are the dispersion and dispersion slope calculated at 1.5 μm. The Nelder-Mead simplex method is a commonly used nonlinear optimization algorithm and it is a numerical method for minimising an objective function in a many-dimensional space. Our target for the inverse optimization is to achieve zero GVD at 1550nm and also to have a dispersion profile flattened over 100nm. A plot of the dispersion profile for our optimized SEST structure (structural properties d/λ=0.48, Λ=1.314 μm) is shown in Figure 5.5. Our results show that it is possible for the SEST design to have a flattened dispersion with D <5 ps/nm/km over a wavelength range spanning from 1430nm to 1610nm, and a γ value approaching 526W -1 km -1 at 1550 nm.


 From previous")


198 CHAPTER 5 Fabrication of complex structure soft glass HF 173 Λ d Λ/4 Figure 5.4: Idealized SEST structures characterized by just 2 free-parameters, Λ is the hole spacing, and d is the hole size Λ = 1.30 μm d/λ = 0.48 Λ = μm d/λ = 0.48 Λ = μm d/λ = 0.48 Figure 5.5: Dispersion profiles for the idealised SEST HF, where the D <5ps/nm/km spanning from 1430nm to 1610nm is possible with an optimized structure (green curve) ring-element stacking SEST HF (2R-SEST) From previous discussion in Section 5.2.3, our modeling showed a promising result, that a flattened dispersion profile, with a γ value approaching 526W -1 km -1 at 1550 nm, is achievable via the single element ring optimized SEST structure. However, the core size for this design is substantially small (~2 μm) and this has implications in terms of confinement loss, as highlighted in Figure 5.6 (b) where we predicted confinement loss of the idealised SEST structure for both 1-ring-element stacking and the 2-ring-element staking designs at 1.55μm. It is seen that the confinement loss is extremely high value for such a small core if we use just a single


199 CHAPTER 5 Fabrication of complex structure soft glass HF 174 ring of stacked elements around the core. So, we need to have a trade-off between nonlinearity and confinement loss where, for very small core and high nonlinearity fibres, in order to reduce the confinement loss, it is necessary to include a second ring of elements within the structure, as depicted in the inset of Figure 5.6 (a). In this instance our calculations show that the confinement loss for our optimized SEST design can be reduced by approximately 4 orders of magnitude, relative to the single ring case down to a level of <20dB/km (Figure 5.6 (b)) well below the bulk loss of SF57, and at the same time maintain the dispersion profile (Figure 5.6 (a)) and the fibre nonlinearity. Note that from a theoretical perspective this fibre is expected to support higher order modes. However, the high confinement loss of these higher order modes, and the large difference in effective index between these and the fundamental mode, leave us confident to predict that this fibre design is likely to be effectively single mode in practice. Note also that the coupling efficiency will degrade and the birefringence of the fibre will increase as the scale of the structure is reduced. 2 rings CL= ring CL= 20 (a) (b) Figure 5.6: (a) Dispersion profiles for the optimized SEST HF and the SF57 glass (Inset: an additional second ring of elements within the optimized SEST structure), (b) Predicted confinement loss of the idealised SEST HF for both 1-ring-element stacking and the 2-ring-element stacking designs at 1.55μm.
200 CHAPTER 5 Fabrication of complex structure soft glass HF Complex structure HF fabrication Introduction Three different fibre designs have been considered: WW, CAST and SEST, in producing highly nonlinear soft glass HFs. The WW design has been discussed in Chapter 4. The analysis of the CAST and SEST design is discussed in the earlier Section 5.2. It shows that in the C-band regime, both the designs can provide nearzero dispersion, single mode fibres which exhibit effective nonlinearities larger than >500W -1 km -1 and confinement losses lower than 0.1 db/m, using a reduced number of rings of air-holes/elements (5 rings of air-holes for the CAST design and 1-2 rings of stacking elements for the SEST design). The CAST and SEST designs with equivalent core size result in similar optical properties, apart from the fact that the SEST design is more advantageous than the CAST design in terms of reducing the confinement loss, when the scale of the structure is reduced and the cladding extent needs to be enlarged. The fabrication scheme for a CAST fibre is shown in Figure 5.7. Basically, it comprises of 5 main steps, where: 1) The stacking elements (hexagonal rod and tube) and the jacket tubes are produced using the extrusion technique. 2) The stacking elements of OD~10mm are reduced in size to canes (capillaries) of OD~1mm. 3) These capillaries are stacked inside the stack jacket tube. 4) The stacked preform of OD>10mm is again reduced in size to a cane of OD~1.3mm and last but not least, 5) the stacked cane is inserted into the jacketing tube and finally drawn to the stacked fibre. We have chosen a hexagonal outer shape for the stacking elements to minimize the gaps between the capillaries in the stack and thus to facilitate fusion of the capillaries without closing the inner holes of the capillaries. The stack jacket has a hexagonal inner shape to suit the hexagonal outer shape of the stack. This facilitates the stacking process and minimizes the gap between jacket and stack.
 are basically equivalent to 1 ring of elements (i.")
 to a CAST structure. Thus, it is easier to add an extra ring of elements to a SEST structure than an extra ring of capillaries to a CAST structure. Figure 5.")
201 CHAPTER 5 Fabrication of complex structure soft glass HF 176 Figure 5.7: fabrication scheme of CAST fibres Fabrication-wise, SEST design fabrication is less labour intensive compared to CAST design fabrication. Refer to Figure 5.7, note that 3 rings of capillaries (i.e. 36 air-holes) are basically equivalent to 1 ring of elements (i.e. 48 air-holes). However, the addition of an extra ring of elements (i.e. a total of 132 air-holes) to a SEST structure implies a larger reduction in loss than the addition of a ring of capillaries (i.e. a total of 60 air-holes) to a CAST structure. Thus, it is easier to add an extra ring of elements to a SEST structure than an extra ring of capillaries to a CAST structure. Figure 5.8: Comparison of CAST and SEST HFs on the fibre drawing reduction ratio We also did not widely explore the CAST fabrication for this project as it is produced through single capillary stacking and the reduction ratio from the stacked preform directly to the end fibre is too small from a single pull compared to SEST
202 CHAPTER 5 Fabrication of complex structure soft glass HF 177 fabrication. Figure 5.8 depicts the fibre drawing reduction ratio for both CAST and SEST HFs. Therefore, after a consideration of the pros and cons of both the CAST and SEST design with different aspects of their functionality, we chose to concentrate on the SEST design fabrication SEST HF Fabrication scheme In Figure 5.9, we present a diagram showing the principle of the SEST approach which combines the benefits of extrusion and stacking to achieve a more complex preform structure with greater flexibility in the HF design. This approach is the combination of the following fabrication steps: 1) extrusion (or drilling) to produce macroscopic capillary tube, which acts as the jacketing tube and 6,7-holestructured elements, which are for stacking. 2) caning of the structured performs to mm scale, 3) stacking within the protective jacket and 4) fibre drawing. In short, this technique includes 2 essential fabrication techniques: extrusion and stacking. Three steps of heating processes, extrusion, caning and fibre drawing, are required to achieve the final fibre, when starting from the melted glass. Schott SF57 lead silicate glass was again selected as the glass host for this work. In order to realise SEST fibres, we first developed a new die design that allowed us to directly extrude 6- and 7-hole hexagonal preforms. The resulting structured preforms were then drawn to canes with an outer diameter of ~600 µm and stacked into an extruded jacketing tube. Finally, the assembled preform was drawn into >200m of fibre. Thus, with the SEST approach we were able to fabricate HFs with a hexagonal arrangement of effectively 4 rings of holes, (48 holes in total), simply by stacking together just 7 structured elements. This approach is less labour intensive than simple capillary stacking and provides a larger reduction ratio from the stacked preform to the final fibre. Moreover, since the core region and the first ring of holes are formed from one extruded glass element a greater degree of glass homogeneity is obtained in the core region. Note that the core size of the SEST fibres

203 CHAPTER 5 Fabrication of complex structure soft glass HF 178 depends on both d (the hole size) and Λ (the hole spacing), and is ~ 2Λ-d. Unlike our previously extruded WW HFs, whose critical properties are determined primarily by just one parameter, the core diameter. The core sizes of the fabricated HFs that we report here ranged between µm and had a d/λ ratio of 0.48 in the outer cladding region, and 0.55 in the ring immediately surrounding the core. Figure 5.9: Fabrication scheme of the SEST HFs Extrusion process and apparatus Basically, the extrusion apparatus and processes for SEST HF fabrication are the same as WW HF fabrication described in Chapter 4. Figure 5.10 shows a custom designed extrusion apparatus comprising an oil hydraulic press and high temperature furnace providing up to ~15 tons (1 ton = 1000kg) of force with the upper operating temperature of C, was used in extruding differently shaped glass elements (rods, tubes, WW preforms). The system gives a reasonable pressure control where the pressure can be changed during extrusion in order to obtain a targeted speed. More detailed explanations in the procedure for extrusion process are given in Appendix 2 (II).

204 CHAPTER 5 Fabrication of complex structure soft glass HF 179 Figure 5.10: Sketch of extrusion set up and process for SEST preform fabrication Die characteristics For all the work done on these extrusions, the dies used were made of stainless steel 303, which is of 70%Fe-18%Cr-10%Ni composition as discussed in Chapter 4, Section It is chosen because it is cheap and has good machining ability. Also, stainless steel has high thermal-stability temperature, which is up to ~700 0 C compared to SF57 soft glass, which has a melting temperature at C. For fabricating dies of complex and intricate structure like the SEST design, we were using another alternative approach, which is known as spark erosion because it is cheap, less labour intensive and the dimensions of the die design can be readily altered compared to fabrication using conventional metal cutting machines (Refer to section for further details on the die materials and die making). Through introducing complex structure into the extrusion die, more complex structured HF preforms can be fabricated. For the SEST design, we need 2 sets of die for the 7-hole structured element, which acts as cladding and the 6-hole structured element for the fibre core. Note that each set of SEST dies consists of two parts: the outer nozzle yielding the outer hexagonal shape and the inner core yielding the inner holey structure as shown in Figure 5.11.
 6-hole die set (b) 7-hole die set for SEST preform extrusion 5.")


205 CHAPTER 5 Fabrication of complex structure soft glass HF 180 (a) (b) Figure 5.11: (a) 6-hole die set (b) 7-hole die set for SEST preform extrusion 5.4 Results and discussion In this section, we will discuss the technical progression of the fabrication work in order to achieve the objective of this project, which is producing a soft glass HF that has a near-zero, or zero dispersion with a flattened dispersion profile, SM or ESM, exhibiting effective nonlinearities larger than >60W -1 km -1 and confinement losses lower than 0.1 db/m. Four trials were carried out: 1. 1 st experiment on 1-ring-element stacking technique: 1R-SEST 2. 2 nd experiment on improved 1-ring-element stacking technique: Improved 1R-SEST 3. 3 rd experiment on 2-ring-element stacking technique: 2R-SEST 4. 4 th experiment on improved 2-ring-element stacking technique: 2+1 R-SEST Firstly, we produced 2 sets of preforms, which consisted of a jacketing tube, a 6-hole core preform and a 7-hole cladding preform each; and another set of preforms which consisted of a 18-hole preform and a 7-hole cladding preform, using SF57 lead silicate glass. We varied the fabrication technique and die design to study the impact

206 CHAPTER 5 Fabrication of complex structure soft glass HF 181 on the preform/structure quality and ultimately on the SEST fibre loss st experiment on 1-ring-element stacking technique: 1R-SEST Die design Through introducing complex structure into the extrusion die, more complex and intricate structured holey glass preforms can be fabricated. Figure 5.12 shows drawings of the 6-pin-die and 7-pin-die that were used in the 1 st experiment of 1R- SEST fabrication. Note that each 6-pin-die or 7-pin-die consists of 2 parts: the outer nozzle yielding the outer hexagonal shape and the inner core yielding the inner 6- hole or 7-hole structure. Figure 5.12: Drawing of 6-pin-die and 7-pin-die for the 1 st experiment on 1-ringelement stacking 1R-SEST fibre fabrication

207 CHAPTER 5 Fabrication of complex structure soft glass HF 182 Figure 5.13: The schematic drawing for the die and the desirable geometry of the extruded element Figure 5.13 depicts the cross section of the perfectly extruded hexagonal structured element. This is the desirable hexagonal geometry that we would like to fabricate, in order to facilitate the stacking process Extruded element When the glass viscosity is between poise, it can be regarded as being in the viscoelastic flow regime. By applying high pressure (up to 1 ton) onto the glass flow and forcing the melted glass by pressing it through the intricately structured die, complex structured holey preforms can be fabricated. A hexagonal outer shape is chosen for the stacking elements (6,7-holepreform) to minimize the gaps between the elements of the stack and thus to facilitate fusion of the elements without closing the inner holes of the elements. The initial stack jacketing tube also has a hexagonal inner shape to suit the hexagonal outer shape of the stack (see Figure 5.14(c)). We believe that it can facilitate the stacking process and minimizes the gap between jacket and stack. However, with the later trials on stack jacketing tube with circular inner shape (see Figure 5.14(b)), we found that it is unnecessary to have a hexagonal inner jacket, as the gap between the jacketing tube and stacked elements will be collapsed during fibre drawing.

 and complex structures (6,7-hole-preform) that are reasonably good in quality, uniformity and length.")
), while the outer holes of the 7- hole preform were slightly squashed inwards (Figure 5.")
 (b) (c) Figure 5.14: (a) 14cm long of extruded jacketing tube of 12 mm OD/1.")
208 CHAPTER 5 Fabrication of complex structure soft glass HF 183 Figure 5.14 (a) shows the extruded jacketing tube, while Figure 5.15 displays the extruded 6-hole and 7-hole preforms for this first trial. For the complex structures, 6, 7-holes are incorporated within the hexagonally shaped extruded element. As shown in Figure 5.14 and 5.15, this fabrication approach is capable of producing extruded simple structures (jacketing tube) and complex structures (6,7-hole-preform) that are reasonably good in quality, uniformity and length. The hexagonal and circular shapes of the die exits are preserved well in the extruded glass elements. The flats of the hexagons exhibit only a slight convex curvature for extruded 6-hole preform (Figure 5.15(a)), while the outer holes of the 7- hole preform were slightly squashed inwards (Figure 5.15(b)). The high pressure applied during the extrusion process of the 7-hole preform, has resulted in the deformation of the outer pins of the 7-hole die. However, referring to Table 5.3, we noticed that the d, Λ and the ratio d/λ of the extruded elements do not deviate too much from the original die. (a) (b) (c) Figure 5.14: (a) 14cm long of extruded jacketing tube of 12 mm OD/1.8mm ID, (b) cross sectional view of the jacketing tube, (c) jacketing tube with hexagonal inner (a) (b) Figure 5.15: extruded SF57 glass structured preforms (a) 6-hole preform, with hole size of ~ 1.0mm, hole spacing of ~3mm and diameter across the flat of ~9.2mm, (b) 7-hole preform, with hole size of ~ 1mm, hole spacing of ~2.2mm and diameter across the flat of ~9.0mm
209 CHAPTER 5 Fabrication of complex structure soft glass HF 184 Table 5.3: Dimensions of the original die and the extruded preforms Sample d Λ d/λ Die 6-pin 1.0mm 3.17mm pin 1.0mm 3.17mm 0.32 Extruded preform 6-pin 1.0mm 3.0mm pin 1.0mm 2.2mm Caning and structured element stacking After the caning process, we noticed that caning did not alter the curvature of the flats and the original geometry of the extruded element significantly (see Table 5.4). The relative hole size d/λ increases with increasing drawing tension. Thus, at high tension, canes with the same relative hole size as the preform or even higher can be made. In addition, high drawing tension prevents oval distortion of the circular hole. From both hexagonal 6,7-hole preforms, we produced >10m of uniform cane with Λ ~0.35 for the 6-hole cane and Λ ~0.48 for the 7-hole cane. According to the modelling, 1-ring-element-stacking of SEST HF (effectively 4 rings of air holes) would results in a significant confinement loss, ~20dB/m (Section 5.2.4). However, as a test trial, the first stack was made of a 1-ring-element stacking, in order to check the feasibility of producing simple SEST structured HF using SF57 lead silicate glass. This technique is a new fabrication concept that had not been reported elsewhere in the literature at the time when the work was carried out. Before the actual stacking procedure, the stacking element canes (OD = μm 6,7-hole-elements) are cleaved to suitable sizes and fused at one end. Another issue was the size of the stack jacket. Prior to extrusion of the jacket, we observed that jacketing tube of 10 mm OD and 1.8mm ID demonstrate a die swell such that the ID of the extruded glass is slightly smaller than the corresponding die diameters. That is why the stacked elements chosen were not of the same size, which is in between the range of μm across the flats, for obtaining the best tight fit


210 CHAPTER 5 Fabrication of complex structure soft glass HF 185 of the stack inside the jacketing tube (Figure 5.16). The definition of measurement across the flat for both the hexagonal elements is shown in Figure Table 5.4: The dies and the structural features of the extruded elements and canes for 1R-SEST fibre fabrication Sample 6-hole-element 7-hole-element Die Preform Preform Cross section Cane Cross section


211 CHAPTER 5 Fabrication of complex structure soft glass HF 186 Figure 5.16: The stack is tightly fitted inside the jacketing tube. 6-hole-element 7-hole-element Figure 5.17: Definition of measurement across the flat for the hexagonal elements is depicted by the red arrows R-SEST HF For drawing of the stacked preform, we used vacuum and internal pressure similar to the assemblies of WW canes inside jacketing tubes (Section , Figure 4.9). Note that all the structured canes were sealed at a top end by flame treatment. The fusion of each microstructured cane end allows the build-up of pressure inside the canes during necking of the stacked preform, which is crucial to keep the holes open. The use of vacuum enables collapse of the structured canes onto each other and onto the stack jacketing tube and thus enables closing of the interstitial holes between the canes. The first fabricated 1R-SEST HF gave quite promising fibre geometry as shown in Figure All holes were open with reasonable uniformity in the circular shape of the holes. However, we noticed that some holes in the 1R-SEST HF are out


212 CHAPTER 5 Fabrication of complex structure soft glass HF 187 of position. This is because the stacking elements can be rotated due to the gaps/ interstitial holes between the interfaces of stacked elements. Another expected issue of 1R-SEST fibre was the thick bridges formed between the interfaces of the stacks. This resulted from the thick side walls of the 7-hole stacking canes. Figure 5.18: SEM of the 1R-SEST fibre Characterisation Figure 5.19(a) demonstrates an IR image of the far end of the 1R-SEST fibre, when laser pulses at 1558nm were launched into the fibre, showed that the light was not only guided in the core, but there is also a strong guidance evident at the fibre cladding due to the bridges formed between the interface of the stacks. This resulted from the thick side walls of the 6,7-hole stacking canes ( Figure 5.19 (b)). It should be appreciated that the first SEST HF produced was guiding light in the first trial, but unfortunately, the fibre was too lossy to proceed with any further optical properties characterisation, such as loss, nonlinearity and dispersion measurements. We assume that the scattering at the interface between the coreelement and the surrounding cladding-element deteriorates the waveguiding property of the microstructure.


213 CHAPTER 5 Fabrication of complex structure soft glass HF 188 Figure 5.19: (a) IR image of the near-field pattern of 1R-SEST fibre when the light was launched into the fibre (b) SEM of 1R-SEST fibre nd experiment on improved 1-ring-element stacking technique: Improved 1R-SEST Die design From the previous 1R-SEST fibre fabrication, it was obvious that the extruded element side walls were too thick which led to light guidance at the cladding of the fibre due to the bridges formed between the interface of the stacks. From the observations of the extruded hexagonal preforms, a concave form was noticed towards the end of extrusion, this was credited to a reducing glass volume and this was seen to be desirable to facilitate the stacking. Therefore, we tried to change the die skirt diameter, hoping it would enable some control over the volume of the glass extruded throughout the extrusion process. The length of the pins was also reduced from 10mm to 5mm, in order to avoid the pins from deformation when high pressure (>10bar) (1 bar = pascals (Pa)), is applied during the extrusion process. This happened to the 1 st trial of 1R-SEST fibre, as we can see the holes were squashed to the centre. The drawing of the improved die structures is depicted in Figure 5.20.

214 CHAPTER 5 Fabrication of complex structure soft glass HF 189 Figure 5.20: Drawing of 6-pin-die and 7-pin-die for the 2 st experiment on improved 1- ring-element stacking Improved 1R-SEST fibre fabrication Stacking preform A number of modifications were made to this second fabrication experiment to eliminate problems that arose in the previous 1R-SEST fibre attempt. Firstly, we realised that the jacketing tube used for the 1 st experiment was produced via extrusion and die swell was observed. Thus, for a more accurate dimension, the drilling approach was used. Glass is a very fragile and brittle material, so deep drilling into the glass is normally not possible. With the assistance of ultrasonic vibration on a diamondcoated drill, the pressure from the drill onto the glass surface can be largely reduced so that the deep drilling becomes feasible. Here we demonstrated the ultrasonic drilling technique, which is rarely used in the silica HF fabrication, to produce the soft
215 CHAPTER 5 Fabrication of complex structure soft glass HF 190 glass stack jacketing tube. The jacketing tube with 12mmOD /1.8mmID was prepared via ultrasonic drilling by my colleague Dr. Xian Feng. Note that ultrasonic drilling has been successfully used for the production of polymer HFs [10]. (no image available for this jacketing tube as it was lost in the fire at the University of Southampton on the 30 th October 2005) Figure 5.21 displays the extruded 6-hole and 7-hole preforms for the second experiment. These stack preforms are of better quality in terms of the structural geometry and hole position compared to the stack preforms of 1R-SEST. The hexagonal and circular shapes of the die exits are again well preserved in these extruded glass elements. From the Figure 5.21, it is clearly shown that the holes of both Improved 1R-SEST 6-hole and 7-hole preforms are more peripherally placed as compared to the stack preforms of 1R-SEST; where the holes are more centralized (as shown in Figure 5.15). However, the flats of the hexagons exhibit more convex curvature for the stack preforms of Improved 1R-SEST compared to the previous stack preforms of 1R-SEST. (a) (b) Figure 5.21: extruded SF57 glass structured preforms for 2 nd experiment, (a) 6-hole preform (b) 7-hole preform, for Improved 1R-SEST fibre fabrication Caning and stacking From both hexagonal 6, 7-hole preforms, we managed to draw >10m of uniform cane with Λ ~0.52 for the 6-hole core-cane and Λ ~0.46 for the 7-hole cladding cane. Referring to Table 5.5, the hexagonal canes of the Improved 1R-SEST,


216 CHAPTER 5 Fabrication of complex structure soft glass HF 191 which were drawn using high tension, demonstrates a larger relative hole size and less oval distortion of the hole compared with the hexagonal canes of 1R-SEST. The canes of the Improved 1R-SEST also exhibited less variation in hole shape, as caning did not alter the original geometry of the extruded element significantly. Table 5.5: The dies and the structural features of the extruded elements and canes for Improved 1R-SEST fibre fabrication Sample 6-hole-element 7-hole-element Die Preform Preform Cross section Cane Cross section
217 CHAPTER 5 Fabrication of complex structure soft glass HF 192 There was a problem with this stacking process. The drawn cane was too fine ( μm) which increases the complexity in terms of positioning the canes during stacking. Furthermore, the inner OD of the jacketing tube was too large (~1.8mm) for the 1-ring-stack and we could not achieve a tight fit of the stack inside the jacketing tube Improved 1R-SEST HF Similarly to the WW fibre drawing, we fused the end of the structured cane to create internal pressure, and we used a vacuum to obtain collapse of the cane onto the jacketing tube. The cane length was about 160 mm. Note that the negative pressure of the vacuum suction was quite low since we just needed to remove the very tiny holes with the size of at most tens of microns. The considerable improvement in the 1-ring-element SEST fibre is consistent with the clearly longer stacked preform and the tight fit of the stack in the jacket. As a consequence, a higher pressure inside the stack could be generated right after the necking. In addition, we have drawn the cane by hand right after necking and dropping and this drastic increase in drawing tension has resulted in opening of all holes. Note that necking at the beginning of the drawing process always causes fusion of all holes within the neck. In this fibre drawing process, we used a weight to enhance the necking speed. The faster necking and the use of a significantly higher drawing tension (= lower drawing temperature) has indeed resulted in a good microstructure of the Improved 1R-SEST fibre (Figure 5.22). All holes are open and within the cross-section the hole size varies only slightly ( d/λ = 0.1). However, along the fibre, we observed larger variations in hole size ( d/λ ~ 0.3), which are attributed to variations in the drawing tension and temperature. In addition, the pressure inside the air holes decreases with time due to decreasing preform length. The core sizes of the fabricated Improved 1R-SEST HFs ranged between µm and had d/λ values of about 5% more to those in the corresponding cane,


. Table 5.")
218 CHAPTER 5 Fabrication of complex structure soft glass HF 193 which are d/λ ratio of 0.48 in the outer cladding region, and 0.55 in the ring immediately surrounding the core. We planned to further downscale the fibre, but the high drawing tension weakened the fibre robustness, and thus the fibre broke as it was gradually downscaled. From the SEM shown in Figure 5.22, the final draw of the Improved 1R- SEST fibre was significantly improved, although some of the holes of the outer-stack were off position and hence, in a way, this structure might help in lowering the confinement loss of the idealised SEST structure where we predicted to have confinement loss of 20dB/m from the modelling. Figure 5.22: The evolution of the fibre structure from the start to the end of the pull Characterisation Experiments and measurements were performed on 3 different Improved 1R- SEST fibres, with core sizes of 4.2μm, 3.4μm and 2.4μm (denoted HF#1, HF#2 and HF#3 respectively). Table 5.6: Types of Improved 1R-SEST fibre Improved 1R-SEST fibre HF#1 HF#2 HF#3 Core size (μm) To derive a useful core diameter from the hexagonal fibre core shape, we employed the following method. First we determined the 3 diameters across the holes


219 CHAPTER 5 Fabrication of complex structure soft glass HF 194 that fit just inside the hexagonal core region as depicted in figure The diameter of the core is represented by the average of the 3 diameters. Example below is applied on HF#3, and the same approach is used for the HF#1 and HF#2. A1= 2.46μm, A2= 2.72μm, A3=2.51μm and the average core diameter= 2.56μm A1 = 186 A2 = 206 A3 = pixels Figure 5.23: Definition of hexagonal core diameter for SEST HF. Note that the measurements in red are in pixel units and will then be converted into μm Mode profile The modal properties at 1550 nm were calculated for the all SEST HF from stack #2 (HF#1, HF#2 and HF#3) with a hexagonal core diameter of 4.2μm, 3.4μm and 2.4μm respectively using the SEM images of the fibre structure and a commercial Finite Element Method (FEM) modeling package. In Figure 5.24, the predicted mode profile for HF#1 is superimposed on the index profile. Note that the mode profile has a near hexagonal symmetry shape, which underlines that the method used for calculating the core diameter in section is a useful way to represent the core size. Figure 5.25 shows that the simulations demonstrate that all 3 fibres are not strictly single-mode. Indeed, free-space coupling experiments sometimes revealed that the fibre can be made to guide more than one mode.

220 CHAPTER 5 Fabrication of complex structure soft glass HF 195 Figure 5.24: Predicted and near-field profiles of HF#1 Figure 5.25: SEST HF#1 seems to be effectively single mode from the simulation We first studied the spatial mode guidance characteristics of the 3 sample HFs at 1.047μm and 1.55μm. The measured near field mode profiles for all 3 fibres demonstrate a clean single mode with hexagonal symmetry in good agreement with theoretical predictions as demonstrated in Table 5.7. Single-mode propagation can be easily recognized in an experiment by changing the launch conditions, which will only affect the launched power, while the spatial distribution of the light exiting the HFs is fixed. In some cases, strictly singlemode guidance is not required; one can uses effectively single-mode fibres, having a few transverse modes, where however all higher-order modes have relatively high losses. Some bending of the HFs are often used to more efficiently suppress higherorder modes.


221 CHAPTER 5 Fabrication of complex structure soft glass HF 196 Table 5.7: SEM images and IR images of the near-field pattern of various core sizes of improved 1-ring stacked element SEST Fibre Type Core diameter (μm) SEM image Near field image comment HF#1 4.2 Fundamental mode observed : single moded HF#2 3.4 Fundamental mode observed : single moded HF#3 2.4 Fundamental mode observed : single moded Propagation loss As for the WW fibres, the propagation loss of the SEST HFs was measured at 1550 nm using free-space coupling from a laser diode and the cut-back method. Both the SEST HFs and bare fibre losses are listed in Table 5.8. All the SEST fibres have clearly higher losses than the corresponding bare fibres because bare fibres have a much smaller surface/volume ratio and thus slight surface changes are supposed to have negligible impact on the fibre loss. The increase of the fibre loss with decreasing core size for the HF#1, #2 and #3, is consistent with the prediction that the impact of surface imperfections becomes more pronounced as the core size decreases, as shown in Figure 5.26.
222 CHAPTER 5 Fabrication of complex structure soft glass HF 197 Table 5.8: Improved 1R-SEST HFs and bare fibre losses Fibre type Core diameter (μm) Propagation loss at 1550nm (db/m) HF# ±0.5 HF# ±0.5 HF# ±0.3 Bare fibre HF# Loss (db/m) HF#2 3.4 HF#1 3.2 Figure 5.26: The propagation loss at 1550nm vs. the core diameter for Improved 1R- SEST HFs core diameter (μm) The loss of the Improved 1R-SEST HFs is higher than that of the bare fibres by at least 3 db/m (Table 5.8). This suggests that the additional loss in the HFs is due to scattering. The additional scattering is due to surface imperfections (roughness, contamination) at the air/glass interface, which also justifies the increase of the HF loss with decreasing core size. This demonstrates that further improvement in the preform surface quality is a promising route to decrease the losses of HFs down to the bare fibre losses Mode area and Nonlinearity The results on the measurement and modelling of the fibre nonlinearity and effective mode area are summarized in Table 5.9. We next evaluated the effective nonlinear (NL) coefficient γ and the effective mode area at 1550 nm for the 3 SEST HFs using the Boskovich method [11] based on the measurement of the NL phase
223 CHAPTER 5 Fabrication of complex structure soft glass HF 198 induced through self-phase modulation of a continuous wave, dual-frequency, optical beat-signal propagated through the fibre Phase Shift (rad) HF length: 2.2m HF core: 2.4µm (HF#3) γ= 410W -1 km -1 Coupling eff.= 26.25% Input Power (mw) Figure 5.27: Measured nonlinear phase shift as a function of input power for Improved 1R-SEST HF#3 with 2.4µm hexagonal core diameter Effective nonlinearity coefficient (W -1 km -1 ) SF57 WW HF [2] SF57 SEST HF Silica HF Measured HF#1 Measured HF#2 Measured HF#3 Measured WW HF Effective nonlinearity coefficient (W -1 km -1 ) Simulation based on the SEM of the real SEST HF Measured HF#3 Measured HF#2 Measured HF# Core diameter (μm) Core diameter (μm) Figure 5.28: Effective nonlinearity coefficient at 1.55 µm as a function of core diameter with superposed measured data (Note that the SEST curve is calculated for the HF geometry corresponding to the fabricated fibre). In Figure 5.27, the NL phase shift is plotted as a function of the input power. From the slope of the linear fit and taking into account the effective length of the test HF, an average value of the effective NL coefficient was estimated up to 414W -1 km -1 for HF#3. Given the NL refractive index of n 2 = m 2 /W for the SF57 Schott
224 CHAPTER 5 Fabrication of complex structure soft glass HF 199 glass, the measured γ value yields an effective mode area of A eff ~4µm 2 (Equation 2.3). This measured A eff value is in good agreement with the predicted A eff value of 3.1±0.1 µm 2 (see Section 5.4). Our measurements are in excellent agreement with our modelling, which predicts γ values of ~170, 250 and 414 W -1 km -1 for HF#1, #2 and #3 respectively ( see Figure 5.28). Table 5.9: The results on the measurement and modelling of the fibre nonlinearity and effective mode area Optical property HF#1 HF#2 HF#3 γ (W -1 km -1 ) Aeff (µm 2 ) Core diameter (µm) Dispersion The great advantages of SEST HFs, though, can be appreciated when the fibre dispersion is considered. We have performed numerical simulations using a full vector model to calculate the group velocity dispersion (GVD) profiles of the 3 fibres. The model used refractive index profiles based on SEM images of the real fibre structure. In Figure 5.29, we plot the predicted variation of GVD at 1.55μm with different core sizes, alongside a plot of the dispersion profile for our optimised SEST structure, where it is seen that very low values of dispersion can be expected for core diameters of ~4μm. Superimposed on the plot are experimentally determined dispersion values at 1.55μm measured for our samples using a low-coherence spectral interferometry technique [12]. The results are seen to be in very good agreement with our theoretical expectations. In Figure 5.29, we plot the theoretical variation of dispersion with wavelength for our three fibre samples, namely HF#1, HF #2 and #3. HF #2 and #3 are seen to exhibit anomalous GVD throughout the C-band due to an excess of waveguide
225 CHAPTER 5 Fabrication of complex structure soft glass HF 200 dispersion in this region. However, for HF #1 the effects of material and waveguide dispersion oppose each other in such a way that the zero-dispersion wavelength is shifted to the region between nm, as intended from our design calculations. Figure 5.29: Dispersion profiles for the SEST HFs (inset: GVD at 1.55μm as a function of core diameter for the SEST HFs) Dispersion (ps/nm/km) um core, WW HF 1.0 um core, WW HF [4] SF57 bulk glass HF#1 HF#2 HF#3 HF#3 HF#2 HF# Wavelength (um) Figure 5.30: Comparison between the dispersion profile of the WW HF and the fabricated SEST HF design We also plot in Figure 5.30 the theoretical dispersion profiles of several extruded SF57 suspended-core fibres previously fabricated with maximum nonlinearity in mind [3, 4]. The primary ZD wavelength for these fibres lies around 1μm. The figure shows that the SEST designs offer far greater control and flatter dispersion profiles in the 1.55μm region compared to the suspended-core structures
.")

.")
.")
226 CHAPTER 5 Fabrication of complex structure soft glass HF 201 previously fabricated. (Note that it is possible to envisage suspended-core fibres with primary ZD-wavelengths within the C-band however these designs are heavily multimode). The figure also shows the dispersion profile of a theoretical SEST design optimised for flattened dispersion at 1.55μm which highlights the excellent properties that should ultimately be achievable using the SEST approach rd experiment on 2-ring-element stacking technique: 2R-SEST R-SEST fibre The fibre fabrication approach for the 2-ring-element-stacking 2R-SEST HF is similar to the 2 nd experiment, 1-ring-element stacking Improved 1R-SEST HF, but with an additional ring for reducing confinement loss to practical level. For the 6 and 7-hole-stacking elements, we used the canes from the previous pull (2 nd experiment). Start of the pull end of pull Increasing pressure Figure 5.31: The evolution of the fibre structure from the start to the end of the pull. From the stacked preform of 2R-SEST fibre, we obtained fibres with a large variation in hole sizes (Figure 5.31). Some holes were even closed completely, whereas others became very large, but the more crucial part (6-holes for the centre core element), were retained and the deformation was in the 7-hole stacks for the cladding region. This might be due to the temperature gradient inside the preform. In
 of the holes is very small, so the effect of surface tension will be more significant than the air pressure inside the holes.")
227 CHAPTER 5 Fabrication of complex structure soft glass HF 202 addition, the ratio of d/λ (0.48) of the holes is very small, so the effect of surface tension will be more significant than the air pressure inside the holes. The holes in the outer ring of the 7-hole elements can still survive because there are large air gaps between the canes and the jacketing tube, which allows the holes to be able to expand, while there is no room for the holes of the inner ring of the 7-hole elements as it was restricted within the hexagonal canes. We also noticed that some canes had been rotated during the fibre drawing and this had caused the holes to be out of position. One of the possible solutions is by using a 6-hole element with the hole size larger than the 7-hole elements and thus reduce the number of stacking rings. Further details on this solution will be discussed in the later section (Improved 2R-SEST). Figure 5.32: Optical micrograph of the 2R-SEST HF Figure 5.32 displays the image of the 2R-SEST HF taken from the optical microscope. Strong index guiding was clearly observed inside the core region, but unfortunately, due to the structure deformation, the fibre was too lossy to be used practically and therefore, we did not continue with the fibre characterisation th experiment on improved 2-ring-element stacking technique: 2+1 R- SEST Design and modelling Figure 5.33 depicts the design structure of the improved SEST fibre (we named it as 2+1 R-SEST fibre), with a smaller hole size for the central element

228 CHAPTER 5 Fabrication of complex structure soft glass HF 203 compared with the hole size of the outer ring, where we named the diameters as d1 and d2 respectively. With this design, only one ring of stacking elements is needed as there are already 2 rings of holes in the central core element. d1 d2 Figure 5.33: 2+1 R-SEST structure with the labelled parameters, d1 and d2 Improved 1R-SEST 2R-SEST 2+1 R-SEST Figure 5.34: Development of SEST HFs We came up with this idea after several trials and improvements of the SEST fibre. Firstly, we found out that more rings of holes were needed for the 1-ringelement stacking SEST, to reduce the impractically high confinement loss. However, we realised that it is very difficult to stack multi-ring elements, let alone to make sure the holes are in their proper position. Therefore, an alternative design of the improved SEST was needed to provide less labour intensive fabrication, at the same time better optical properties, in terms of nonlinearity, dispersion and confinement loss than the SEST fibres we produced in the previous 3 trials. Figure 5.34 shows the development of the SEST design from trial 1 to trial 4.

229 CHAPTER 5 Fabrication of complex structure soft glass HF 204 Λ = μm Λint = μm d1/λint = d2/λ = Figure 5:35: 2+1 R-SEST design with the optimised parameters Again, the inverse design approach, similar to that previously applied to the optimisation of the SEST HF [7], is employed in order to identify the ideal SEST design which can provide a flat and zero dispersion profile in the C-band, also high nonlinearity and low confinement loss. The structure is described using four parameters: d1, d2, Λ int and Λ, as shown in Figure Figure 5:36: Dispersion profiles and predicted mode profile of the 2+1 R-SEST design Figure 5.36 illustrates some dispersion profiles simulated by varying the values of the 3 mentioned parameters. The idealised dispersion profile has the D <1 ps/nm/km, spanning from 1500nm to 1600nm, where the Λ=2.286μm,


230 CHAPTER 5 Fabrication of complex structure soft glass HF 205 d1/λ int = and d2/λ= The γ value is approaching 464W -1 km -1 at 1550 nm, with the effective mode area of 3.58μm 2, while the confinement loss is predicted to be 0.026dB/m. In short, this structure has offered a very good dispersion curve, with a high nonlinearity and a very low confinement loss which is what we are targeting Die design Figure 5.37 shows the drawing of the 18-pin-die and 7-pin-die that were used in the 4 th experiment of 2+1 R-SEST fibre fabrication. Note that each 18-pin-die or 7-pin-die consists of 2 parts: the outer nozzle yielding the outer hexagonal shape and the inner core yielding the inner 18-hole or 7-hole structure. The pin size of the 7- pin-die was increased from 1mm to 1.5mm, compared to the previously made 7-pindie for 1 st, 2nd and 3 rd experiments. Figure 5.38 depicted the cross section of the perfectly extruded 18-hole hexagonal structured element. This is the desirable hexagonal geometry that we would like to fabricate, as it can facilitate the stacking process but it will be very challenging to extrude an element of more than a ring of holes. (a) (b) Figure 5.37: Drawing of (a) 18-pin-die and (b) 7-pin-die of the 2+1 R-SEST HF
231 CHAPTER 5 Fabrication of complex structure soft glass HF 206 Figure 5.38: The schematic drawing for the die and the desirable geometry of the 18- hole extruded element Extruded preform, caning and structured element stacking Table 5.10 displays the extruded 18-hole and 7-hole preforms. We managed to achieve a reasonably good length and uniformity for the two preforms. Both of the 18, 7-hole extruded preforms exhibited circular outer shape compared to the original hexagonal shape in the dies. From the cross-section view of the preforms, all holes in are in appropriate position and do not deviate too much from the original die. However, the 18-hole preform demonstrated smaller holes than originally expected. This is probably due to extrusion parameters (speed, pressure and temperature) variations. Thus, active control of the extrusion by appropriate die design and correct parameters are needed to allow the fabrication of preform with good structural geometry. Table 5.10 shows the canes for both extruded 18-hole and 7-hole preforms. The 18-hole cane exhibited even smaller relative hole size compared to the original preform although high drawing tension was applied during the caning process. High drawing tension is used to prevent distortion of the circular holes. From both hexagonal 18,7-hole preforms, we produced >10m of uniform cane with the OD range of μm. There were some difficulties in canes stacking due to the circular outer shape of the canes. With the circular outer shape, the canes were more prone to rotate during


232 CHAPTER 5 Fabrication of complex structure soft glass HF 207 the stacking process and this will lead to hole displacement. Table 5.10: The dies and the structural features of the extruded elements and canes for the 2+1 R-SEST design Sample 18-hole-element 7-hole-element Die Preform *Photo is not available Preform Cross section Cane Cross section


233 CHAPTER 5 Fabrication of complex structure soft glass HF R-SEST Fibre Start of the pull end of the pull increasing pressure, higher tension Figure 5.39: The evolution of the 2+1 R-SEST fibre structure from the start to the end of the pull along the whole length The fibre structure was observed after the fibre pulling. From the observation, the evolution of this 2+1 R-SEST fibre is illustrated in Figure All holes are open, except a hole in the inner ring is collapsed. We also observed that the inner holes gradually appear from the 2 nd ring to the 1 st ring within the cross-section, the hole sizes are significantly smaller than the optimised ratios from the modelling. Along the fibre, we also noticed variations in hole size. During the fibre-drawing, the air-filled microstructured cladding will usually be deformed, due to the effects of the of the air pressure inside the air-filled holes, the surface tension of the glass and the temperature gradient in the HF preform. The hole deformation that we have discussed above, are attributed to the variations in the drawing tension and temperature. In addition, a high pressure that builds up inside the air holes can be generated and it will increase with time due to the decreasing preform length, which means the decrease in the internal volume of the air-filled holes. Therefore, we believe that a considerable improvement in fibre structure will be achieved with a significantly longer fibre preform. Moreover, in order to minimize the collapse of the holey cladding when drawing fibres, all the holes in the preform need to be sealed properly before fibredrawing. One of the possible solutions for this problem is to use a 18-hole-element with a larger hole size than the 7-hole-elements. So after some compensation during fibre drawing, the holes around the core can be maintained.


234 CHAPTER 5 Fabrication of complex structure soft glass HF Characterisation Samples of the 2+1 R-SEST fibre was observed under the optical microscope. Using the reflection optical microscope, strong index guiding was clearly observed inside the core region, but due to the fire at the ORC on 30 th October 2005, the drum of these HFs was destroyed and we could not perform further fibre characterization. Therefore, we can only predict the optical properties of the HFs from the available SEM images via simulations. The details of the 2+1 R-SEST HF modelling process discussed in this section were courtesy of Francesco Poletti. Again, in order to study the improved SEST HFs, we employed COMSOL MULTIPHYSICS (COMSOL), a commercial Finite Element Method modeling package, which can accurately represent the large refractive index contrast present in high nonlinear soft glass HFs and a full vector method is required. This model used the refractive index profiles based on the SEM images of the real fibre structure as shown in Figure 5.40(a). The missing inner hole of the real 2+1 R-SEST fibre is included for the simulation purpose as described in Figure 5.40(b)(c). We first investigated the spatial mode guidance characteristic of this HF at 1.55μm. The predicted fundamental mode profile exhibited a near hexagonal symmetry of the fibre core (Figure 5.41 (b)), which looked quite similar to the predicted fundamental mode of the optimized 2+1 R-SEST HF (Figure 5.41(a)), but less confined. The effective mode area and the effective nonlinear coefficient for this fibre at 1.55μm were then evaluated, and predicted values are 15.51μm 2 and 107W - 1 km -1 respectively with the confinement loss of 0.03dB/m (see Figure 5.42). (a) (b) (C) Figure 5.40: (a) SEM image of the 2+1 R-SEST HF with a missing inner hole (b) For the modeling purpose, the missing hole is included in the SEM image (c) The exact fibre structure is defined in black and white
 predicted mode profiles of the exact 2+1 R-SEST HF at 1.")
 as")
235 CHAPTER 5 Fabrication of complex structure soft glass HF 210 (a) (b) Figure 5.41: (a) Predicted mode profile of the optimized 2+1 R-SEST HF at 1.55μm (b) predicted mode profiles of the exact 2+1 R-SEST HF at 1.55μm The great advantages of the 2+1 R-SEST HFs though can be appreciated when the fibre dispersion and mode confinement are considered. We have performed numerical simulations using a full vector model to calculate the basic properties of the fibre such as modal effective area, confinement loss and group velocity dispersion (GVD) as depicted in Figure The fibre exhibits normal GVD throughout the C- band due to insufficient waveguide dispersion to overcome the large material dispersion for SF57 glass in this region. The GVD at 1.55μm is about -40 ps/nm/km at 1550 nm. This is due to the fabricated fibre has larger Λ than the optimized structure (Λ=2.286μm), and this can be clearly seen by plotting the optimized fibre and fabricated fibre in the same scale. Also we can notice that d1/λ int of the holes in the central element is smaller than the optimized structure, which probably generates smaller waveguide dispersion that is required to compensate the large material dispersion (-50 ps/nm/km at 1550nm) and to shift the ZDW to the C-band regime as intended from our design calculation, which eventually leads to the normal GVD. However, this HF shows an improved dispersion profile in terms of the profile steepness compared to the WW HFs.
236 CHAPTER 5 Fabrication of complex structure soft glass HF 211 Figure 5.42: Some basic optical properties of the 2+1 R-SEST HF based on the exact fibre SEM image. The next investigation will be on the variation of fibre size towards the fibre dispersion management. The size of the 2+1 R-SEST fibre was scaled down to 80% and 60% from the original size as shown in Figure 5.43 (a) and (c) respectively. We noticed that since the size reduction of the fibre does not change the d/λ of the inner rings, dispersion remains very similar. The only advantage for the smaller fibres is in a reduced effective area and higher nonlinearity. Larger hole size of the inner rings are needed to provide enough waveguide dispersion to compensate for the material dispersion in order for the fibre to have a ZDW at the C-band region.
237 CHAPTER 5 Fabrication of complex structure soft glass HF 212 (a) (b) (c) (d) Figure 5.43: (a) The size of the 2+1 R-SEST fibre that has been scaled down to 80% (b) Some basic optical properties of the downscaled 80% 2+1 R-SEST fibre (c) The size of the 2+1 R-SEST fibre that has been scaled down to 60% (d) Some basic optical properties of the down scaled 60% 2+1 R-SEST fibre
238 CHAPTER 5 Fabrication of complex structure soft glass HF Conclusion The aim of this project is to develop a new class of highly nonlinear HFs, with better dispersion management characteristics, using Schott SF57 lead silicate glass. The targets for such fibres are high effective nonlinearity, low confinement loss, single-mode or effectively single-mode guidance, near-zero dispersion and flattened dispersion slope at 1550 nm. For many telecommunications applications, a fibre with as low and flat a dispersion profile as possible within the C-band is required. The WW HFs (refer to Chapter 4) that we produced earlier offer very large nonlinearities but allow for only relatively limited dispersion control around 1550nm. It is also noticeable that it will be a challenging task to control the fibre dispersion and at the same time, succeed in shifting the ZDW of the WW HF to longer wavelengths, i.e. 1550nm, due to its very sensitive and steep dispersion profile at that particular wavelength range. We started our initial research of SF57 lead silicate glass HF for highly nonlinear applications in telecommunications by firstly considering the hexagonally CAST and SEST designs. Modelling of the CAST and SEST fibre designs has been conducted and the fibre properties were predicted using a commercial Finite Element Method modeling package. In order to identify fibre designs providing near-zero, flat dispersion at 1550nm, an inverse design procedure similar to that previously applied to the optimization of dispersion-flattened high nonlinearity silica fibres was employed [3,4]. The analysis shows that both CAST and SEST fibre designs can overcome the SF57 material dispersion at 1970nm and provide a flattened dispersion profile at 1550nm regime with D <5 ps/nm/km over a wavelength range spanning >100nm, and a γ value >500W -1 km -1 i.e. about 25% of the maximum possible in SF57 glass, at a reasonably low confinement loss. The CAST and SEST designs with equivalent core size result in similar optical properties, apart from the fact that the SEST design is more advantageous than the CAST design in terms of: 1) reducing the confinement loss, 2) when the scale of the structure is reduced and the cladding extent needs to be enlarged, 3) SEST design fabrication is less labour intensive compared to CAST design fabrication. Therefore, after a consideration of the pros and cons of both the CAST and SEST design with
239 CHAPTER 5 Fabrication of complex structure soft glass HF 214 different aspects of their functionality, the SEST design fabrication was selected. Extrusion has been proven to be a powerful technique to produce glass elements of different shapes. A good understanding of the process parameters and their impact on the extruded glass element dimensions and qualities has been achieved. More investigations and experience are required to determine optimum temperature and pressure, in particular for glass with intricate structures such as SEST performs. In addition, the impact of the different die designs on the geometry of the extruded elements needs to be explored further. A new fabrication approach SEST is introduced. This fabrication technique combines the versatility of capillary stacking with the simplicity of extrusion to allow the production of soft glass HFs with the complex structures required for greater dispersion control in soft glass HFs. We have gained understanding and experience in the fabrication of SEST fibres with an array of small air holes. Compared with the WW canes and fibres, having three larger holes, higher drawing tension is required to prevent collapse of the clearly smaller holes in the stacked canes and fibres. In addition, it is important to have a sufficiently long stacked preform (~150 mm) to allow high internal pressure. We have succeeded in fabricating different types of SEST fibres with a regular array of air holes of similar size. Several trials and improvements of the SEST fibre fabrication were performed. Firstly, we found out that more rings of holes are needed for the 1-ring-element stacking SEST, to reduce the impractically high confinement loss, but it is very difficult to stack multi-ring elements and, at the same time, make sure the holes are in their proper position. Thus, an alternative design of the improved SEST ( 2+1 R-SEST) was made to provide less labour intensive fabrication. It is also predicted to offer better optical properties, in terms of nonlinearity, dispersion slope and confinement loss at wavelengths centred around 1.55μm, than the SEST fibres we produced in the previous 3 trials. In short, we have successfully fabricated high-nonlinearity, effectively single mode, lead-silicate HFs with ZDWs around 1.55 µm using a new fabrication approach SEST. We demonstrated the fabrication of an SF57 SEST fibre with a ZDW within the C-band, a 3.2 db/m loss, and a γ value of 170 W -1 km -1. The measured properties of these fibres are shown to be in good agreement with the theoretical expectations.
240 CHAPTER 5 Fabrication of complex structure soft glass HF 215 Further enhancement of the dispersion flatness, nonlinearity and loss of SEST HFs is anticipated in the near future with the optimised SEST structure.
241 CHAPTER 5 Fabrication of complex structure soft glass HF References 1. P. Petropoulos, T.M. Monro, H. Ebendorff-Heidepriem, K. Frampton, R.C. Moore, and D.J. Richardson, Highly nonlinear and anomalously dispersive lead silicate glass holey fibres, Opt. Express 11, (2003). 2. H. Ebendorff-Heidepriem, P. Petropoulos, R. Moore, K. Frampton, D. J. Richardson, and T. M. Monro, "Fabrication and optical properties of lead silicate glass holey fibres" J. Non-Crystalline Solids , (2004). 3. J.Y.Y.Leong, P.Petropoulos, S.Asimakis, H.Ebendorff-Heidepriem, R.C.Moore, K.Frampton, V.Finazzi, X.Feng, J.H.V.Price, T.M.Monro, D.J.Richardson, A lead silicate holey with y=1860 W -1 km -1 at 1550 nm, OFC 2005 Anaheim 6-11 Mar 2005 PDP22 (Postdeadline). 4. J.Y.Y.Leong, P.Petropoulos, J.H.V.Price, H.Ebendorff-Heidepriem, S.Asimakis, R.Moore, K.Frampton, V.Finazzi, X.Feng, T.M.Monro, D.J.Richardson, High nonlinearity dispersion-shifted lead-silicate holey fibres for efficient 1 micron pumped supercontinuum generation, Journal of Lightwave Technology 24, pp (2006). 5. J.Y.Y.Leong, H.Ebendorff-Heidepriem, S.Asimakis, P.Petropoulos, V.Finazzi, D.J.Richardson, T.M.Monro, Development of Highly Nonlinear Extruded Lead Silicate Holey, Advances in Glass and Optical Materials: Proceedings of the 107th Annual Meeting of The American Ceramic Society, Baltimore, Maryland, USA 2005, Ceramic Transactions, Volume 173, pp1-9 (2006). 6. T. M. Monro, D. J. Richardson, N. G. R. Broderick, and P. J. Bennett, "Holey optical fibres: An efficient modal model," J. Lightwave Technol. 17, (1999). 7. F. Poletti, V. Finazzi, T. M. Monro, N. G. R. Broderick, V. Tse, and D. J. Richardson, "Inverse design and fabrication tolerances of ultra-flattened dispersion holey fibres," Opt. Express 13, (2005). 8. V.Finazzi, T. M. Monro and D. J. Richardson, Small-core silica holey fibres: nonlinearity and confinement loss trade-offs, J. Opt. Soc. Am. B 20, (2003). 9. K. Saitoh, M. Koshiba, T. Hasegawa and E. Sasaoka, Chromatic dispersion control in photonic crystal fibres: application to ultra-flattened dispersion, Opt. Express 11, (2003).
242 CHAPTER 5 Fabrication of complex structure soft glass HF M. A. van Eijkelenborg, M. C. J. Large, A. Argyros, J. Zagari, S. Manos, N. A. Issa, I. Bassett, S. Fleming, R. C. McPhedran, C. M. de Sterke and N. A. P. Nicorovici, Microstructured Polymer Optical Fibre, Opt. Express 9, (2001). 11. A. Boskovich, S.V. Chernikov, J.R. Taylor, L. Gruner-Nielsen, and O.A. Levring, Direct continuous-wave measurement of n 2 in various types of telecommunication fibre at 1.55 µm, Opt. Lett. 21, (1996). 12. L. G. Cohen, Comparison of Single-Mode Fibre Dispersion Measurement Techniques, Journal of Lightwave Technology LT-3, pp (1985).
243 CHAPTER 6 Non-silica glass high-nonlinearity dispersion-shifted HFs for efficient supercontinuum generation 6.1 Introduction One of the unique properties of lasers is that they are monochromatic. This means that lasers emit coherent light at only a single wavelength (over a narrow wavelength range). Lasers are also exceptionally bright when compared to thermal white light sources. This is because a large amount of power is not only concentrated in a small spectral window but can also be focused tightly onto a small area. However, white light sources have attracted great interest despite their low brightness. Their broad and smooth spectrum, and low temporal coherence have made them very useful in a wide range of applications. Supercontinuum (SC) is a new type of light source that provides a combination of the desirable features of both laser and white light: (a) high output power, (b) a broad and flat spectrum, which can span more than 2 octaves in frequency, and (c) a high degree of spatial coherence that allows tight focusing [1]. In other words, a SC source is a coherent white light. SC generation was first observed in 1970 by Alfano and Shapiro, by focusing powerful picosecond pulses in bulk borosilicate glass [2]. Similar broadening was observed in H 2 O and D 2 O in 1977 [3] and in a jet of gaseous ethylene glycol in 1983 [4]. It is essentially a nonlinear phenomenon and a product of the synergy between several fundamental nonlinear processes, of which the most important are self phase modulation (SPM), four wave mixing (FWM) and stimulated Raman scattering (SRS). The interplay between these different nonlinear effects affects the SC properties such as extends of spectral broadening, homogeneity and coherence. With the introduction of ultrafast lasers which provide picosecond pulses operating at the telecommunication wavelengths at 1310 nm and 1550 nm, SC
244 CHAPTER 6 Non-silica glass high-nonlinearity dispersion-shifted HFs for efficient supercontinuum generation 219 generation was achieved in a conventional SMF in 1987 [5]. After that, several fibre designs have been proposed to enhance the generated spectral bandwidth. For example, by decreasing the dispersion along the fibre at the telecommunication wavelengths, a bandwidth of a few hundred nanometers was obtained [6]. In the 90 s, MOFs or HFs were invented, providing new opportunities in the field of SC generation by virtue of their unique nonlinear and dispersive properties. The study of SC generation in HFs is currently a topic of great interest since HFs first enabled visible SC generation using seed pulses input directly from a Ti:Sapphire oscillator as shown by Ranka et al. [7] in The attention arose because of the unique properties of this remarkable spectral broadening in HFs, such as low energies and comparatively big input-pulse durations, its coherence, and high spatial brightness as well as SM operation; also because of capability of pumping at ~780nm from established fs-sources such as a Ti:sapphire laser. Figure 6.1 shows the comparison of the power spectral density of various fibre-coupled broadband sources: (a) ASE source, (b) Incandescent lamp (thermal white light), (c) HF-based SC source and, (d) SLEDs. When compared to the thermal white light source, the SC source covers a comparable spectral range, but is typically thousands of times brighter, providing a signal-to-noise advantage of db in many applications [1]. For the ASE source based on Rare Earth doped fibre, it is comparable in total output power with the SC source, but its output spectrum is narrower, and it is limited to wavelengths for which suitable dopant/host combinations are available. In short, SC combines both high brightness and broad spectral coverage, a combination offered by no other technologies. Due to these special properties, SC in HFs has shown very promising potential for the development of applications such as frequency metrology [8], optical coherence tomography [9, 10], novel light sources and, spectroscopy [11,12]. The use of HFs is also particularly attractive for efficient generation of SC radiation due to the large degree of design freedom which makes it possible to enhance the nonlinear effects by reduction of their effective area and to tailor their dispersion in order to favour soliton generation or phase-matched processes in the wavelength range of interest. For example, in the visible and near IR, applications for these sources include optical frequency metrology and optical tomography. Other applications for a broadband continuum exist for wavelengths beyond 2 µm, i.e.
245 CHAPTER 6 Non-silica glass high-nonlinearity dispersion-shifted HFs for efficient supercontinuum generation 220 LIDAR applications in the 3-12 µm wavelength range [13]. Intensity (dbm) Figure 6.1: Comparison of the power spectral density delivered into a SMF for various broadband light sources: ASE-source, incandescent lamp, SC source and SLEDs (this figure was extracted from [1]) SC generation can be observed in a drop of water, provided enough power is available, but the nonlinear effects involved in the spectral broadening are highly dependent on the dispersion of the media and clever dispersion design can significantly reduce power requirements. Despite the capability of these HFs to offer effective nonlinearities, that exceed by far what can normally be achieved by using conventional fibre technology, SC generation can become more efficient when the fibre is pumped at wavelengths near to its ZDW. Because of the extreme waveguiding conditions of the highly nonlinear HFs, it is possible to alter the magnitude and slope of their dispersion profile by suitable modification of the fibre design (as described previously in Chapter 4 for the WW HFs and Chapter 5 for the SEST HFs). Shifting the ZDW of a nonlinear HF to a region where there are convenient laser sources available enhances the efficiency and practicality of the SC generation process. Table 6.1 is a very simple guideline valid for femtosecond pumping, when selecting a fibre/pump combination for SC generation. The widest spectra are obtained when the pump pulse is launched close to the ZDW of the nonlinear media.
246 CHAPTER 6 Non-silica glass high-nonlinearity dispersion-shifted HFs for efficient supercontinuum generation 221 Table 6.1: list of selection for fibre/pump combination for SC generation Pumping wavelength (λ pump ) Output spectrum < ZDW Stable, smooth and narrow spectrum = ZDW Irregular, medium-wide and with a dip at the ZDW > ZDW Irregular and wide spectrum It is interesting to consider alternative glasses for the generation of broadband radiation due to the limitation of silica at certain wavelengths, e.g. material dispersion and material nonlinearity. The fundamental material properties of non-silica soft glasses can enhance SC generation across the visible to mid-ir. By suitable control of the fibre transverse structure, and material choice, it is possible to envisage fibre designs with nonlinearities that are tailorable over orders of magnitude, at the same time obtaining suitable dispersion properties, which is often of greater importance for many nonlinear devices for telecommunications applications. The high index contrast between air and glass allows for extreme values of waveguide dispersion and this can be used to control the large material dispersion associated with soft glasses at wavelengths of interest in the near IR i.e. at 1550nm for telecommunications, or around 1060nm for incorporation within Yb-doped fibre based devices. Up till now, soft glasses have not yet found widespread application due to the difficulty in fabricating low-loss single mode fibres. However, HF technology provides a powerful new technique for producing soft glass structures. Recent work at the University of Southampton has led to successful fabrication of the first soft glass HFs [14]. Investigations of the fibres non-linear and dispersive properties will help establish their suitability, or otherwise, as temporally agile, frequency selective sources. For instance, both SF57 glass WW HF with γ=1860 / (W.km) [15] (More details can be found in Chapter 4) and SF57 glass SEST HF [16] (More details can be found in Chapter 5) were reported recently. In silica glass HFs, it is possible to achieve anomalous dispersion at visible wavelengths, i.e. at wavelengths much shorter than the material zero dispersion wavelength, allowing soliton formation at wavelengths shorter than 600nm [17]. Similar benefits in terms of controlling the dispersion properties of fibres at wavelengths of technological interest can be obtained in soft glass HFs. The material
247 CHAPTER 6 Non-silica glass high-nonlinearity dispersion-shifted HFs for efficient supercontinuum generation 222 ZDW for SF57 glass is ~1.97 μm but as we have shown in the previous chapters, it is possible to use the large waveguide dispersion available in SF57 HFs to obtain fibres with ZDWs shifted by more than 1000nm to allow efficient SC generation when pumped at wavelengths around 1μm and 1.55 μm. SC generation depends on the fibre characteristics over a broad range of wavelengths, so complex dispersion profiles, for example with two ZDWs, can also be envisaged as suggested by other authors [18]. For this initial practical demonstration, we have considered a single ZDW for WW HFs measurement and this has practical significance as it reduces the pulse energies required for the initial stages of SC generation down to the 100pJ regime a pulse energy regime that can readily be accessed directly from mode-locked Yb-doped fibre laser cavities. This should lead to the development of truly compact and practical SC sources for metrological applications. To date the majority of work on SC generation has used nj pulses from bulky and expensive Ti-Sapphire laser systems which has restricted widespread deployment of the technology. The objective of my PhD was to explore the limits of nonlinearity and dispersion control in SF57 lead-silicate based HFs. My focus has been both on establishing the maximum nonlinearity that can be achieved in these fibres at telecommunications wavelengths, and to develop high nonlinearity fibres with dispersion-shifted characteristics suitable for SC generation applications at 1.06 μm and 1.55μm. This chapter is devoted to the SC studies we carried out using the two types of fibres produced (WW HFs (Chapter 4) and SEST HFs (Chapter 5)). We present both experiments and numerical simulations and discuss how the properties of each of the fibres affected the broadened spectra. Both of these studies combined experimental and numerical results, and the simulations and experiments were in qualitative agreement. 6.2 Numerical model of the SC simulations Numerical simulations were performed to assist us in interpreting the results and to gain a better understanding of our SC generation data. This simulation work was preformed by Dr. Jonathan Price on the WW HFs discussed in Chapter 4, with
248 CHAPTER 6 Non-silica glass high-nonlinearity dispersion-shifted HFs for efficient supercontinuum generation 223 the fibre properties details provided by myself. As with silica, we have assumed that the amorphous multicomponent glass that I used (i.e. SF57 glass), is centro-symmetric, and has a homogeneous third order (3) nonlinear susceptibility ( χ ), which is small compared to the linear susceptibility, and is also wavelength independent over the wavelength range considered. The total refractive index therefore includes a small intensity dependent nonlinear contribution: ( n n I ) n =. The model used to simulate pulse propagation includes both the instantaneous electronic response (responsible for the Kerr effect), and the delayed ionic response (responsible for Raman and Brillouin scattering) in the nonlinear component of the refractive index, n 2. As is usual when modelling silica fibres, the nonlinear response to the applied field, ( z, t) A, has been written as R( t) ( 1 f ) ( t) f h( t) = δ, where R + the δ -function represents the instantaneous electronic response, h (t) represents the delayed Raman response of the ions and f R represents the fractional contribution of the delayed Raman response governed by h (t). The optical amplitude A ( z, t) will be changed according to: + t i 2 Δ A ( z, t) = iγ 1+ A( z, t) R( t') A( z, t t') dt', where ( n ω 0 t 2ω0 ca eff ) R γ =. 6.1 For silica, the Raman temporal response has been previously determined from the shape of the Raman gain in the frequency domain [19], and the Raman fraction of the total nonlinearity was determined to be 0.18 from measurements of the absolute value of the Raman gain. We are not aware of any previous measurements of the delayed temporal response or absolute Raman gain for SF57, and we have calculated the temporal response from uncalibrated spontaneous Raman spectra following the procedure used for silica by Stolen et al. [20]. For SF57 we assumed the Raman fraction of the total nonlinearity to be f R = 0.2, based on the known fraction of 0.18 for silica. As far as we are aware, this is the first time that non-silica Raman responses have been included in numerical SC simulations. Effects such as two photon absorption, have not been included, and we have
249 CHAPTER 6 Non-silica glass high-nonlinearity dispersion-shifted HFs for efficient supercontinuum generation 224 considered a single polarization only, and processes occurring within the fundamental fibre mode, and not mode-mixing to possible higher order modes. These simplifications enable modelling of the pulse-propagation using the modified nonlinear Schrödinger equation (NLSE) [21], with loss, as shown below, and as used previously for SC simulations [22-24]. A i z k k i βk A α( ω) + A = iγ 1+ k k! t 2 k 2 ω 0 i A( z, t) t + t R( t' ) A( z, t t') 2 dt', 6.2 where A = A( z, t) is the electric field envelope, β k are the dispersion coefficients at the centre frequency ω 0, α (ω ) is the frequency dependent fibre loss. The full wavelength dependent loss and dispersion profile of the fibre was included as shown in Chapter 4. We used the A eff data from Chapter 4 as calculated at the seed pulse wavelength. To solve the propagation equation, we used a standard split-step Fourier algorithm treating dispersion in the frequency domain and the nonlinearity in the time domain, apart from the temporal derivative for the self-steepening effect, which was evaluated using Fourier transforms. Our simulation results show the expected fine structuring [21] and the Fourier transform of the time-separated pulses causes high frequency modulation on the spectrum (fine structuring). Very small variations in the seed-pulse lead to small changes in the wavelengths of the peaks and dips so they are only observed in a single-shot measurement whereas a time-averaged measurement would show the smoothed out average spectrum. Here, we have applied a rolling average to smooth the spectra, which should be approximately comparable to the time average over several pulses that was measured in the experiments and is computationally straightforward since it does not require repeated simulations with slight variations of the input pulse and which would be necessary for a detailed study of the noise properties of the SC. We believe that given the uncertainties of the exact characteristics of the fibre, and the generally good agreement with the experimental data, the simulations provide a strong indication that the fibre performance may be understood based on the simulated dispersion profiles and nonlinearity. The simulated seed pulse was a transform limited 300 fs (FWHM) Gaussian profile at µm.
250 CHAPTER 6 Non-silica glass high-nonlinearity dispersion-shifted HFs for efficient supercontinuum generation Experiment setup Several issues regarding pulse distortion must be addressed when coupling light from a femtosecond (fs) laser into a HF, in order to achieve the optimum performance. In this section, we will discuss the experimental procedures and briefly discuss the operation principles of the components used in the experimental setup, together with the precautions that should be taken to couple light from a fs laser into a small-core HF. The considerations discussed here are applicable to free-space setups. Figure 6.2 shows a schematic overview of a typical setup. Figure 6.2: Schematic drawing of a typical experimental setup for SC generation using a femtosecond source and a short piece of highly nonlinear and dispersion tailored HF. First, the supercontinuum was generated by launching fs pulses from a tunable mode-locked fs laser into a highly nonlinear HF (WW/SEST HF) as shown in Table 6.2. The light was coupled into the fibre using standard microscope objectives with a high numerical aperture. An optical isolator was placed after the laser to prevent back reflections. The polarization state of the input pump pulses was controlled with a halfwave plate inserted after the isolator. A telescope composed of two lenses was added between the half-wave plate and the coupling lens to reduce the size of the diffractionlimited spot formed after the coupling lens. With this system, a coupling efficiency of 20 % can be obtained. The spectrum of pulses after propagation through the HF was recorded using an optical spectrum analyzer (OSA). The power measurements were performed utilizing the spectrum analyzer and a power meter.
251 CHAPTER 6 Non-silica glass high-nonlinearity dispersion-shifted HFs for efficient supercontinuum generation 226 A. Laser source Two types of fs lasers were used in the SC experiment. A mode-locked Nd:glass laser and the Coherent Mira laser were used as sources of short and intense pulses for SC generation in WW HF and SEST HF respectively. The Nd:glass laser produces Gaussian pulses with a duration of the order of 200fs, at a repetition rate of 80 MHz while the Coherent Mira laser produces 100fs pulses with a repetition rate of 250KHz. Table 6.2: Parameters of the fs pump sources used in this study Operating wavelength (μm) Femtosecond source Pulse width (fs) Repetition rate (MHz) Average output power (mw) ~1.06 Nd:glass ~100 ~1.53 Coherent Mira laser ~500 B. Coupling system i. Optical isolator Lasers are very sensitive to optical feedback. Optical feedback can strongly affect the performance of the laser under mode-locked operation. The first issue to be addressed is the reflection from the fibre surface, which can lead to a distortion of the pulse train and, in severe cases, stop the laser from modelocking. In conventional fibre, back reflections can be minimized by cleaving the fibre at an angle, but this is very difficult for soft glass HFs. Thus, it is recommended to avoid this problem by using an isolator. An optical isolator was placed after the laser output facet to reduce the effect of unwanted optical feedback. Its operation is based on a Faraday rotator, which turns the polarization state of input beam by 45 0 [25]. Two polarizing plates located at the input and output of the isolator can be adjusted to allow maximum intensity transmittance. The direction of polarization of a beam reflected back to the isolator rotates by Consequently, the direction of polarization of this reflected beam is perpendicular to the optical axis of the input polarizing plate of the isolator, which therefore blocks the beam.
 plate Due to the birefringence of most HFs, especially the highly nonlinear small core HFs, the polarization axis of the linearly polarized fs pulses should coincide with one of the")
252 CHAPTER 6 Non-silica glass high-nonlinearity dispersion-shifted HFs for efficient supercontinuum generation 227 ii. Half wave (λ/2) plate Due to the birefringence of most HFs, especially the highly nonlinear small core HFs, the polarization axis of the linearly polarized fs pulses should coincide with one of the principal axes in the fibre. A half-wave plate allows for controlling the polarization of a beam without varying the power. The relative orientation of the axes can be controlled by a λ/2 plate. To find the principal axes, the polarization state of the output is measured and the λ/2 plate/fibre is rotated until the output is linearly polarized. iii. Telescope and lens The fs pulses can be easily coupled into the HFs through standard microscope objectives. Magnifications of x40 and x60 provide good results. To maximize the coupling efficiency, the spot size of the laser beam at the focus of the coupling lens should match the size of the fibre core and this can be achieved with a standard telescope. iv. Translation stage Nonlinear effects are very sensitive to any variations in the input power, thus a very stable mounting platform is needed. The HF was attached to an XYZ-translator using a fibre clamp. The 60-nm resolution of the stage allows precise positioning of the tip of the fibre towards the focus of the coupling lens. Our HFs have a very fine core and thus require critical alignment, which is difficult to maintain over an extended period of time due to thermal, acoustic and other unwanted effects. To avoid any oscillation of the fibre tip due to these effects, less than 1 mm of the fibre was left over the edge of the fibre clamp. Further stability can be achieved by taping the fibre to the mount. Figure 6.3: Thorlabs 3-axis Microblock Flexure stage [26]
253 CHAPTER 6 Non-silica glass high-nonlinearity dispersion-shifted HFs for efficient supercontinuum generation Results and discussion The determining factors for generation of supercontinua are the dispersion of the HFs relative to the certain pumping wavelengths, the pulse length and the peak power. The dispersion, especially the sign and the slope of the dispersion, is critical in establishing the type of nonlinear effects participating in the formation of the broadening spectra, and eventually for the nature of the spectrum in terms of spectral shape and stability. This is a study of visible/nir SC from our extruded highly nonlinear SF57 HFs. The fundamental material properties of non-silica soft glasses can enhance SC generation across the visible to mid-ir. The ZDWs of these highly nonlinear, lead silicate HFs are designed to be shifted to the regions of 1.06 μm and 1.55μm, as there are convenient laser sources available, which can enhance the efficiency of the SC generation process. We have successfully developed the high nonlinearity WW HFs (Chapter 4) and SEST HFs (Chapter 5), with dispersion-shifted characteristics suited for SC generation applications at both 1.06 μm and 1.55μm respectively. For the SC in the visible and near IR region (WW HFs with ZDW of 1.06 μm), applications include optical frequency metrology and optical tomography. Other applications for a broadband continuum exist for C-band wavelengths (SEST HFs with ZDW of 1.55 μm), i.e. nonlinear devices for telecommunications applications. The evolution of the pump pulse spectrum into a SC, by launching fs pulses of just a few tens of pj energy in a <1m piece of our fabricated lead silicate glass fibres, is studied by gradually increasing the pump pulse power. In addition, the effects of pump wavelength with respect to the zero dispersion wavelength, polarization, and fibre length on the generated SC are also investigated. In this section, the measurement results are presented. Furthermore, numerical analysis compared with the measurement data of the SC generation in both WW HFs and SEST HFs is discussed. This study with the combination of both experimental and simulation were in qualitative agreement. An ultra-broad SC is generated by optimizing the pump-pulse parameters.
254 CHAPTER 6 Non-silica glass high-nonlinearity dispersion-shifted HFs for efficient supercontinuum generation SF57 WW HFs with ZDW at 1.06 μm The primary ZDW for the previously discussed WW HFs lies around 1μm. Here, we describe our SC studies at 1.06 µm using the two SF57 WW HFs named Fibre#1 and Fibre#2, as described in Chapter 4 (Figure 6.4 and Table 6.3). We first present our SC generation experiments which yielded spectra spanning over one octave and extending into both NIR and the visible regions of the spectrum. Next, the results of the simulations are compared with our experimental results. We also consider simulation results for fibres with different core sizes, and conclude by suggesting promising combinations of pump wavelengths and fibre designs for continuum applications using SF57 HFs. (a) (b) Figure 6.4: (a) SEM image of the small core extruded WW HF, Fibre#1 with a core diameter of ~0.95 μm and the enclosed area is the diameter of the circle that fits just inside the core region. (b) Measured mode profile for the HF with a core diameter of ~0.95 μm at 1040nm

255 CHAPTER 6 Non-silica glass high-nonlinearity dispersion-shifted HFs for efficient supercontinuum generation 230 Table 6.3: List of WW HFs used for the SC generation experiment with pumping wavelength at ~1.06μm WW Fibre Physical properties Optical properties Fibre#1 1. fibre core diameter = ~0.95 μm 2. fibre length = 60cm 1. loss = ~2.50dB/m 2. nonlinearity, γ =1860 W -1 km ZDW= ~945nm Fibre#2 1. fibre core diameter = ~1.3 μm 2. fibre length = 6.8cm 1. loss = ~2.62dB/m 2. nonlinearity, γ = 600 W -1 km ZDW = ~1060nm SC experiment At present we have no ready way to measure the dispersion profile of short lengths of our fibres around 1 μm, so we rely on our spectral broadening/sc experiments to confirm that these HFs have a low dispersion in the 1 μm range. For our SC generation experiments, we used a diode-pumped, mode-locked Nd:glass laser operating at 1.06μm as a pump source. This laser generated 200fs transform-limited pulses at a repetition rate of 80 MHz with an average output power of 100mW corresponding to a peak power of 4.17kW at ~1.05 μm. Thus, we were able to launch pulses with energies of up to ~250 pj into short lengths of the two fibres. Typical measured launch efficiencies into the fundamental mode were 15-20% for these experiments depending on the specific fibre/coupling lens choice. The effect of pump pulse power is studied by gradually increasing pump pulse power and monitoring changes in the spectrum transmitted through the HFs. The input light polarization is set to match the direction of one of the principle axes of the HFs. The input power is varied by rotating a λ/2 state at the input polarizer of the
256 CHAPTER 6 Non-silica glass high-nonlinearity dispersion-shifted HFs for efficient supercontinuum generation 231 optical isolator. When the input power is increased, the pulse rapidly evolves into a higher-order soliton. The degeneracy of the higher-order soliton is lifted due to Raman scattering, resulting in soliton decay dividing it into fundamental solitons, as discussed in Section 6.2. After the decay, each of the fundamental solitons experiences a SSFS while propagating. This sequence of events is recorded using the optical spectrum analyzer and is shown in Figure 6.6 when the pump pulse power is gradually increased. The pulses were first launched into ~60 cm of Fibre#1 (~0.95µm core). Figure 6.6 illustrates the spectra obtained at various launched powers. For modest power levels (launched pulse energies below ~20 pj), we saw clear evidence of Raman soliton formation, an indication that this HF has anomalous dispersion at the wavelength of operation. However, the presence of four-wave mixing (FWM) and the generation of new components at shorter wavelengths relative to the pump is an indication that the ZDW is close to the predicted wavelengths. As we increased the power further, the spectral extent of the newly generated frequencies became broader (extended mainly towards the longer wavelength side) and the spectrum became smoother. In the measurements, the role of FWM is important in the last phases of SC generation. With high pump power levels, the Raman shifted solitons generate sidebands filling the empty spaces in the red part of the spectrum, as seen in Figure 6.6. The filling of the gaps between the solitons begins with the solitons closest to ZDW. At higher pulse energies (~100 pj) the spectral components in the HF spanned more than one octave and extended significantly into the near IR/visible wavelength regions of the spectrum. We achieved a spectral broadening in excess of 1000 nm for launched pulse energies as low as ~100pJ. Any further increase of the pump power does not result in an increase of the bandwidth in the infrared indicating a limit for the process. When comparing the absorption spectrum of the fibre (Figure 6.5(a)) with the recorded spectrum (Figure 6.6), it can be seen that the limit in the spectral bandwidth is caused by the peak in the absorption spectrum due to OH-molecular resonances at around 1440nm. Note that we also investigated the sensitivity of the SC process to input pulse polarization but found the shape of the output SC spectrum to be relatively insensitive to this. We next experimented with a short length (~6.8 cm) of Fibre#2 with a larger
257 CHAPTER 6 Non-silica glass high-nonlinearity dispersion-shifted HFs for efficient supercontinuum generation 232 core diameter of ~1.30 μm. In Figure 6.7, we see that the SC generation properties of this fibre are quite different to Fibre#1. Although the overall spectral broadening is not as strong (a bandwidth of ~700 nm is observed in this case), broadening (at least up to certain power levels) occurred much more symmetrically than in Fibre#1. However, for pulse energy levels higher than 178pJ, spectral broadening was again more significant at longer rather than shorter wavelengths. This shows that the wavelength of the fs pulses is close to the fibre ZDW, and lies slightly within the normal dispersion regime. Self phase modulation dominates with raman scattering broadening to the long wavelength side. The output spectrum looks reasonably smooth and stable, and it is well suited for pulse compression or optical coherence tomography (OCT). Loss (db/m) (a) ~1.3μm core bare fibre Effective nonlinearity coefficient (W -1 km -1 ) (b) predicted at 1.06μm predicted at 1.55μm Wavelength(nm) Core diameter (μm) Fibre#1 Fibre#2 SF57 bulk glass Dispersion (ps/nm/km) (c) Wavelength (um) Figure 6.5: Optical properties of the WW HFs, Fibre#1 and Fibre #2: (a) spectral propagation loss for Fibre#1, spot loss measurement is conducted for Fibre #2, 2.5dB/m at 1550nm, (b) fibre effective nonlinearity at 1060nm and 1550nm and (c) dispersion.
258 CHAPTER 6 Non-silica glass high-nonlinearity dispersion-shifted HFs for efficient supercontinuum generation 233 Figure 6.6: Simulated and experimental optical spectrum at the output of the supercontinuum generation system for Fibre#1 Intensity (dbm) Simulation_90pJ Simulation_220pJ 232pJ 178pJ 124pJ 1.2pJ Wavelength (nm) Figure 6.7: Simulated and experimental optical spectrum at the output of the supercontinumm generation system for Fibre #2.
259 CHAPTER 6 Non-silica glass high-nonlinearity dispersion-shifted HFs for efficient supercontinuum generation Comparison of simulations and experimental results SC generation depends on the interplay between the seed pulse parameters (pulse width, repetition rate and operation wavelength), fibre length, dispersion, nonlinearity and loss. Considering the short lengths of fibre used in these experiments, we believe that the loss did not strongly influence the spectra, except possibly at wavelengths below ~500 nm where the absorption is strong (Refer to the loss spectrum of SF57 WW HF in Figure 6.5(a)). Furthermore, comparing fibres with different core sizes, the difference in nonlinearity parameter varied with effective mode area and, therefore, showed only a modest variation (Figure 6.5(b)). In addition, the width of the SC spectrum saturates after a threshold propagation distance along the fibres [24]. Therefore, the dispersion has the strongest influence on the shape of the continuum. The 0.95 µm core fibre, Fibre#1 has a ZDW of ~945 nm, so the dispersion is anomalous at the pump wavelength. Figure 6.6 shows the experimental spectrum from the fibre, and there is clear evidence of the soliton-self-frequency shift (SSFS) transferring energy to longer wavelengths due to Raman gain, together with a dip in the spectrum close to the ZDW, and a low power short wavelength spectral peak. Comparing simulation results with the data, there is reasonable agreement with the overall shape of the spectra. Slight differences are that the short wavelength peak is sharper in the simulation and that on the long wavelength side the individual Raman solitons have not merged to a flat continuum. We suggest that the flatter experimental spectrum may well be due to time averaging of several input pulses with a slight energy jitter although we unfortunately did not measure the amplitude jitter of the launched pulses source during these experiments and are thus unable to substantiate this comment further. Furthermore, small differences between the simulated and the exact dispersion profile could change the position and shape of the short-wavelength peak, and also influence the soliton fission process thus influencing the longer wavelength spectral shape. Such differences are to be expected since the calculated dispersion profiles shown in Figure 6.8 are for fibres with core sizes in 0.1 µm increments, and a finer grid should enable closer agreement. We believe that the relatively high intensity at the pump wavelength in the experimental spectrum is due to some residual power guided along the cladding of this uncoated fibre, which, due to
260 CHAPTER 6 Non-silica glass high-nonlinearity dispersion-shifted HFs for efficient supercontinuum generation 235 the larger cladding area, is not broadened by nonlinear effects. Dispersion (ps/nm/km) um 0.7 um 1.0 um 1.10 um 1.20 um 1.30 um 1.40 um SF57 bulk glass Wavelength (um) Figure 6.8: Dispersion curves for bulk glass and HFs with different core diameters The 1.25 µm core fibre, Fibre#2 has a ZDW of ~1080 nm, so that fibre has normal dispersion at the pump wavelength. The lower power spectra (both experimental and simulation plots) in Figure 6.7 clearly show that a threshold power is required for explosive spectral broadening. Simulations indicated that, for the first several centimeters of propagation, broadening was due to pure SPM in the normal dispersion region, and that only when sufficient power was transferred across the ZDW would soliton effect compression lead to SC. The propagation distance to the soliton effect compression reduced with increasing power from ~7.5 cm at low power to ~6.5 cm at high power. Therefore for the experimental fibre length of 6.8 cm the data in Figure 6.7 shows that both the behaviors were clearly observed. The high power simulation spectrum shown in the figure is in good agreement with the experimental data, and is reasonably flat from nm, apart from the dip close to the ZDW. We again interpret differences between the simulation and experimental spectra to be due to slight differences between the calculated and actual dispersion profiles, and to cladding guidance leading to the increased experimentally measured intensity at the pump wavelength. We also performed simulations for fibres with smaller core sizes than 0.95 µm, which have increasing anomalous dispersion at the pump wavelength.
261 CHAPTER 6 Non-silica glass high-nonlinearity dispersion-shifted HFs for efficient supercontinuum generation 236 Simulations for a 5 cm fibre length with 0.8 µm core diameter indicated that pulse energies of ~100 pj (as used in the above experiments), would produce a more pronounced blue-shifted component at <700 nm and Raman solitons extending to >1600 nm but with very low power in the range nm. (Other authors have considered even smaller core sizes [18].) However, in practice wavelengths below ~500 nm would be strongly absorbed in longer lengths of SF57 fibre. Further simulations indicated that with ~100 pj pulses and a 1.05 µm pump wavelength, the broadest and flattest continua were produced by seeding slightly on the anomalous dispersion side of the ZDW, which corresponds to the dispersion profiles of fibres with core sizes in the range µm. The predicted spectra spanned from 750 nm to 1500 nm. Fibres with core sizes above 1.4 µm were not predicted to be efficient for continuum generation due to the strong normal dispersion at the pump wavelength. In short, SC is generated through a process of decay of higher order solitons (Figure 6.9(a)) into wavelength shifted Raman-solitons and group-delay matched blueshifted radiation (Figure 6.9(b)). Ultimately, FWM merges the solitons and reduces the magnitude of the gap around the ZWD (green arrows in Figure 6.9(c)). The increased power at short wavelength and reduced power close to the ZDW have been observed previously by other researchers and also in our own previous experiments on UV generation in small core silica HF [27] and are explained by the schematic shown in Figure 6.9 [28]. When the pulse is injected in the anomalous dispersion region, providing the energy is sufficient, it will form into a higher order soliton, which subsequently breaks apart into single solitons. These single solitons shift to longer wavelengths due to the SSFS, and shed energy which is transferred to the phase-matched wavelengths on the short wavelength side of the ZDW. Due to the high anomalous dispersion at the seed wavelength, and the SSFS moving the pulses to longer wavelengths, the phase-matching mainly transfers power to the short wavelength region with high normal dispersion. A gap in the spectrum is left in the low dispersion region near the ZDW. The rate of SSFS wavelength change is proportional to 1/(pulse duration)^4, so short pulses transfer power to the longer wavelengths most efficiently[29]. However, for a fixed energy soliton, the duration increases with dispersion so the
262 CHAPTER 6 Non-silica glass high-nonlinearity dispersion-shifted HFs for efficient supercontinuum generation 237 dispersion slope broadens the pulses in time, and this limits the maximum wavelength shift. Considering the general relationship between the seed and zero dispersion wavelengths described above, we conclude that a flatter dispersion profile would perhaps be preferable for realising an ultra broad SC generation. Figure 6.9: Schematic of the three stages of SC generation. (This diagram is extracted from [28]) Considering what we have described above, for all of the fibres, the steep dispersion profile at short wavelengths was due to the need for a large waveguide dispersion to shift the bulk SF57 ZDW from ~1.97 µm towards the ~1.05 µm pump
263 CHAPTER 6 Non-silica glass high-nonlinearity dispersion-shifted HFs for efficient supercontinuum generation 238 wavelength. The steep dispersion prevented broad visible continuum generation with this pump wavelength. To create an SF57 fibre with a flatter dispersion profile would require moving the fibre ZDW closer to that of the bulk glass e.g. a dispersionflattened SF57 HF with a ZDW ~ µm, is likely to be feasible. (For comparison the ZDW of bulk silica is at 1.3 µm and therefore smaller waveguide dispersion is required to shift the ZDW to 1 µm and, as a consequence, a dispersion flattened silica HF with ZDW at 1 µm is feasible.) Since a SC source comprises both a nonlinear fibre and pump laser, we expect that dispersion flattened SF57 HF with an Er-fibre pump system could provide a very attractive and practical source for broadband continuum generation in the 1 2 µm wavelength regime. Therefore, we came out with a newly designed SEST HF, which is suitable for this application SF57 SEST HFs with ZDWL at 1.55 μm The next fibre we are going to discuss in this section is the SEST HF (detail discussion on Chapter 5). The great advantages of SEST HFs, though, can be appreciated when the fibre dispersion is considered for SC generation. The location of the ZDW with respect to the pumping wavelength and the flat dispersion slope of the fibre are the most important considerations. The primary ZDW for the previously discussed WW HFs lies around 1μm, whilst The SEST designs offer far greater control and flatter dispersion profiles in the C-band compared to the WW suspended core structures. (See Figure 5.30 in Chapter 5 for the comparison of dispersion profiles of WW HFs and SEST HFs). In this section, we will demonstrate, experimentally and theoretically, our SC studies at 1.55 µm using the SEST HF made out of SF57 glass, HF#1 with core diameter of 4.2μm, as shown in Figure 6.10 and Table 6.4. This SEST HF possesses a higher nonlinear refractive index and a different chromatic dispersion profile compared to HF based on fused silica at telecommunication wavelengths. We first present our SC generation experiments which yielded spectra spanning over one octave and extending into both the visible region and the MIR region of the spectrum. We next describe a numerical model, which we have used to simulate the phase
 (b) Figure 6.10: (a) SEM image of the extruded + stacked SEST HF, HF#1 with a core diameter of 4.")

264 CHAPTER 6 Non-silica glass high-nonlinearity dispersion-shifted HFs for efficient supercontinuum generation 239 matching behavior of the fibres. Finally the results of the simulations are compared with our experimental results. (a) (b) Figure 6.10: (a) SEM image of the extruded + stacked SEST HF, HF#1 with a core diameter of 4.2 μm (b) measured mode profile for SEST HF with a core diameter of 4.2 μm at 1040nm Table 6.4: List of SEST HF used for the SC generation experiment with pumping wavelength at ~1.55μm SEST fibre Physical properties Optical properties HF#1 1. fibre core diameter = ~4.2 μm 2. fibre length = 1.02 m 1. loss =3.2±0.5dB/m 2. nonlinearity, γ = 170 W -1 km ZDW = ~1550nm SC experiment We employed a mode-locked tunable Coherent Mira femtosecond laser system operating at a selected wavelength of ~1530nm with a repetition rate of 250kHz, a pulse width of 100fs and which was able to generate a maximum average output power of ~500mW, corresponding to a peak power of ~10MW at 1530nm
265 CHAPTER 6 Non-silica glass high-nonlinearity dispersion-shifted HFs for efficient supercontinuum generation 240 (equivalent to 80nJ per pulse). Experimentally, the laser source was coupled into a 1.02m long piece of the SEST HF#1 with a core diameter of 4.2μm and the zero dispersion around 1.55μm. Typically an input coupling efficiency of 20% is obtained, but in this SC experiment, the coupling efficiency achieved was 4-6%. To obtain maximum coupling efficiency, it is essential that the laser beam travels along the optical axis of the microscope objective. Launched average power up to 30mW was measured after the test HF#1, corresponding to pulse energy of about 4.8nJ at 1.55μm. A λ/2 plate and a polarizer (PBS) were used before the focal lens for variable adjustment of the pulse energy launched in to the test HF. The light emitted from the test SEST HF was butt-coupled to a standard SMF28, connected to an optical OSA where the spectra were recorded, as the input pulse power was varied. Due to the limits of the OSA, we were only able to investigate the spectrum between 350nm to 1750nm. The major experimental findings of this experiment are illustrated in Figure 6.12 with all spectra plotted in a log scale for different launched pulse powers. In each spectrum, a narrow peak around 1530nm appeared, which corresponded to a small amount of residual pump power from the fs laser. With pulse energy of 4.8nJ (average power of 30mW), we observed a more than octave-spanning SC from 700nm to beyond 1750nm. We expect to see more spectral components extending far beyond 1850nm, but not more than 2μm because the IR cut-off of lead silicate glass is at ~3μm (refer to Figure 2.7 in Section 2.5.1, Chapter 2). A broad and flat spectrum can be achieved with the increased input power.
266 CHAPTER 6 Non-silica glass high-nonlinearity dispersion-shifted HFs for efficient supercontinuum generation 241 Table 6.5: The list of SEST HF#1 optical properties Optical property HF#1 Core diameter (µm) 4.2 Propagation (db/m) 3.2±0.5 γ (W -1 km -1 ) 170 Aeff (µm 2 ) 9.66 ZDW (µm) ~ Effective nonlinearity coefficient (W -1 km -1 ) HF#1 Dispersion (ps/nm/km) SF57 bulk glass HF#1 HF# Core diameter (μm) (a) Wavelength (um) Figure 6.11: Optical properties of the SEST HF, HF#1: (a) fibre effective nonlinearity at 1550nm and (c) dispersion over a wavelength range. (b) Intensity (dbm) -50 1mw 2mw 5mw 8.3mw 15.6mw mw Wavelength (nm) Figure 6.12: The evolution of the SC as a function of launched pulse power after 1.02m of the SEST HF#1 with the zero dispersion at about 1550nm
267 CHAPTER 6 Non-silica glass high-nonlinearity dispersion-shifted HFs for efficient supercontinuum generation Phase matching modeling SEST HF#1 dispersion Disperison (ps/nm/km) Dispersion Wavelength (um) Figure 6.13: An approximate dispersion profile of the SEST HF#1 Phase mismatch delta (arb. units) Phase mismatch for 1.55um soliton 1mW 5mW 30mW (a) Phase-matched wavelength (μm) (b) Nonsoliton wavelength (um) Average pump power (mw) Figure 6.14: (a) Phase mismatch for the 1.55μm soliton of the SEST HF#1 (b) Phase matching for the SEST HF#1 assuming 25% coupling efficiency The dispersion of the fibre is the utmost importance as it governs the phase matching of the nonlinear processes. The dispersion of this fibre has a profound influence on the SC which is believed to be generated through self phase modulation (SPM), soliton fission and subsequent generation of dispersive waves, as in the initial discussed WW HF in Section Here, we will discuss the dominant physical mechanisms and the shape of the generated SC depending on the fibre s ZDW and the corresponding phase matching conditions for dispersive wave generation. Here, we would like to thank Dr. P. Horak for performing the phase matching modeling for this fibre (SEST HF#1). For the interpretation of the observed SC spectrum, we also studied the properties of the dispersive wave generation. Pumping the fibres in the anomalous dispersion region leads to the creation of high-order solitons, which then break up into fundamental solitons [30]. The most powerful of
268 CHAPTER 6 Non-silica glass high-nonlinearity dispersion-shifted HFs for efficient supercontinuum generation 243 these fundamental solitons has a peak power approximately four times higher then the input pulse [31]. Due to the fibre dispersion, the solitons shed energy into a dispersive wave at a phase-matched wavelength in the normal dispersion region [30]. The generated components were directly calculated from the dispersion profile of the SEST HF#1 as shown in Figure 6.11(b). The dispersion profile used in the modeling is an approximate step-index fibre model which gives the same dispersion at nm (Figure 6.13), ZDW at 1.54μm and GVD of 2ps/nm/km at 1550nm (The programme for generating the exact dispersion for the full wavelength region has been lost due to a fire in the University of Southampton on 30 th October 2005). Figure 6.14(a) shows the phase mismatch for the 1.55μm soliton and (b) the phase matching wavelength corresponding to the average pumped power of the SEST HF#1. By examining the phase matched wavelength of the corresponding fibre dispersion, one can interpret the peak of the spectrum achievable at the shorter wavelength. For example, the shortest anti-stokes band for the fibre is around 800nm at the average pumping power of 30mw with the pumping wavelength of ~1530nm. Given the uncertainties of the model, in all cases, we found that the trends are in reasonable good agreement between the predicted and observed spectra Comparison of simulations and experimental results The SEST HF#1 has a ZD at ~1540nm and it exhibited a quite symmetrical spectrum with sharp edges, see Figure 6.5, when it was pumped at ~1530nm. The SC generation is dominated by the SPM and soliton nonlinear processes. At low input power, the spectrum is slightly broadened by SPM. At only 2mw, soliton processes set in, which leads to a sudden increase in the bandwidth from 900nm to beyond 1650nm (note that the measurement range of the OSA used in this experiment extended from 350nm to 1750nm). At only 15.6mW (2.5nJ), the broadening is near to the maximum value. From the phase matching graph of Figure 6.14(b), we can see that the main phase-matched wavelength components for 15.6mW and 30mW average input powers are at ~900nm and ~800nm respectively. The dispersion at the pump wavelength is small for fibre with a very low anomalous dispersion. It is quite surprising that the short wavelength peak extends as far as 1μm. We believe the
269 CHAPTER 6 Non-silica glass high-nonlinearity dispersion-shifted HFs for efficient supercontinuum generation 244 frequency components at nm are generated when a soliton (at 1550nm) sheds energy due to a non-vanishing dispersion slope. The flatness and uniformity of the spectrum can be improved by applying maximum input power. Other applications of the SEST HF apart from the main SC application include wavelength conversion by four-wave-mixing (FWM). Papers on experiments associated with this application are included in the Appendix Conclusion The phenomenon of SC generation in HF relies on high intensity pulses from a laser being converted into an extremely broad spectrum by cascaded nonlinear processes. The generation of the SC is achieved by pumping the fibre at a wavelength near to the ZDW of the fibre. Highly nonlinear HFs can exhibit a range of novel dispersive properties, with modifications of the fibre design, allowing application specific control of the magnitude, slope and sign of the dispersion. Shifting the zerodispersion wavelength to regimes where there are convenient sources allows the generation of efficient SC sources. The fundamental material properties of non-silica soft glasses can enhance SC generation across the wavelengths of interest. The ZDW of the fibre is strongly dependent on the choice of material, and one particularly attractive option is to shift the fibre zero dispersion to 1.0 and 1.5µm, to offer the potential to use Nd:glass fs lasers and, both Yb and erbium-doped fibre lasers respectively to generate the SC and allowing synergy with NIR nonlinear application work. The combination of HF technology and non silica soft glasses can potentially be used to exploit the fibre nonlinearity and achieve broad SC generation in the NIR region. By controlling the generated continuum, it is anticipated that a single laser source capable of serving a range of near IR applications could be realised. Both high nonlinearities and low losses together with unique dispersion properties should
270 CHAPTER 6 Non-silica glass high-nonlinearity dispersion-shifted HFs for efficient supercontinuum generation 245 ultimately result in practical compact nonlinear devices using very short fibre lengths and operating at low powers. Our highly nonlinear SF57 lead silicate glass HFs: WW HFs and SEST HFs, which have been discussed in Chapter 4 and 5 respectively, are attractive for studying nonlinear effects especially SC generation, as they have a high nonlinear coefficient, at the same time, they can be tailored to provide a range of unique zero dispersion wavelengths, e.g. WW HF has the a ZDW at ~1.0 µm whilst SEST HF has a ZDW at C-band. These fibres are designed with relatively small holes to be single moded at the operating wavelength as many applications require strictly single-mode operation. We have used extrusion techniques to fabricate small-core lead silicate glass WW HFs with an extremely high effective nonlinearity. The fibres we have fabricated exhibit an effective nonlinearity of 1860 W -1 km -1, which is the highest value reported to date for a fibre at 1550nm. By carefully tailoring the size of the microstructure we achieved a ZDW of ~1 µm, which made our fibres extremely useful for SC generation applications at that wavelength. We have used two HFs which differed only slightly in the size of their cores to demonstrate the critical effect of dispersion in the SC generation process. We managed to achieve a spectral broadening in excess of 1000nm for launched pulse energies as low as 98pJ into a 60cm piece of record-high effective nonlinearity and dispersion tailored WW HF. We expect even broader spectra to be observed if we use an even shorter length of fibre, because of the significant fibre loss on both long and short wavelength ends of the spectrum. However this does require the use of higher power pulses. Additionally, we backed our experimental findings with numerical simulations of the SC generation, which enabled us to explain fully the nonlinear behavior of the HFs. Although here, we did not achive an exact correspondence with the experimental spectra, the simulations have reproduced important features such as peaks at short wavelength produced by using a seed wavelength on the long wavelength side of the zero dispersion wavelength. Here, we expect that the numerical simulations of the visible, NIR and mid-ir SC should provide considerable assistance in predicting the spectra that might be possible from future experimental work, but we would not expect an exact prediction. Some general outcomes of interest from this study are:
271 CHAPTER 6 Non-silica glass high-nonlinearity dispersion-shifted HFs for efficient supercontinuum generation 246 The pulse energies required for the initial stages of SC generation is ~100pJ: a pulse energy regime that can readily be accessed directly from mode-locked Yb-doped fibre laser cavities. This should lead to the development of truly compact and practical supercontinuum sources. The separation between the pump wavelength and the wavelength range that needs to be generated by SC effects should be minimised. Due to the very high nonlinearity of the fibres considered within this study, the spectral broadening occurs in a very short fibre length, and the impact of loss is typically negligible. Dispersion profiles were found to be key for this application. In particular, the steep dispersion properties often associated with nonlinear fibre types limited the bandwidth the generated SC. This feasibility study has identified a range of practical fibre designs that are capable of moving the dispersion zero to suit both 1.0 and 1.5 µm pump sources. However, other factors such as the dispersion slope and profile can be very significant in influencing the SC spectrum that is generated. Further work is clearly required to optimise the fibre parameters. For example, design of fibres with broadband flat dispersion. The most attractive route to performing this optimisation would be via the use of inverse modelling techniques (e.g. genetic algorithms) [32], which have been applied on our SEST fibre design.
272 CHAPTER 6 Non-silica glass high-nonlinearity dispersion-shifted HFs for efficient supercontinuum generation References 1. Crystal-fibre Catalogue R. R. Alfano and S. L. Shapiro, "Emission in the region 4000 to 7000 Å via four-photon coupling in glass", Phys. Rev. Lett. 24, pp (1970). 3. W. Lee Smith, P. Liu, and N. Bloembergen, "Superbroadening in H2O and D2O by self-focused picosecond pulses from a YAIG:Nd laser", Phys. Rev. A 15, pp (1977). 4. Fork R. L., Shank C. V., Hirlimann C., Yen R., Tomlinson W. J., "Femtosecond white-light continuum pulses", Opt. Lett. 8, pp. 1-3 (1983). 5. P. L. Baldeck and R. R. Alfano, "Intensity effects on the stimulated four photon spectra generated by picosecond pulses in optical fibres", J. Lightwave Technol. 5, pp (1987). 6. K. Mori, H. Takara, and S. Kawanishi, "Analysis and design of supercontinuum pulse generation in a single-mode optical fibre", J. Opt. Soc. Am. B. 18, pp (2001). 7. J. K. Ranka, R. S. Windeler, and A. J. Stentz, "Visible continuum generation in air-silica microstructure optical fibres with anomalous dispersion at 800 nm", Opt. Lett. 25, pp , (2000). 8. S. T. Cundiff, J. Ye, and J. L. Hall, "Optical frequency synthesis based on mode-locked lasers", Rev. Sci. Instrum. 72, pp (2001). 9. X. D. Hartl, C. Li, R. Chudoba, K. Ghanta, T. H. Ko, J. G. Fujimoto, J. K. Ranka, and R. S. Windeler, "Ultrahigh-resolution optical coherence tomography using continuum generation in an air silica microstructure optical fibre," Opt. Lett. 26, (2001). 10. B. Povazay, K. Bizheva, A. Unterhuber, B. Hermann, H. Sattmann, A. F. Fercher, W. Drexler, A. Apolonski, W. J. Wadsworth, J. C. Knight, P. S. J. Russell, M. Vetterlein, and E. Scherzer, "Submicrometer axial resolution optical coherence tomography," Opt. Lett. 27, (2002). 11. J. Stenger, T. Binnewies, G. Wilpers, F. Riehle, H. R. Telle, J. K. Ranka, R. S. Windeler, and A. J. Stentz, Phase-coherent frequency measurement of the Ca intercombination line at 657 nm with a Kerr-lens mode-locked femtosecond laser, Phys. Rev. A 63, (R) (2001).
273 CHAPTER 6 Non-silica glass high-nonlinearity dispersion-shifted HFs for efficient supercontinuum generation P. J. Blythe, S. A. Webster, H. S. Margolis, S. N. Lea, G. Huang, S.-K. Choi, W. R. C. Rowley, P. Gill, and R. S. Windeler, Subkilohertz absolute-frequency measurement of the 467-nm electric octupole transition in 171 Yb +, Physical Review A - Atomic, Molecular, and Optical Physics 67 (2), pp / /4 (2003). 13. J.H.V.Price, T.M.Monro, H.Ebendorff-Heidepriem, F.Poletti, V.Finazzi, J.Y.Y.Leong, P.Petropoulos, J.C.Flanagan, G.Brambilla, X.Feng, D.J.Richardson, Mid-IR supercontinuum generation in non-silica glass fibres, Photonics West San Jose, California, Jan 2006 (Invited). 14. T.M. Monro, Y.D. West, D. W. Hewak, N. G. R. Broderick and D.J.Richardson, Chalcogenide holey fibres, Electron. Lett. 36, (2000). 15. J.Y.Y.Leong, P.Petropoulos, S.Asimakis, H.Ebendorff-Heidepriem, R.C.Moore, K.Frampton, V.Finazzi, X.Feng, J.H.V.Price, T.M.Monro, D.J.Richardson, A lead silicate holey with y=1860 W -1 km -1 at 1550 nm, OFC 2005 Anaheim 6-11 Mar 2005 PDP22 (Postdeadline). 16. J. Y. Y. Leong, S. Asimakis, F. Poletti, P. Petropoulos, X. Feng, R. Moore, K. Frampton, T. M. Monro, H. Ebendorff-Heidepriem, W. Loh, and D. J. Richardson, Towards zero dispersion highly nonlinear lead silicate glass holey fibres at 1550nm by structured-element-stacking, presented at the European Conference in Optical Communication, Glasgow, United Kingdom, Sep.2005, paper Th4.4.5 (Postdeadline). 17. J. C. Knight, J. Arriaga, T. A. Birks, A. Ortigosa-Blanch, W. J.Wadsworth, P. St.J.Russell, "Anomalous dispersion in photonic crystal fibre," IEEE Photonics Technology Letters 12, pp (2000). 18. A. Boskovich, S.V. Chernikov, J.R. Taylor, L. Gruner-Nielsen, and O.A. Levring, Direct continuous-wave measurement of n 2 in various types of telecommunication fibre at 1.55 µm, Opt. Lett. 21, (1996). 19. J. H. V. Price, T. M. Monro, K. Furusawa, W. Belardi, J. C. Baggett, S. J. Coyle, C. Netti, J. J. Baumberg, R. Paschotta, and D. J. Richardson, "UV generation in a pure silica holey fibre," Applied Physics B-Lasers and Optics 77, pp (2003). 20. J. M. Dudley and S. Coen, "Coherence properties of supercontinuum spectra generated in photonic crystal and tapered optical fibres," Optics Letters 27, pp (2002). 21. G. Genty, M. Lehtonen, H. Ludvigsen, J. Broeng, and M. Kaivola, "Spectral broadening of femtosecond pulses into continuum radiation in microstructured fibres," Optics Express 10, pp (2002).
274 CHAPTER 6 Non-silica glass high-nonlinearity dispersion-shifted HFs for efficient supercontinuum generation R. H. Stolen, J. P. Gordon, W. J. Tomlinson, and H. A. Haus, "Raman Response Function of Silica-Core Fibres," Journal of the Optical Society of America B-Optical Physics 6, pp , (1989). 23. R. H. Stolen, C. Lee, and R. K. Jain, "Development of the Stimulated Raman-Spectrum in Single-Mode Silica Fibres," Journal of the Optical Society of America B-Optical Physics 1, pp , (1984). 24. G. Q. Chang, T. B. Norris, and H. G. Winful, "Optimization of supercontinuum generation in photonic crystal fibres for pulse compression," Optics Letters 28, pp (2003). 25. R. Wynands, F. Diedrich, D. Meschede, and H. R. Telle, "A compact tunable 60-dB Faraday isolator for the near infrared", Rev. Sci. Instrum. 63, pp (1992). 26. Thorlabs Online Catalogue J. Herrmann, U. Griebner, N. Zhavoronkov, A. Husakou, D. Nickel, J. C. Knight, W. J. Wadsworth, P. St.J.Russell, and G. Korn, "Experimental evidence for supercontinuum generation by fission of higher-order solitons in photonic fibres," Physical Review Letters 88, art (2002). 28. Mikko Lehtonen, Thesis: Supercontinuum generation in photonic crystal fibre, 31st May, J. P. Gordon, "Theory of the soliton self-frequency shift," Optics Letters 11, pp (1986). 30. A.V.Husakou and J.Herrmann. Supercontinuum generation, four-wave mixing, and fission of higher-order solitions in photonic-crystal fibres, J. Opt. Soc. Am. B, 19, (2002). 31. J. K. Lucek and K. J. Blow, "Soliton self-frequency shift in telecommunications fibre", Phys. Rev. A 45, No. 9, pp (1992). 32. F. Poletti, V. Finazzi, T. M. Monro, N. G. R. Broderick, V. Tse, and D. J. Richardson, "Inverse design and fabrication tolerances of ultra-flattened dispersion holey fibres," Opt. Express 13, (2005).
275 CHAPTER 7 Conclusions and future directions This thesis has described the fabrication, characterisation, and applications of a range of small core, highly nonlinear and dispersion shifted HFs with a particular emphasis on the non-silica soft glass material. In contrast to the conventional fibres (CFs), HFs can be made from a single material type, which can eliminate the problems induced by the core/cladding interface of the two different glass types, and also possess a sufficiently large refractive index difference. The design flexibility of the HFs is based on the freedom in the specification of size, shape and the hole arrangement, combined with the flexibility in the properties of the solid material. One of the most promising practical applications of HF technology is the opportunity to develop fibres with an extremely high optical nonlinearity per unit length, with a nonlinearity 2 to 4 orders greater than that of CFs [1], which is again not easily achieved by using standard optical fibre technology. Consequently, it is generally desirable to develop fibres with high values of effective nonlinearity (γ) per unit length in order to reduce the physical length and/or required operating powers, and to maximize the operating bandwidth of many such devices. HFs can also exhibit a range of novel dispersive properties. In small core HFs, the waveguide contribution to the chromatic fibre dispersion can be large, in particular for small Λ and large air-filling fraction (AFF) designs. This allows the dispersion to be tailored to suit the demands for a range of nonlinear applications. For example, shifting the ZDW to regimes where there are convenient high power laser sources: Ti:sapphire at 800nm, Yb-fibre at 1000nm, Nd:YAG at 1060nm, erbiumdoped fibre lasers at 1550nm and Tm-fibre at 2000nm, should allow the development of efficient SC sources, which are particularly attractive for a host of applications
276 CHAPTER 7 Conclusions and future directions 251 such as DWDM transmitters, optical coherence tomography (OCT), optical frequency metrology and spectroscopy. To date, most HF device applications are concentrated on the use of small core silica HFs, which have around ~50-70 times the nonlinearity of standard telecommunication single mode fibres (SMF28). Further improvements are to be expected when a highly nonlinear soft glass is combined with the tight mode confinement offered by a HF structure. Hence, soft glasses offer substantial improvements in terms of mode confinement, relative to silica, besides providing high intrinsic material nonlinearities. HF technology can also be used as a powerful solution for producing single mode soft glass fibres. Obviously, high nonlinearity soft glasses are potential materials for nonlinear devices. Despite their promise, soft glass fibres have yet to find widespread application owing to the difficulty in fabricating low loss single mode soft glass fibres using conventional fibre fabrication techniques. At the time of this work, knowledge of the soft glass HF fabrication and the factors that influence some optical properties of the HFs: propagation loss, fibre nonlinearity and dispersion, were limited. There had been little development towards soft glass HF fabrication techniques that could be used to produce good quality fibres, and also the characterisation techniques that could be used to accurately measure the optical properties. Both of the fabrication and characterisation techniques are essential for future soft glass HFs research and development, and for accessing what benefits soft glass HFs may offer over their conventional counterparts, and silica HFs in the small core, single mode regime. Chapter 1: By choosing soft glasses, with several hundred times more nonlinearity than the standard CFs, as the background material for the fibres, it should ultimately allow sub-metre, sub-watt devices to be realised. In addition, nonlinear effects are highly sensitive to the dispersive properties of the soft glass HFs, and so the ability to tailor dispersion, combined with the extremely small mode areas that can be achieved in HFs, leads to the possibility of realising highly efficient nonlinear processes, particularly SC generation. The use of soft glass with low softening temperatures (~420 0 C) has allowed
277 CHAPTER 7 Conclusions and future directions 252 the development of a novel fabrication technique for HF structured preforms: Extrusion. Extrusion is a method where a glass disc is forced through a die at elevated temperature near the softening point, whereby the die orifice determines the preform geometry Therefore, the objectives within my research presented here are thus threefold: (1) To attempt to enhance the fibre fabrication technique in order to reduce the fibre loss, at the same time, increase the effective nonlinear length of the fibre. (2) To use the novel HF fabrication technique, namely extrusion to produce the structured preforms that can be potentially drawn into fibres which can achieve the maximum possible γ for SF57 small core HFs by using air-suspended-core structure. (3) To attempt the dispersion control of the soft glass HFs for telecommunications and SC generation applications by extending and improving the previous extrusion technology. Chapter 2: The timeline of the HF development was discussed. A comprehensive review of the HF optical properties: optical guidance, propagation loss, γ and dispersion, the HF background glass characteristics, and the state-of-art fibre preform fabrication techiniques were studied. An investigation is conducted on the characteristics of some soft glasses, mainly lead silicate glasses and chalcogenide glasses, these are compared with the silica glass, in terms of optical properties: transmission, impact of OH content on IR transmission and refractive index of the glasses (material dispersion and material nonlinearity), and thermal property: viscosity. As a brief conclusion for the glass selection, we believe that heavy-metal oxide glasses, especially lead silicate glass, have adequate properties for meeting the requirements in achieving visible-nir devices, and are technologically the best developed candidates for immediate experiments. A brief review of fabrication technology was provided in order to establish appropriate fibre geometry for the design optimization described in Chapter 4 and 5. The key in HF fabrication is the making of the macroscopic structure of the fibre
278 CHAPTER 7 Conclusions and future directions 253 preform. There are few practical techniques in manufacturing soft glass HFs and they are: capillary stacking, extrusion, ultrasonic drilling and casting. A novel fabrication technique for non-silica HF structured preforms: Extrusion, is chosen. Extrusion can be used to produce structures that could not be made with the capillary stacking method, i.e. small core HFs with very high air filling fraction that are ideally suited for exploring nonlinear effects Chapter 3: HFs, especially soft glass HFs, exhibit some unique features compared to those of the standard optical fibres. Comprehensive characterisations have been conducted to identify the optical properties, such as mode profile, propagation loss, effective nonlinearity and dispersion, for a range of our studied highly nonlinear small core soft glass HFs. The measurement tasks become more difficult or impractical in the case of small core HFs using standard measurement techniques, compared to conventional fibres. General guidelines for the experimental considerations, i.e. soft glass HF end preparation: cleaving, polishing and cladding light removing, launching light into soft glass HF and coupling from HF to the detector, were provided. Mode profile: In order to check the guided modes of the HFs at particular wavelengths, appropriate laser sources were used to conduct these measurements. The expected near field images were observed by using an infrared charge coupled device (CCD) camera. Propagation loss: The cutback method was used since it is an internationally recognised reference test method and it offers the highest measurement accuracy. Both the spot loss measurement and broadband loss measurement were preformed. Nonlinearity: The effective nonlinear coefficient, γ, for the studied soft glass HFs was measured using the Boskovich method [4]. This method is based on the measurement of the nonlinear phase shift induced through the SPM effect with a continuous wave, dual-frequency optical beat signal propagating through the fibre.
279 CHAPTER 7 Conclusions and future directions 254 Dispersion: The dispersion value of the highly nonlinear fibre is a critical parameter for the efficient spectral broadening of the signal. Dispersion measurement based on the interferometric technique has been developed in the ORC by Asimakis et al. [5,6], and it has been used in measuring these highly nonlinear soft glass studied HFs. Birefringence: The wavelength scanning method is used to generate a modulated spectrum and from there, beat length of the fibres was calculated by using Equation FOM: The proper FOM for our highly nonlinear soft glass HFs is discussed. we have identified two different fibre lengths and thus two different FOMs: 1) devices based on maximum useful fibre length and, 2) compact devices using 1 m or less fibre length. Since the main focus of this work is on the HF for nonlinear compact devices, mainly supercontinuum (SC), therefore the discussion will pay more focus to compact devices using 1m fibre length. Chapter 4: This chapter concerns the design, characterisation and particularly the fabrication of simple structure soft glass HFs with small cores, thus with high nonlinearity, for nonlinear device applications. There are several distinctly different opportunities offered by small core soft glass HFs, compared with the CFs and silica HFs: Unique dispersion properties and extremely high nonlinearity. The objective of this work is to explore the limits of nonlinearity and dispersion control in lead-silicate based microstructured fibres, and at the same time to minimize the loss of these soft glass HFs. We had established the maximum nonlinearity that can be achieved in these fibres at telecommunications wavelengths, and developed high nonlinearity fibres with dispersion-shifted characteristics suited for SC generation applications at 1.06 μm. The Wagon wheel (WW) structure was chosen as our design. WW HF is a HF where its microstructured region consists of three large air holes surrounding a very small core. The air suspended core is supported by three long and fine struts. The
280 CHAPTER 7 Conclusions and future directions 255 targeted optical properties for these WW designed HFs are high effective nonlinearity (small effective area), low confinement loss, single mode or essentially single-mode guidance and near zero dispersion at 1060nm. General guidelines for the preform preparation and optical fibre drawing process were discussed. The fabrication related issues were also studied. The extrusion technique readily allows the implementation of structures with high air content claddings as required for high nonlinearity fibre fabrication. Good dimensional control and surface finish of preforms can be achieved through the optimization of the extrusion parameters such as temperature, pressure and die design. In this studied work, dies of two different fabricated types were used: machined fabricated types and eroded and dry lubricant coated types. Spark erosion does not produce a completely smooth surface but it is slightly rough and indented when observed under an optical microscope. Therefore, in order to decrease the friction between glass and die, a good surface finish for eroded dies is needed. Practical issues such as cleaning the glass billets and the extrusion dies are also discussed. This is a crucial process, in order to avoid contaminants that might be incorporated into the extruded preforms. In the two step method, the structured cane is drawn first from a structured preform, and is then pulled again by jacketing with another tube. This approach is particularly effective for obtaining small structures with OD of less than 2μm. In the fibre drawing process, furnace temperature, preform feed speed, draw speed and the use of pressure/vacuum within the preform determines the size and shape of the features in the final fibre. Investigations into the optical properties of the WW HFs were presented. Propagation loss: The factors influence the fibre propagation loss were discussed, in terms of the effect of the core diameter, the die characteristic, the fibre structure, the fibre defects, cleaning and the temperature. We managed to produce low loss lead silicate WW HFs, at about 2dB/m at 1550 nm. The fibre loss was reduced by optimising the fabrication process. Mode profile: For our specific design, single mode operation can be achieved when reducing the scale of the microstructure beyond a certain value. Practically, for
281 CHAPTER 7 Conclusions and future directions 256 this type of HF, single mode or effectively single mode operation was obtained for a core diameter of 1.8 μm or less at μm. Nonlinearity: By improving our fabrication process and optimizing our fibre design, we have now achieved a value of γ=1860 W -1 km -1 at 1.55 μm and at the same time improved fibre losses. This γ value approaches the ultimate limit for this material and represents the highest value of nonlinearity yet reported for a fibre. Dispersion: For most nonlinear fibre applications, control of the fibre dispersion is more important than achieving the maximum possible nonlinearity per unit length, and here again the use of HF technology provides unique opportunities. The material ZDW for SF57 glass is ~1.97 μm, yet we managed to demonstrate that it is possible to use the large waveguide dispersion available in SF57 HFs to obtain fibres with ZDW shifted by more than 1000nm to allow efficient SC when pumped at wavelengths around 1μm. FOM: The FOM for compact devices using 1m fibre length is used, as our work is on producing HF for compact nonlinear device application, i.e. SC. For such devices, all SF57 glass WW HFs even those with ~3dB/m exhibit clearly better performance (higher γ L eff,1m values) than the best silica HF. SF57 HFs clearly outperform silica HFs for compact and low power nonlinear devices. Finally, more work is still needed to identify the cause of defects in preforms and further improvement in the preform fabrication is envisaged to decrease defects and eventually the optical loss of the end fibre. Also, further investigations should be conducted to explore and confirm the impact of coated dies in producing low loss WW HFs. Continuous investigations to improve the fabrication process also need to be done in order to reduce the fibre losses to values near to the bulk glass loss. By further surface refinement and the use of glasses with lower bulk loss, it should be possible to reduce HF losses down to <1 db/m. Chapter 5: The development of complex structure, high nonlinearity lead silicate glass HFs with the ZDW shifted to the 1.55 μm regime, were described. WW
282 CHAPTER 7 Conclusions and future directions 257 HFs offer very large nonlinearities but allow for only relatively limited dispersion control around 1.55μm. The aim of the work in this chapter is to develop a new class of highly nonlinear HFs, with better dispersion management characteristics, using Schott SF57 lead silicate glass. The targets for such fibres are high effective nonlinearity, low confinement loss, single-mode or effectively single-mode guidance, near-zero dispersion and flattened dispersion profiles at 1550 nm. The control of the dispersion is a critical issue for the majority of nonlinear device applications and therefore fibre designs that allow a trade off in nonlinearity for improved dispersion control (whilst maintaining single mode operation) are of great technological interest. Generally, these designs require far more complex arrangements of air holes than a simple air-suspended core. For the fibre design, in order to identify fibre designs providing near-zero, flat dispersion at 1.55 μm, we employed an inverse design procedure similar to that previously applied to the optimization of dispersion-flattened high nonlinearity silica fibres [7,8]. Our results showed that it is possible for the SEST design to have a flattened dispersion with D <5 ps/nm/km over a wavelength range spanning from 1430nm to 1610nm, and a γ value approaching 526W -1 km -1 at 1550 nm. It is currently difficult to achieve this kind of holey cladding by extrusion alone due to the complexity of the die-design required. However, we managed to develop a novel fibre fabrication approach: Structured Element Stacking Technique (SEST), which combined the best features of both extrusion and stacking, and allows the production of the more complex preforms required to achieve good dispersion control in soft glass HFs. Thus, with the SEST approach we were able to fabricate HFs with a hexagonal arrangement of effectively 4 rings of holes, (48 holes in total), simply by stacking together just 7 structured elements. This approach is less labour intensive than simple capillary stacking and provides a larger reduction ratio from the stacked preform to the final fibre. Moreover, since the core region and the first ring of holes are formed from one extruded glass element a greater degree of glass homogeneity is obtained in the core region. We have gained understanding and experience in the fabrication of SEST
283 CHAPTER 7 Conclusions and future directions 258 fibres with an array of small air holes. Compared with the WW canes and fibres having three larger holes, higher drawing tension is required to prevent collapse of the clearly smaller holes in the stacked canes and fibres. In addition, it is important to have a sufficiently long stacked preform (~150 mm) to allow high internal pressure during the fibre drawing process. Several trials and optimisations of the SEST fibre fabrication, in terms of the fibre design, die design, preform extrusion parameters and fibre drawing parameters, were performed. We succeeded in fabricating different types of SEST fibres with fairly good structures, where they have a regular array of air holes of similar size. Characterisation was carried out to check on the fibres properties. Firstly, we need to have a trade-off between the nonlinearity and the confinement loss where for very small core and high nonlinearity fibres, in order to reduce the confinement loss, it is necessary to include a second ring of elements within the structure. However, an issue needs to be addressed here whereby it is very difficult to stack multi-ring elements, at the same time make sure the holes are in their proper position. Thus, an alternative design of the improved SEST ( 2+1 R-SEST) was made to provide less labour intensive fabrication. It is also predicted to offer better optical properties, in terms of nonlinearity, dispersion slope and confinement loss at wavelengths centred around 1.55μm, than the SEST fibres we produced in the previous 3 trials. In short, we have successfully fabricated high-nonlinearity, effectively single mode, lead-silicate HFs with ZDWs around 1.55 µm using a new fabrication approach SEST. We demonstrated the fabrication of an SF57 SEST fibre with a ZDW within the C-band, a 3.2 db/m loss, and a γ value of 170 W -1 km -1. The measured properties of these fibres are shown to be in good agreement with the theoretical expectations. Finally, more investigations and experiences are required to determine the optimum temperature and pressure, in particular for glass with intricate structures such as SEST preforms. In addition, the impact of the different die designs on the geometry of the extruded elements needs to be explored further. For example, one of the fabrication difficulties is in cane stacking, where the circular outer shape of the canes were more prone to rotate during the stacking process and this will lead to hole displacement. Thus, by overcoming this issue, a better geometry of the fibres can be
284 CHAPTER 7 Conclusions and future directions 259 achieved. For the improved SEST ( 2+1 R-SEST), a larger hole size for the inner rings are needed to provide enough waveguide dispersion to compensate for the material dispersion in order for the fibre to have a ZDW at the C-band region. This study also demonstrates that further improvement in the preform surface quality is a promising route to decrease the losses of HFs down to the bare fibre losses. Last but not least, further enhancement and improvement of the dispersion flatness, nonlinearity and loss of SEST HFs is anticipated in the near future with the optimised SEST structure. Chapter 6: The chapter is devoted to the Supercontinuum (SC) studies we carried out using the two types of HFs (WW HFs (Chapter 4) and SEST HFs (Chapter 5)) produced. We present both experiment and numerical simulations and discuss how the properties of each of the fibres affected the broadened spectra. Both of the WW HFs and SEST HFs SC studies combined experimental and numerical results, and the simulations and experiments were in qualitative agreement. The numerical simulations were performed to assist us in interpreting the results and gain a better understanding of our SC generation data. We used a small core WW HF with a record-high γ (γ=1860 / (W.km)) and tailored dispersion characteristics (ZDW at ~1 µm) to generate a broadband SC at 1.06 µm extending either side of the pump wavelength. We observed a spectrum spanning over 1000nm by using just ~98 pj energy pulses in a 60cm piece of this HF. We also used two WW HFs which differed only slightly in the size of their cores to demonstrate the critical effect of dispersion in the SC generation process. However, there is an important issue here. The steep dispersion profile at short wavelengths was due to the need for a large waveguide dispersion to shift the bulk SF57 ZDW from 1.97 µm towards the 1.06 µm pump wavelength. The steep dispersion prevented broad visible continuum generation with this pump wavelength. To create an SF57 fibre with a flatter dispersion profile would require moving the fibre ZDW closer to that of the bulk glass e.g. a dispersion-flattened SF57 HF with ~ µm ZDW is likely to be feasible.
285 CHAPTER 7 Conclusions and future directions 260 The SEST designs offer far greater control and flatter dispersion profiles in the C-band regime compared to the WW suspended core structures at 1 µm. With a pulse energy of 30nJ (average power of 30mW), we observed a more than octave-spanning SC from 700nm to beyond 1750nm using a 1550nm pump. We expect to see more spectral components extending far beyond 1850nm, but not more than 2μm because the IR cut-off of lead silicate glass is at ~3μm. The flatness and uniformity of the spectrum can be improved by applying maximum input power. Additionally, we backed our experimental findings with the phase matching modeling of the SC generation, which enabled us to interpret the peak of the spectrum achievable at the shorter wavelength, by examining the phase matched wavelength of the corresponding fibre dispersion. Given the uncertainties of the model, in all cases, we found that the trends are in reasonably good agreement between the predicted and observed spectra. Finally, we expect that the numerical simulations of the visible, NIR and mid- IR SC, should provide a considerable assistance in predicting the spectra that might be possible from future experimental work. There are some general outcomes of interest from this study: 1) The separation between the pump wavelength and the wavelength range that needs to be generated by SC effects should be minimised; 2) Due to the very high nonlinearity of the fibres considered within this study, the spectral broadening occurs in a very short fibre length, and the impact of loss is typically negligible; 3) Dispersion profiles were found to be key for this application. In particular, the steep dispersion properties often associated with nonlinear fibre types limited the bandwidth the generated SC. Thus, further work is clearly required to optimise and refine the fibre parameters, for an efficient SC, i.e. SC generation depends on the fibre characteristics over a broad range of wavelengths, so complex dispersion profiles, for example with two ZDWs could also be envisaged in the future. It is also necessary to consider alternative glasses for generation of broadband radiation due to the limitation of silica and lead silica soft glass at certain wavelengths, e.g. material dispersion and material nonlinearity. Based on the study in Chapter 2, the chalcogenide glasses possess advantages over the heavy metal oxide glass systems in terms of higher n 2 and longer
286 CHAPTER 7 Conclusions and future directions 261 wavelength multiphonon absorption edges. Thus, chalcogenide glasses can be a very promising component for the development of compact nonlinear devices that are operating at low powers, for a broad range of mid IR SC applications in the future. i.e. LIDAR applications in the 3-12 µm wavelength range.
287 CHAPTER 7 Conclusions and future directions References 1. N.G.R. Broderick, T.M. Monro, P.J. Bennett, D.J. Richardson, Nonlinearity in holey optical fibers: measurement and future opportunities, Opt. Lett. 24, (1999). 2. T. A. Birks, P. J. Roberts, P. St. J. Russell, D. M. Atkins, and T. J. Shepherd, Full 2-D photonic bandgaps in silica/air structures, Electron. Lett., 31(22), (October 1995). 3. J. C. Knight, T. A. Birks, P. St. J. Russell and D. M. Atkin, All-silica single-mode photonic crystal fiber, Opt. Lett. 21, (1996). 4. A. Boskovich, S.V. Chernikov, J.R. Taylor, L. Gruner-Nielsen, and O.A. Levring, Direct continuous-wave measurement of n 2 in various types of telecommunication fiber at 1.55 µm, Opt. Lett. 21, (1996). 5. S.Asimakis, P.Petropoulos, F.Poletti, J.Y.Y.Leong, H.Ebendorff- Heidepriem, R.C.Moore, K.E.Frampton, X.Feng, W.H.Loh, T.M.Monro, D.J.Richardson, Efficient four-wave-mixing at 1.55 microns in a shortlength dispersion shifted lead silicate holey fibre, ECOC 2006 Cannes, Sept S.Asimakis, P.Petropoulos, F.Poletti, J.Y.Y.Leong, R.C.Moore, K.E.Frampton, X.Feng, W.H.Loh, D.J.Richardson, Towards efficient and broadband four-wave-mixing using short-length dispersion tailored lead silicate holey fibers, Opt. Express 15, pp (2007). 7. T. M. Monro, D. J. Richardson, N. G. R. Broderick, and P. J. Bennett, "Holey optical fibers: An efficient modal model," J. Lightwave Technol. 17, (1999). 8. F. Poletti, V. Finazzi, T. M. Monro, N. G. R. Broderick, V. Tse, and D. J. Richardson, "Inverse design and fabrication tolerances of ultra-flattened dispersion holey fibers," Opt. Express 13, (2005).
288 APPENDIX 1 Measured refractive index data The generalized Sellmeier equation is: n = A0 + A1 λμ + A2λ μ + A3λ μ + A4λ μ + A5λ μ where λ μ is the wavelength in microns and n is the linear refractive index. The measured index data is taken from the Schott glass catalog for the SF57 Schott glass. SF57 λ (μm) n A 0 A 1 A 2 A 3 A 4 A e e-5 263
289 APPENDIX 2 (I) Glass Disc Preparation Glass disc and dies cleaning prior extrusion process A. Sample I: T1 and WW1 SF57 glass disc for T1 and WW1 The figure above shows the SF57 glass disc used in producing T1. The glass disc was ultrasonically drilled from a SF57 glass block (108 SF57/28D) by SKAN Company. It was cleaned in ultrasonic bath with methanol for 10 minutes. The dies were also thoroughly cleaned in heavy duty cleaner (Denco 90) and an ultrasonic bath at temperature 40 0 C for 20minutes. After which, they were soaked in methanol and cleaned in an ultrasonic bath for another 10 minutes without applying heat. B. Sample II: T2 and WW2 The ultrasonic drilling and cleaning conditions are the same as T1 except the drilling was done in ORC Mechanical Workshop. 264
290 APPENDIX 2 (II) Extrusion Process Glass extrusion is preformed by using hydraulic system A. Before starting extrusion: 1. Check assembly of every part; make sure they are correctly fitted. 2. Make sure every part in the assembly is cleaned. B. Assembly of glass holder: 1. Make sure all parts (die, sleeve, stainless steel (ss) sheet, graphite sheet and piston), parent body (body, lid and screw) and glass disc are readily prepared. 2. Die in place, match thermo-couple hole (note alignment) 3. Add sleeve 4. Add glass disk 5. Add ss sheet 6. Add graphite sheet 7. Add piston 8. Make sure every part is tightly fitted 9. Lid and screw (note alignment) C. Assembly in rig: Preset of desired pressure 1. Use a dummy first instead of the assembled holder. 2. Put a steel shield before the ram 3. Assemble the ram, the dolly and the assembled holder. 4. Turn on the main switch of the hydraulic system. 5. Set the dial according to the desired pressure 6. Turn on the pump and ramp down to meet the dummy (slowly and carefully), make sure the dummy and the dolly are not fixed too tightly. 265
291 7. Turn off the pump and switch off the controller power. Final Assembly 1. Remove the dummy and replace it with the assembled holder (check alignment). 2. Insert thermo-couple. 3. Dolly in and a steel shield is placed between dolly and ram. 4. Turn on the pump and ramp down to meet the assembled holder. 5. Close the furnace and lock it. 6. Set the gauge C. Extrusion process: 1. Adjust the desired temperature in Zone Adjust the desired temperature in Zone Wait for the temperatures to reach the setting values. 4. Switch on the pressure controller. 5. Set the desired pressure. 6. Extrusion begins. D. End of extrusion: 1. Press on the stop button. 2. Turn off the pump 3. Set the dial back to zero 4. Turn pressure controller off. 5. Put a sand bottle down below the guiding tube to support the fallen perform 6. The temperatures of Zone1 and Zone 2 are set to zero. 7. Turn off the lamp and the thermo-coupler. 8. Disassemble. 266
292 APPENDIX 2 (III, IV) Cleaning Process (III) Glass disc and dies cleaning prior extrusion process A. Die and parts cleaning: 1. Fill in deionised water to the shoulder length of the Ultrasonic Bath device. Add in some washing liquid (Denco 90). 2. Preheat the Ultrasonic Bath device at 60 0 C. 3. Soak the die and parts in a beaker that contains heavy duty detergent. 4. Place the beaker in the Ultrasonic Bath device. 5. Set the temperature to 40 0 C and clean them for 30 minutes. 6. Clean the die, parts and the beaker thoroughly with of running water. 7. Blow dry with nitrogen. 8. Clean the die and parts again by soaking in methanol for 10minutes without heating application. 9. Blow dry with nitrogen. 10. Repeat step 3-9 if the die and part are not fully cleaned. B. Glass cleaning: 1. Soak the glass in a beaker containing methanol. 2. Place the beaker in the Ultrasonic Bath device. 3. Turn on the device for 20 minutes without applying heat. 4. Repeat step 1-3 if the glass is not fully cleaned. Note: Do not apply heat when methanol is used. The maximum temperature for methanol is <40 0 C! 267
293 (IV) Extruded preforms cleaning prior drawing A. Jacketing tube 1. Fill in deionised water to the shoulder length of the Ultrasonic Bath device. Add in some washing liquid (Denco 90). 2. Soak the preform in a beaker that contains diluted heavy duty detergent, Micro Solution 90 (used by silica group to clean silica preforms). 3. Place the beaker in the Ultrasonic Bath device and clean for minutes without applying heat. 4. Clean the preform and the beaker thoroughly with running water. 5. Blow dry with nitrogen. 6. Clean the preform again by soaking it in the deionised water (to get rid of the detergen) for another minutes. 7. Blow dry with nitrogen. 8. Again, clean the preform by soaking it in methanol for 10-15minutes without applying heat. 9. Blow dry with nitrogen. 10. Repeat step 4-9 if the preform is not fully cleaned. B. Structured perform 1. Soak the preform in a beaker containing methanol. 2. Place the beaker in the Ultrasonic Bath device. 3. Turn on the device for minutes without applying heat. 4. Repeat step 1-3 if the glass is not fully cleaned. 268
294 APPENDIX 2 (V) Annealing Extruded structured performs, extruded jacketing tubes and canes are annealed in order to eliminate thermal stress A. Before starting: 1. Silicon basins are place in the furnace as the support for preform. B. Setting: 1. Turn On the furnace by pressing the open programme button. 2. Set the ramp rate (estimated programmable rate) to 120 o C/h or 2 o C/minute. 3. Set the level which is the desired temperature: 490 o C. 4. Set the dwell time = 1 hour/ 60 minutes (slowly so doesn t create nuclei) 5. Set cycle =1. 6. Set the 2 nd ramp rate to 30 o C 7. Set the 2 nd level to 20 o C. 8. Set the 2 nd dwell time to end. C. End of setting 1. Leave the preform to anneal overnight, probably around 18hours. Note: Annealing: to remove stress, prevent fibre/ preform breaks when fibre drawing/caning. 269
295 APPENDIX 3 Other applications of the SEST HF Other applications of the SEST HF apart of the main SC application include FWM. Papers on experiments associated with this application are shown in this section. 1. S.Asimakis, P.Petropoulos, F.Poletti, J.Y.Y.Leong, H.Ebendorff- Heidepriem, R.C.Moore, K.E.Frampton, X.Feng, W.H.Loh, T.M.Monro, D.J.Richardson, Efficient four-wave-mixing at 1.55 microns in a shortlength dispersion shifted lead silicate holey fibre, ECOC 2006 Cannes, Sept S.Asimakis, P.Petropoulos, F.Poletti, J.Y.Y.Leong, R.C.Moore, K.E.Frampton, X.Feng, W.H.Loh, D.J.Richardson, Towards efficient and broadband four-wave-mixing using short-length dispersion tailored lead silicate holey fibers, Opt. Express 15, pp (2007) 270
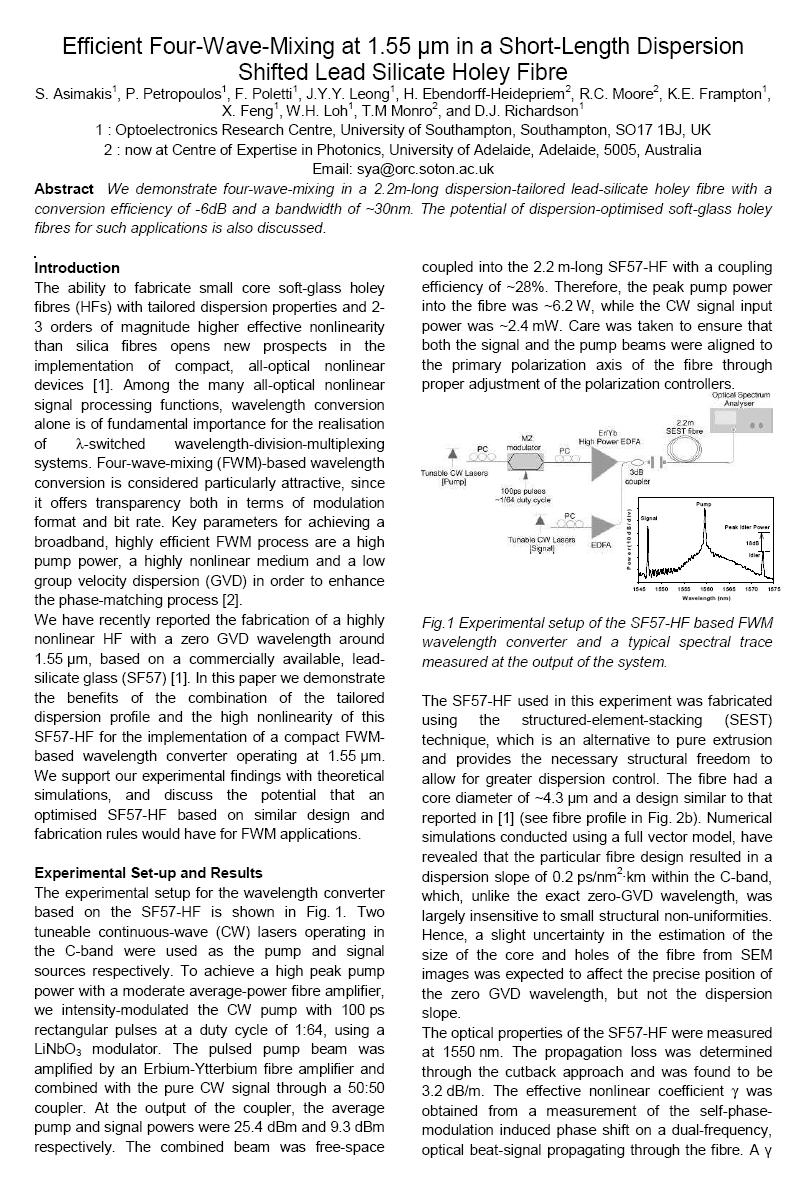
296 271
297 272
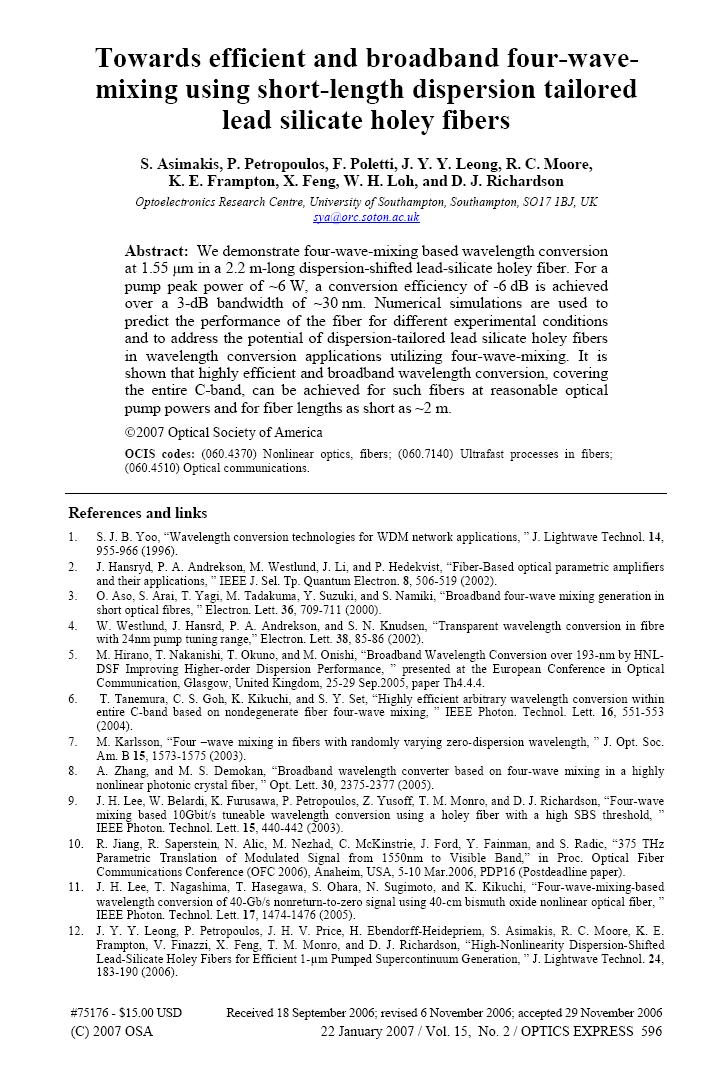
298 273
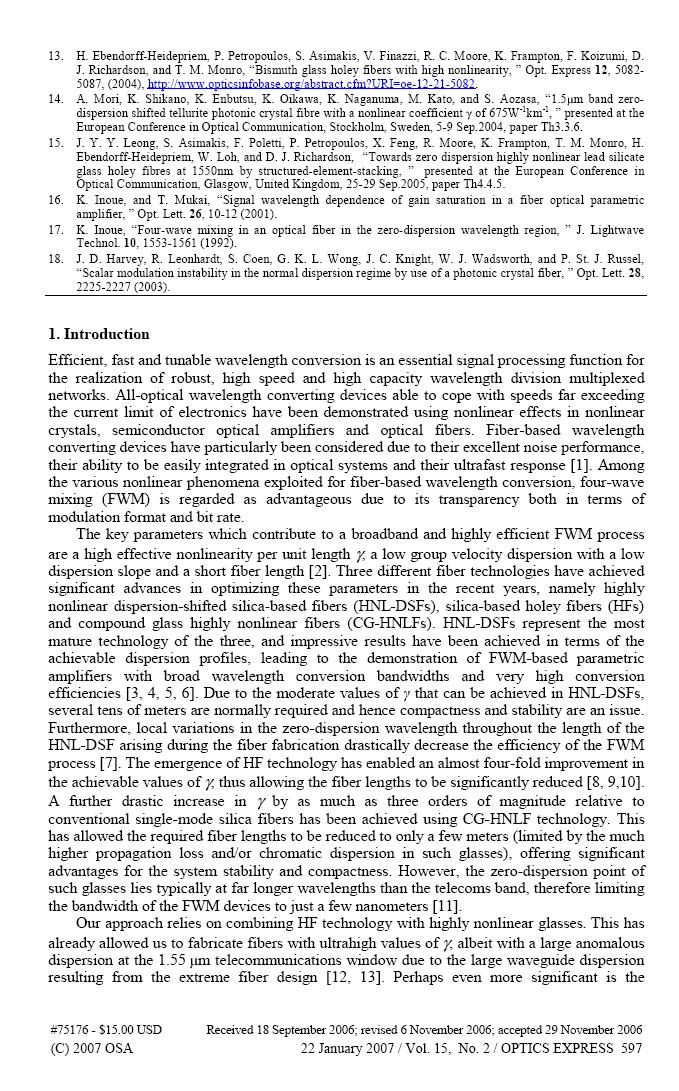
299 274
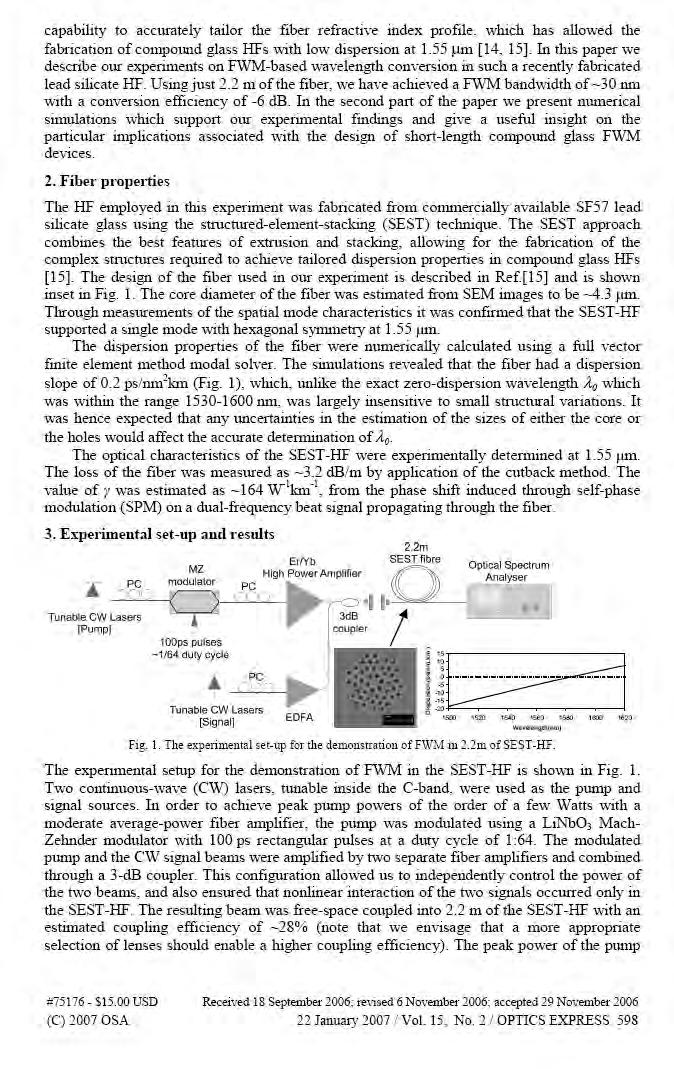
300 275
301 276
302 277
303 278
Highly Nonlinear Fibers and Their Applications
 1/32 Highly Nonlinear Fibers and Their Applications Govind P. Agrawal Institute of Optics University of Rochester Rochester, NY 14627 c 2007 G. P. Agrawal Introduction Many nonlinear effects inside optical
Demonstration of ultra-flattened dispersion in photonic crystal fibers
 Demonstration of ultra-flattened dispersion in photonic crystal fibers W.H. Reeves, J.C. Knight, and P.St.J. Russell Optoelectronics Group, School of Physics, University of Bath, Claverton Down, Bath,
Finite Element Method
 Appendix A Finite Element Method A.1 Formulation All the analyses of the PCF properties presented in this book have been performed by using the FEM. The FEM allows the PCF cross-section in the transverse
Fiber-Optics Group Highlights of Micronova Department of Electrical and Communications Engineering Helsinki University of Technology
 Highlights of 2004 Micronova Department of Electrical and Communications Engineering Micronova Seminar 3 December 2004 Group Leader: Hanne Ludvigsen Postdoctoral researcher: Goëry Genty Postgraduate students:
Copyright 2008 IEEE. Reprinted from IEEE Journal of Selected Topics in Quantum Electronics, 2007; 13 (3):
:") Copyright 2008 IEEE. Reprinted from IEEE Journal of Selected Topics in Quantum Electronics, 2007; 13 (3):738-749 This material is posted here with permission of the IEEE. Such permission of the IEEE does
Copyright 2008 IEEE. Reprinted from IEEE Journal of Selected Topics in Quantum Electronics, 2007; 13 (3):738-749 This material is posted here with permission of the IEEE. Such permission of the IEEE does
Highly Birefringent Elliptical-Hole Microstructure Fibers With Low Confinement Loss
 JOURNAL OF LIGHTWAVE TECHNOLOGY, VOL. 30, NO. 21, NOVEMBER 1, 2012 3381 Highly Birefringent Elliptical-Hole Microstructure Fibers With Low Confinement Loss Wenbin Liang, Ningliang Liu, Zhihua Li, and Peixiang
JOURNAL OF LIGHTWAVE TECHNOLOGY, VOL. 24, NO. 1, JANUARY /$ IEEE
 JOURNAL OF LIGHTWAVE TECHNOLOGY, VOL. 24, NO. 1, JANUARY 2006 183 High-Nonlinearity Dispersion-Shifted Lead-Silicate Holey Fibers for Efficient 1-µm Pumped Supercontinuum Generation J. Y. Y. Leong, P.
Analysis and Modeling of Microstructured Fiber Using The Analytical Method Based on The Empirical Equation
 Analysis and Modeling of Microstructured Fiber Using The Analytical Method Based on The Empirical Equation DEBBAL Mohammed 1, CHIKH-BLED Mohammed 2 1 University of Tlemcen, Algeria, Department of electrical
Polarization Properties of Photonic Crystal Fibers Considering Thermal and External Stress Effects
 Polarization Properties of Photonic Crystal Fibers Considering Thermal and External Stress Effects Md. Afzal Hossain*, M. Shah Alam** * Department of Computer Science and Engineering Military Institute
Sources supercontinuum visibles à base de fibres optiques microstructurées
 Sources supercontinuum visibles à base de fibres optiques microstructurées P. Leproux XLIM - Université de Limoges Journées Thématiques CMDO+, Palaiseau, 24-25 nov. 2008 Palaiseau, 25/11/2008 - P. Leproux
The Glass Ceiling: Limits of Silica. PCF: Holey Silica Cladding
 The Glass Ceiling: Limits of Silica Loss: amplifiers every 50 100km limited by Rayleigh scattering (molecular entropy) cannot use exotic wavelengths like 10.µm Breaking the Glass Ceiling: Hollow-core Bandgap
Maximizing the Bandwidth from Supercontinuum Generation in Photonic Crystal Chalcogenide Fibers
 Maximizing the Bandwidth from Supercontinuum Generation in Photonic Crystal Chalcogenide Fibers Curtis R. Menyuk based on the PhD dissertation of: Dr. Jonathan Hu now at Princeton University 1 Report Documentation
International Conference on Information Sciences, Machinery, Materials and Energy (ICISMME 2015)
") International Conference on Information Sciences, Machinery, Materials and Energy (ICISMME 2015) Numerical modelling the ultra-broadband mid-infrared supercontinuum generation in the As2Se3 photonic crystal
International Conference on Information Sciences, Machinery, Materials and Energy (ICISMME 2015) Numerical modelling the ultra-broadband mid-infrared supercontinuum generation in the As2Se3 photonic crystal
Nonlinear effects and pulse propagation in PCFs
 Nonlinear effects and pulse propagation in PCFs --Examples of nonlinear effects in small glass core photonic crystal fibers --Physics of nonlinear effects in fibers --Theoretical framework --Solitons and
Fiber Gratings p. 1 Basic Concepts p. 1 Bragg Diffraction p. 2 Photosensitivity p. 3 Fabrication Techniques p. 4 Single-Beam Internal Technique p.
 Preface p. xiii Fiber Gratings p. 1 Basic Concepts p. 1 Bragg Diffraction p. 2 Photosensitivity p. 3 Fabrication Techniques p. 4 Single-Beam Internal Technique p. 4 Dual-Beam Holographic Technique p. 5
Title. Author(s)Nagasaki, Akira; Saitoh, Kunimasa; Koshiba, Masanori. CitationOptics Express, 19(4): Issue Date Doc URL.
Nagasaki, Akira; Saitoh, Kunimasa; Koshiba, Masanori. CitationOptics Express, 19(4): Issue Date Doc URL.") Title Polarization characteristics of photonic crystal fib Author(s)Nagasaki, Akira; Saitoh, Kunimasa; Koshiba, Masanori CitationOptics Express, 19(4): 3799-3808 Issue Date 2011-02-14 Doc URL http://hdl.handle.net/2115/45257
Title Polarization characteristics of photonic crystal fib Author(s)Nagasaki, Akira; Saitoh, Kunimasa; Koshiba, Masanori CitationOptics Express, 19(4): 3799-3808 Issue Date 2011-02-14 Doc URL http://hdl.handle.net/2115/45257
SUPER-LATTICE STRUCTURE PHOTONIC CRYSTAL FIBER
 Progress In Electromagnetics Research M, Vol. 11, 53 64, 2010 SUPER-LATTICE STRUCTURE PHOTONIC CRYSTAL FIBER D. Chen, M.-L. V. Tse, and H. Y. Tam Photonics Research Centre, Department of Electrical Engineering
Empirical formulae for hollow-core antiresonant fibers: dispersion and effective mode area
 Empirical formulae for hollow-core antiresonant fibers: dispersion and effective mode area MD IMRAN HASAN, * NAIL AKHMEDIEV, AND WONKEUN CHANG Optical Sciences Group, Research School of Physics and Engineering,
Negative curvature fibers
 504 Vol. 9, No. 3 / September 2017 / Advances in Optics and Photonics Review Negative curvature fibers CHENGLI WEI, 1 R. JOSEPH WEIBLEN, 2 CURTIS R. MENYUK, 2 AND JONATHAN HU 1,* 1 Department of Electrical
Chapter 24 Photonics Question 1 Question 2 Question 3 Question 4 Question 5
 Chapter 24 Photonics Data throughout this chapter: e = 1.6 10 19 C; h = 6.63 10 34 Js (or 4.14 10 15 ev s); m e = 9.1 10 31 kg; c = 3.0 10 8 m s 1 Question 1 Visible light has a range of photons with wavelengths
Chalcogenide glass Photonic Crystal Fiber with flattened dispersion and high nonlinearity at telecommunication wavelength
 Chalcogenide glass Photonic Crystal Fiber with flattened dispersion and high nonlinearity at telecommunication wavelength S.REVATHI #, ABHIJITH CHANDRAN #, A. AMIR #3, SRINIVASA RAO INBATHINI #4 # School
University of Southampton Research Repository eprints Soton
 University of Southampton Research Repository eprints Soton Copyright and Moral Rights for this thesis are retained by the author and/or other copyright owners. A copy can be downloaded for personal non-commercial
Photonic crystal fiber with a hybrid honeycomb cladding
 Photonic crystal fiber with a hybrid honeycomb cladding Niels Asger Mortensen asger@mailaps.org Martin Dybendal Nielsen COM, Technical University of Denmark, DK-2800 Kongens Lyngby, Denmark Jacob Riis
STUDIES ON PHOTONIC BANDGAP BRAGG FIBERS AND WAVEGUIDES
 STUDIES ON PHOTONIC BANDGAP BRAGG FIBERS AND WAVEGUIDES by SONALI DASGUPTA Department of Physics Submitted in fulfillment of the requirements of the degree of Doctor of Philosophy to the INDIAN INSTITUTE
Optical and Photonic Glasses. Lecture 30. Femtosecond Laser Irradiation and Acoustooptic. Professor Rui Almeida
 Optical and Photonic Glasses : Femtosecond Laser Irradiation and Acoustooptic Effects Professor Rui Almeida International Materials Institute For New Functionality in Glass Lehigh University Femto second
Tailoring Nonlinearity and Dispersion of Photonic Crystal Fibers Using Hybrid Cladding
 5 Liu Zhao-lun et al. Tailoring Nonlinearity and Dispersion of Photonic Crystal Fibers Using Hybrid Cladding Liu Zhao-lun, Hou Lan-tian, and Wang Wei Institute of Infrared Optical Fibers and Sensors, Yanshan
Optical Fiber Signal Degradation
 Optical Fiber Signal Degradation Effects Pulse Spreading Dispersion (Distortion) Causes the optical pulses to broaden as they travel along a fiber Overlap between neighboring pulses creates errors Resulting
Nonlinear Optical Effects in Fibers
 Nonlinear Optical Effects in Fibers NLO effects are manifested as attenuation, phase shifts, or wavelength conversion effects, and become stronger with increasing light intensity. The glass materials usually
SPECTRAL PROPERTIES OF m InGaAsP SEMICONDUCTOR DIODE LASERS JOSEPH EDWARD HAYWARD, B.ENG, M.ENG. A Thesis
 SPECTRAL PROPERTIES OF 1.3 11m InGaAsP SEMICONDUCTOR DIODE LASERS By JOSEPH EDWARD HAYWARD, B.ENG, M.ENG A Thesis Submitted to the School of Graduate Studies in Partial Fulfilment of the Requirements for
Generation of supercontinuum light in photonic crystal bers
 Generation of supercontinuum light in photonic crystal bers Koji Masuda Nonlinear Optics, Fall 2008 Abstract. I summarize the recent studies on the supercontinuum generation (SC) in photonic crystal fibers
University of Bath. Publication date: Document Version Peer reviewed version. Link to publication
 Citation for published version: Knight, J 2011, Photonic crystal and microstructured fibers: Making fibers better by leaving bits out. in 2011 Optical Fiber Communication Conference and Exposition and
Chapter 5. Effects of Photonic Crystal Band Gap on Rotation and Deformation of Hollow Te Rods in Triangular Lattice
 Chapter 5 Effects of Photonic Crystal Band Gap on Rotation and Deformation of Hollow Te Rods in Triangular Lattice In chapter 3 and 4, we have demonstrated that the deformed rods, rotational rods and perturbation
Dispersion Properties of Photonic Crystal Fiber with Four cusped Hypocycloidal Air Holes in Cladding
 IOSR Journal of Electronics and Communication Engineering (IOSR-JECE) e-issn: 78-834,p- ISSN: 78-8735.Volume 1, Issue 1, Ver. III (Jan.-Feb. 17), PP 35-39 www.iosrjournals.org Dispersion Properties of
Design of Seven-core Photonic Crystal Fiber with Flat In-phase Mode for Yb: Fiber Laser Pumping
 Optics and Photonics Journal, 2013, 3, 197-201 doi:10.4236/opj.2013.32b047 Published Online June 2013 (http://www.scirp.org/journal/opj) Design of Seven-core Photonic Crystal Fiber with Flat In-phase Mode
Design and Modal Analysis of Photonic Crystal Fiber for Dispersion Compensation over Broadband Range
 365 Design and Modal Analysis of Photonic Crystal Fiber for Dispersion Compensation over Broadband Range Madhavi Waghmare 1, K.T.V.Reddy 2, 1. Research Scholar, Department of Electronics and Telecommunication
MODAL EXPANSION THEORIES FOR SINGLY - PERIODIC DIFFRACTION GRATINGS
 MODAL EXPANSION THEORIES FOR SINGLY - PERIODIC DIFFRACTION GRATINGS by.r. Andrewartha, B.Sc.(Hons.), University of Tasmania A thesis submitted in fulfilment of the requirements for the degree of Doctor
Enhancement of the Sensitivity of Gas Sensor Based on Microstructure Optical Fiber
 PHOTONIC SENSORS / Vol., No. 4, 2: 312 32 Enhancement of the Sensitivity of Gas Sensor Based on Microstructure Optical Fiber Monir MORSHED 1*, Md. Imran HASAN 2, and S. M. Abdur RAZZAK 3 1 Department of
Electromagnetic Wave Guidance Mechanisms in Photonic Crystal Fibers
 Electromagnetic Wave Guidance Mechanisms in Photonic Crystal Fibers Tushar Biswas 1, Shyamal K. Bhadra 1 1 Fiber optics and Photonics Division, CSIR-Central Glass and Ceramic Research Institute *196, Raja
PHOTONIC BANDGAP FIBERS
 UMEÅ UNIVERSITY May 11, 2010 Department of Physics Advanced Materials 7.5 ECTS PHOTONIC BANDGAP FIBERS Daba Dieudonne Diba dabadiba@gmail.com Supervisor: Andreas Sandström Abstract The constant pursuit
Polarization mode dispersion reduction in spun large mode area silica holey fibres
 Polarization mode dispersion reduction in spun large mode area silica holey fibres M. Fuochi 1,, J.R. Hayes 1, K. Furusawa 1, W. Belardi 1, J.C. Baggett 1, T.M. Monro 1,.J. Richardson 1 1 Optoelectronics
OPTI510R: Photonics. Khanh Kieu College of Optical Sciences, University of Arizona Meinel building R.626
 OPTI510R: Photonics Khanh Kieu College of Optical Sciences, University of Arizona kkieu@optics.arizona.edu Meinel building R.626 Announcements Homework #4 is assigned, due March 25 th Start discussion
Characterisation of polarised supercontinuum generation and its focal field
 Characterisation of polarised supercontinuum generation and its focal field A thesis submitted for the degree of Doctor of Philosophy by Brendan James Chick Centre for Micro-Photonics Faculty of Engineering
Laser Physics OXFORD UNIVERSITY PRESS SIMON HOOKER COLIN WEBB. and. Department of Physics, University of Oxford
 Laser Physics SIMON HOOKER and COLIN WEBB Department of Physics, University of Oxford OXFORD UNIVERSITY PRESS Contents 1 Introduction 1.1 The laser 1.2 Electromagnetic radiation in a closed cavity 1.2.1
Practical 1P4 Energy Levels and Band Gaps
 Practical 1P4 Energy Levels and Band Gaps What you should learn from this practical Science This practical illustrates some of the points from the lecture course on Elementary Quantum Mechanics and Bonding
Optics, Optoelectronics and Photonics
 Optics, Optoelectronics and Photonics Engineering Principles and Applications Alan Billings Emeritus Professor, University of Western Australia New York London Toronto Sydney Tokyo Singapore v Contents
Progress In Electromagnetics Research B, Vol. 22, 39 52, 2010
 Progress In Electromagnetics Research B, Vol. 22, 39 52, 2010 A COMPARATIVE STUDY OF HIGH BIREFRINGENCE AND LOW CONFINEMENT LOSS PHOTONIC CRYSTAL FIBER EMPLOYING ELLIPTICAL AIR HOLES IN FIBER CLADDING
Mode-Field Diameter (MFD)
") Mode-Field Diameter (MFD) Important parameter determined from mode-field distribution of fundamental LP 01 mode. Characterized by various models Main consideration: how to approximate the electric field
Mode-Field Diameter (MFD) Important parameter determined from mode-field distribution of fundamental LP 01 mode. Characterized by various models Main consideration: how to approximate the electric field
QUESTION BANK IN PHYSICS
 QUESTION BANK IN PHYSICS LASERS. Name some properties, which make laser light different from ordinary light. () {JUN 5. The output power of a given laser is mw and the emitted wavelength is 630nm. Calculate
Geometrical parameters dependence towards ultra-flat dispersion square-lattice PCF with selective liquid infiltration
 Geometrical parameters dependence towards ultra-flat dispersion square-lattice PCF with selective liquid infiltration Partha Sona Maji and Partha Roy Chaudhuri Department of Physics & Meteorology, Indian
Fundamentals of fiber waveguide modes
 SMR 189 - Winter College on Fibre Optics, Fibre Lasers and Sensors 1-3 February 007 Fundamentals of fiber waveguide modes (second part) K. Thyagarajan Physics Department IIT Delhi New Delhi, India Fundamentals
Coherent Raman imaging with fibers: From sources to endoscopes
 Coherent Raman imaging with fibers: From sources to endoscopes Esben Ravn Andresen Institut Fresnel, CNRS, École Centrale, Aix-Marseille University, France Journées d'imagerie vibrationelle 1 Jul, 2014
Thermal Effects Study on Stimulated Brillouin Light Scattering in Photonic Crystal Fiber
 International Journal of Optics and Photonics (IJOP) Vol. 6, No. 2, Summer-Fall 2012 Thermal Effects Study on Stimulated Brillouin Light Scattering in Photonic Crystal Fiber R. Parvizi a,b a Department
Practical 1P4 Energy Levels and Band Gaps
 Practical 1P4 Energy Levels and Band Gaps What you should learn from this practical Science This practical illustrates some of the points from the lecture course on Elementary Quantum Mechanics and Bonding
Research Article Designing an Ultra-Negative Dispersion Photonic Crystal Fiber with Square-Lattice Geometry
 ISRN Optics, Article ID 545961, 7 pages http://dx.doi.org/1.1155/214/545961 Research Article Designing an Ultra-Negative Dispersion Photonic Crystal Fiber with Square-Lattice Geometry Partha Sona Maji
The coldest place in Ireland
 Snapshots of Doctoral Research at University College Cork 2011 Laura Russell Physics Department, UCC Introduction Did you know that the Quantum Optics Laboratory in Tyndall National Institute is the coldest
Butje Alfonsius Louk Fanggi
 AXIAL COMPRESSIVE BEHAVIOR OF FRP-CONCRETE-STEEL DOUBLE-SKIN TUBULAR COLUMNS Butje Alfonsius Louk Fanggi BEng and MEng (Structural Engineering) Thesis submitted to The University of Adelaide School of
Multi-cycle THz pulse generation in poled lithium niobate crystals
 Laser Focus World April 2005 issue (pp. 67-72). Multi-cycle THz pulse generation in poled lithium niobate crystals Yun-Shik Lee and Theodore B. Norris Yun-Shik Lee is an assistant professor of physics
Introducing Defects in Photonic Band-Gap (PBG) Crystals. Elliott C. Johnson
 Crystals. Elliott C. Johnson") Introducing Defects in Photonic Band-Gap (PBG) Crystals Elliott C. Johnson Office of Science, Science Undergraduate Laboratory Internship (SULI) North Dakota State University Stanford Linear Accelerator
Introducing Defects in Photonic Band-Gap (PBG) Crystals Elliott C. Johnson Office of Science, Science Undergraduate Laboratory Internship (SULI) North Dakota State University Stanford Linear Accelerator
Plastic Coated Silica/Silica (Low OH) FIBER CROSS SECTION Polyimide and Acrylate Coated. Nylon and Tefzel Coated
 FIBER CROSS SECTION Polyimide and Acrylate Coated. Nylon and Tefzel Coated") DESCRIPTION When looking for a high quality fiber with superior transmission and a numerical aperture (N.A.) of 0.22 for efficient light coupling, the is the fiber of choice. The Anhydroguide fiber is
DESCRIPTION When looking for a high quality fiber with superior transmission and a numerical aperture (N.A.) of 0.22 for efficient light coupling, the is the fiber of choice. The Anhydroguide fiber is
Charge collection in PET detectors
 University of Wollongong Research Online University of Wollongong Thesis Collection 1954-2016 University of Wollongong Thesis Collections 2007 Charge collection in PET detectors Tony Young University of
Analysis of Single Mode Step Index Fibres using Finite Element Method. * 1 Courage Mudzingwa, 2 Action Nechibvute,
 Analysis of Single Mode Step Index Fibres using Finite Element Method. * 1 Courage Mudzingwa, 2 Action Nechibvute, 1,2 Physics Department, Midlands State University, P/Bag 9055, Gweru, Zimbabwe Abstract
Let us consider a typical Michelson interferometer, where a broadband source is used for illumination (Fig. 1a).
.") 7.1. Low-Coherence Interferometry (LCI) Let us consider a typical Michelson interferometer, where a broadband source is used for illumination (Fig. 1a). The light is split by the beam splitter (BS) and
7.1. Low-Coherence Interferometry (LCI) Let us consider a typical Michelson interferometer, where a broadband source is used for illumination (Fig. 1a). The light is split by the beam splitter (BS) and
Interferometry and precision measurements with Bose-condensed atoms
 Interferometry and precision measurements with Bose-condensed atoms Daniel Döring A thesis submitted for the degree of Doctor of Philosophy of The Australian National University. April 2011 Declaration
Polarization control of defect modes in threedimensional woodpile photonic crystals
 Polarization control of defect modes in threedimensional woodpile photonic crystals Michael James Ventura and Min Gu* Centre for Micro-Photonics and Centre for Ultrahigh-bandwidth Devices for Optical Systems,
Photonic Communications Engineering I
 Photonic Communications Engineering I Module 3 - Attenuation in Optical Fibers Alan E. Willner Professor, Dept. of Electrical Engineering - Systems, University of Southern California and Thrust 1 Lead
Design of a Polarization Maintaining Large Negative Dispersion PCF Using Rectangular Lattice
 Design of a Polarization Maintaining Large Negative Dispersion PCF Using Rectangular Lattice Sharafat Ali, Nasim Ahmed, Monirul Islam, S. A. Aljunid, R. B. Ahmad, H. Jaman, and S. Habib Abstract In this
Principle of photonic crystal fibers
 Principle of photonic crystal fibers Jan Sporik 1, Miloslav Filka 1, Vladimír Tejkal 1, Pavel Reichert 1 1 Fakulta elektrotechniky a komunikačních technologií VUT v Brně Email: {xspori1, filka, xtejka,
Doctor of Philosophy
 FEMTOSECOND TIME-DOMAIN SPECTROSCOPY AND NONLINEAR OPTICAL PROPERTIES OF IRON-PNICTIDE SUPERCONDUCTORS AND NANOSYSTEMS A Thesis Submitted for the degree of Doctor of Philosophy IN THE FACULTY OF SCIENCE
DUAL CORE PHOTONIC CRYSTAL FIBER WITH HIGH NEGATIVE DISPERSION AND LOW COUPLING LENGTH
 DUAL CORE PHOTONIC CRYSTAL FIBER WITH HIGH NEGATIVE DISPERSION AND LOW COUPLING LENGTH Mangesh M. Landge 1, Revathi S. 2, Vinay P. Sigedar 1 and Aditya Chourasia 1 1 Department of Communication Engineering
Propagation losses in optical fibers
 Chapter Dielectric Waveguides and Optical Fibers 1-Fev-017 Propagation losses in optical fibers Charles Kao, Nobel Laureate (009) Courtesy of the Chinese University of Hong Kong S.O. Kasap, Optoelectronics
Chemistry 524--Final Exam--Keiderling Dec. 12, pm SES
 Chemistry 524--Final Exam--Keiderling Dec. 12, 2002 --4-8 pm -- 238 SES Please answer all questions in the answer book provided. Calculators, rulers, pens and pencils are permitted plus one 8.5 x 11 sheet
Photonic Crystal Fiber based Network Components: The Future Trend in Optical Network Design
 International Journal of Current Engineering and Technology ISSN 2277 4106 2013 INPRESSCO. All Rights Reserved Available at http://inpressco.com/category/ijcet Research Article Photonic Crystal Fiber based
Alexander Gaeta Department of Applied Physics and Applied Mathematics Michal Lipson Department of Electrical Engineering
 Chip-Based Optical Frequency Combs Alexander Gaeta Department of Applied Physics and Applied Mathematics Michal Lipson Department of Electrical Engineering KISS Frequency Comb Workshop Cal Tech, Nov. 2-5,
Simulations of nanophotonic waveguides and devices using COMSOL Multiphysics
 Presented at the COMSOL Conference 2010 China Simulations of nanophotonic waveguides and devices using COMSOL Multiphysics Zheng Zheng Beihang University 37 Xueyuan Road, Beijing 100191, China Acknowledgement
SUPPLEMENTARY INFORMATION
 SUPPLEMENTARY INFORMATION Supplementary Information I. Schematic representation of the zero- n superlattices Schematic representation of a superlattice with 3 superperiods is shown in Fig. S1. The superlattice
Design of a Multi-Mode Interference Crossing Structure for Three Periodic Dielectric Waveguides
 Progress In Electromagnetics Research Letters, Vol. 75, 47 52, 2018 Design of a Multi-Mode Interference Crossing Structure for Three Periodic Dielectric Waveguides Haibin Chen 1, Zhongjiao He 2,andWeiWang
Numerical Modeling of the Fundamental Characteristics of ZBLAN Photonic Crystal Fiber for Communication in 2 3 m Midinfrared Region
 Numerical Modeling of the Fundamental Characteristics of ZBLAN Photonic Crystal Fiber for Communication in 2 3 m Midinfrared Region Volume 8, Number 2, April 2016 D. C. Tee N. Tamchek C. H. Raymond Ooi
PROCEEDINGS OF SPIE. Photonic crystal fibers as miniature monitoring platforms for petroleum characterization
 PROCEEDINGS OF SPIE SPIEDigitalLibrary.org/conference-proceedings-of-spie Photonic crystal fibers as miniature monitoring platforms for petroleum characterization Rodolfo Luiz Patyk, Cicero Martelli, Marco
Real-Time Software Transactional Memory: Contention Managers, Time Bounds, and Implementations
 Real-Time Software Transactional Memory: Contention Managers, Time Bounds, and Implementations Mohammed El-Shambakey Dissertation Submitted to the Faculty of the Virginia Polytechnic Institute and State
Effective area of photonic crystal fibers
 Effective area of photonic crystal fibers Niels Asger Mortensen Crystal Fibre A/S, Blokken 84, DK-3460 Birkerød, Denmark nam@crystal-fibre.com http://www.crystal-fibre.com Abstract: We consider the effective
Negative curvature fibers
 Negative curvature fibers presented by Jonathan Hu 1 with Chengli Wei, 1 R. Joseph Weiblen, 2,* and Curtis R. Menyuk 2 1 Baylor University, Waco, Texas 76798, USA 2 University of Maryland Baltimore County,
50%-50% Beam Splitters Using Transparent Substrates Coated by Single- or Double-Layer Quarter-Wave Thin Films
 University of New Orleans ScholarWorks@UNO University of New Orleans Theses and Dissertations Dissertations and Theses 5-22-2006 50%-50% Beam Splitters Using Transparent Substrates Coated by Single- or
Defect-based Photonic Crystal Cavity for Silicon Laser
 Defect-based Photonic Crystal Cavity for Silicon Laser Final Term Paper for Nonlinear Optics PHYC/ECE 568 Arezou Khoshakhlagh Instructor: Prof. M. Sheikh-Bahae University of New Mexico karezou@unm.edu
Bloch method for the analysis of modes in microstructured optical fibers
 Bloch method for the analysis of modes in microstructured optical fibers Boris T. Kuhlmey 1,2, Ross C. McPhedran 1 and C. Martijn de Sterke 1 1: Centre for Ultrahigh-bandwidth Devices for Optical Systems
Research Article Nonlinear Phenomena of Ultra-Wide-Band Radiation in a Photonic Crystal Fibre
 International Optics Volume 2, Article ID 3748, 6 pages doi:./2/3748 Research Article Nonlinear Phenomena of Ultra-Wide-Band Radiation in a Photonic Crystal Fibre Rim Cherif and Mourad Zghal Cirta Com
STUDIES OF PHOTONIC CRYSTALS WITH PLANE-WAVE EXPANSION METHOD
 STUDIES OF PHOTONIC CRYSTALS WITH PLANE-WAVE EXPANSION METHOD THESIS Submitted in Partial Fulfillment of the Requirements for the Degree of Sarjana in Physics at the Institut Teknologi Bandung by YUDISTIRA
Nonlinear Effects in Optical Fiber. Dr. Mohammad Faisal Assistant Professor Dept. of EEE, BUET
 Nonlinear Effects in Optical Fiber Dr. Mohammad Faisal Assistant Professor Dept. of EEE, BUET Fiber Nonlinearities The response of any dielectric material to the light becomes nonlinear for intense electromagnetic
Performance Limits of Delay Lines Based on "Slow" Light. Robert W. Boyd
 Performance Limits of Delay Lines Based on "Slow" Light Robert W. Boyd Institute of Optics and Department of Physics and Astronomy University of Rochester Representing the DARPA Slow-Light-in-Fibers Team:
Advanced Vitreous State The Physical Properties of Glass
 Advanced Vitreous State The Physical Properties of Glass Active Optical Properties of Glass Lecture 21: Nonlinear Optics in Glass-Applications Denise Krol Department of Applied Science University of California,
COMPRESSION of soliton pulses propagating in conventional
 192 IEEE JOURNAL OF QUANTUM ELECTRONICS, VOL. 44, NO. 2, FEBRUARY 2008 Designing Tapered Holey Fibers for Soliton Compression Ming-Leung V. Tse, Peter Horak, Francesco Poletti, and David J. Richardson
Applications of Nonlinear Fiber Optics. Second Edition
 Applications of Nonlinear Fiber Optics Second Edition Applications of Nonlinear Fiber Optics Second Edition GOVIND P. AGRAWAL The Institute of Optics University of Rochester Rochester, New York AMSTERDAM
Jindan Shi, Xian Feng, Peter Horak, Kangkang Chen, Peh Siong Teh, Shaif-ul Alam, Wei H. Loh, David J. Richardson, Morten Ibsen
 1 1.06μm picosecond pulsed, normal dispersion pumping for generating efficient broadband infrared supercontinuum in meter-length single-mode tellurite holey fiber with high Raman gain coefficient Jindan
Abstract... I. Acknowledgements... III. Table of Content... V. List of Tables... VIII. List of Figures... IX
 Abstract... I Acknowledgements... III Table of Content... V List of Tables... VIII List of Figures... IX Chapter One IR-VUV Photoionization Spectroscopy 1.1 Introduction... 1 1.2 Vacuum-Ultraviolet-Ionization
Nanomaterials and their Optical Applications
 Nanomaterials and their Optical Applications Winter Semester 2012 Lecture 08 rachel.grange@uni-jena.de http://www.iap.uni-jena.de/multiphoton Outline: Photonic crystals 2 1. Photonic crystals vs electronic
EVALUATION OF RADIATION DETECTOR SYSTEMS FOR MAMMOGRAPHY X-RAY UNITS. Risimati Dazmen Mavunda
 EVALUATION OF RADIATION DETECTOR SYSTEMS FOR MAMMOGRAPHY X-RAY UNITS Risimati Dazmen Mavunda Submitted to the Faculty of Science, University of the Witwatersrand, Johannesburg, South Africa, in fulfillment
Supercontinuum generation in dispersion engineered highly nonlinear (γ = 10 /W/m) As 2 S 3 chalcogenide planar waveguide
 As 2 S 3 chalcogenide planar waveguide") Supercontinuum generation in dispersion engineered highly nonlinear (γ = 10 /W/m) As 2 S 3 chalcogenide planar waveguide Michael R.E. Lamont, 1 Barry Luther-Davies, 2 Duk-Yong Choi, 2 Steve Madden, 2 and
Supercontinuum generation in dispersion engineered highly nonlinear (γ = 10 /W/m) As 2 S 3 chalcogenide planar waveguide Michael R.E. Lamont, 1 Barry Luther-Davies, 2 Duk-Yong Choi, 2 Steve Madden, 2 and
10. OPTICAL COHERENCE TOMOGRAPHY
 1. OPTICAL COHERENCE TOMOGRAPHY Optical coherence tomography (OCT) is a label-free (intrinsic contrast) technique that enables 3D imaging of tissues. The principle of its operation relies on low-coherence
Nuremberg, Paul-Gordan-Str. 6, Erlangen, Germany
 Numerical and Experimental Investigation of a Fiber-Optic Sensor Consisting of a Fiber Bragg Grating in a Two-Mode Fiber for Simultaneous Sensing of Temperature and Strain A. Siekiera 1,, R. Engelbrecht
FINITE-DIFFERENCE FREQUENCY-DOMAIN ANALYSIS OF NOVEL PHOTONIC
 FINITE-DIFFERENCE FREQUENCY-DOMAIN ANALYSIS OF NOVEL PHOTONIC WAVEGUIDES Chin-ping Yu (1) and Hung-chun Chang (2) (1) Graduate Institute of Electro-Optical Engineering, National Taiwan University, Taipei,