Introduction to Robust Statistics. Anthony Atkinson, London School of Economics, UK Marco Riani, Univ. of Parma, Italy
|
|
|
- Annabel Lewis
- 5 years ago
- Views:
Transcription
1 Introduction to Robust Statistics Anthony Atkinson, London School of Economics, UK Marco Riani, Univ. of Parma, Italy
2 Multivariate analysis
3 Multivariate location and scatter Data where the observations are x 1 column vectors Classical model: elliptical distribution (e.g. multivariate gaussian) with parameters (location) and (spread and correlation structure)
4 Remarks In the multivariate setting outliers cannot be detected by applying outlier detection rules to each variable separately There is no natural ordering of multivariate data
5 Target identify a large portion of the outliers when they are present in the data: high power provide a small number of false alarms with good data (i.e. data coming from the postulated model): low swamping
6 Bivariate data
7 Ex. animals data set Consider the Animals data set containing the logarithm of the body and brain weight of 28 animals
8 (Tukey) depth Depth is a generalization of ranking to multivariate situations. It is a nonparametric notion, since it is not assumed that the data come from a given type of distribution (e.g. elliptical). For bivariate data, the halfspace depth of a point y is the smallest number of observations in any halfplane whose boundary passes through y. Points on the outskirts have low depth, whereas points in the middle get high depth
9 Depth in 2 dimensions For example, in the figure below the Tukey depth of the red point is 2 because the heavy line has two points on its left and every other line has at least two points on its left and right.
10 Example of depth contours

11 Bagplot of the animal data
, correlation (the orientation of the bag), skewness (the shape of the bag and the outer contour), and tails (the points near the boundary of the outer contour and the")
12 Bagplot The bagplot is a bivariate generalisation of the univariate boxplot The bagplot visualizes several characteristics of the data: its location, spread (the size of the bag), correlation (the orientation of the bag), skewness (the shape of the bag and the outer contour), and tails (the points near the boundary of the outer contour and the outliers).

13 Bivariate boxplot based on convex hull peeling

14 Bivariate boxplot of the animals data

15 Bivariate boxplot of the stars data
16 Multivariate data
17 Mahalanobis distances If we estimate the parameters of N(µ,Σ) with sample mean and unbiased sample covariance matrix multivariate outliers should have large Mahalanobis Distances (MD): = (yi )T(yi ) For statistical outlier detection, we thus need cut-off values for d2i We can also assume that µ = 0 and Σ = I because MD are invariant under affine transformations
18 Tolerance ellipsoid Its boundary contains those y-values with constant MD to the mean Classical tolerance ellipsoid } with the 97.5% quantile of the distirbution with degrees of freedom We expect (for large n) that about 97.5% of the observations belong to the ellipsoid
19 (Classical) tolerance ellipsoid
20 Scatter ratios Wilks showed that under the null hypothesis of no outliers H0 : {y1 N(µ,Σ)} {y2 N(µ,Σ)}... {yn N(µ,Σ)} the n scatter ratios have a distribution
21 Outlier test A Bonferroni bound can be used to approximate the distribution of the smallest ratio or equivalently of the largest squared distance Test for outlyingness of the most extreme observations

22 Wilks rule Compute the largest squared distance At level γ, label the corresponding observation an outlier if where b1 γ/n is the 1 γ/n quantile of the distribution
23 Wilks rule - simulations 5,000 simulations for each combination of n and v. Size under the null model of no contamination: N(0,I) Power under a location-shift contamination model for one outlier: y1 N(λe, I)
24 Wilks rule - summary The Wilks rule is a statistically principled criterion for multivariate outlier detection with good properties both in small and large samples: the probability of detecting contamination increases with the amount of contamination when the data contain a single outlier this probability approaches 1 if λ is large enough the actual size of the test is very close to the nominal γ when no outlier is present These goals are achieved through: accurate distributional results: Beta distribution recognition that we perform n simultaneous tests: compute the largest squared Mahalanobis distance But...
25 With more than 1 outlier, what is the proportion of outliers detected by the Wilks rule? Wilks rule - many outliers Nominal size: γ = 0.01, n = 200, v = 5. 5,000 simulations for each λ. Left panel: 5% of the observations are contaminated Right panel: 20% of the observations are contaminated Wilks rule is ineffective: this phenomenon is known as masking
26 Masking Masking occurs because the classical estimates (sample mean) and (unbiased sample covariance matrix) are grossly biased by the presence of many (extreme) outliers. Ex. Stars data The ellipses represent 0.99 probability contours. The large ellipse is based on and. The small ellipse is obtained by computing robust high-breakdown estimates of µ and Σ!
27 Breakdown point In regression we used the expression: «bounded and also bounded away from the boundary of the parameter space» Dispersion matrices: parameter space consists of the set of symmetric non negative definite matrices Each matrix has eigenvalues and eigenvectors. «bounded and also bounded away from the boundary of the parameter space» means: the eigenvalues are bounded away from 0 and infinity
28 Efficiency All affine equivariant location estimates (when data are from N() have an asymptotic covariance matrix of the form where is a constant depending on the estimate. Consequence: the normal distribution efficiency of an affine equivariant location estimate is independent of and
29 Multivariate M estimators The multivariate M-estimate of location and dispersion are defined as the solution of the following system of equations (estimating equations) where the functions W1 and W2 need not to be equal If function W2 is non decreasing, the solution to this system of equation is called monotone multivariate M estimates, while if W2 is redescending the solutions are called redescending multivariate M-estimates
30 Properties of multivariate M estimators Note that from we can express as a weighted mean, with weights depending on the outlying measure (weighted mean with data dependent weights) / Multivariate M estimates are affine equivariant and asymptotically have a multivariate normal distribution.
31 Numerical computations of multivariate estimates Start with initial estimates and (vector of coordinatewise medians and the diagonal matrix with the squared normalized MADs of the variables in the diagonal). At iteration k let and compute / )
32 M and S estimators Just as with the regression estimates where we aimed at making the residuals "small", we shall define multivariate estimates of location and dispersion that make the distances di small. To this purpose we look for and some measure of largeness of, ). Avoid spurious solutions: exclude solutions for which the smallest eigenvalue of is zero If impose constraint =1
33 M and S estimators Minimize a robust estimate of scale If is an M scale estimate which satisfies where ρ is a smooth bounded ρ-function, we obtain the class of S estimates. K for consistency is chosen as
34 Characteristics of S estimates of multivariate location and scatter Affine equivariant BDP, Bounded influence function (Fisher)-consistent and asymptotically normal Constant c in Tukey biweight controls bdp (and eff) Efficiency is low
35 MM estimators The MM estimator of location and shape is defined as the minimum of the following f function where ρ2 is possibly another ρ function which provides higher efficiency than the previous ρ at the null multivariate normal model. Function f is minimized with respect to µ and Ʃ for fixed. is any auxiliary robust scale estimate, however it is common to use and as starting values of location and shape, those which come out from the S estimator (that is and )
36 MM estimators The MM estimate of scatter is given by = S estimator of scale is tuned for robustness (high bdp) Redescending M-estimator is tuned for high efficiency Claim: highly robust and efficient!

37 Explanation for the failure of multivariate MM estimators =200 =2 δ=0.30 shift of 3

38 Iteration 1 in the MM loop

39 Iteration 4 in the MM loop

40 Iteration 1, 4, 7, 8 in the MM loop
41 MVE estimate If we take (to mimic the approach that results in the LMS in regression) the sample median of the Mahalanobis distances, the resulting location and dispersion matrix estimate is called minimum volume ellipsoid (MVE) estimate The name comes from the fact that among all ellipsoids {y: d(y, µ, Ʃ)} containing at least half of the data points, the one given by the MVE estimate has minimum volume. The consistency rate of MVE is the same slow rate as the LMS (namely )
42 MCD (Minimum covariance determinant) Idea: use a trimmed scale for instead of an M-scale (as was done to obtain LTS) More formally, let be the ordered of the squared distances, ) and for define the trimmed scale as
43 MCD (Minimum covariance determinant) y(mcd) := sub-sample of n/2 h < n observations whose covariance matrix has the smallest determinant The proportionality term kmcd(h,n,v) is crucial to ensure consistency and (approximate) unbiasedness of The proportionality term is formed by an analytic component (for consistency) and a simulation-based component (for unbiasedness) The coverage h must be fixed: usually yielding a breakdown value of 50% and 25% respectively.
44 REWEIGHTED MCD Reweighted subsample: give weight to observations for which and weight 1 otherwise Claim: improve efficiency while mantaining the same bdp Again the scaling krmcd(h,n,v) ensures consistency and unbiasedness
45 Robust RMCD Distances The outliers are revealed by their large (squared) Mahalanobis distances from the robust fit: The robust distances do not suffer from masking The common suggestion is to use the 1% or 2.5% 5% cut-off values from the asymptotic Chi-squared distribution on degrees of freedom. Ex. if 2.5% flag as outliers the obs. which do not belong to the robust tolerance ellipsoid
46 Outlier detection Outlier detection based on RMCD correctly flags the outliers in the animals data:
47 Distance-distance plot In dimensions p > 2, we cannot draw a scatterplot or a tolerance ellipsoid. To explore the differences between a classical and a robust analysis we can draw a distance-distance plot, which plots the points (MDi, RDi)
48 Computation of the MCD Exact algorithm: consider all h-subsets, compute the mean and covariance matrix of each, and retain the subset with smallest covariance determinant But: infeasible for large n or v Approximate algorithm: consider selected set of hsubsets. The most popular algorithm is FAST-MCD (Rousseeuw and Van Driessen, 1999). It uses random initial subsets. Recently a deterministic algorithm DetMCD has been developed, which is almost affine equivariant (Hubert et al., 2012).
49 Analysis of the test size of RMCD Monte Carlo estimate (50,000 simulations) of empirical size of the reweighted MCD outlier detection rule under no contamination and using a Bonferroni correction Nominal simultaneous size: 1% Some correction is needed to reduce the number of false outliers in finite samples!
50 Approach 1 Calibrate the cut-off values of the distribution of robust distances, not just its first two moments (Cerioli, Riani, and Atkinson, Stat. & Comp. 2009) Use Beta and F distribution (Cerioli, JASA 2010)
51 Performance of corrected MCD nominal size of 1% for the test of no outliers Max breakdown: h = (n + + 1)/2 Trimming at in the reweighting step 5000 simulations for each combination of n and.
52 FS: flexible power improvement The Forward Search (FS) relies on a fully-iterative adaptive trimming scheme: Order the data by closeness to the assumed model (for outlier detection: N(μ, )) Start with a small subset of observations Move Forward: increase the number of observations m used for fitting the model. The choice of the new subset (of cardinality + 1) is based on the distances computed at step Continue until Outliers and other observations not following the general structure enter at the end and can be clearly identified
53 The FS details at step := fitting subset of observations at step of the FS We compute the estimates of the centroid and covariance matrix from S() and These estimates yield squared distances Order these squared distances and take the observations corresponding to the smallest as the new subset

54 Theoretical results Cerioli, Farcomeni, and Riani, JMVA (2014) show that and are strongly consistent under the null model and have breakdown point 1 under contamination: The FS yields consistent high-breakdown estimators, but with adaptive breakdown point
55 Empirical Performance of FS Estimators Comparison with MCD and RMCD Boxplots of the values of the squared bias for the FS estimator of location, as a function of γ = m/n, for n = 100 (left) and n = 200 (right). The circles over the boxplots denote the average values The horizontal dashed-dotted lines are associated with the squared bias for the MCD location estimator (upper line) and the Reweighted MCD (MCDr) location estimator (lower line)
56 The FS for outlier detection Importance of monitoring : a wealth of diagnostics can be computed and displayed along the search. The main tool for outlier detection is the forward plot of the Minimum distance among units outside the subset (min MD) If observation [ + 1] is an outlier, its distance will be large compared to the maximum distance of the observations in : peak in the forward plot of dmin().
57 Scaled MD In regression we work with scaled residuals In multivariate analysis we scale MD as
58 Dependence on v and n Unscaled distances Scaled distances 95% points of the empirical distribution of the min. MD for sample sizes n=100, 200, 600 and 1000; v=1, 2, 13
59 Approximation based on order statistics Comparison of 1%, 50% and 99% asymptotic envelopes for scaled distances. Continuous lines: envelopes found by simulation (n=100 and v=6)
60 Approximation based on order statistics n=200 v=5 Scaled distances Unscaled distances
61 Approximation based on order statistics n=600 v=5 Scaled distances Unscaled distances
62 Swiss heads data Six readings on the dimensions of the heads of 200 twenty years old soldiers
63 Swiss heads data Final purpose: to study the variability in size and shape of young men in order to help to design a new protection mask Choice of the initial subset: we find an initial subset of m0 observations from the intersection of units inside a robust bivariate contour for each pair of variables

64 Swiss heads data: SPM with univariate and bivariate boxplots
65 Remark on the initial definition of starting point Does not involve complicated iterative procedures The size of the initial subset can easily be decreased or increased by changing the value of the outer contour We can easily try several starting points and check whether the final part of the search is the same We can force the starting point
66 Monitoring min MD with envelopes
67 Swiss bank notes 6 variables are measurements of the size of the bank notes 100 of which are genuine and 100 are forged Some complications: Some of the notes in either group may have been misclassified Forged notes may not form a homogeneous group
 populations (genuine and forged notes), but with several outliers (different forgers?")
68 Swiss Banknotes 100 are genuine and 100 are forged (n=200 v=6) Two(?) populations (genuine and forged notes), but with several outliers (different forgers?) Both extreme and intermediate outliers
 populations (genuine and forged notes), but with several outliers (different forgers?")
69 Swiss Banknotes 100 are genuine and 100 are forged Two(?) populations (genuine and forged notes), but with several outliers (different forgers?) Both extreme and intermediate outliers
70 Analysis of the group of 100 fake banknotes
71 Monitoring min MD with envelopes
72 Strategy for outlier detection Once a signal takes place (m=m*) start superimposing 99% envelopes using n=m*-1, m*, m*+1 up to when the trajectory is inside the threshold
73 SBN: superimposed envelopes at step n=84
74 SBN: resuperimposed envelopes at step n=85
75 SBN: resuperimposed envelopes at step n=86
76 Forward plot of scaled MD
77 Example with simulated data: n=200 p=5, 30% contamination (first 60 obs.) Level shift= y y y y4-2 0 y
78 Example with simulated data: n=200 p=5, 30% contamination (first 60 obs.) Level shift= y y y y4-2 0 y
79 n=200 p=5 30% contamination Level shift=1.2 Output from FAST MCD (consistency correction + Pison correction - Real α=0.3291)
80 n=200 p=5 30% contamination Level shift=1.2 Output from reweighted MCD + Pison correction Real α=0.1095)
81 Fast MCD MD 30 Robust MCD distances against traditional MD Traditional MD 15
82 Output from FS
83 Robust classification through the forward search The random start approach
84 Swiss heads: forward plot of minmd 500 searches with random starting points
85 Swiss banknotes: 500 fwd searches (random starts): monitoring of minimum MD 123 searches 189 searches

86 Two clusters of independent normal variables (TC): spm
87 TC: forward plot of Min MD from 200 random starts

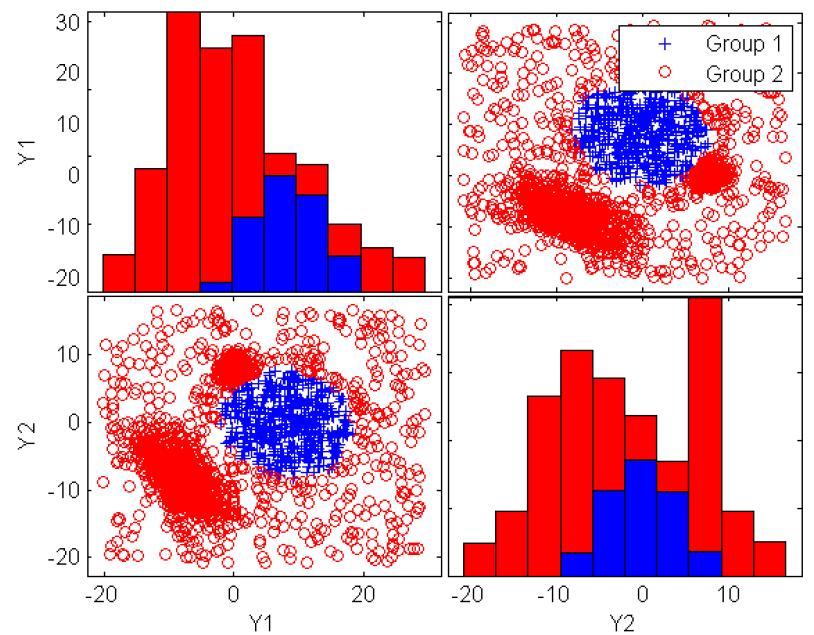
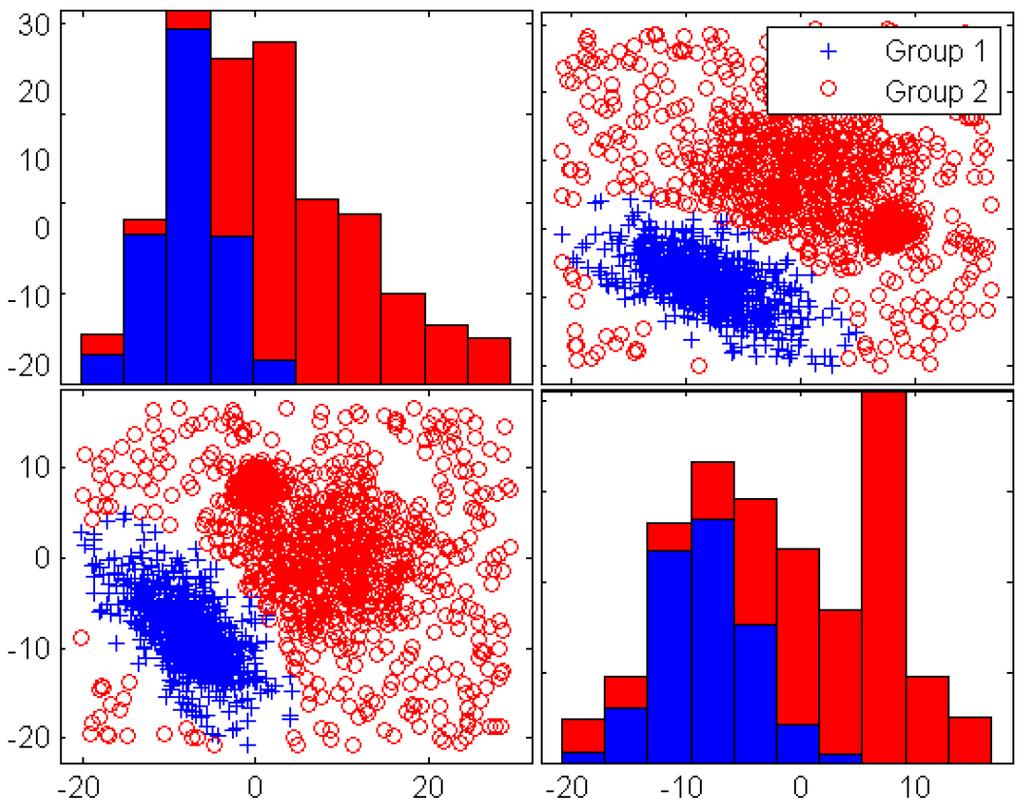
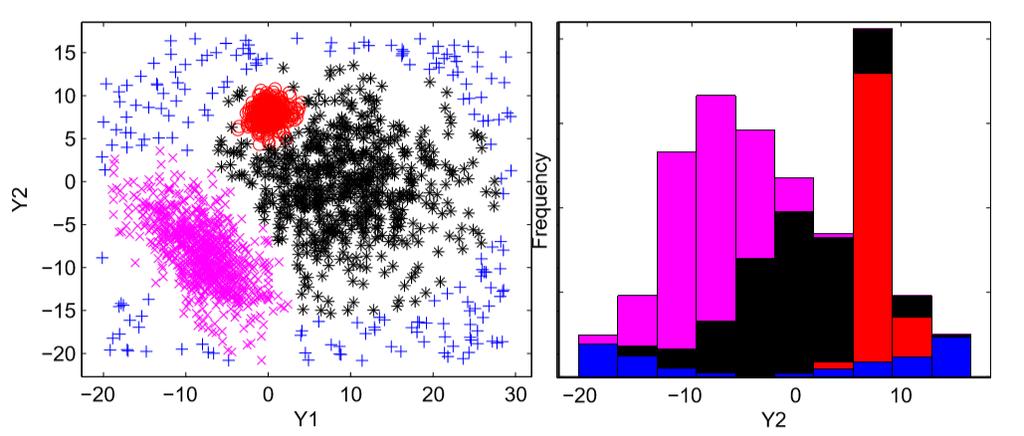
88 Three clusters of correlated normal variables (3C)

89 3C: plot of groups 1 and 2
90 3C: forward plot of min MD from 200 random starts
91 Classes of robust estimators Three classes of estimators: Hard (0,1) trimming (LTS, LMS, MCD, MVE) in which the amount of trimming is determined by the choice of the trimming parameter. Adaptive Hard Trimming. In the Forward Search (FS), the observations are again hard trimmed, but the amount of trimming is determined by the data, being found adaptively by the search. Soft trimming (downweighting). M estimation and derived methods (S, MM, tau). rho function ensures that increasingly remote observations have a weight that decreases with distance from the centre.
92 Decisions which have to be taken when using soft or fixed hard (soft) trimming methods The number of subsamples to extract to each of which the model is fitted exactly. The maximum number of refining iterations (concentration steps), if any, within each subsample. The tolerance for the convergence of the estimate of target function in the refining steps. The number of best subsets resulting from the refining steps to be brought to convergence. The number of refining iterations for each best subset being brought to convergence. The tolerance for the estimate of b in the refining steps for each subset being brought to convergence. The tolerance for the estimate of scale in the best subsets. Often these choices are not well documented in software
93 The philosophy of monitoring One reason for the excellent performance of the Forward Search is the adaptive choice of the trimming parameter Extension: MONITOR the behaviour of robust procedures over a range of values of this parameter Monitoring also helps with the choice among robust methods and the decisions that have to be made before data analysis These decisions are another major disincentive to the routine use of standard robust methods
94 Geyser data 2 variables n=272
95 Big cluster 175 obs Small cluster 97 obs Waiting Geyser data (n=272) Eruptions 5

96 Robust Mahalanobis distances for MM estimation as a function of eff from 0.5 to 0.99 For efficiencies less than 0.71, the plot reveals the observations from the smaller cluster as outliers

97 Robust Mahalanobis distances for MCD (left) and MVE (right) as a function of subset size MCD: definite indication of a break in the structure, here at a subset size of 244

98 A random start forward search analysis of the Old Faithful data: monitoring of min. Mahalanobis distance outside subset
99 Further analysis within each cluster to find the number of units belonging to each group All units Two units removed Last unit removed Three units removed
100 Final classification from the FS
101 Comparison with Mclust
102 Final classification from MCLUST

103 Another example: M5 dataset

104 Another example: M5 dataset = 2000 observations: 1800 good data points, simulated on v = 2 (normal) variables, outliers Three groups with different scales Radial outliers around the groups; two groups strongly overlap
105 M5: 500 fwd searches (random starts): monitoring of minmd 3 different trajectories


106 We can interrogate the FS at selected steps: step =420

107 Step =490
108 Step =780
109 Final classification
110 Comparison with leading robust clustering routines TCLUST: mainly developed in Valladolid (Garcia-Escudero et al., Ann. Stat., 2008; ADAC, 2010; Statistics and Computing 2012)
111 TCLUST
112 Issues in Tclust Heteroscedastic model: we need constraints on the covariances of the different groups Three crucial aspects: α = trimming proportion k = number of groups c = restriction factor
113 State of the art for the choice of k and α Classification trimmed likelihood (CTL) curves Swiss banknotes M5 datasets 3, Suggests k=2 and α=0.1 k=3 but α not clear

114 All routines for robust estimators are implemented in the MATLAB toolbox FSDA downloadable from or from
Accurate and Powerful Multivariate Outlier Detection
 Int. Statistical Inst.: Proc. 58th World Statistical Congress, 11, Dublin (Session CPS66) p.568 Accurate and Powerful Multivariate Outlier Detection Cerioli, Andrea Università di Parma, Dipartimento di
Monitoring Random Start Forward Searches for Multivariate Data
 Monitoring Random Start Forward Searches for Multivariate Data Anthony C. Atkinson 1, Marco Riani 2, and Andrea Cerioli 2 1 Department of Statistics, London School of Economics London WC2A 2AE, UK, a.c.atkinson@lse.ac.uk
Supplementary Material for Wang and Serfling paper
 Supplementary Material for Wang and Serfling paper March 6, 2017 1 Simulation study Here we provide a simulation study to compare empirically the masking and swamping robustness of our selected outlyingness
TESTS FOR TRANSFORMATIONS AND ROBUST REGRESSION. Anthony Atkinson, 25th March 2014
 TESTS FOR TRANSFORMATIONS AND ROBUST REGRESSION Anthony Atkinson, 25th March 2014 Joint work with Marco Riani, Parma Department of Statistics London School of Economics London WC2A 2AE, UK a.c.atkinson@lse.ac.uk
Cluster Detection and Clustering with Random Start Forward Searches
 To appear in the Journal of Applied Statistics Vol., No., Month XX, 9 Cluster Detection and Clustering with Random Start Forward Searches Anthony C. Atkinson a Marco Riani and Andrea Cerioli b a Department
Detection of outliers in multivariate data:
 1 Detection of outliers in multivariate data: a method based on clustering and robust estimators Carla M. Santos-Pereira 1 and Ana M. Pires 2 1 Universidade Portucalense Infante D. Henrique, Oporto, Portugal
Computational Statistics and Data Analysis
 Computational Statistics and Data Analysis 65 (2013) 29 45 Contents lists available at SciVerse ScienceDirect Computational Statistics and Data Analysis journal homepage: www.elsevier.com/locate/csda Robust
Finding an unknown number of multivariate outliers
 J. R. Statist. Soc. B (2009) 71, Part 2, pp. Finding an unknown number of multivariate outliers Marco Riani, Università di Parma, Italy Anthony C. Atkinson London School of Economics and Political Science,
Robust Wilks' Statistic based on RMCD for One-Way Multivariate Analysis of Variance (MANOVA)
") ISSN 2224-584 (Paper) ISSN 2225-522 (Online) Vol.7, No.2, 27 Robust Wils' Statistic based on RMCD for One-Way Multivariate Analysis of Variance (MANOVA) Abdullah A. Ameen and Osama H. Abbas Department
ISSN 2224-584 (Paper) ISSN 2225-522 (Online) Vol.7, No.2, 27 Robust Wils' Statistic based on RMCD for One-Way Multivariate Analysis of Variance (MANOVA) Abdullah A. Ameen and Osama H. Abbas Department
The power of (extended) monitoring in robust clustering
 monitoring in robust clustering") Statistical Methods & Applications manuscript No. (will be inserted by the editor) The power of (extended) monitoring in robust clustering Alessio Farcomeni and Francesco Dotto Received: date / Accepted:
Statistical Methods & Applications manuscript No. (will be inserted by the editor) The power of (extended) monitoring in robust clustering Alessio Farcomeni and Francesco Dotto Received: date / Accepted:
On consistency factors and efficiency of robust S-estimators
 TEST DOI.7/s749-4-357-7 ORIGINAL PAPER On consistency factors and efficiency of robust S-estimators Marco Riani Andrea Cerioli Francesca Torti Received: 5 May 3 / Accepted: 6 January 4 Sociedad de Estadística
Small Sample Corrections for LTS and MCD
 myjournal manuscript No. (will be inserted by the editor) Small Sample Corrections for LTS and MCD G. Pison, S. Van Aelst, and G. Willems Department of Mathematics and Computer Science, Universitaire Instelling
IMPROVING THE SMALL-SAMPLE EFFICIENCY OF A ROBUST CORRELATION MATRIX: A NOTE
 IMPROVING THE SMALL-SAMPLE EFFICIENCY OF A ROBUST CORRELATION MATRIX: A NOTE Eric Blankmeyer Department of Finance and Economics McCoy College of Business Administration Texas State University San Marcos
Fast and robust bootstrap for LTS
 Fast and robust bootstrap for LTS Gert Willems a,, Stefan Van Aelst b a Department of Mathematics and Computer Science, University of Antwerp, Middelheimlaan 1, B-2020 Antwerp, Belgium b Department of
ON THE CALCULATION OF A ROBUST S-ESTIMATOR OF A COVARIANCE MATRIX
 STATISTICS IN MEDICINE Statist. Med. 17, 2685 2695 (1998) ON THE CALCULATION OF A ROBUST S-ESTIMATOR OF A COVARIANCE MATRIX N. A. CAMPBELL *, H. P. LOPUHAA AND P. J. ROUSSEEUW CSIRO Mathematical and Information
Journal of Biostatistics and Epidemiology
 Journal of Biostatistics and Epidemiology Original Article Robust correlation coefficient goodness-of-fit test for the Gumbel distribution Abbas Mahdavi 1* 1 Department of Statistics, School of Mathematical
Stat 5101 Lecture Notes
 Stat 5101 Lecture Notes Charles J. Geyer Copyright 1998, 1999, 2000, 2001 by Charles J. Geyer May 7, 2001 ii Stat 5101 (Geyer) Course Notes Contents 1 Random Variables and Change of Variables 1 1.1 Random
Introduction to Linear regression analysis. Part 2. Model comparisons
 Introduction to Linear regression analysis Part Model comparisons 1 ANOVA for regression Total variation in Y SS Total = Variation explained by regression with X SS Regression + Residual variation SS Residual
TITLE : Robust Control Charts for Monitoring Process Mean of. Phase-I Multivariate Individual Observations AUTHORS : Asokan Mulayath Variyath.
 TITLE : Robust Control Charts for Monitoring Process Mean of Phase-I Multivariate Individual Observations AUTHORS : Asokan Mulayath Variyath Department of Mathematics and Statistics, Memorial University
Re-weighted Robust Control Charts for Individual Observations
 Universiti Tunku Abdul Rahman, Kuala Lumpur, Malaysia 426 Re-weighted Robust Control Charts for Individual Observations Mandana Mohammadi 1, Habshah Midi 1,2 and Jayanthi Arasan 1,2 1 Laboratory of Applied
The S-estimator of multivariate location and scatter in Stata
 The Stata Journal (yyyy) vv, Number ii, pp. 1 9 The S-estimator of multivariate location and scatter in Stata Vincenzo Verardi University of Namur (FUNDP) Center for Research in the Economics of Development
CHAPTER 5. Outlier Detection in Multivariate Data
 CHAPTER 5 Outlier Detection in Multivariate Data 5.1 Introduction Multivariate outlier detection is the important task of statistical analysis of multivariate data. Many methods have been proposed for
Small sample corrections for LTS and MCD
 Metrika (2002) 55: 111 123 > Springer-Verlag 2002 Small sample corrections for LTS and MCD G. Pison, S. Van Aelst*, and G. Willems Department of Mathematics and Computer Science, Universitaire Instelling
applications Rome, 9 February Università di Roma La Sapienza Robust model based clustering: methods and applications Francesco Dotto Introduction
 model : fuzzy model : Università di Roma La Sapienza Rome, 9 February Outline of the presentation model : fuzzy 1 General motivation 2 algorithm on trimming and reweigthing. 3 algorithm on trimming and
WEIGHTED QUANTILE REGRESSION THEORY AND ITS APPLICATION. Abstract
 Journal of Data Science,17(1). P. 145-160,2019 DOI:10.6339/JDS.201901_17(1).0007 WEIGHTED QUANTILE REGRESSION THEORY AND ITS APPLICATION Wei Xiong *, Maozai Tian 2 1 School of Statistics, University of
Identifying and accounting for outliers and extreme response patterns in latent variable modelling
 Identifying and accounting for outliers and extreme response patterns in latent variable modelling Irini Moustaki Athens University of Economics and Business Outline 1. Define the problem of outliers and
MULTIVARIATE TECHNIQUES, ROBUSTNESS
 MULTIVARIATE TECHNIQUES, ROBUSTNESS Mia Hubert Associate Professor, Department of Mathematics and L-STAT Katholieke Universiteit Leuven, Belgium mia.hubert@wis.kuleuven.be Peter J. Rousseeuw 1 Senior Researcher,
A Brief Overview of Robust Statistics
 A Brief Overview of Robust Statistics Olfa Nasraoui Department of Computer Engineering & Computer Science University of Louisville, olfa.nasraoui_at_louisville.edu Robust Statistical Estimators Robust
Glossary. The ISI glossary of statistical terms provides definitions in a number of different languages:
 Glossary The ISI glossary of statistical terms provides definitions in a number of different languages: http://isi.cbs.nl/glossary/index.htm Adjusted r 2 Adjusted R squared measures the proportion of the
Outlier detection for high-dimensional data
 Biometrika (2015), 102,3,pp. 589 599 doi: 10.1093/biomet/asv021 Printed in Great Britain Advance Access publication 7 June 2015 Outlier detection for high-dimensional data BY KWANGIL RO, CHANGLIANG ZOU,
An Overview of Multiple Outliers in Multidimensional Data
 Sri Lankan Journal of Applied Statistics, Vol (14-2) An Overview of Multiple Outliers in Multidimensional Data T. A. Sajesh 1 and M.R. Srinivasan 2 1 Department of Statistics, St. Thomas College, Thrissur,
INVARIANT COORDINATE SELECTION
 INVARIANT COORDINATE SELECTION By David E. Tyler 1, Frank Critchley, Lutz Dümbgen 2, and Hannu Oja Rutgers University, Open University, University of Berne and University of Tampere SUMMARY A general method
Introduction to robust statistics*
 Introduction to robust statistics* Xuming He National University of Singapore To statisticians, the model, data and methodology are essential. Their job is to propose statistical procedures and evaluate
Simulating mixtures of multivariate data with fixed cluster overlap in FSDA library
 Adv Data Anal Classif (5) 9:46 48 DOI.7/s634-5-3-9 REGULAR ARTICLE Simulating mixtures of multivariate data with fixed cluster overlap in FSDA library Marco Riani Andrea Cerioli Domenico Perrotta Francesca
Computational Connections Between Robust Multivariate Analysis and Clustering
 1 Computational Connections Between Robust Multivariate Analysis and Clustering David M. Rocke 1 and David L. Woodruff 2 1 Department of Applied Science, University of California at Davis, Davis, CA 95616,
A Modified M-estimator for the Detection of Outliers
 A Modified M-estimator for the Detection of Outliers Asad Ali Department of Statistics, University of Peshawar NWFP, Pakistan Email: asad_yousafzay@yahoo.com Muhammad F. Qadir Department of Statistics,
Robust Exponential Smoothing of Multivariate Time Series
 Robust Exponential Smoothing of Multivariate Time Series Christophe Croux,a, Sarah Gelper b, Koen Mahieu a a Faculty of Business and Economics, K.U.Leuven, Naamsestraat 69, 3000 Leuven, Belgium b Erasmus
A ROBUST METHOD OF ESTIMATING COVARIANCE MATRIX IN MULTIVARIATE DATA ANALYSIS G.M. OYEYEMI *, R.A. IPINYOMI **
 ANALELE ŞTIINłIFICE ALE UNIVERSITĂłII ALEXANDRU IOAN CUZA DIN IAŞI Tomul LVI ŞtiinŃe Economice 9 A ROBUST METHOD OF ESTIMATING COVARIANCE MATRIX IN MULTIVARIATE DATA ANALYSIS G.M. OYEYEMI, R.A. IPINYOMI
Journal of Statistical Software
 JSS Journal of Statistical Software April 2013, Volume 53, Issue 3. http://www.jstatsoft.org/ Fast and Robust Bootstrap for Multivariate Inference: The R Package FRB Stefan Van Aelst Ghent University Gert
Robust estimation of scale and covariance with P n and its application to precision matrix estimation
 Robust estimation of scale and covariance with P n and its application to precision matrix estimation Garth Tarr, Samuel Müller and Neville Weber USYD 2013 School of Mathematics and Statistics THE UNIVERSITY
Testing Statistical Hypotheses
 E.L. Lehmann Joseph P. Romano Testing Statistical Hypotheses Third Edition 4y Springer Preface vii I Small-Sample Theory 1 1 The General Decision Problem 3 1.1 Statistical Inference and Statistical Decisions
Improvement of The Hotelling s T 2 Charts Using Robust Location Winsorized One Step M-Estimator (WMOM)
") Punjab University Journal of Mathematics (ISSN 1016-2526) Vol. 50(1)(2018) pp. 97-112 Improvement of The Hotelling s T 2 Charts Using Robust Location Winsorized One Step M-Estimator (WMOM) Firas Haddad
Punjab University Journal of Mathematics (ISSN 1016-2526) Vol. 50(1)(2018) pp. 97-112 Improvement of The Hotelling s T 2 Charts Using Robust Location Winsorized One Step M-Estimator (WMOM) Firas Haddad
MULTICHANNEL SIGNAL PROCESSING USING SPATIAL RANK COVARIANCE MATRICES
 MULTICHANNEL SIGNAL PROCESSING USING SPATIAL RANK COVARIANCE MATRICES S. Visuri 1 H. Oja V. Koivunen 1 1 Signal Processing Lab. Dept. of Statistics Tampere Univ. of Technology University of Jyväskylä P.O.
Identification of Multivariate Outliers: A Performance Study
 AUSTRIAN JOURNAL OF STATISTICS Volume 34 (2005), Number 2, 127 138 Identification of Multivariate Outliers: A Performance Study Peter Filzmoser Vienna University of Technology, Austria Abstract: Three
A robust clustering procedure with unknown number of clusters
 A robust clustering procedure with unknown number of clusters Una procedura di cluster analysis robusta con un numero di cluster incognito Francesco Dotto and Alessio Farcomeni Abstract A new methodology
Robust Estimation of Cronbach s Alpha
 Robust Estimation of Cronbach s Alpha A. Christmann University of Dortmund, Fachbereich Statistik, 44421 Dortmund, Germany. S. Van Aelst Ghent University (UGENT), Department of Applied Mathematics and
Robust Bayesian regression with the forward search: theory and data analysis
 TEST (2017) 26:869 886 DOI 10.1007/s11749-017-0542-6 ORIGINAL PAPER Robust Bayesian regression with the forward search: theory and data analysis Anthony C. Atkinson 1 Aldo Corbellini 2 Marco Riani 2 Received:
arxiv: v1 [math.st] 11 Jun 2018
![arxiv: v1 [math.st] 11 Jun 2018](/thumbs/95/123609812.jpg "arxiv: v1 [math.st] 11 Jun 2018") Robust test statistics for the two-way MANOVA based on the minimum covariance determinant estimator Bernhard Spangl a, arxiv:1806.04106v1 [math.st] 11 Jun 2018 a Institute of Applied Statistics and Computing,
Robust test statistics for the two-way MANOVA based on the minimum covariance determinant estimator Bernhard Spangl a, arxiv:1806.04106v1 [math.st] 11 Jun 2018 a Institute of Applied Statistics and Computing,
arxiv: v3 [stat.me] 2 Feb 2018 Abstract
![arxiv: v3 [stat.me] 2 Feb 2018 Abstract](/thumbs/79/79067867.jpg "arxiv: v3 [stat.me] 2 Feb 2018 Abstract") ICS for Multivariate Outlier Detection with Application to Quality Control Aurore Archimbaud a, Klaus Nordhausen b, Anne Ruiz-Gazen a, a Toulouse School of Economics, University of Toulouse 1 Capitole,
ICS for Multivariate Outlier Detection with Application to Quality Control Aurore Archimbaud a, Klaus Nordhausen b, Anne Ruiz-Gazen a, a Toulouse School of Economics, University of Toulouse 1 Capitole,
Robust estimation of principal components from depth-based multivariate rank covariance matrix
 Robust estimation of principal components from depth-based multivariate rank covariance matrix Subho Majumdar Snigdhansu Chatterjee University of Minnesota, School of Statistics Table of contents Summary
Vienna University of Technology
 Vienna University of Technology Deliverable 4. Final Report Contract with the world bank (1157976) Detecting outliers in household consumption survey data Peter Filzmoser Authors: Johannes Gussenbauer
ROBUST ESTIMATION OF A CORRELATION COEFFICIENT: AN ATTEMPT OF SURVEY
 ROBUST ESTIMATION OF A CORRELATION COEFFICIENT: AN ATTEMPT OF SURVEY G.L. Shevlyakov, P.O. Smirnov St. Petersburg State Polytechnic University St.Petersburg, RUSSIA E-mail: Georgy.Shevlyakov@gmail.com
Detecting outliers and/or leverage points: a robust two-stage procedure with bootstrap cut-off points
 Detecting outliers and/or leverage points: a robust two-stage procedure with bootstrap cut-off points Ettore Marubini (1), Annalisa Orenti (1) Background: Identification and assessment of outliers, have
Statistical Data Analysis Stat 3: p-values, parameter estimation
 Statistical Data Analysis Stat 3: p-values, parameter estimation London Postgraduate Lectures on Particle Physics; University of London MSci course PH4515 Glen Cowan Physics Department Royal Holloway,
Package ForwardSearch
 Package ForwardSearch February 19, 2015 Type Package Title Forward Search using asymptotic theory Version 1.0 Date 2014-09-10 Author Bent Nielsen Maintainer Bent Nielsen
Testing Statistical Hypotheses
 E.L. Lehmann Joseph P. Romano, 02LEu1 ttd ~Lt~S Testing Statistical Hypotheses Third Edition With 6 Illustrations ~Springer 2 The Probability Background 28 2.1 Probability and Measure 28 2.2 Integration.........
Fall 2017 STAT 532 Homework Peter Hoff. 1. Let P be a probability measure on a collection of sets A.
 1. Let P be a probability measure on a collection of sets A. (a) For each n N, let H n be a set in A such that H n H n+1. Show that P (H n ) monotonically converges to P ( k=1 H k) as n. (b) For each n
401 Review. 6. Power analysis for one/two-sample hypothesis tests and for correlation analysis.
 401 Review Major topics of the course 1. Univariate analysis 2. Bivariate analysis 3. Simple linear regression 4. Linear algebra 5. Multiple regression analysis Major analysis methods 1. Graphical analysis
Wiley. Methods and Applications of Linear Models. Regression and the Analysis. of Variance. Third Edition. Ishpeming, Michigan RONALD R.
 Methods and Applications of Linear Models Regression and the Analysis of Variance Third Edition RONALD R. HOCKING PenHock Statistical Consultants Ishpeming, Michigan Wiley Contents Preface to the Third
Lecture 12 Robust Estimation
 Lecture 12 Robust Estimation Prof. Dr. Svetlozar Rachev Institute for Statistics and Mathematical Economics University of Karlsruhe Financial Econometrics, Summer Semester 2007 Copyright These lecture-notes
robustness, efficiency, breakdown point, outliers, rank-based procedures, least absolute regression
 Robust Statistics robustness, efficiency, breakdown point, outliers, rank-based procedures, least absolute regression University of California, San Diego Instructor: Ery Arias-Castro http://math.ucsd.edu/~eariasca/teaching.html
Two Simple Resistant Regression Estimators
 Two Simple Resistant Regression Estimators David J. Olive Southern Illinois University January 13, 2005 Abstract Two simple resistant regression estimators with O P (n 1/2 ) convergence rate are presented.
FAST CROSS-VALIDATION IN ROBUST PCA
 COMPSTAT 2004 Symposium c Physica-Verlag/Springer 2004 FAST CROSS-VALIDATION IN ROBUST PCA Sanne Engelen, Mia Hubert Key words: Cross-Validation, Robustness, fast algorithm COMPSTAT 2004 section: Partial
Journal of the Korean Statistical Society
 Journal of the Korean Statistical Society 39 (2010) 117 134 Contents lists available at ScienceDirect Journal of the Korean Statistical Society journal homepage: www.elsevier.com/locate/jkss The forward
Monte Carlo Studies. The response in a Monte Carlo study is a random variable.
 Monte Carlo Studies The response in a Monte Carlo study is a random variable. The response in a Monte Carlo study has a variance that comes from the variance of the stochastic elements in the data-generating
A Convex Hull Peeling Depth Approach to Nonparametric Massive Multivariate Data Analysis with Applications
 A Convex Hull Peeling Depth Approach to Nonparametric Massive Multivariate Data Analysis with Applications Hyunsook Lee. hlee@stat.psu.edu Department of Statistics The Pennsylvania State University Hyunsook
PROBABILITY DISTRIBUTIONS. J. Elder CSE 6390/PSYC 6225 Computational Modeling of Visual Perception
 PROBABILITY DISTRIBUTIONS Credits 2 These slides were sourced and/or modified from: Christopher Bishop, Microsoft UK Parametric Distributions 3 Basic building blocks: Need to determine given Representation:
Introduction to Robust Statistics. Elvezio Ronchetti. Department of Econometrics University of Geneva Switzerland.
 Introduction to Robust Statistics Elvezio Ronchetti Department of Econometrics University of Geneva Switzerland Elvezio.Ronchetti@metri.unige.ch http://www.unige.ch/ses/metri/ronchetti/ 1 Outline Introduction
Y (Nominal/Categorical) 1. Metric (interval/ratio) data for 2+ IVs, and categorical (nominal) data for a single DV
 1. Metric (interval/ratio) data for 2+ IVs, and categorical (nominal) data for a single DV") 1 Neuendorf Discriminant Analysis The Model X1 X2 X3 X4 DF2 DF3 DF1 Y (Nominal/Categorical) Assumptions: 1. Metric (interval/ratio) data for 2+ IVs, and categorical (nominal) data for a single DV 2. Linearity--in
1 Neuendorf Discriminant Analysis The Model X1 X2 X3 X4 DF2 DF3 DF1 Y (Nominal/Categorical) Assumptions: 1. Metric (interval/ratio) data for 2+ IVs, and categorical (nominal) data for a single DV 2. Linearity--in
Robust multivariate methods in Chemometrics
 Robust multivariate methods in Chemometrics Peter Filzmoser 1 Sven Serneels 2 Ricardo Maronna 3 Pierre J. Van Espen 4 1 Institut für Statistik und Wahrscheinlichkeitstheorie, Technical University of Vienna,
MS-E2112 Multivariate Statistical Analysis (5cr) Lecture 4: Measures of Robustness, Robust Principal Component Analysis
 Lecture 4: Measures of Robustness, Robust Principal Component Analysis") MS-E2112 Multivariate Statistical Analysis (5cr) Lecture 4:, Robust Principal Component Analysis Contents Empirical Robust Statistical Methods In statistics, robust methods are methods that perform well
MS-E2112 Multivariate Statistical Analysis (5cr) Lecture 4:, Robust Principal Component Analysis Contents Empirical Robust Statistical Methods In statistics, robust methods are methods that perform well
ESTIMATING THE WINTERING LOCATION OF THE WOOD THRUSH HANNA JANKOWSKI, VERONICA SABELNYKOVA, JOHN SHERIFF
 ESTIMATING THE WINTERING LOCATION OF THE WOOD THRUSH HANNA JANKOWSKI, VERONICA SABELNYKOVA, JOHN SHERIFF Abstract. We consider the estimation of the wintering location of the wood thrush based on geolocator
Computational Statistics and Data Analysis
 Computational Statistics and Data Analysis 54 (2010) 3300 3312 Contents lists available at ScienceDirect Computational Statistics and Data Analysis journal homepage: www.elsevier.com/locate/csda Robust
Dependence. Practitioner Course: Portfolio Optimization. John Dodson. September 10, Dependence. John Dodson. Outline.
 Practitioner Course: Portfolio Optimization September 10, 2008 Before we define dependence, it is useful to define Random variables X and Y are independent iff For all x, y. In particular, F (X,Y ) (x,
Fundamentals to Biostatistics. Prof. Chandan Chakraborty Associate Professor School of Medical Science & Technology IIT Kharagpur
 Fundamentals to Biostatistics Prof. Chandan Chakraborty Associate Professor School of Medical Science & Technology IIT Kharagpur Statistics collection, analysis, interpretation of data development of new
ANALYSIS OF VARIANCE OF BALANCED DAIRY SCIENCE DATA USING SAS
 ANALYSIS OF VARIANCE OF BALANCED DAIRY SCIENCE DATA USING SAS Ravinder Malhotra and Vipul Sharma National Dairy Research Institute, Karnal-132001 The most common use of statistics in dairy science is testing
Chapter 9. Hotelling s T 2 Test. 9.1 One Sample. The one sample Hotelling s T 2 test is used to test H 0 : µ = µ 0 versus
 Chapter 9 Hotelling s T 2 Test 9.1 One Sample The one sample Hotelling s T 2 test is used to test H 0 : µ = µ 0 versus H A : µ µ 0. The test rejects H 0 if T 2 H = n(x µ 0 ) T S 1 (x µ 0 ) > n p F p,n
368 XUMING HE AND GANG WANG of convergence for the MVE estimator is n ;1=3. We establish strong consistency and functional continuity of the MVE estim
 Statistica Sinica 6(1996), 367-374 CROSS-CHECKING USING THE MINIMUM VOLUME ELLIPSOID ESTIMATOR Xuming He and Gang Wang University of Illinois and Depaul University Abstract: We show that for a wide class
Lecture 3. G. Cowan. Lecture 3 page 1. Lectures on Statistical Data Analysis
 Lecture 3 1 Probability (90 min.) Definition, Bayes theorem, probability densities and their properties, catalogue of pdfs, Monte Carlo 2 Statistical tests (90 min.) general concepts, test statistics,
Short Answer Questions: Answer on your separate blank paper. Points are given in parentheses.
 ISQS 6348 Final exam solutions. Name: Open book and notes, but no electronic devices. Answer short answer questions on separate blank paper. Answer multiple choice on this exam sheet. Put your name on
Research Article A Nonparametric Two-Sample Wald Test of Equality of Variances
 Advances in Decision Sciences Volume 211, Article ID 74858, 8 pages doi:1.1155/211/74858 Research Article A Nonparametric Two-Sample Wald Test of Equality of Variances David Allingham 1 andj.c.w.rayner
Stahel-Donoho Estimation for High-Dimensional Data
 Stahel-Donoho Estimation for High-Dimensional Data Stefan Van Aelst KULeuven, Department of Mathematics, Section of Statistics Celestijnenlaan 200B, B-3001 Leuven, Belgium Email: Stefan.VanAelst@wis.kuleuven.be
Robust repeated median regression in moving windows with data-adaptive width selection SFB 823. Discussion Paper. Matthias Borowski, Roland Fried
 SFB 823 Robust repeated median regression in moving windows with data-adaptive width selection Discussion Paper Matthias Borowski, Roland Fried Nr. 28/2011 Robust Repeated Median regression in moving
Applied Multivariate and Longitudinal Data Analysis
 Applied Multivariate and Longitudinal Data Analysis Chapter 2: Inference about the mean vector(s) Ana-Maria Staicu SAS Hall 5220; 919-515-0644; astaicu@ncsu.edu 1 In this chapter we will discuss inference
Computationally Easy Outlier Detection via Projection Pursuit with Finitely Many Directions
 Computationally Easy Outlier Detection via Projection Pursuit with Finitely Many Directions Robert Serfling 1 and Satyaki Mazumder 2 University of Texas at Dallas and Indian Institute of Science, Education
Detecting outliers in weighted univariate survey data
 Detecting outliers in weighted univariate survey data Anna Pauliina Sandqvist October 27, 21 Preliminary Version Abstract Outliers and influential observations are a frequent concern in all kind of statistics,
Introduction Robust regression Examples Conclusion. Robust regression. Jiří Franc
 Robust regression Robust estimation of regression coefficients in linear regression model Jiří Franc Czech Technical University Faculty of Nuclear Sciences and Physical Engineering Department of Mathematics
Leverage effects on Robust Regression Estimators
 Leverage effects on Robust Regression Estimators David Adedia 1 Atinuke Adebanji 2 Simon Kojo Appiah 2 1. Department of Basic Sciences, School of Basic and Biomedical Sciences, University of Health and
Research Article Robust Control Charts for Monitoring Process Mean of Phase-I Multivariate Individual Observations
 Journal of Quality and Reliability Engineering Volume 3, Article ID 4, 4 pages http://dx.doi.org/./3/4 Research Article Robust Control Charts for Monitoring Process Mean of Phase-I Multivariate Individual
STAT 501 Assignment 2 NAME Spring Chapter 5, and Sections in Johnson & Wichern.
 STAT 01 Assignment NAME Spring 00 Reading Assignment: Written Assignment: Chapter, and Sections 6.1-6.3 in Johnson & Wichern. Due Monday, February 1, in class. You should be able to do the first four problems
Finite Population Sampling and Inference
 Finite Population Sampling and Inference A Prediction Approach RICHARD VALLIANT ALAN H. DORFMAN RICHARD M. ROYALL A Wiley-Interscience Publication JOHN WILEY & SONS, INC. New York Chichester Weinheim Brisbane
New robust dynamic plots for regression mixture detection
 Adv Data Anal Classif (2009) 3:263 279 DOI 10.1007/s11634-009-0050-y REGULAR ARTICLE New robust dynamic plots for regression mixture detection Domenico Perrotta Marco Riani Francesca Torti Received: 12
Practical Statistics for the Analytical Scientist Table of Contents
 Practical Statistics for the Analytical Scientist Table of Contents Chapter 1 Introduction - Choosing the Correct Statistics 1.1 Introduction 1.2 Choosing the Right Statistical Procedures 1.2.1 Planning
Simulating Uniform- and Triangular- Based Double Power Method Distributions
 Journal of Statistical and Econometric Methods, vol.6, no.1, 2017, 1-44 ISSN: 1792-6602 (print), 1792-6939 (online) Scienpress Ltd, 2017 Simulating Uniform- and Triangular- Based Double Power Method Distributions
Fast and Robust Discriminant Analysis
 Fast and Robust Discriminant Analysis Mia Hubert a,1, Katrien Van Driessen b a Department of Mathematics, Katholieke Universiteit Leuven, W. De Croylaan 54, B-3001 Leuven. b UFSIA-RUCA Faculty of Applied
A nonparametric test for seasonal unit roots
 Robert M. Kunst robert.kunst@univie.ac.at University of Vienna and Institute for Advanced Studies Vienna To be presented in Innsbruck November 7, 2007 Abstract We consider a nonparametric test for the
Robust scale estimation with extensions
 Robust scale estimation with extensions Garth Tarr, Samuel Müller and Neville Weber School of Mathematics and Statistics THE UNIVERSITY OF SYDNEY Outline The robust scale estimator P n Robust covariance
On the Distribution of Hotelling s T 2 Statistic Based on the Successive Differences Covariance Matrix Estimator
 On the Distribution of Hotelling s T 2 Statistic Based on the Successive Differences Covariance Matrix Estimator JAMES D. WILLIAMS GE Global Research, Niskayuna, NY 12309 WILLIAM H. WOODALL and JEFFREY
SAS/IML. Software: Changes and Enhancements, Release 8.1
 SAS/IML Software: Changes and Enhancements, Release 8.1 The correct bibliographic citation for this manual is as follows: SAS Institute Inc., SAS/IML Software: Changes and Enhancements, Release 8.1, Cary,
FAULT DETECTION AND ISOLATION WITH ROBUST PRINCIPAL COMPONENT ANALYSIS
 Int. J. Appl. Math. Comput. Sci., 8, Vol. 8, No. 4, 49 44 DOI:.478/v6-8-38-3 FAULT DETECTION AND ISOLATION WITH ROBUST PRINCIPAL COMPONENT ANALYSIS YVON THARRAULT, GILLES MOUROT, JOSÉ RAGOT, DIDIER MAQUIN