ANALYSIS OF VARIANCE OF BALANCED DAIRY SCIENCE DATA USING SAS
|
|
|
- Thomasine Stanley
- 5 years ago
- Views:
Transcription
1 ANALYSIS OF VARIANCE OF BALANCED DAIRY SCIENCE DATA USING SAS Ravinder Malhotra and Vipul Sharma National Dairy Research Institute, Karnal The most common use of statistics in dairy science is testing hypothesis difference between two or more categorical treatments group. When we compared means from k independent groups, where k is greater than 2, the technique is called Analysis of Variance (ANOVA).It is a powerful statistics tool for test of significance. It is a family of methods that can be used to design and analyze the results from both simple and complex experiments. It is one of the most important statistical techniques available to researchers and provides a link between the design of experiments and the analysis of experimental data. In ANOVA the total variation in the sample data is expressed as the sum of its non negative components where each of these components is a measure of variation due to some specific independent source. In analysis of variance, a continuous response variable, known as a dependent variable, is measured under experimental conditions identified by classification variables, known as independent variables. The variation in the response is assumed to be due to effects in the classification, with random error accounting for the remaining variation. Balanced data is that data with equal numbers of observations for every combination of the classification factors. One Way ANOVA A one-way analysis of variance is an extension of the independent group t-test where there are more than two groups. A one-way analysis of variance considers one treatment factor with two or more treatment levels. The goal of the analysis is to test for differences among the means of the levels and to quantify these differences. For example in milk filling plant, four machines are filling milk in the cans to a level of 12.0 litres. In order to test the differences among machine with regard to average quantity of milk filled in the cans we can perform one way ANOVA. Assumptions: It is assumed that subjects are randomly assigned to one of 3 or more groups and that the data within each group are normally distributed with equal variances across groups. Sample sizes between groups do not have to be equal, but large differences in sample sizes for the groups may affect the outcome of some multiple comparisons tests. Test: The hypotheses for the comparison of independent groups are: H k (means of all the groups are equal) k is the number of groups H a i j (means of the two or more groups are not equal) The test statistic reported is an F-test with k-1 and N-k degrees of freedom, where N is the number of subjects. A low p-value for the F-test is evidence to reject the null hypothesis. In other words, there is evidence that at least one pair of means are not equal. PROC ANOVA and PROC GLM are two procedures in SAS designed for analyzing ANOVA models. The general form of PROC ANOVA is, PROC ANOVA data = data set; CLASS variables; /* Identify the variable that divide the data set into groups. MODEL dependent variable = independent variable; MEANS variables / options RUN;
2 The general form of PROC GLM is, PROC GLM data = data set; CLASS variables; /* Identify the variable that divide the data set into groups. MODEL dependent variable = independent variable; MEANS variables / options RUN; The MEANS statement requests multiple comparisons for the class variable listed after MEANS. Include a MEANS statement with a multiple comparison option. The syntax for this statement is MEANS variable name /test name; where test name is a multiple comparison test. Some of the tests available in SAS include BON - Performs Bonferroni t-tests of differences DUNCAN - Duncan s multiple range test SCHEFFE - Scheffe multiple comparison procedure SNK - Student Newman Keuls multiple range test LSD - Fisher s Least Significant Difference test TUKEY - Tukey s studentized range test DUNNETT - Dunnett s test compare to a single control specify For example, to select the TUKEY test, we would use the statement CASE STUDY MEANS GROUP /TUKEY; Procedure is discussed in Example 1. Two-way ANOVA Two-way ANOVA is used to compare the means of populations that are classified in two different ways, or the mean responses in an experiment with two factors. PROC GLM and PROC ANOVA are two procedures in SAS designed for analyzing ANOVA models. Only simple modifications are needed to incorporate the additional factor and possible interactions between the factors. The general form of PROC GLM is, PROC GLM data = data set; CLASS variables; /* Identify the variables that divide the data set into groups. MODEL response variable = explanatory variables; MEANS variables / options RUN; In the program above the CLASS statement designates which variables are factors in the model. For example, the statement: CLASS A B tells SAS that the variables A and B are factors in the ANOVA model. The MODEL statement is used to define the format of the model. In two-way ANOVA both factors should be included in this statement. In addition, the interaction term should be included here if you want one to be part of the model. Assuming that y specifies the response variable, the following statement specifies a two-way ANOVA model without an interaction term is: MODEL y = A B (procedure is discussed in Example 2) The statement MODEL y = A B A*B specifies a two-way ANOVA model with interaction; This can alternatively be written in short-hand form as: MODEL y = A B; (Procedure is discussed in Example 3)
3 Both PROC GLM and PROC ANOVA are procedures that can be used for analyzing ANOVA models. PROC GLM is an all-purpose procedure that can be used to analyze all types of general linear models (including ANOVA, regression and multivariate models). Because PROC GLM will do so many things, it generally uses more computer resources to generate the same output as PROC ANOVA. However, PROC ANOVA is not appropriate to use when the data are unbalanced. It is also not able to create the contrasts that may be needed in a follow-up analysis. Therefore it is recommended to use PROC GLM when performing ANOVA in SAS. Types of Sums of Squares for ANOVA Effects a) Type I SS are order-dependent (hierarchical, sequential). Each effect is adjusted for all other effects that appear earlier (to the left) in the model, but not for any effects that appear later in the model. It is appropriate for balanced (orthogonal, equal n), analyses of variance in which the effects are specified in proper order (main effects, then two-way interactions, then three-way interactions, etc.) and for trend analysis where the powers for the quantitative factor are ordered from lowest to highest in the model statement. b) Type II SS involve the adjustments regardless of the order of the effects in the model statement. There is reduction in the SSE due to adding the effect to a model that contains all other effects except effects that contain the effect being tested.. c) Type III SS are each adjusted for all other effects in the model, regardless of order. It is recommended in non-orthogonal data. This is also the SS that are approximated by the traditional unweighted means ANOVA that uses harmonic mean sample sizes to adjust cell totals. d) Type IV SS are identical to Type III SS for designs with no missing cells. Multiple Comparison Procedures a) Least Significant Difference (LSD) The aim of the procedure is to determine the least difference between a pair of means that will be significant and to compare that value with the calculated differences between two means is greater than the least significant difference, it can be concluded that the difference between this pair of means is significant. LSD is computed LSD t ij / 2, N MS RES 1 ni 1 n j where MS RES ni 1 n j 1 is the standard error of the estimator of the difference between the mean of two groups i and j. b) Scheffe' Test A test used to find where the differences between means lie when the Analysis of Variance indicates the means are not all equal. The Scheffe' test is generally used when the sample sizes are different. It uses a critical value from ANOVA and multiply by k- 1where k is number of groups (means) F' critical = (k 1) F critical xi x j ' Test Value Fs If F s F Critical then the two means are significantly different 2 S 1 1 w ni n j c) Tukey s Test A test used to find where the differences between the means lie when the Analysis of Variance indicates the means are not all equal. The Tukey test is generally used when the sample sizes are all the same. All means for each condition are ranked in order of magnitude; group with lowest mean gets a ranking of 1. The pairwise differences between means, starting with the largest mean compared to the smallest mean, are tabulated
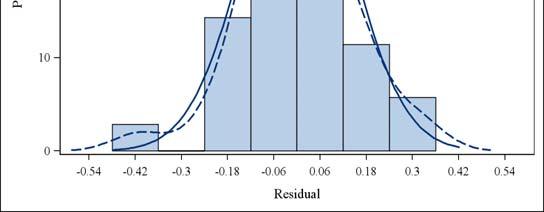
4 between each group pair and divided by the standard error. The value, q computed xi x j as q, is compared to a Studentized range critical value. If q is larger than the 2 sw / n critical value, then the expression between that group pair is considered to be statistically different. d) Student-Newman-Keuls (SNK) test: This test is similar to the Tukey test, except with regard to how the critical value is determined. All q s in Tukey s test are compared to the same critical value determined for that experiment; whereas all q s determined from SNK test are compared to a different critical value. This makes the SNK test slightly less conservative than the Tukey test. Tests for Homogeneity of Variances a) Levene s Test b) Brown-Forsythe Test c) F max Test Checking for Normality If the assumptions for the ANOVA hold, the values from each sample should come from a normal distribution. Departures from normality can suggest the presence of outliers in the data, or of a non-normal distribution in one or more of the samples. The normality test will give an indication of whether the populations from which the samples were drawn appear to be normally distributed, but will not indicate the cause(s) of the non-normality. The smaller the sample size, the less likely the normality test will be able to detect non-normality. Normality tests: a) Kolmogorov-Smirnov test; Anderson-Darling test (both based on the empirical CDF). b) Shapiro-Wilk s test; Ryan-Joiner test (both are correlation based applicable for n < 50). c) D Agostino s test (n>=50). Graphical methods: The graphic displays can convey the patterns and relationships easily than by other analytic methods. However, the power of graphical methods relies on our eye-brain system and the graphical technique a) Histograms: The histogram each sample has a reference normal distribution curve for a normal distribution with the same mean and variance as the sample. This provides a reference for detecting gross non-normality when the sample sizes are large. b) Normality test for residuals: If the assumptions for the ANOVA hold, all the residuals should come from the same normal distribution with mean 0. Departures from normality can suggest the presence of outliers in the data, or of a non-normal distribution in one or more of the populations from which the samples were drawn. c) Histogram for residuals: The histogram for residuals has a reference normal distribution curve for a normal distribution with the same mean and variance as the residuals. This provides a reference for detecting gross nonnormality when the sample sizes are large. d) Boxplot for residuals: Suspected outliers appear in a boxplot as individual points o or x outside the box. If these appear on both sides of the box, they also suggest the possibility of a heavy-tailed distribution. If they appear on only one side, they also suggest the possibility of a skewed distribution. Skewness is also suggested if the mean (+) does not lie on or near the central line of the boxplot, or if the central line of the boxplot does not evenly divide the box.
5 e) Normal probability plot for residuals: For data sampled from a normal distribution, the normal probability plot, (normal Q-Q plot) has the points all lying on or near the straight line drawn through the middle half of the points. Scattered points lying away from the line are suspected outliers. f) Residuals plotted against fitted values: If the fitted model under the assumption of populations with equal variance is correct, the plot of residuals against fitted values should suggest a horizontal band across the graph. The graph of residuals against fitted values will consist of vertical "stacks" of residuals, one stack for each unique sample mean. The stacks should be about the same length and at about the same level. Outliers may appear as anomalous points in the graph (although an outlier may not turn up in the residuals plot by virtue of affecting the mean so that its fitted value lies near it). g) Kernel Density Plot: Another graphical method for normality test is the kernel density plot that portrays the distribution of data directly. In order to get the plot, we first have to perform statistical density estimation, which involves approximating a hypothesized probability density function from the observed data. Kernel density estimation is a nonparametric technique for density estimation in which a known density function (kernel) is averaged across the observed data points to create a smooth approximation. After plotting the density function, we can easily check the normality by comparing the shape of resulting plot with the bell-shaped curve of normal distribution. Example 1: In milk filling plant, four machines are filling milk in the cans to a level of 12.0 litres random samples of the cans from each of the four machines were taken. The following table gives the quantity of milk filled in the cans by different machines. Machine Quantity of Milk A A A 12.1 A 12.3 A. B 12.6 B B B B C 11.9 C C C C D 12.1 D D D. D. Test the differences among machine with regard to average quantity of milk filled in the cans
6 SAS Procedure PROC ANOVA DATA=WORK.TMP0TempTableInput ; CLASS Machine; MODEL "Qunatity of Milk"n = Machine ; MEANS Machine / TUKEY ALPHA=0.05 ; MEANS Machine / LSD ALPHA=0.05 ; RUN; QUIT; One-Way Analysis of Variance Results Class Level Information Class Levels Values Machine 4 A B C D Number of Observations Read 20 Number of Observations Used 17 Source DF Sum of Squares Mean Square F Value Pr > F Model Error Corrected Total R Square Coeff Var Root MSE Quantity of Milk Mean Source DF Anova SS Mean Square F Value Pr > F Machine
7 Tukey's Studentized Range (HSD) Test for Quantity of Milk Alpha 0.05 Error Degrees of Freedom 13 Error Mean Square Critical Value of Studentized Range Comparisons significant at the 0.05 level are indicated by ***. Difference Between Simultaneous 95% Means Confidence Limits Machine Comparison B A B D B C A B A D A C D B D A D C C B C A C D t Tests (LSD) for Quantity of Milk Alpha 0.05 Error Degrees of Freedom 13 Error Mean Square Critical Value of t Comparisons significant at the 0.05 level are indicated by ***. Machine Comparison Difference Between Means 95% Confidence Limits B A B D B C *** A B A D A C D B D A D C C B *** C A C D Means Plot of 'Quantity of Milk' by Machine
8 Example 2: An experiment was conducted with Five levels of Total Solid (17 %, 20%, 23% 26% and 30 %) to examine the influence on the quality of ice-cream.a sensory evaluation was carried out and the table below gives the overall acceptability scores of Ice cream prepared with 5 levels of total solids given by a panel of seven judges. Obs ratio judge score
9 SAS Procedure proc glm data=rmsas.two_way_one_obs plots(only)=diagnostics(unpack); class fat_ratio judge; model score=fat_ratio judge; title 'TWO WAY ANOVA for Consistency Score'; run; quit; TWO WAY ANOVA for Consistency Score The GLM Procedure Source DF Sum of Squares Mean Square F Value Pr > F Model <.0001 Error Corrected Total R Square Coeff Var Root MSE score Mean Source DF Type I SS Mean Square F Value Pr > F fat_ratio <.0001 judge Source DF Type III SS Mean Square F Value Pr > F fat_ratio <.0001 judge
10
11 Example 3: Four batches of paneer were prepared by taking three levels of fat contents of milk and three churning speeds and moisture contents of these samples were recorded and are given below : SAS Procedure fat_ moisture_ Obs level speed batch content proc glm data=rmsas.two_way_inter; class fat_level speed batch; model moisture_content=fat_level speed fat_level*speed; title 'Analyze the Effects of fat_level & speed'; title2 'Including Interaction'; run; quit;
12 Analyze the Effects of fat_level & speed Including Interaction The GLM Procedure Source DF Sum of Squares Mean Square F Value Pr > F Model <.0001 Error Corrected Total R Square Coeff Var Root MSE moisture_content Mean Source DF Type I SS Mean Square F Value Pr > F fat_level <.0001 speed fat_level*speed <.0001 Source DF Type III SS Mean Square F Value Pr > F fat_level <.0001 speed fat_level*speed <.0001 References: Susan J. Slaughter & Lora D. Delwiche. The Little SAS Book for Enterprise Guide 4.2. Kaps M and Lamberson W R. Bio Statistics for Animal Sciences, CABI Publications
Lec 1: An Introduction to ANOVA
 Ying Li Stockholm University October 31, 2011 Three end-aisle displays Which is the best? Design of the Experiment Identify the stores of the similar size and type. The displays are randomly assigned to
Laboratory Topics 4 & 5
 PLS205 Lab 3 January 23, 2014 Orthogonal contrasts Class comparisons in SAS Trend analysis in SAS Multiple mean comparisons Laboratory Topics 4 & 5 Orthogonal contrasts Planned, single degree-of-freedom
Introduction. Chapter 8
 Chapter 8 Introduction In general, a researcher wants to compare one treatment against another. The analysis of variance (ANOVA) is a general test for comparing treatment means. When the null hypothesis
A posteriori multiple comparison tests
 A posteriori multiple comparison tests 11/15/16 1 Recall the Lakes experiment Source of variation SS DF MS F P Lakes 58.000 2 29.400 8.243 0.006 Error 42.800 12 3.567 Total 101.600 14 The ANOVA tells us
Linear Combinations of Group Means
 Linear Combinations of Group Means Look at the handicap example on p. 150 of the text. proc means data=mth567.disability; class handicap; var score; proc sort data=mth567.disability; by handicap; proc
STAT 115:Experimental Designs
 STAT 115:Experimental Designs Josefina V. Almeda 2013 Multisample inference: Analysis of Variance 1 Learning Objectives 1. Describe Analysis of Variance (ANOVA) 2. Explain the Rationale of ANOVA 3. Compare
Biological Applications of ANOVA - Examples and Readings
 BIO 575 Biological Applications of ANOVA - Winter Quarter 2010 Page 1 ANOVA Pac Biological Applications of ANOVA - Examples and Readings One-factor Model I (Fixed Effects) This is the same example for
Answer Keys to Homework#10
 Answer Keys to Homework#10 Problem 1 Use either restricted or unrestricted mixed models. Problem 2 (a) First, the respective means for the 8 level combinations are listed in the following table A B C Mean
Linear Combinations. Comparison of treatment means. Bruce A Craig. Department of Statistics Purdue University. STAT 514 Topic 6 1
 Linear Combinations Comparison of treatment means Bruce A Craig Department of Statistics Purdue University STAT 514 Topic 6 1 Linear Combinations of Means y ij = µ + τ i + ǫ ij = µ i + ǫ ij Often study
Assignment 9 Answer Keys
 Assignment 9 Answer Keys Problem 1 (a) First, the respective means for the 8 level combinations are listed in the following table A B C Mean 26.00 + 34.67 + 39.67 + + 49.33 + 42.33 + + 37.67 + + 54.67
Pairwise multiple comparisons are easy to compute using SAS Proc GLM. The basic statement is:
 Pairwise Multiple Comparisons in SAS Pairwise multiple comparisons are easy to compute using SAS Proc GLM. The basic statement is: means effects / options Here, means is the statement initiat, effects
1 One-way Analysis of Variance
 1 One-way Analysis of Variance Suppose that a random sample of q individuals receives treatment T i, i = 1,,... p. Let Y ij be the response from the jth individual to be treated with the ith treatment
The entire data set consists of n = 32 widgets, 8 of which were made from each of q = 4 different materials.
 One-Way ANOVA Summary The One-Way ANOVA procedure is designed to construct a statistical model describing the impact of a single categorical factor X on a dependent variable Y. Tests are run to determine
unadjusted model for baseline cholesterol 22:31 Monday, April 19,
 unadjusted model for baseline cholesterol 22:31 Monday, April 19, 2004 1 Class Level Information Class Levels Values TRETGRP 3 3 4 5 SEX 2 0 1 Number of observations 916 unadjusted model for baseline cholesterol
Introduction to Analysis of Variance (ANOVA) Part 2
 Part 2") Introduction to Analysis of Variance (ANOVA) Part 2 Single factor Serpulid recruitment and biofilms Effect of biofilm type on number of recruiting serpulid worms in Port Phillip Bay Response variable:
Introduction to Analysis of Variance (ANOVA) Part 2 Single factor Serpulid recruitment and biofilms Effect of biofilm type on number of recruiting serpulid worms in Port Phillip Bay Response variable:
Outline. Topic 19 - Inference. The Cell Means Model. Estimates. Inference for Means Differences in cell means Contrasts. STAT Fall 2013
 Topic 19 - Inference - Fall 2013 Outline Inference for Means Differences in cell means Contrasts Multiplicity Topic 19 2 The Cell Means Model Expressed numerically Y ij = µ i + ε ij where µ i is the theoretical
Example: Four levels of herbicide strength in an experiment on dry weight of treated plants.
 The idea of ANOVA Reminders: A factor is a variable that can take one of several levels used to differentiate one group from another. An experiment has a one-way, or completely randomized, design if several
9 One-Way Analysis of Variance
 9 One-Way Analysis of Variance SW Chapter 11 - all sections except 6. The one-way analysis of variance (ANOVA) is a generalization of the two sample t test to k 2 groups. Assume that the populations of
DETAILED CONTENTS PART I INTRODUCTION AND DESCRIPTIVE STATISTICS. 1. Introduction to Statistics
 DETAILED CONTENTS About the Author Preface to the Instructor To the Student How to Use SPSS With This Book PART I INTRODUCTION AND DESCRIPTIVE STATISTICS 1. Introduction to Statistics 1.1 Descriptive and
PLS205 Lab 2 January 15, Laboratory Topic 3
 PLS205 Lab 2 January 15, 2015 Laboratory Topic 3 General format of ANOVA in SAS Testing the assumption of homogeneity of variances by "/hovtest" by ANOVA of squared residuals Proc Power for ANOVA One-way
More about Single Factor Experiments
 More about Single Factor Experiments 1 2 3 0 / 23 1 2 3 1 / 23 Parameter estimation Effect Model (1): Y ij = µ + A i + ɛ ij, Ji A i = 0 Estimation: µ + A i = y i. ˆµ = y..  i = y i. y.. Effect Modell
One-way ANOVA Model Assumptions
 One-way ANOVA Model Assumptions STAT:5201 Week 4: Lecture 1 1 / 31 One-way ANOVA: Model Assumptions Consider the single factor model: Y ij = µ + α }{{} i ij iid with ɛ ij N(0, σ 2 ) mean structure random
4.8 Alternate Analysis as a Oneway ANOVA
 4.8 Alternate Analysis as a Oneway ANOVA Suppose we have data from a two-factor factorial design. The following method can be used to perform a multiple comparison test to compare treatment means as well
sphericity, 5-29, 5-32 residuals, 7-1 spread and level, 2-17 t test, 1-13 transformations, 2-15 violations, 1-19
 additive tree structure, 10-28 ADDTREE, 10-51, 10-53 EXTREE, 10-31 four point condition, 10-29 ADDTREE, 10-28, 10-51, 10-53 adjusted R 2, 8-7 ALSCAL, 10-49 ANCOVA, 9-1 assumptions, 9-5 example, 9-7 MANOVA
df=degrees of freedom = n - 1
 One sample t-test test of the mean Assumptions: Independent, random samples Approximately normal distribution (from intro class: σ is unknown, need to calculate and use s (sample standard deviation)) Hypotheses:
Unit 27 One-Way Analysis of Variance
 Unit 27 One-Way Analysis of Variance Objectives: To perform the hypothesis test in a one-way analysis of variance for comparing more than two population means Recall that a two sample t test is applied
Glossary. The ISI glossary of statistical terms provides definitions in a number of different languages:
 Glossary The ISI glossary of statistical terms provides definitions in a number of different languages: http://isi.cbs.nl/glossary/index.htm Adjusted r 2 Adjusted R squared measures the proportion of the
Unit 12: Analysis of Single Factor Experiments
 Unit 12: Analysis of Single Factor Experiments Statistics 571: Statistical Methods Ramón V. León 7/16/2004 Unit 12 - Stat 571 - Ramón V. León 1 Introduction Chapter 8: How to compare two treatments. Chapter
Chap The McGraw-Hill Companies, Inc. All rights reserved.
 11 pter11 Chap Analysis of Variance Overview of ANOVA Multiple Comparisons Tests for Homogeneity of Variances Two-Factor ANOVA Without Replication General Linear Model Experimental Design: An Overview
Group comparison test for independent samples
 Group comparison test for independent samples The purpose of the Analysis of Variance (ANOVA) is to test for significant differences between means. Supposing that: samples come from normal populations
ANOVA: Analysis of Variation
 ANOVA: Analysis of Variation The basic ANOVA situation Two variables: 1 Categorical, 1 Quantitative Main Question: Do the (means of) the quantitative variables depend on which group (given by categorical
This is a Randomized Block Design (RBD) with a single factor treatment arrangement (2 levels) which are fixed.
 with a single factor treatment arrangement (2 levels) which are fixed.") EXST3201 Chapter 13c Geaghan Fall 2005: Page 1 Linear Models Y ij = µ + βi + τ j + βτij + εijk This is a Randomized Block Design (RBD) with a single factor treatment arrangement (2 levels) which are fixed.
EXST3201 Chapter 13c Geaghan Fall 2005: Page 1 Linear Models Y ij = µ + βi + τ j + βτij + εijk This is a Randomized Block Design (RBD) with a single factor treatment arrangement (2 levels) which are fixed.
Application of Variance Homogeneity Tests Under Violation of Normality Assumption
 Application of Variance Homogeneity Tests Under Violation of Normality Assumption Alisa A. Gorbunova, Boris Yu. Lemeshko Novosibirsk State Technical University Novosibirsk, Russia e-mail: gorbunova.alisa@gmail.com
Week 7.1--IES 612-STA STA doc
 Week 7.1--IES 612-STA 4-573-STA 4-576.doc IES 612/STA 4-576 Winter 2009 ANOVA MODELS model adequacy aka RESIDUAL ANALYSIS Numeric data samples from t populations obtained Assume Y ij ~ independent N(μ
Lecture 5: Comparing Treatment Means Montgomery: Section 3-5
 Lecture 5: Comparing Treatment Means Montgomery: Section 3-5 Page 1 Linear Combination of Means ANOVA: y ij = µ + τ i + ɛ ij = µ i + ɛ ij Linear combination: L = c 1 µ 1 + c 1 µ 2 +...+ c a µ a = a i=1
T-test: means of Spock's judge versus all other judges 1 12:10 Wednesday, January 5, judge1 N Mean Std Dev Std Err Minimum Maximum
 T-test: means of Spock's judge versus all other judges 1 The TTEST Procedure Variable: pcwomen judge1 N Mean Std Dev Std Err Minimum Maximum OTHER 37 29.4919 7.4308 1.2216 16.5000 48.9000 SPOCKS 9 14.6222
DESIGNING EXPERIMENTS AND ANALYZING DATA A Model Comparison Perspective
 DESIGNING EXPERIMENTS AND ANALYZING DATA A Model Comparison Perspective Second Edition Scott E. Maxwell Uniuersity of Notre Dame Harold D. Delaney Uniuersity of New Mexico J,t{,.?; LAWRENCE ERLBAUM ASSOCIATES,
The Model Building Process Part I: Checking Model Assumptions Best Practice
 The Model Building Process Part I: Checking Model Assumptions Best Practice Authored by: Sarah Burke, PhD 31 July 2017 The goal of the STAT T&E COE is to assist in developing rigorous, defensible test
Chapter 8 (More on Assumptions for the Simple Linear Regression)
") EXST3201 Chapter 8b Geaghan Fall 2005: Page 1 Chapter 8 (More on Assumptions for the Simple Linear Regression) Your textbook considers the following assumptions: Linearity This is not something I usually
EXST3201 Chapter 8b Geaghan Fall 2005: Page 1 Chapter 8 (More on Assumptions for the Simple Linear Regression) Your textbook considers the following assumptions: Linearity This is not something I usually
Outline. Topic 20 - Diagnostics and Remedies. Residuals. Overview. Diagnostics Plots Residual checks Formal Tests. STAT Fall 2013
 Topic 20 - Diagnostics and Remedies - Fall 2013 Diagnostics Plots Residual checks Formal Tests Remedial Measures Outline Topic 20 2 General assumptions Overview Normally distributed error terms Independent
Introduction to Design and Analysis of Experiments with the SAS System (Stat 7010 Lecture Notes)
") Introduction to Design and Analysis of Experiments with the SAS System (Stat 7010 Lecture Notes) Asheber Abebe Discrete and Statistical Sciences Auburn University Contents 1 Completely Randomized Design
Introduction to Design and Analysis of Experiments with the SAS System (Stat 7010 Lecture Notes) Asheber Abebe Discrete and Statistical Sciences Auburn University Contents 1 Completely Randomized Design
SAS Procedures Inference about the Line ffl model statement in proc reg has many options ffl To construct confidence intervals use alpha=, clm, cli, c
 Inference About the Slope ffl As with all estimates, ^fi1 subject to sampling var ffl Because Y jx _ Normal, the estimate ^fi1 _ Normal A linear combination of indep Normals is Normal Simple Linear Regression
Tentative solutions TMA4255 Applied Statistics 16 May, 2015
 Norwegian University of Science and Technology Department of Mathematical Sciences Page of 9 Tentative solutions TMA455 Applied Statistics 6 May, 05 Problem Manufacturer of fertilizers a) Are these independent
Exam details. Final Review Session. Things to Review
 Exam details Final Review Session Short answer, similar to book problems Formulae and tables will be given You CAN use a calculator Date and Time: Dec. 7, 006, 1-1:30 pm Location: Osborne Centre, Unit
Analysis of variance and regression. April 17, Contents Comparison of several groups One-way ANOVA. Two-way ANOVA Interaction Model checking
 Analysis of variance and regression Contents Comparison of several groups One-way ANOVA April 7, 008 Two-way ANOVA Interaction Model checking ANOVA, April 008 Comparison of or more groups Julie Lyng Forman,
STATISTICS 479 Exam II (100 points)
") Name STATISTICS 79 Exam II (1 points) 1. A SAS data set was created using the following input statement: Answer parts(a) to (e) below. input State $ City $ Pop199 Income Housing Electric; (a) () Give the
Name STATISTICS 79 Exam II (1 points) 1. A SAS data set was created using the following input statement: Answer parts(a) to (e) below. input State $ City $ Pop199 Income Housing Electric; (a) () Give the
Remedial Measures, Brown-Forsythe test, F test
 Remedial Measures, Brown-Forsythe test, F test Dr. Frank Wood Frank Wood, fwood@stat.columbia.edu Linear Regression Models Lecture 7, Slide 1 Remedial Measures How do we know that the regression function
ST505/S697R: Fall Homework 2 Solution.
 ST505/S69R: Fall 2012. Homework 2 Solution. 1. 1a; problem 1.22 Below is the summary information (edited) from the regression (using R output); code at end of solution as is code and output for SAS. a)
Inferences for Regression
 Inferences for Regression An Example: Body Fat and Waist Size Looking at the relationship between % body fat and waist size (in inches). Here is a scatterplot of our data set: Remembering Regression In
PLS205!! Lab 9!! March 6, Topic 13: Covariance Analysis
 PLS205!! Lab 9!! March 6, 2014 Topic 13: Covariance Analysis Covariable as a tool for increasing precision Carrying out a full ANCOVA Testing ANOVA assumptions Happiness! Covariable as a Tool for Increasing
Multiple Comparison Procedures Cohen Chapter 13. For EDUC/PSY 6600
 Multiple Comparison Procedures Cohen Chapter 13 For EDUC/PSY 6600 1 We have to go to the deductions and the inferences, said Lestrade, winking at me. I find it hard enough to tackle facts, Holmes, without
SAS Commands. General Plan. Output. Construct scatterplot / interaction plot. Run full model
 Topic 23 - Unequal Replication Data Model Outline - Fall 2013 Parameter Estimates Inference Topic 23 2 Example Page 954 Data for Two Factor ANOVA Y is the response variable Factor A has levels i = 1, 2,...,
Analysis of Variance
 Statistical Techniques II EXST7015 Analysis of Variance 15a_ANOVA_Introduction 1 Design The simplest model for Analysis of Variance (ANOVA) is the CRD, the Completely Randomized Design This model is also
The Model Building Process Part I: Checking Model Assumptions Best Practice (Version 1.1)
") The Model Building Process Part I: Checking Model Assumptions Best Practice (Version 1.1) Authored by: Sarah Burke, PhD Version 1: 31 July 2017 Version 1.1: 24 October 2017 The goal of the STAT T&E COE
The Model Building Process Part I: Checking Model Assumptions Best Practice (Version 1.1) Authored by: Sarah Burke, PhD Version 1: 31 July 2017 Version 1.1: 24 October 2017 The goal of the STAT T&E COE
1-Way ANOVA MATH 143. Spring Department of Mathematics and Statistics Calvin College
 1-Way ANOVA MATH 143 Department of Mathematics and Statistics Calvin College Spring 2010 The basic ANOVA situation Two variables: 1 Categorical, 1 Quantitative Main Question: Do the (means of) the quantitative
Lecture 3: Inference in SLR
 Lecture 3: Inference in SLR STAT 51 Spring 011 Background Reading KNNL:.1.6 3-1 Topic Overview This topic will cover: Review of hypothesis testing Inference about 1 Inference about 0 Confidence Intervals
1) Answer the following questions as true (T) or false (F) by circling the appropriate letter.
 Answer the following questions as true (T) or false (F) by circling the appropriate letter.") 1) Answer the following questions as true (T) or false (F) by circling the appropriate letter. T F T F T F a) Variance estimates should always be positive, but covariance estimates can be either positive
1) Answer the following questions as true (T) or false (F) by circling the appropriate letter. T F T F T F a) Variance estimates should always be positive, but covariance estimates can be either positive
Transition Passage to Descriptive Statistics 28
 viii Preface xiv chapter 1 Introduction 1 Disciplines That Use Quantitative Data 5 What Do You Mean, Statistics? 6 Statistics: A Dynamic Discipline 8 Some Terminology 9 Problems and Answers 12 Scales of
Testing for Normality
 Testing for Normality For each mean and standard deviation combination a theoretical normal distribution can be determined. This distribution is based on the proportions shown below. This theoretical normal
 http://www.statsoft.it/out.php?loc=http://www.statsoft.com/textbook/ Group comparison test for independent samples The purpose of the Analysis of Variance (ANOVA) is to test for significant differences
COMPLETELY RANDOM DESIGN (CRD) -Design can be used when experimental units are essentially homogeneous.
 -Design can be used when experimental units are essentially homogeneous.") COMPLETELY RANDOM DESIGN (CRD) Description of the Design -Simplest design to use. -Design can be used when experimental units are essentially homogeneous. -Because of the homogeneity requirement, it may
COMPLETELY RANDOM DESIGN (CRD) Description of the Design -Simplest design to use. -Design can be used when experimental units are essentially homogeneous. -Because of the homogeneity requirement, it may
Preview from Notesale.co.uk Page 3 of 63
 Stem-and-leaf diagram - vertical numbers on far left represent the 10s, numbers right of the line represent the 1s The mean should not be used if there are extreme scores, or for ranks and categories Unbiased
Statistics for exp. medical researchers Comparison of groups, T-tests and ANOVA
 Faculty of Health Sciences Outline Statistics for exp. medical researchers Comparison of groups, T-tests and ANOVA Lene Theil Skovgaard Sept. 14, 2015 Paired comparisons: tests and confidence intervals
Descriptions of post-hoc tests
 Experimental Statistics II Page 81 Descriptions of post-hoc tests Post-hoc or Post-ANOVA tests! Once you have found out some treatment(s) are different, how do you determine which one(s) are different?
Dr. Junchao Xia Center of Biophysics and Computational Biology. Fall /1/2016 1/46
 BIO5312 Biostatistics Lecture 10:Regression and Correlation Methods Dr. Junchao Xia Center of Biophysics and Computational Biology Fall 2016 11/1/2016 1/46 Outline In this lecture, we will discuss topics
3rd Quartile. 1st Quartile) Minimum
 Minimum") EXST7034 - Regression Techniques Page 1 Regression diagnostics dependent variable Y3 There are a number of graphic representations which will help with problem detection and which can be used to obtain
EXST7034 - Regression Techniques Page 1 Regression diagnostics dependent variable Y3 There are a number of graphic representations which will help with problem detection and which can be used to obtain
Multiple Comparisons
 Multiple Comparisons Error Rates, A Priori Tests, and Post-Hoc Tests Multiple Comparisons: A Rationale Multiple comparison tests function to tease apart differences between the groups within our IV when
Topic 20: Single Factor Analysis of Variance
 Topic 20: Single Factor Analysis of Variance Outline Single factor Analysis of Variance One set of treatments Cell means model Factor effects model Link to linear regression using indicator explanatory
EXST Regression Techniques Page 1. We can also test the hypothesis H :" œ 0 versus H :"
 EXST704 - Regression Techniques Page 1 Using F tests instead of t-tests We can also test the hypothesis H :" œ 0 versus H :" Á 0 with an F test.! " " " F œ MSRegression MSError This test is mathematically
Lecture 11: Simple Linear Regression
 Lecture 11: Simple Linear Regression Readings: Sections 3.1-3.3, 11.1-11.3 Apr 17, 2009 In linear regression, we examine the association between two quantitative variables. Number of beers that you drink
STAT 501 EXAM I NAME Spring 1999
 STAT 501 EXAM I NAME Spring 1999 Instructions: You may use only your calculator and the attached tables and formula sheet. You can detach the tables and formula sheet from the rest of this exam. Show your
Statistics For Economics & Business
 Statistics For Economics & Business Analysis of Variance In this chapter, you learn: Learning Objectives The basic concepts of experimental design How to use one-way analysis of variance to test for differences
Chapter 16. Simple Linear Regression and dcorrelation
 Chapter 16 Simple Linear Regression and dcorrelation 16.1 Regression Analysis Our problem objective is to analyze the relationship between interval variables; regression analysis is the first tool we will
Review of Statistics 101
 Review of Statistics 101 We review some important themes from the course 1. Introduction Statistics- Set of methods for collecting/analyzing data (the art and science of learning from data). Provides methods
Lecture 3. Experiments with a Single Factor: ANOVA Montgomery 3.1 through 3.3
 Lecture 3. Experiments with a Single Factor: ANOVA Montgomery 3.1 through 3.3 Fall, 2013 Page 1 Tensile Strength Experiment Investigate the tensile strength of a new synthetic fiber. The factor is the
BE640 Intermediate Biostatistics 2. Regression and Correlation. Simple Linear Regression Software: SAS. Emergency Calls to the New York Auto Club
 BE640 Intermediate Biostatistics 2. Regression and Correlation Simple Linear Regression Software: SAS Emergency Calls to the New York Auto Club Source: Chatterjee, S; Handcock MS and Simonoff JS A Casebook
Lecture 3. Experiments with a Single Factor: ANOVA Montgomery 3-1 through 3-3
 Lecture 3. Experiments with a Single Factor: ANOVA Montgomery 3-1 through 3-3 Page 1 Tensile Strength Experiment Investigate the tensile strength of a new synthetic fiber. The factor is the weight percent
Regression models. Categorical covariate, Quantitative outcome. Examples of categorical covariates. Group characteristics. Faculty of Health Sciences
 Faculty of Health Sciences Categorical covariate, Quantitative outcome Regression models Categorical covariate, Quantitative outcome Lene Theil Skovgaard April 29, 2013 PKA & LTS, Sect. 3.2, 3.2.1 ANOVA
Topic 13. Analysis of Covariance (ANCOVA) [ST&D chapter 17] 13.1 Introduction Review of regression concepts
![Topic 13. Analysis of Covariance (ANCOVA) [ST&D chapter 17] 13.1 Introduction Review of regression concepts](/thumbs/85/91874865.jpg "Topic 13. Analysis of Covariance (ANCOVA) [ST&D chapter 17] 13.1 Introduction Review of regression concepts") Topic 13. Analysis of Covariance (ANCOVA) [ST&D chapter 17] 13.1 Introduction The analysis of covariance (ANCOVA) is a technique that is occasionally useful for improving the precision of an experiment.
Topic 13. Analysis of Covariance (ANCOVA) [ST&D chapter 17] 13.1 Introduction The analysis of covariance (ANCOVA) is a technique that is occasionally useful for improving the precision of an experiment.
Contrasts and Multiple Comparisons Supplement for Pages
 Contrasts and Multiple Comparisons Supplement for Pages 302-323 Brian Habing University of South Carolina Last Updated: July 20, 2001 The F-test from the ANOVA table allows us to test the null hypothesis
13: Additional ANOVA Topics. Post hoc Comparisons
 13: Additional ANOVA Topics Post hoc Comparisons ANOVA Assumptions Assessing Group Variances When Distributional Assumptions are Severely Violated Post hoc Comparisons In the prior chapter we used ANOVA
Lecture 18: Simple Linear Regression
 Lecture 18: Simple Linear Regression BIOS 553 Department of Biostatistics University of Michigan Fall 2004 The Correlation Coefficient: r The correlation coefficient (r) is a number that measures the strength
Handout 1: Predicting GPA from SAT
 Handout 1: Predicting GPA from SAT appsrv01.srv.cquest.utoronto.ca> appsrv01.srv.cquest.utoronto.ca> ls Desktop grades.data grades.sas oldstuff sasuser.800 appsrv01.srv.cquest.utoronto.ca> cat grades.data
Multiple t Tests. Introduction to Analysis of Variance. Experiments with More than 2 Conditions
 Introduction to Analysis of Variance 1 Experiments with More than 2 Conditions Often the research that psychologists perform has more conditions than just the control and experimental conditions You might
Chapter 16. Simple Linear Regression and Correlation
 Chapter 16 Simple Linear Regression and Correlation 16.1 Regression Analysis Our problem objective is to analyze the relationship between interval variables; regression analysis is the first tool we will
Orthogonal contrasts and multiple comparisons
 BIOL 933 Lab 4 Fall 2017 Orthogonal contrasts Class comparisons in R Trend analysis in R Multiple mean comparisons Orthogonal contrasts and multiple comparisons Orthogonal contrasts Planned, single degree-of-freedom
One-Way Analysis of Variance (ANOVA) There are two key differences regarding the explanatory variable X.
 There are two key differences regarding the explanatory variable X.") One-Way Analysis of Variance (ANOVA) Also called single factor ANOVA. The response variable Y is continuous (same as in regression). There are two key differences regarding the explanatory variable X.
One-Way Analysis of Variance (ANOVA) Also called single factor ANOVA. The response variable Y is continuous (same as in regression). There are two key differences regarding the explanatory variable X.
Topic 17 - Single Factor Analysis of Variance. Outline. One-way ANOVA. The Data / Notation. One way ANOVA Cell means model Factor effects model
 Topic 17 - Single Factor Analysis of Variance - Fall 2013 One way ANOVA Cell means model Factor effects model Outline Topic 17 2 One-way ANOVA Response variable Y is continuous Explanatory variable is
N J SS W /df W N - 1
 One-Way ANOVA Source Table ANOVA MODEL: ij = µ* + α j + ε ij H 0 : µ = µ =... = µ j or H 0 : Σα j = 0 Source Sum of Squares df Mean Squares F J Between Groups nj( j * ) J - SS B /(J ) MS B /MS W = ( N
One-Way Analysis of Covariance (ANCOVA)
") Chapter 225 One-Way Analysis of Covariance (ANCOVA) Introduction This procedure performs analysis of covariance (ANCOVA) with one group variable and one covariate. This procedure uses multiple regression
Chapter 225 One-Way Analysis of Covariance (ANCOVA) Introduction This procedure performs analysis of covariance (ANCOVA) with one group variable and one covariate. This procedure uses multiple regression
5.3 Three-Stage Nested Design Example
 5.3 Three-Stage Nested Design Example A researcher designs an experiment to study the of a metal alloy. A three-stage nested design was conducted that included Two alloy chemistry compositions. Three ovens
Outline. Analysis of Variance. Comparison of 2 or more groups. Acknowledgements. Comparison of serveral groups
 Outline Analysis of Variance Analysis of variance and regression course http://staff.pubhealth.ku.dk/~jufo/varianceregressionf2011.html Comparison of serveral groups Model checking Marc Andersen, mja@statgroup.dk
What Is ANOVA? Comparing Groups. One-way ANOVA. One way ANOVA (the F ratio test)
") What Is ANOVA? One-way ANOVA ANOVA ANalysis Of VAriance ANOVA compares the means of several groups. The groups are sometimes called "treatments" First textbook presentation in 95. Group Group σ µ µ σ µ
What Is ANOVA? One-way ANOVA ANOVA ANalysis Of VAriance ANOVA compares the means of several groups. The groups are sometimes called "treatments" First textbook presentation in 95. Group Group σ µ µ σ µ
M A N O V A. Multivariate ANOVA. Data
 M A N O V A Multivariate ANOVA V. Čekanavičius, G. Murauskas 1 Data k groups; Each respondent has m measurements; Observations are from the multivariate normal distribution. No outliers. Covariance matrices
Analysis of variance. April 16, Contents Comparison of several groups
 Contents Comparison of several groups Analysis of variance April 16, 2009 One-way ANOVA Two-way ANOVA Interaction Model checking Acknowledgement for use of presentation Julie Lyng Forman, Dept. of Biostatistics
Analysis of variance. April 16, 2009
 Analysis of variance April 16, 2009 Contents Comparison of several groups One-way ANOVA Two-way ANOVA Interaction Model checking Acknowledgement for use of presentation Julie Lyng Forman, Dept. of Biostatistics
4:3 LEC - PLANNED COMPARISONS AND REGRESSION ANALYSES
 4:3 LEC - PLANNED COMPARISONS AND REGRESSION ANALYSES FOR SINGLE FACTOR BETWEEN-S DESIGNS Planned or A Priori Comparisons We previously showed various ways to test all possible pairwise comparisons for
22s:152 Applied Linear Regression. Take random samples from each of m populations.
 22s:152 Applied Linear Regression Chapter 8: ANOVA NOTE: We will meet in the lab on Monday October 10. One-way ANOVA Focuses on testing for differences among group means. Take random samples from each
The One-Way Independent-Samples ANOVA. (For Between-Subjects Designs)
") The One-Way Independent-Samples ANOVA (For Between-Subjects Designs) Computations for the ANOVA In computing the terms required for the F-statistic, we won t explicitly compute any sample variances or
The One-Way Independent-Samples ANOVA (For Between-Subjects Designs) Computations for the ANOVA In computing the terms required for the F-statistic, we won t explicitly compute any sample variances or
Analysis of Variance
 1 / 70 Analysis of Variance Analysis of variance and regression course http://staff.pubhealth.ku.dk/~lts/regression11_2 Marc Andersen, mja@statgroup.dk Analysis of variance and regression for health researchers,