A Thesis. Md. Ali Nawab, B.Sc. {Honours), M.Sc. {Dacca University)
|
|
|
- August Webb
- 5 years ago
- Views:
Transcription
1 THE VISCOSITY OF DIWTE EMULSIONS AND SUSPENSIONS A Thesis by Md. Ali Nawab, B.Sc. {Honours), M.Sc. {Dacca University) Submitted to the Faculty of Graduate Studies and Research of McGill University in partial fulfilment of the requirements for the degree of Doctor of Philosophy Department of Chemistry, McGill University, Montreal, P.Q., Canada August 1957
2 ACKNCMLEIGEMENI'S The author would like to take this opportunity for expressing his most sincere gratitude and grateful thanlœ to Dr. S.G. Mason, for his encouragement, valuable guidance and suggestions, without which the work would never have been completed, the Technical Co-operation Service of the Colombo Plan, Department of Trade and Commerce, Government of Canada, for a scholarship, travel grants and thesis expanses during the period of this work, Dacca University, East Pakistan, for granting stuqy leave, Dr. D.A.I. Goring and Dr. A.A. Robertson for their valuable discussions, the Atlas Powder Co., Brantford, Canada, for the supply of emulsifiers and related information, the Pulp and Paper Research Institute of Canada for accommodation and laboratory facilities, all service sections of the Pulp and Paper Research Institute of Canada for their technical assistance and many helpful gestures, O.L. Forgacs for measuring the~ values of the rayon fibres, A.R.G. Lang for his assistance in correcting typographical errors.
3 (i) FOREWORD This thesis describes an investigation of the viscosity of dilute emulsions and suspensions of rigid and.flexible thread-like particles. The method of presentation needs some explanation. It has been written to achieve brevity, without loss of clarity, and at tbe same time to make it possible for its different parts to be published in the scientific literature with little or no modification. For the benefit of the reader, each part has been made complete in itself with separate introduction and bibliography. A brier resume of the theories of viscosity has been given in Part I, without attempting to give details of the derivation of any of the equations. The scope of the present work may be summarized as follows: The experimental work consista of different parts dealing with the preparation of emulsions, viscosity of dilute emulsions and the viscosity of dilute suspensions of rod-like particles. It was necessar,y to devise a convenient method of preparing stable and reasonably monodisperse emulsions of accurately known disperse-phase concentrations. A new technique based on electrical atomization of the disperse phase was developed. This is described in Part II.
4 (ii) Experimental values of the particle co-efficient o( 0 and the interaction co-efficient ~l of emulsions, having various viscosity ratios ~ were measured in capillary viscometers of special design under conditions of negligible particle deformation. Non-ionie and anionic emulsifiers were employed as the stabilizers; also the affects of added electrolytes have been studied. The resulta have been compared with Taylorts theory which considera the effect of internal circulation in fluid drops on the emulsion viscosity and also with Oldroyd's theory accounting for the presence of viscous and visco-elastic interracial films. This is presented in Part III. Measurements of d., 0 and ot 1 of suspensions of thin rayon filaments having axis ratios covering the range from 43 to 356 were carried out in coaxial cylinder viscometer. Separate observations were made of the orbital behaviour and flexibility of the particles in laminar shear. The resulta have been compared with various modifieations of Jeffery's and Burgers' theories. This forms Part IV of the thesis. Parts II, III and IV are independant of each other and can be easily followed without cross references. Additional information on experimental procedure and results, description of apparatus and historical reviews have been compiled as a series of Appendices. Finally, sections entitled "suggestions for further work" and "claims to original research" are presented.
5 (iii) SUMMARY The viscosity of a series of dilute monodisperse oil/water emulsions, prepared by a new technique, has been measured at various concentrations and the intrinsic viscosity o( 0 and the interaction co-efficient o( 1 determined in the Newtonian region. In some cases measured o( 0 values were in excellent agreement with Taylorts theory. In others, positive deviations were observed which have been explained by the recent theory of Oldroyd accounting for the presence of viscous or visco-elastic interfacial films. The effect of precipitating electrolytes on emulsion viscosity containing anionic emulsifiers has been studied and it has been concluded that interfacial films of increasing rigidity are initially for.med, which subsequently become fragile on further addition of the electrolyte. It was observed that the interaction co-efficient 0( 1, for emulsions obeying Taylorts theory, increased with 0{ 0 in a systematic order while for emulsions devia ting from Taylorts theory, r:1.. unique ].y determined by d 0 1 was not A method of preparing emulsions having narrow size distribution in which the disperse phase is first atomized to form an aerosol has been developed. The method, which is of general applicability, is particularly suitable!or preparation of accurately known concentrations of the disperse phase and has a number of advantages over the conventional methods of emulsification.
6 (iv) The viscosity of dilute suspensions of both rigid and flexible fibres of rayon in castor oil has been measured at different shear rates in rotational viscometer. Suspensions of fibres having axis ratio greater than 113 were found to exhibit the Weissenberg effect indicating elastic deformation of the particles under shear. Experimental resulta have been correlated with the Jeffer,r Burgers'viscosity theor,y modified by the 'equivalent axis ratio concept' of Mason ~ al. It has been concluded that flexible fibres contribute more to viscosity than rigid ones. The observations have been confirmed by the viscosity measurements of swollen fibres. A single viscosity parameter has been proposed to cover both the rigid and flexible fibres.
7 (v) TABLE OF CONI'ENI'S PART I Page GENERAL INTRODUCTION 1. Suspension of solid spheres 1 2. :Elnulsions 4 3. Suspension of thread-like particles 8 4. Wall effect 9 PART II Preparation of Monodisperse Emulsions by Electrical Atomization 1. INI'RODUCTION 2. EXPERIMENTAL l'art (a) Electrical Atomization (b) Preparation of Emulsions DISCUSSION PART III Viscosity of Dilute Emulsions 1. INTRODUCTION ~!MENT AL PART.3.3 (a) Preparation of Emulsions 33 (b) Viscosity Measurements R.ESULTS (a) Preliminary Measurements. (b) Emulsions Obeying Taylor's Theory. (c) Emulsions deviating from Taylor's Theor.y 4. DISCUSSION PART IV Viscosity of Dilute Suspensions of Rod-like Particles 1. INTRODUCTION 65
8 (vi) TABLE OF CONI'ENTS ( continued) 2. EXPERIMENTAL PART 71 Page J. RESULTS. (a) ~lall-effect (b) Behaviour of Sheared Suspensions (c) Behaviour of Single Fibres in Double (d) Swelling of Fibres 4. DISCUSSION (a) Intrinsic Viscosity ex (b) Possible Causes of --2 deviation. (c) Time effect (d) other Effects. (e) Interaction co-efficient â 1 (f) The Weissenberg Effect ~.. Couette APPENDIX - A APPENDIX- B APPENDICES The Dilution Capillary Viscometers for Foaming Liquids 1. Description 2. Ope rat ion Experimental Investigations on Emulsion Viscosity An Historical Review APPENDIX - C-l The Viscosity of Dilute Emulsions: A Supplement to Part III 107 (a) Newtonian behaviour of emulsions 107 (b) Ca1eulation of density of an emulsion. 107 (c) Effect of emulsifier on d and ~l 107 (d) Addition of CaC1 2 to emulsîons containing anion1c emulsifier 110 (e) Variation of interfacial film 'viscosity' with emulsifier concentration 116 (f) Variation of o(l with ol 116 (g) Viscosity and surface te&sion of emulsifier solutions 119 APPENDIX - C-2 The Hydrophile-Lyophile. Balance (HLB) 122 APPENDIX - D-l The Drage Structural Viscometer 124 APPENDIX - D-2 Preparation of Samples of Rayon Fibres 129
9 (vii) TABLE OF CONI'ENI'S (continued) Page APPENDIX - D-3 Water Vapour Sorption Ce11 for Swe11ing Fibres 132 CLAIMS TO ORIGINAL RESEARCH 134 SUGGESTIONS FOR FURTHER WORK 135 BIBLIOGRAPHY
10 (viii) LIST OF TABLES Table I II PART II Effect of distance between the ground and the capillaries on the critical potential..... Size distribution of a typical oil/water emulsion Page I II III PART III Typical dilution experiment Reproducibility of emulsion viscosity Emulsions obeying Taylor's equation IV v Emulsions deviating from Taylor's equation Emulsions deviating from Taylor's equation VI Effect of CaC1 2 on emulsion viscosity VII Viscosity of suspension of solid spheres 56 PART IV I II III IV Viscosity of suspension of rayon fibres Viscosity of suspension of rayon fibres... Viscosity of suspension of swollen rayon fibres Comparison of measured and calculated value APPENDIX- A I I Efflux time of aqueous glycerine solution containing 1% Tween APPENDIX - C-l Newtonian behaviour of dilute emulsions los
11 (ix) LIST OF FIGtJR.FS PART I Figure 1 2 Streamlines around a solid sphere Deformation of a liquid drop in a shear field Page Variation of cj. with p 0 7 PART II Apparatus for preparation of emulsions b.y electrical atomization Various stages of atomization of water A close-up view of the atomized column Log V /R vs. Log R c PART III Reduced viscosity - f6 plots for emulsions obeying Taylorts theor,y Reduced viscosity emulsions f6 plots for oil/water (j.. meas./ of cale. versus emulsifier 0 t t' concen ra ~on Ef flux time versus volume of CaC1 2 added to 10 cc. of emulsion Tl ''/Tl ' versus per cent emulsifier (}( 0 versus c;ll
12 (x) LIST OF FIGURES ( continued) PART IV Orbital distribution of a rod in a shear field Reduced viscosity - c plots Photomicrograph showing the effect of shearing on flexible particles Intrinsic viscosity versus axis ratio Log cl. 1 vs. Log CJ{ 0 Page APPENDIX- A Dilution viscometer for foaming liquids Dilution viscometer for foaming liquids APPENDIX- B Reduced viscosity - 9} plot (Leviton and Leighton) Reduced viscosity - 9} plot (Sherman) Reduced vi.scosity - 9} plot (Maron et al.) APPENDIX - c-1 Density versus concentration of emulsion Emulsion deviating from Taylorts equation Effect of emulsifier concentration on o( 0 Effect of emulsifier concentration on o< 1 Effect of CaC1 2 on emulsion viscosity Effect of CaC~ on intrinsic viscosity
13 (xi) LIST OF FIGURES :(eontinued) Page APPENDIX - C-1 (cont'd.) (2 C + Jo) vs. per cent emulsifier 2 Log Q(1 vs. ~0 Surface tension vs. emulsifier concentration Viscosity vs. emulsifier concentration APPENDIX - D-1 Drage Viscometer Sea1e reading vs. shear rate APPENDIX - D-2 Frame for mounting rayon threads APPENDIX - D-3 Water vapeur sorption cell 133
14 (xii) GLOSSARY OF SYMBOLS Symbol Meaning Viscosity of emulsion or suspension '11' Viscosity of disperse phase Viscosity of continuous medium 1L = Relative viscosity 'l"lo '11r - 1 = Specifie viscosity Volume fraction of the disperse phase (Part III) Reduced viscosity (Part III) Volume fraction (Part I and Part IV) Intrinsic viscosity Particle interaction co-efficient p K p + 2/5 p + 1 = Taylor's co-efficient Shear viscosity of film a a 1 d Area viscosity of film Particle diameter (sphere) Length of a rod-like particle Particle diameter (rod) r 1 d = Axis ratio
15 (xiii) Symbol Meaning Equivalent ellipsoidal axis ratio.l.. r e Critical potential y G Surface tension or interfacial tension Velocity gradient Shear stress Angle, spherical co-ordinate 0 IJ. T c li) n Angle, spherical co-ordinate Micron = 10-4 cm Period of rotation of a rod Orbit constant Angular velocity Number of particles/unit volume Goniometrie expression in Burgers' equation
16 PARTI GENERAL INTRODUCTION
17 1. PARTI GENERAL INTRODUCTION Before the experimental studies on the viscosity of dilute emal.sions and dilute suspensions of thread-like particles are described, a brief reference to the importance of their stuqy and a resume of the pertinent theoretical background will be presented. Studies of the viscosity of solutions, suspensions and emulsions are of great theoretical and practical importance. Rheological studies of various systems, e.g. polymers, polymer solutions, emulsions and suspensions etc. provide useful and significant information on their structural characteristics and hydroqynamic behaviour which find extensive application in many industries. But to explore the fundamental factors governing such properties, dilute model systems, for which theories have been developed, should first be studied and here is the origin of the present investigation. Viscosity Theories of Dilute Systems 1. Suspension of solid spheres: If a dispersed system, such as a solid in liquid (a suspension) or a liquid in liquid (an emulsion), is sheared the streamlines around the dispersed particles will no longer be the same as that of the pure
18 2 liquid but will be distorted and crowded in the neighbourhood of the particle, the distortion will depend on the particle characteri8tics. Fig. 1 shows the calculated flow lines around a solid sphere in a suspension in laminar shear; the sphere rotates about an axis in the plane of shear and normal to the direction of fluid motion at a constant angular velocity ~ = ~ where G is the velocity gradient. 2 As a result of the crowding of the streamlines, which results in a localized enhancement of the velocity gradient, the viscosity of the suspension is greater than that of the pure dispersion medium. Einstein (1,2) visualized such a model and from hydrodynamic principles showed that in a suspension having a volume fraction ~ of the disperse phase.!) suspension Tl medium ""' Tl r (1) provided the following conditions are fulfilled: (a) the suspension is intinitely dilute, i.e. there is no particle interaction, (b) the particles are electrically neutral and there is no slip at the interface, (c) the spheres are large in comparison to the molecules of the dispersion medium but small in comparison to the dimensions of the apparatus. If another sphere is i.magined in the vicinity of the sphere in Fig. (1), it is obvious that the fiow lines will be further complicated and bydroqynamic interaction will set in and under appropriate conditions collision doublets will be formed (3). To account for such
19 3 FIG. 1 - PART I Streamlines around a solid sphere in shear' f 1eld. * b - radius of the sphere h - displacement between particle centre and streamline measured along y-axis at large distances from sphere x, y - cartesian co-ordinates (x-direction of shear flow) * Reproduced by kind permission of ~1. Bartok and S.G. Mason
20 4 interactions, various theories have been developed by Guth and Gold (4), Guth and Simha (5), Vand (6), Manley and Mason (7). Ail of the equations, which take into account interaction effects at finite concentrations may be expressed as a simple power series of ~: '1) - 1 :z r '11 sp = or c (2) where c;j. 0 = lim ~ c-o c is the particle co-efficient since it is defined pri11cipally by the particle geometry and 0(, the inter 1 action co-efficient. For solid spheres ol 0 = 5/2 (Eq. (1)) and O(l assumes different values from 7.35 to 14.1 (4,5,6,7). The two important quantities, cj. 0 and oc 1 may be experi.mentally evaluated from a linear plot of '11 :œ vs ~ over suitable range of concentrations. c 2. E'mulsions In emulsions in which the disperse phase is a liquid in form of droplets, two new problems are encountered viz. (l)distortion of the drop by shearing action and (ii) circulation inside the drop due to transmission of shear from the continuous to the disperse phase. The effect of distortion on emulsion viscosity has not yet been theoretically treated but it is reasonable to assume that the contribution of distorted drops to viscosity will be less than that of spherical ones and the viscosity will be non-newtonian, i.e. it will vary with G. For
21 5 small deformations Taylor (S) deduced an expression (to be discussed in Part III) for the eccentricity of the defor.med drop in a parallel plate shearing apparatus where the drop initially set itself with its major axis at an angle of 45 with the shear plane. On increasing the gradient, the drop is deformed more and the major axis tends to ali.gn itself along the flow lines. Photographe showing the deformation and orientation of a drop of cyclohexanol phthalate in corn syrup at various values of G are shawn in Fig. 2. Taylor experimentally verified his theor.y which has been recently confirmed over a wide range b,y Bartok and Mason (9). The effect of internal circulation on emulsion viscosity bas been calculated by Taylor (10); he obtained the expression.2. = 2 p + 2/5 p + 1 (3) where.p is the viscosity ratio of the disperse to the continuous phase. Equation (3) is valid only wh en the drops remain practically spherical in the shear field and there is no viscous or visco-elastic interracial film, the presence of which would increase the value of ô. 0 over the value calculated from Equation (3). Oldroyd (11) bas recently extended Taylorts theory to account for such viscous or visco-elastic films; this will be discussed in Part III. The effect of.p on o< 0 predicted by Equation (3) is represented in Fig. 3 where the range of.p values covered in the present investigation has been shown. It may be noted that the affect of' internal circulation
22 6 FIG. 2 - PART I Shear deformation of a CHP drop in corn syrup * Frame No. G sec a = 575/1 * Reproduced by kind permission of W. Bartok and S.G. Mason
23 1 i 1 _j ii. '. lhiiiil i o mm SCALE 6 DEFORMATION IN LAMINAR SHEAR DROP DIAMETER " a " 575 fl VISCOSITY RATIO = TJf'r}o = 2.2
24 7 FIG. 3 - PART I Variation of ot 0 with p Calculated from Taylor's Equation
25 but as will be seen in Part (IV) it can be anticipated that flexible particles will contribute more to viscosity than the rigid ones of the same size. 4. Wall effect Before concluding these introductory remarks it remains to mention briefly one experimental anomal.y that may be encountered while measuring the vi.scosity ot suspensions or emulsions. As a result of the distortion of the flow lines around a particle, the particle will never reach the walls of the viscometer; in other worda, there will remain a tparticle free t layer of the continuous medium at the wall. This resulta in a tpseudo-slip' at the walls and the measured viscosity is consequentl.y lower than the true viscosity. For spherical particles Vand (20) has worked out the extent of this pseudo-slip and a correction for 'wall effects t in auch systems may be easil.y employed from the particle size and dimensions of the visco.meter and the measured relative viscosity. For rod-like particles, however, no theoretical treatment exista for wall effects, although the wall effects may be very pronounced as observed in suspensions of wood fibres in water by Robertson and Mason (21). Eirich et!! (22) also observed a fibre free layer in their capillar.y viscometers. The wall effects may be greatly increased by particle aggregation and the fibre free layer ot about 1 mm, observed by Robertson and Mason, i.s partly due to aggregat i on and the f ibre
26 1.0 suspensions in the tubes exhibited plug flow i.e. the aggregated pulp moved through the tube as a solid rod. When such phenomenon is observed, viscosity measurements become meaningless.
27 PART II THE PREPARATION OF MONODISPERSE EMULSIONS BY ELECTRICAL ATOMIZATION
28 ARS TRACT A method of preparing emulsions having narrow aize distributions in which the disperse phase is first atomized to form an aerosol is described. The method, which is of general applicability, is particularly suitable for preparations of accurately known concentration of disperse phase, and has a number of advantages over conventional methods of emulsification. The basic factors governing the atomization are considered but no attempt is made to arrive at a quantitative explanation of the phenomena.
29 12 1. INTRODUCTION As the first step in investigating viscosity behaviour ot dilute emulsions~ it was necessar.y to develop a convenient technique for preparing stable emulsions of accurately known concentrations and of reasonably uniform particle size. Since none of the conventional methods of emulsification~ e.g. mechanical shaking~ colloid milling, injection~ etc.~ was suitable a new technique based on electrical atomization of the disperse phase was developed. A high electrical potential applied to water emerging from a fine capillar,y causes the water to break into fine threads consisting of small globules. Zeleny (5) discovered the phenomenon and recently Vonnegut and Neubauer (3) reported similar observations. Using glass capillaries and applying high positive potentials to water, ethanol, lubricating oil and aqueous sugar solutions, aerosols were produced which exhibited higher order T,rndall phenomena,!rom which it was concluded that the particles were of uniform size, about 1 ~ diameter. In a subsequent stuqy (4) o! the effect of simple electrolytes on ato~ ization, it was found necessar,y to place a negative electrode near the capillar.y; when the conductance o! the solution was much higher than that of water only threads of unifo~ globules could be produced. Vonnegut and Neubauer considered the breakup to result from the autorepulsion of the electrostatic~ eharged surface overcoming the cohesive forces of surface tension and from elementary considerations
30 derived the following relationship: (1) where r is the radius of the droplets formed, Q the total electrostatic charge carried by a volume y of dispersed liquid, y is the surface tension and! is a constant. Although Equation (1) has not been contirmed quantitatively, it is of interest to note that, other conditions remaining the same,.r will vary with surface tension. Drozin (2) conducted a more elaborate study using a number of liquids and gave a systematic description of the various stages of atomization as the applied field was varied. He tried, without success, to arrive at a quantitative treatment of the process. The investigation described here was undertaken to use the technique to prepare monodisperse emulsions. The development of the method together with pertinent observations of atomization phenomena are the subjects of this par~. 2. EXPERIMENTAL PART (a) Electrical Atomization Preliminary experimente were made us ing glass capillaries of about 0.08 mm diameter with the electrode dipping in the liquid. It was
31 ~t4 soon f'ound that by substituting the glass by a metal capillary directly connected to a high voltage source, atomization occurred at much lower voltages, particularly in the case of' poorly conducting liquids. Figure 1 shows the essential parts of the apparatus used. The steel hypodermic needle (N) was ground to a flat end and was connected to a 0 to 4 k.v. d-e source. The graduated tube (L) contained the liquid to be dispersed. Depending upon the viscosity of' the liquid used, the needle diameter was chosen so that a flow rate of' about 20 to 30 drops per minute was maintained in absence of' the field. In soma observations of' atomization of' various liquids in air, the brasa tube (M), which served as the ground, was replaced by flat metal strips kept parallel to the needle or directly below the needle tip in such a way that the distance between the ground and the needle could be varied. B.y proper choice of' the needle diameter and the gap between the needle and the ground, various liquida could be atomized at a potential of' 4 k.v. or less. The liquids used included benzene, carbon tetrachloride, 0.1% aqueous caustic soda, solutions of' different emulsifiers in water and in butyl benzoate, ~1 benzoate, etc. There appeared in f'act to be no limitation to the type of' the liquid used, provided that the flow rate, ground-to-needle distance and potential were suitably adjusted for reasons discussed later. The successive stages of' atomization on slowly increasing the potential, which could be either positive or negative, was observed through a microscope having a magnification of about 40X. The various
32 :15 FIG. 1, PART - II Apparatus for preparation of emulsions L - graduated tube for the disperse phase R, Rl' R 2 - rubber stoppera M - grounded brass tube N - hypodermic needle T - side tube c - grounded electrode in continuous medium sl, s2 - magnetic stirrer F - receiving flask
33 - J----L R2 R M R H.T(4K.V) R2 M.. RI N F - - c =r CD
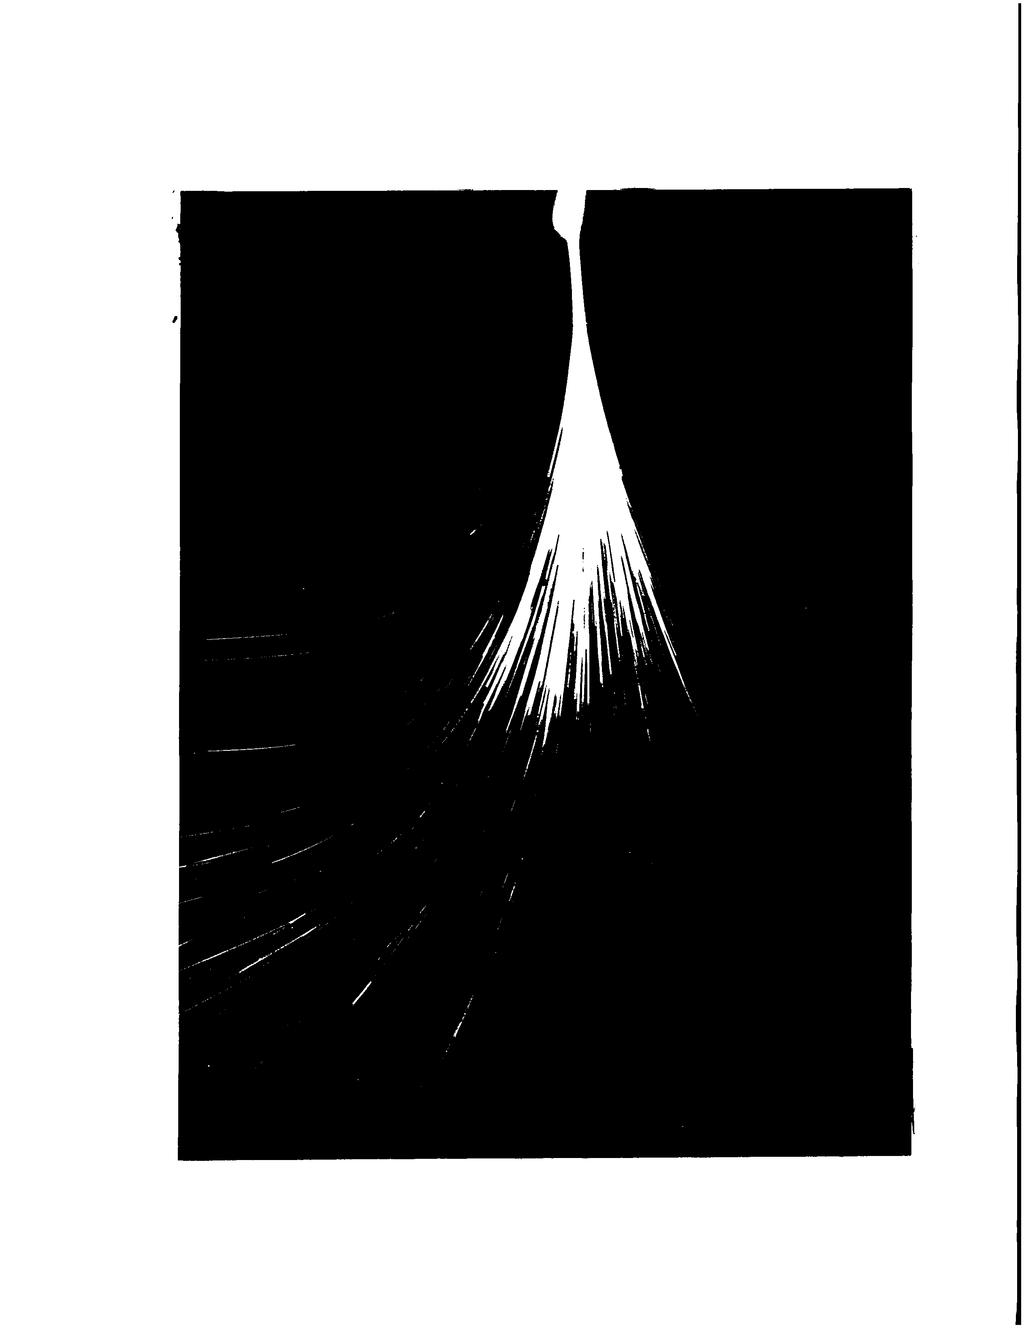
34 :16 stages are shawn in Fig. 2. On increasing the potential from (i) to (iii), the drop eize leaving the capillary decreased and the drop frequency increased. On further increase of the potential the drops, elongated in the vertical direction, emerged very close together, possibly at times even touching one another, to give the appearance of a vibrating thread (iv). This was a transition stage at which a slight increase in potential (20 volts or less) caused the single column of liquid to split into multiple threads (v, vi) each consisting of small drops which were only rarely visible. The "critical potential" at which the transition from Stages (iv) to (v) occurred was highly reproducible for a fixed geometr,y. After a turther increase of potential (Stages vi, vii, viii, ix), the threads became more numerous and the drop aize decreased further. It was observed for all liquida and under all circumstances studied, that the liquid jet emerging from the needle tip was conical and converged at a distance of about 0.5 mm.into a narrow column (viii) which then broke into several filaments about 6 mm. from the tip (ix). Increasing the potential above the critical value at which the transition from Stage (iv) to Stage (v) occurred caused the particle aize to decrease gradually and the number of threads to increase,but otherwise did not change the general behaviour. A close up view of the whole atomized column is shown in Fig. 3. The critical potential (V ) was independant of the polarity and ~ was highly reproducible for a fixed position of the ground relative to the metal capillary. When the distance R, between the ground and the
35 :17 FIG. 2, PART - II Various stages of atomization of water (i) 0.0 kv. - normal drop (ii) 1.3 kv. - drops becoming smaller (iii) 1.8 kv. - drops becoming smaller (iv) 2.56 kv. - continuous column (v) 2.58 kv. - critical potential; on set of atomization (vi) 2.60 kv. - threads becoming finer (vii).3.9 kv. - upper part of atomized column (viii) 3.8 kv. - conical ext.ended liquid jet, upper part (ix).3.9 kv. - middle part of the atomized column.

36 I ~ ~ III IV v VI VII VIII IX
37 FIG. 3, PART - II A close-up view of the whole atomized column Applied Potential = 3.0 k.v.
38
39 1_9 TABLE I, PART - II Errect or Field Strength on Critical Potential or Water R = Metal Capillary 0.11 mm. i.d. Glass Capillary 0.08 mm. i.d. Distance between ground and capillary Metal Capillary R Critical Potential ~ volts (Vc) Glass Capillary
40 20 FIG. 4 1 PART - II Plot of Log V /R versus Log R Line 1- glass capillary (diameter = o.oa mm.) Line 2 - metal capillary (diameter = 0.11 mm.) Empirical relationship: V = k.r 0 2, k = constant. c
41 a::... (.) > ~------~--~--~~~--~~--~--~ R y !
42 21_ capillar,y was decreased, V decreased as shown in Table I, presumably ~ because of the increase in field strength. In these experimenta a thin metal probe, serving as ground, was held at various distances directly below the needle opening. V increased by replacing the metal ~ needle with a glass capillary. A plot or log vcfr vs. log R gave excellent linear relationships for all cases studied. Two of them are shawn in Fig. 4. Table I and Fig. 4 clearly demonstrate that use of a metal capillary caused the atomization at a lower potential corresponding to that of a glass capillar,y. It was found that reducing the surface tension by means of surface-active agents caused a reduction of the critical potential and, as predieted b,y Equation (1), a reduction in drop aize at a given potential. The effect of surface tension was not, however, investigated quantitatively although it would have been of interest to do so. It is considered that the observations are in qualitative agreement with the mechanism proposed by Vonnegut and Neubauer (3). Drozin (2), who used glass capillaries, was unable to atomize carbon tetrachloride and benzene even at 30 k.v. probably because of the low conductivity which would tend to produce low field strengths at the tips in his experimenta. In the present work both liquida could be atomized at 4 k.v. or lesa when a metal capillary directly connected to the high tension source was used. Moreover, in contrast to the experience of Vonnegut and Neubauer (3), the method was not affected b.1 the polarity of the electrostatic charge in the liquid; very recently Green and Lane (6) reported similar observations on polarity, but also noted
43 22 that carbon tetrachloride and benzene could not be atomized using glass capillaries. Although it was not stated in the text, their photomicrographs (6, Plate 2, Fig. 2.1$ and 2.19) show the presence of a small amount of liquid in the capillary tip in form of a tconical extended jett, observed in the present investigation. (b) Preparation of Emulsions In first applying the technique to the preparation of emulsions, the disperse phase was introduced directly into the continuous medium by ilmnersing the charged hypodermic needle tip in the latter medium which also contained the ground. This method proved excellent for small concentrations of the disperse phase. When the emulsion concentration reached about 1 per cent, however, it failed. Initial emulsification went on smoothly but after several minutes elongated globules from 1 to.3 mm. in length with pointed encis were formed at the ground. These deformed globules, wbich appeared invariably to be multiple emulsions, moved to and fro with their major axes in the direction of the electric field. On continuing the process the emulsions broke. These observations appeared to be similar to those made by Dixon and Bennet-Clark (1) in a stuqy of the electrical conductance of emulsions. This method was finally abandoned. Instead, the disperse phase was atomized into the air and then allowed to settle into the continuous phase. After a series of experimenta the arrangement shown in Fig. 1 was adopted for preparing oil/water emulsions. The outermost rubber stopper (R 1 ) served as a stopper for the
44 23 receiving flask (F). The ground (M) was a 1.5 cm. dia. brass tube whose bottom was about 2 cm. above the needle tip. At smaller separations the atomized liquid tended to be attracted up towards the ground and deposited on it. The disperse phase in the graduated tube (L) was atomized in air and collected as a finely divided spray on the continuous phase containing a suitable emulsifier. The continuous medium was stirred gently by a variable-speed magnetic stirrer (s, s ) so as to entrain 1 2 and distribute the atomized liquid immediately after the droplets met the surface. The rate o! stirring was controlled to avoid foaming. The height of the needle-tip above the surface of the continuous medium was also important. If too close to the surface, electrical charge accumulated in the lower layer and caused the amulsion to break, presumably because the travel through the air was too brief for dissipation of most of the charge; also the liquid column (Fig. 2, ix upper part) struck the surface before the dispersed filaments (Fig. 2, ix, lower part) could form, and thus caused coalescence at the surface. A distance of about 2 to 3 cm. was found suitable, when the!ully dispersed threads struck the surface (Fig. 3 - lower part). It is possible that dissipation of the charge in the air could be assisted by introducing a small ionizing source auch as Polonium to increase the conductivity of the air. The continuous phase was also grounded by a metal strip (C) passing through a side arm (T). Without this additional ground atomization soon stopped, presumably due to charge accumulation in the bulk liquid. N-butyl benzoate and solutions of castor oil and carbon tetra-
45 24 chloride in butyl benzoate, iso-~1 benzoate, solutions of benzene and carbon tetrachloride were used as the disperse phases while water, aqueous solutions of sucrose and glycerine of varying concentrations containing both ionie and non-ionie emulsifiers were employed as the continuous phases. The ionie and non-ionie emulsifiers were propyl benzene (and napthalene) amine sulphonate (G-3300) and polyoxyethylene sorbitan monolaurate (Tween 20) respectively and were supplied by the Atlas Powder Co., Brantford, Canada. These emulsions were used in the investigation of viscosity described in Part III. The highest concentration attempted was 37 per cent by volume, but doubtless this could have been exceeded. To prepare an emulsion of known concentration the tared receiving flask (F) was filled half-way with a known weight of the continuous medium. After collecting the appropriate amount of the dispersed phase from the graduated tube (L), the stirring magnet was removed from the flask by means of another magnet covered with a tared filter paper to soak up the liquid on the stirrer. The flask was then weighed on an analytical balance and after correcting for the liquid adhering to the magnet,the volume concentrations were calculated from the density values of the two phases. In this way the volume concentration could reasily be determined with a precision of at least per cent.
46 25 3. DISCUSSION Emulsions so prepared were stable for periods of at least several months. not agglomerated. The particles were reasonably uniform in size and were It was observed that freshly prepared emulsions often contained about 5 per cent of globules, 5 to 10 1J. diameter, but on ageing, preferably under ver,y gentle agitation, the large globules were dispersed in about two days; after this period 98 to 99 per cent of the particles were in the diameter range from 2.5 to 3.5 IJ. and 3.5 to 4.5 IJ. for emulsions of butyl benzoate dispersed respectively in water and in aqueous glycerol. Table II gives a size count of a typical emulsion. The dispersion of the large globules on standing is believed to have been due to a slight residual charge on the particles. Similar emulsions prepared by shaking and having much larger particles did not show any tendency to disperse further on standing; on the contrar,y, they slowly showed signs of breaking. As a technique of preparing emulsions for research purposes, the atomization method has a number of advantages over conventional methode: it is simple and straightforward; it can be used equally well for oil/water or water/oil emulsions; there is no tendency to entrap air or to form multiple emulsions; the particles are of reasonably unifo~ size, and the disperse-phase concentration can be determined accurately; finally, emulsions of high stability can be prepared with relatively low content of emulsifier (0.2 to 1 per cent). In the usual methods of emulsification, emulsifier contents are kept high, 2 to 10 per cent being
47 2() TABLE II, PART - II Size Distribution of a Iypical O/W Emulsion Butyl benzoate in water (plus 1% Tween 20) ; aged 3 days Diameter Particles Microns Counted 0 to to to to to 8 2
48 27 common, to reduce the interracial tension sufficiently to facilitate mechanical disruption of the liquid. In the present method lowering the interracial tension is not necessar,y since dispersion is accomplished before the phases are mixed. Two limitations should be mentioned for guidance in the preparation of other emulsion systems. If the viscosity of the continuous medium is high, coalescence at the surface becomes pronounced thus resulting in polydispersity. If, on the other hand, the viscosity of the disperse phase is high, the flow rate from the capillary becomes small and long preparation times are necessar,y; this might be overcome b.y using several capillaries or by using a pressure feed.
49 PART III THE VISCOSITY OF DILUTE EMULSIONS
50 28 SUMMARY The viscosity of a series of dilute monodisperse oil/water emulsions having ratios of viscosity of disperse to continuous phases varying from 0.5 to 5.2, was measured as a function of emulsion concentration and the intrinsic viscosity ~ 0 and the interaction coefficient d 1 were determined in the Newtonian region. In a number of cases the measured o( 0 was in excellent agreement with that calculated from Taylor's hydro<trnamic theory which makes allowance for the effect of circulation inside the emulsion droplets. In other cases, including a series of emulsions of butyl benzoate in aqueous glycerine solutions containing a non-ionie emulsifier and a series in water containing an anionic emulsifier to which traces of a precipitating electrolyte were added, o( theoretical value. 0 was greater than the It was concluded from these experimenta that Taylor's theory was valid except when a viscous interfacial film was formed by the emulsifying agent which tended to inhibit internal circulation. Oldroyd's recent extension of Taylor's theory was used to calculate a linear combination of the two-dimensional shear and dilatational viscosity coefficients of films deviating from Taylor's theory. ~~en Taylor's theory applied, o{ 1 increased with increase in c:j. up to cj.. = 2.5 for rigid spheres according to a simple exponential relationship. When the system deviated from the theory, a more complicated relationship involving factors ether than o( 0 was indicated.
51 2!J PART III 1. INI'RODUCTION The specifie viscosity of a dilute suspension of particles in a viscous liquid may be expressed as a power series:,., Tl - Tlo...,.,r _ 1 ''sp., Tlo (la) (lb) or + 1" (le) Here ~ (in place of the symbol ~ which is used in the General Introduction and in Part IV to avoid confusion with the spherical coord.inate is the volume fraction of particles in the suspension; n_, 11.J:. and Tl are the actual 1 relative and speci fie viscosity respectively;.:.2:2 ca 0 is the intrinsic viscosity 1 or alternativezy the "particle" coefficient since it is determined by the mean properties (chiefly shape) of the individual particles; and o( 1 is the particle interaction coefficient. For solid spheres c( has a theoretical value of 5/2 (6,7). 0 Theories by Guth and Gold (10) and by Vand ( ) predict G( l to be
52 and 7.35 respectively. Manley and Ma.son (13) mod.ified Vandts theory to accord with the experimentally established mechanism of shear-induced two-boqy collisions of solid spheres and obtained dl = Experimental values of d 0 and~ agree with the theories to various degrees (1,13). Taylor (24) has extended the hydroqynamic theory to dilute suspensions of fluid spheres in immiscible liquids by taking into account the internal circulation in the suspended fluid drops due to transmission of the tangential and normal stresses across the interface between the continuous and the disperse phases during shear flow. In this case, Taylor showed that, at a velocity gradient low enough for the particles to remain spherical, cj. Tlo /2 0 Tlo + Tl' (2a) - 2. p + 2/5 2 p + 1 (2b) (2c) where Tl' and 11 0 are the viscosities of the disperse and the continuous phases respectively, _E (= Tl t/ Tl ) is the viscosity ratio of the two 0 phases, and li is designated the Taylor coefficient: According to Taylorts theory, therefore, li may vary from 2/5 to unity and 0( 0 from unity to the Einstein coefficient 5/2, by changing E from 0 to o0.
53 Details of the internal circulation patterns predicted from Taylor's theory and which have been partly confirmed b,y direct observation are discussed by Bartok and Mason (2). It is sufficient for the present purpose to point out that the increase in viscosity expressed by Eq. l(b) is due to a distortion of the field of laminar shear flow in the region of each particle {Part I) which has the effect of increasing the gradient in the immediate neighbourhood. Fluid circulation inside the drops reduces the distortion of the flow pattern outside the drops and hence reduces (j by an amount which increases as 0.E decreases. Taylor's theory assumes that the particles remain spherical, although they tend to be distorted into ellipsoids by the deforming stresses generated by the shear field. It has been shawn theoretically (25) and confirmed experimentally (2,25) that a sphere is deformed into an ellipsoid having its major axis initially at 45 to the direction of motion and an eccentricity which for small deformations may be expressed as: L-B = Gart p/16 L + B 2y 1 + p (3) where L and B are the length and width respectively of the prolate spheroid (or alternatively the major and minor axes), ~ is the diameter of the undeformed sphere, y is the interfacial tension and.the remaining quantities have the meanings previously assigned. The effect
54 of particle deformation upon a( 0 32 has not been considered theoretically but it appears reasonable to assume that c( will be diminished by 0 distortion (2) 1 i.e. the system may become non-newtonian at high Gts. Thus any experimenta to test Taylorts theor,y should be performed under conditions of negligible particle distortion. Because of the technical importance of emulsion rheology, numerous experimental studies have been made. Most of these, however, have been conducted at high values of ~ ( > 40 per cent) where particle interaction effects predominate and ether effects such as the formation of multiple emulsions and of particle aggregates, polydispersity and non-newtonien behaviour complicate the interpretation. The results, which may be represented by various semi-empirical equations, have been summarized by Clayton (4) and Sherman (23). They are of no value in testing Taylor's theory. Experimental studies at law emulsion concentrations have been reported by Sherman (22), Van der Waarden (30) and Leviton and Leighton (12). Of these studies only the last was considered in relation to Taylorts theory. For reasons which will be discussed later, none of these investigations provided data sufficiently reliable to test the theory. However a brief review of these and some other works pertaining to the present stuqy has been given in Appendix B. A series of experimenta on well-defined stable emulsions are being described having a range of viscosity ratios E 1 which have confirmed Taylorts theory. In a number of cases positive deviations from
55 33 the theoretical values of ~ were observed which have been interpreted ---2 to result from the formation of an interfacial film which reduces the rate of internal circulation in the emulsion droplets. These deviations are considered further in the light of a recent modification of Taylor's theory b,y Oldroyd (18) which takes into account the effects of viscous or visco-elastic films at the interface. 2. EXPERIMEN'l' AL PART (a) Preparation of Emulsions O~water emulsions having concentrations of about 15 volume per cent were prepared by electrical atomization, details of which are given in Part II, by applying a potential of about 4000 volts D.C. to a hypode~ic needle connected to a vessel containing the liquid to be dispersed. This caused the liquid to become atomized into fine drops of approxima.tel.y uniform size which were allowed to settle through the air onto the surface of the aqueous phase containing a suitable emulsifier to stabilize the system. Pure n-butyl benzoate, and solutions of castor oil (No. 300 Castor Oil, Baker Castor Oil Company, New York, U.S.A.) and of carbon tetrachloride in n-butyl benzoate, were used as disperse phases. Pure water and aqueous solutions of sucrose and of glycerine were employed as continuous phases. The emulsifiers employed were Tween 20 (Pol.yoxyethylene sorbitan monolaurate, non-ionie) and G-3300 (Propyl
56 34 benzene amine sulphonate, anionic), both of which were supplied by the Atlas Powder Co., Brantford, Canada. They were chosen according to the H.L.B. classification (9,32) and the amount necessary to stabilize an emulsion was determined experimentally and has been described in Appendix C-2. The critical micelle concentrations in water, determined from surface tension measurements, were 0.10 per cent for Tween 20 and 0.12 per cent for G These measurements are given in Appendix-G-1. lt.lhen solutions instead of pure liquids were u.sed as the disperse or the continuou.s phases the additional component was added in order to vary the viscosity ratio E and in several cases to equalize the two phase densities. The emulsions so prepared were excellent for the purpose. They were stable over periods of several months, were of suitable particle size and were of accurately known concentration. Particle diameters varied from (i) 2.5 to 3.5 microns for pure oil/water emulsions, and (ii) 3.5 to 4.5 microns when the continuous phases were glycerine or sugar solutions. They were reasonably monodisperse; about 98 per cent were between the sizes stated for (i) and about 95 per cent for (ii). The emulsions were free from aggregates, entrapped air bubbles or multiple emulsion droplets any of which, if present, would adversely affect viscosity measurements. The concentration of each emulsion prepared, which was of the order of 15 per cent by volume, was determined to a high degree of precision from the increase in weight of the
57 35 continuous medium. By suitable choice of phases it was possible to vary the viscosity ratio E over the range 0.5 to 5.2, corresponding to a variation of li from 0.6 to 0.9. (b) Viscosity Measurements Viscosity measurements were made over a range of concentrations. The original emulsions were diluted gravimetrically with the continuous phase containing the emulsifiers. The early measurements of relative viscosities were made in Ostwald-Fenske type capillary viscometers. Subsequently, they were replaced b.1 two multi-shear viscometers, described in Appendix A and desi.gned to overcome difficulties arising from foaming of the emulsions and to permit dilution of the emulsions in the viscometer itself. In the viscometers the mean velocity gradient could be varied over the -1 range of 200 to 900 sec. The kinetic energy correction was negligible in all cases but one, where it was applied in the usual way. Densities of the disperse and continuous phases were measured pyknometrically and the values were used to compute the volume fraction,~ from the weight compositions of the emulsions with an accuracy of ~ 0.02 per cent. In calculating relative viscosities from the efflux times, the mean densities of the emulsions were directly measured or were determined by interpolation from the composition-density curves; two of these curves have been shown i n Appendix C-1. Viscosity and
58 3fi density measurements were made at 25.0 ± C. Efflux times were reproducible to ± 0.2 per cent or less. Over the range of concentrations (5 to 16 per cent b,y volume) and rates of shear (200 to 900 sec.- 1 ) studied, the emulsions were Newtonian. Evidence o~ this is presented in Appendix C-1. Deformation of the particles b,y shear under the conditions of the experiment was calculated and found negligible; values of (L-B/L+B) calculated from Equation (3) were about 10-4 which correspond to an increase in axis ratio of only 0.02 per cent. Vand's (2?,28) wall correction as discussed in Part I and by Manley and Mason (13) for the measured relative viscosities was calculated and, corresponding to the emulsion globular diameter of 3~ and the viscometer capillary diameters of 0.06 and 0.0? cm., was found to be negligibly small. 3. RESULTS (a) Preliminar;y Experiments Table I shows the results of a typical set of measurements of Tl and Tl obtained by progressive dilution using the continuous r sp phase (containing the emulsifier) as the diluent. A plot of T) sri f/j versus f/j yielded a straight line from which o( 0 and o( 1 were deter- - - mined b,y the method of least squares in the usual way; a number of these plots are given in Fig. 1. The emulsion preparations and
59 37 FIG. 1, PART III Reduced viscosity - ~ plots for emulsions obeying Taylorts theory: Line 1 - Castor oil + butyl benzoate/water + 1% Tween 20 Line 2 - butyl benzoate/water + 1% Tween 20 {open circles) butyl benzoate/water + 0.5% Tween 20 {solid circles) Line 3 - butyl benzoate/25% aqueous sugar solution + 1% Tween 20
60 \ o.l N
61 38 TABLE I, PART III Typica1 Dilution Experiment Buty1 benzoate/water + 1% Tween 20 Densities : continuous phase = g/cc. disperse phase = g/cc. Relative ~ Eff1ux time, viscosity per cent seconds 1'l r lll f (2.08)a a - Extrapolated
62 39 viscosity measurements were highly reproducible as is illustrated by the data for five preparations listed in Table II. Since the emulsifier caused a small but appreciable increase in the viscosity of the continuous phase and at the same time was probably adsorbed at the interface in the emulsion, it was important to use the correct value of Tl in calculating Tl and Tl It was ---2 _..r. ~ established as follows that a~ adsorption occurring caused a negligible reduction in "" ~- (i) The viscosity of an emulsion of butyl benzoate in water containing 1.0 per cent Tween 20 was measured in the standard way, i.e. by diluting the original emulsion with water containing one per cent -Tween 20. The latter had Tl = O cp. and this value was used to compute Tl ---2 ~ The results obtained yielded the linear plot I in Fig. 2. (ii) In a parallel run, the same emulsion as in (i) was diluted with pure water, and in calculating Tl for T'l 0 ~ the value used was that of water P.S937 cp.). Since the true value of Tl was higher due to the emulsifier present in ---2 the emulsion at the start, the calculated Tl were!!e expected to be erroneously high except in the limit of infinite dilution ( IJ = o) when the errer would diaappea.r. The reduced viscosity plot so obtained (Curve 2, Fig. 2) is non-linear and lies above the linear plot obtained b,y the preceding method but extrapolates to the same intrinsic
63 40 TABLE II, PART III Reproducibi1ity of Emulsion Viscosity Buty1 benzoate/water + 1% Tween 20 Preparation dto B Mean =
64 4:1 FIG. 2, PART III Reduced viscosity versus concentration of butyl benzoate in water + 1% Tween 20 obtained by diluting with water (Curve 2) and with water plus 1% Tween 20 (line 1)
65 l{) 0 \ LO 0. ' ' \ \ \ 0 l{) 0 t(j Cl. en -6- ~. C\1. C\1 0
66 42 viscosity o( 0 It was concluded that the standard procedure yielded the correct value of ot 0 although not necessarily of o( 1 (iii) A similar emulsion was prepared containing 0.5 per cent Tween 20 and o( determined by the standard method, i.e. ~ by diluting with water containing 0.5 per cent emulsifier ( 11 = o cp.). The reduced viscosity data obtained 0 are plotted as solid points in Fig. 1 and show excellent agreement with results obtained under (i) (Line 1, Fig. 2). This indicates that the standard procedure yields the correct values for both G( 0 and Q( 1 (iv) Assuming that an adsorbed monolayer of emulsifier having 0 an area per molecule of 40 sq. A forms at the interface and taking the particle diameter in the emulsion to be , it is calculated that the amount of emulsifier necessary to form a monolayer is 0.02 gm. for Tween 20 (m.w. = 400 approx.) and gm. for G-3300 (m.w. = 260 approx.) in 100 cc. of an emulsion of 95 = It i.s estimated from separate viscosity measurements of emulsifier solutions (given in Appendix C-1) that this adsorption would lower the viscosity of the continuous medium by 0.09 per cent in one per cent solution of Tween 20, and 0.07 per cent for 0.25 per cent solution of G-3300; in both cases such reductions in 11 0 are negligible.
67 43 (b) Emulsions Obeying Taylor's Theorz The measured intrinsic viscosities of the emulsions discussed above and those of two additional preparations (Nos. 3, 4 - Table III) of different viscosity ratio E but containing the same non-ionie emulsifier showed good agreement with Taylorts theory. Table III summarizes the measured values of cj 0 and ~l for the four sets of emulsion preparations in which the viscosity ratio E varied from 1.3 to 5.2 and whose reduced viscosity plots are shown in Fig. 1. The measured values of d. within the limit of experimental error with those calculated from Equation (2). _.2 agree (c) Emulsions Deviating from Taylor's Theory The lowest viscosity ratio in the emulsions thus far prepared was 1.3, when butyl benzoate was dispersed in a 25 per cent aqueous sucrose solution. To reduce E further, 45 per cent aqueous sugar solution was used as the continuous phase,but when butyl benzoate was dispersed, the emulsion was unstable partly because of the difference in phase densities. When carbon tetrachloride was added to the butyl benzoate to equalize the phase densities, the emulsion waa stable. However, the measured value of ~ 0 was appreciably higher than that calculated from Equation (2), as shawn in Table IV for two concentrations of non-ionie emulsifier (Preparations Nos. 1 and~). One other emulsion preparation (No. 3) listed in Table IV showed similar behaviour. It was concluded that in these emulsions some mechanism was operating to reduce internal circw..ation and thus increased rj.. 0
68 TABLE III, PART III Emulsions Obeying Taylorts Equation No. Emulsion,,fit t, 0, Range of fzl 0 (:eer cent) C E ~ E 1 Butyl benzoate/water a to % Tween 20 0(0 measured calculated 2.ll ( Butyl benzoate/water to % Tween Castor oil solution in to 16 butyl benzoate/water + 1% Tween Butyl benzoate in 25% to 16 aqueous sugar solution + 1% Tween a Values shown are mean of 5 preparations listed in Table II ~ ~
69 in 45% aqueous TABLE IV, PART III Emulsions Deviating from Tgylorts Equation sugar solution 1% to in 33% aqueous glycerine 1% to *for meaning see Discussion o( 0( (2 t Ü43o) 0.29 * ~ \.11 xl -1 gm. sec. calculated _ Emulsifier %,0, ' Range of~ ~ Emulsion Tween 20 ~~ per cent measured 1 Butyl benzoate solution of cc1 4 2 " " 0.2% to Butyl benzoate solution of CC1 4
70 46 A related effect was observed in a separate investigation by Bartok and Mason (2). Using liquid drops which were sufficiently large ( dia.) to permit observation through a microscope, the predicted circulation inside drops of cc1 4 in corn syrup undergoing shear could not be detected; it was found that when two drops were brought into collision by the shearing motion they showed a progressively decreasing tendency to coalesce as the suspension was allowed to age for periods up to several hours. It was concluded that an interfacial film of increasing rigidity was formed which tended to make the particles exhibit solid rather than fluid behaviour. An additional series of emulsions was prepared using aqueous glycerine solutions as the continuous phase. The first three were prepared with 45, 33 and 22 weight per cent (approx.) solutions all containing one per cent Tween 20. All yielded values of a greater --2. than the theoretical values, the per cent deviation increasing with increased concentration of glycerine. To determine the effect of the emulsifier, a series of emulsions was prepared in which the concentration of emulsifier was progressively reduced and the intrinsic viscosities determined. The experimental resulta are summarized in Table V. As the emulsifier concentration was reduced, the measured values of o( 0 approached the theoretical values and showed good agreement when extrapolated to zero emulsifier concentration. The extrapolated values together with values of o(l deter.mined similarly are also shown in Table V. The agreement is also shown in Fig. 3 where it is seen that the ratio cl. 1 o( t d becomes practically unity as o measure~ o ca 1 cu 1 a e the emulsifier concentration tends to zero. The effect of emulsifier
71 47 FIG. 3, PART III rj.. measured/ J. calculated at various concentrations of Tween for emulsions of butyl benzoate in aqueous glycerine solutions of weight concentrations: Line 1-45% Glycerine, Line 2-33% Glycerine, Line 3-22% Glycerine.
72 a 0 MEASURED ao CALCULATED ~ 0 ft1 3: c r en, - ft1 ::0 0 (JI - b
73 TABlE V, PART III Emulsions Deviatiœ; from T&1or's EQuation Effect of emulsifier concentration Elnulsifier % ' Range of~ o(o (2l: + Jo) x 10 4 '1"10 Tl No. Emulsion Tween 20 o(1-1* ~~ per cent measured ca1culated gm. sec. 1 Buty1 benzoate to in 45% aqueous glycerine 2 " tt to " " to " " a o.o Buty1 benzoate to in 33% aqueous glycerine 5 " " to (.02) (.48) 6 " " to a o.o ( continued) ~ 00
74 TABLE V, PART III (continued) l2!. Emulsion Emuls ifier % ' Range oftj cxo Tween20 ~ ~ per cent measured calculated o(l ( 2 l: + 3a) x 10 4 Jnn. sec. -1* 7 Butyl benzoate in 22% aqueous glycerine to (.03) 7.18 (.30) tt " to (.03) 6.93 (.32) " " to (.01) 5.12 (.38) a o.o a - b,y extrapolation Bracketed quantities are calculated standard deviation from associated least mean square values * for mea ning see n 1scuss1on. ~ c;
75 50 concentration on the viscosity of emulsions containing glycerine in the continuous phase and the extrapolations of o( 0 and o(l to zero emulsifier concentration have been amplified in Appendix C-1. The results from the emulsions containing glycerine indicated strongly that in these systems the stabilizing film of emulsifier surrounding each droplet tended to inhibit internal circulation and thus caused positive deviations from Taylorts theor.y. It was therefore considered to be of interest to prepare emulsions stabilized by anionic emulsifiers in which the rigidity of the film could be increased by addition of precipitating electrolytes. For this purpose emulsions of butyl benzoate were prepared in water containing 0.25 per cent of the anionic emulsifier (G-3300) which could be precipitated from the aqueous solution by adding small amounts of 0.1 per cent CaC1 solution. The precipitation point was 2 determined by adding CaC1 2 solution to the emulsifier solution by taking the first appearance of turbidity a! the end point. The CaC1 2 solution had no measurable effect on the viscosity of the continuous medium at least up to the precipitation point, i.e. ~ 0 was constant. A dilution experiment, made without CaC~ yielded C( 0 = 2.08 with a standard deviation of from the line of regression; this compares favourably with the theoretical value of When CaC1 2 was added dropwise to 10 cc. of the original emulsion placed in the viscometer and the efflux time measured after each addition, it was found that in spite of the dilution of the emulsion
76 FIG. 4, PART III Effect of CaC1 2 on Emulsion Viscosity (Butyl benzoate in Water % G-3300) ~ denotes initial concentration of emulsions P denotes bulk precipitation points.
77 104 cp = cp=o.i Cf) 0 z 0 (.) LLJ Cf).. LLJ ::e ~ x =>...J LL LL LLJ cp = cp : /o Ca Ct 2, ADDED mt.60
78 52 TABLE VI, PART III Effect of CaC1 2 on Emulsion Viscosity Emulsion : Buty1 benzoate in water containing 0.25% G-3300 ~ 1 (2C + 3a) x 104* J!mulsion system measured ca.lculated (}..1 gm. sec. -1 Original emulsion no CaC (.03) "" 2 Original emulsion cc. 0.1% CaClf added/10 cc. emuls on (less tban ma.ximum (.02) (.31) point) 3 Original emulsion cc. 0.1% CaClf added/10 cc. emuls on (slightly in excess of maximum point) 4 Maximum viscosity values from Fig Original emulsion cc. of 0.1% CaC1 2 per 10 cc. emulsion ( obtained by interpolation from other measurements) Bracketed quantities are calculated standard deviations from associated 1east mean square values. *f 1 or mean1.ng see D scuss1.on
79 by the salt solution, the viscosity increased until a sharp maximumwas reached and then diminished. The effect, although small in magnitude, was nevertheless striking and is illustrated in Fig. 4 for four emulsions of different volume concentrations. In each case the maximum, which is shown as a cusp, occurred at an approximately reproducible concentration of CaC1 2 below the bulk precipitation point of the emulsifier. The effect of CaC1 2 was also studied by measuring ~ 0 and o( 1 in a series of dilution experimenta in each of which the concentration of salt in the continuous phase was maintained constant (Table VI); two of the concentrations of CaC1 2 were in the region of the viscosity maxima shown in Fig. 4. Values of d. 0 and cj,. 1 obtained by plotting the reduced viscosity - ~ curve corresponding to the maximum viscosity points in Fig. 4 are included in Table VI. \{hile the measured ~ 0 values are less sensitive than the actual viscosity values ~ (Fig. 4) to the effect of CaC1 2 addition, they nevertheless show the same trend, i.e. they increase until a maximum is reached and then decrease. Further details of these measurements will be found in Appendix C-1. It should be noted here that it is highly unlikely that the increase in viscosity caused by adding CaC1 2 was an electroviscous effect. Calculations based on Booth's theoretical equations (3) show that both the particle diameter (3 to 4f.l ) and the total ionie concentrations were prohibitively large for any measurable electroviscous effect. It is considered that the increase in viscosity was an interfacial-film effect similar to the case of the glycerine containing emulsions. The maximum
80 in viscosity occurring as a cusp rather than a continuous curve (Fig 4) suggests that CaC1 increased the rigidity of the film to a maximum 2 value after which it became fragile and perhaps collapsed on further addition of CaC1 2 In this connection it is significant that beyond the point of maximum viscosity the emulsions tended to become unstable, thus suggesting that the stabilizing film was probably collapsing since after reaching the precipitation point P (Fig. 4) the emulsion broke. Direct evidence of the formation of increasingly rigid films which then became fragile on adding polyvalent metal ions exists for insoluble monolayers at air/water interface (26,31). 4. DISCUSSION It is convenient at this point to make brief reference to the related experimental studies by other workers mentioned in the Introduction. Leviton and Leighton (12) used milk fat dispersed by homogeni~ ation in skim milk as their emulsions and measured relative viscosity -~ relationships. They concluded that the resulta accorded with Taylor's theory. However, when the experimental data was re-plotted as in Fig. 1, the points showed too wide a scatter to afford a test of the theory. Sherman's viscosity data (22) for dilute emulsions of water in oil suffer from the same limitation as is demonstrated in Appendix B. Van der Waarden (30), in a stuqy of mineral oil in water
81 55 emulsions prepared by phase inversion and stabilized by ionie emulsifiers initially dissolved in the oil phase, found that o( 0 varied from 2.6 to 4.8 depending on the concentration of emulsifier,which was varied over the extraordinarily high range of 5 to 35 per cent by weight. On extrapolating to zero emulsifier concentration 0( 0 became 2.5. The abnormally high values of c( 0 were attributed to an increase in the effective volume fraction ~ by adsorption of the emulsifier on the globules. Examination of the resulta reveals surprisingly high values of relative viscosity probably due to incorrect assignment of ~ In the measureo ments of reduced viscosity the system was diluted with pure water; ~ was taken to be the viscosity at the critical micelle concentration and was practically the same as for pure water. Since Van der Waarden previously showed (29) that the emulsifier used in his system was partitioned between the two phases,the values of ~ are probably too ---.!: high. It was for these reasons that particular care was taken to avoid 0 uncertainties about ~ 0 in the present experimenta. From viscosity measurements on polymer latices containing soaps as stabilizers, Maron et al. (14,15,16) similarly concluded that the particle volume is increased by adsorption of the soap and made a correction for this adsorbed layer to obtain a value of 5/2 for 0( in ~ Eiler's equation (5). We have recalculated Maronts data (14,15) without making any volume correction and obtained reduced viscosity plots similar to those in Fig. 1. The details are given in Appendix B. 1 recalculated values of o( 0 and dl' given in Table VII; excellent agreement is shawn with values obtained qy other workers on solid spherical The
82 56 TABLE VII, PART III Viscosity of Dilute Suspensions of Solid Spheres (some recent values) Author Suspensions r4- Manley and Mason (13) Glass spheres 12.7 Matton et al. * (14,15) Polymer latices Saunders and Oswald (20) Polymer latices 2.50 *recalculated values using Eq. (le) with ~ correction for adsorbed volume.
83 57 particles. It appears therefore that in both cases the conclusion is unwarranted. The present resulta provide an excellent confirmation of Taylorts theory based on internal circulation except in certain cases in which the emulsifier can exercise an inhibitory effect on internal circulation and thereby cause an increase in 0( 0 In this connection it should be mentioned that internal circulation was observed in coarse particles of butyl benzoate undergoing gravitational sedimentation in water containing one per cent Tween 20, the system which in emulsion form showed excellent agreement with theory. Particles of diameter 100 ~ each containing a few 5 ~ water globules, which served as markers, were followed in a continuously travelling microscope as they slowly settled through the water phase under the action of the small density differences. Internal circulation patterns, like smoke-rings and similar to those described b,y Garner et al. (S) and by Savic (21) for sedimenting liquid drops, could be seen. As was mentioned earlier, Oldroyd (17,18) has recently extended Taylorts theory for emulsions having "normal" interfaces to allow for various complications such as interfacial slip and visco-elastic interfacial films. In the modified theory, slip (which may be envisaged t o occur, for example, with a "lubricati ng" film around each particle) will cause o( 0 to be less than given by Eq. (2a) at shear rates sufficiently low for Newtonian behaviour. An interracial film which is visco-elasti c in deformati on, i.e. which on i ncrease of surface area can withstand an increase of equilibri um interracial tension, will cause the particles
84 to behave as though solid (o< 0 58 = 5/2) in the Newtonian range. When the film is purely viscous, the predicted value is greater than that given by Equation (2a) but less than 5/2 in the Newtonian region. Oldroydts equation for this case, which appears to be the appropriate one for the systems, can be written, using the present notation, in the alternative forms: D<o = T) + 5/2 T) ' 0 + 2(2C +Jo)/a + 4/5(21; + 3a)/a (4a) = T) + 5/2 ( T) ' + T) ") 0 T) 0 + ( T) ' + T) ") (4b) Here ~ is the diameter of the emulsion particles; C is the two-dimensional shear viscosity of the film; a is the area viscosity of the film, the two-dimensional analogue of the bulk viscosity, which provides a measure of the energy dissipation when the interfacial area is changed at a finite rate: alternatively (19), ( a - C ) is the two-dimensional analogue of the second coefficient of viscosity (17); and T)" = 4/5 (2l; +Jo )/a is the amount by which the viscosity of the disperse phase must be increased to make Equation (2a) hold.
85 59 FIG. 5, PART III Effect of emulsifier concentration on Tl /Tl ' for butyl benzoate in 45% (curve 1), 33% (curve 2) and 22% ( curve 3) aqueous glycerine solutions containing Tween 20. "
86 /o EMULSIFIER 1.0
87 values of D( It will be noted that when ~ > 0, Equation (4a) yields 0 greater than those given by Equation (2a). When a -7 o or Tl '!_,, 00 d 0 becomes 5/2, i.e. the particles behave as though solid. 60 Equations (4a) can be used to calculate the quantities (2 t + 3 a ) and Tl " from the experimental values of 0( for systems deviating from Taylorts theory, since all other quantities including ~ are lmown. Values of (2t + 3a ) are given in Tables IV, V and VI and in Fig. 7 of Appendix C-1. Fig. 5 shows the variation of Tl "/Tl', the fractional increase in effective viscosity of the disperse phase due to the interfacial film, with emulsifier content for the butyl benzoate emulsions containing gl.yerine. As is to be expected, Tl "/ Tl ' is zero at zero concentration of emulsifier; at a given emulsifier concentration Tl "/ 11 ' is zero in pure water and increases with increasing glycerine concentration. On the basis of Oldroydts theory, it is concluded that there is interaction between the emulsifier and the glycerine which causes the interfacial film to become more viscous as the glycerine concentration increases. Of the two viscosity coefficients of the film, only the shear viscosity ~ at interfaces has ever been measured directly and most measurements have been made at air/water interfaces. Recent measurements by Joly (11) on a large number of surface-active agents and insoluble monolayer films at air/water interfaces yield values of t ranging from 0 to 10-3 surfaces poises (gm. sec.- 1 ); this is about the same range of values for (2 t + 3 a) in Tables IV, V and VI. The agree-
88 ment cannot be considered to be very significant, however, because of differences in composition between the two sets of interfaces and because of the presence of o, which is physically distinct from and independent of Ç, in the composite quantity given in the tables. To the current knowledge, o has never been measured for any phase interfaces, although it is conceivable that methods could be devised for measuring it at air/liquid interfaces which are analogous to those used in measnring the bulk coefficient of viscosity; direct measurements on liquiq/liquid interfaces would, however, present great difficulties. The results presented here suggest that viscosity measurements on emulsions, of sufficiently high precision, may be used in conjunction with Oldroyd's theory to derive properties of the liquiq/liquid interface. It remains to mention briefly the measured values of the interaction coefficient ~l' even though there exists no theoretical treatment of this for emulsions and the theory for solid spheres cannot yet be considered to be finally established. It is significant that the values of ~l increased systematically with the measured values of ~, 0 as shown in Fig. 6 which includes the measured and extrapolated values for most of the emulsions studied. Fig. 6 also includes the most recent, and it is believed, the most reliable values for solid spheres given in Table VII. It is seen that the points for the systems obeying Taylor's theory fall on a smooth curve passing through experimental points for (the limiting case of) solid spheres. The curve can
89 62 FIG. 6, PART III dt. 0 versus o( 1 open circles directly measured values solid circles - extrapolated values crosses solid spheres (Table VII) half circles, triangles and - emulsions deviating from Eq. (2c) squares Dotted lines show effect of emulsifier concentration.
90 ---, 0 f'() " 0 <:j _- t>---().. _t>-.- _... ~ _. ~... q (\J L cq 0 - q lt)
91 be represented by the empirical relationship: e 0.53 d (5). The linear plot of log at 1 versus 0( 0 2 has been given in Appendix C-1. The points for systems deviating from Taylorts equation lie somewhat scattered above the curve, (Fig. 6) indicating that in such systems G( is not uniquely deter.mined b,y 0( In the absence of a 1 0 theory of interactions for ideal emulsion behaviour, however, any speculation on the reasons for this behaviour is not warranted at this time.
92 PA.~T IV THE VISCOSITY OF DILUTE SUSPEM>IONS OF TFIREAD-LIKE PARTICLES
93 64 The viscosity of dilute suspensions of thread-like rayon particles has been measured for various axis ratios A: At low values of L when the partie les were rigid rods 1 the measured intrinsic viscosities 1 ~ 01 were in excellent agreement with Burgers' theory for rigid rods provided that the equivalent ellipsoidal axis ratio r was used instead of A: in the goniometrie factor and an orbit ~ constant C.. c0 is assumed. At higher values of L when the particles became flexible and underwent bending in the shear field, d was higher than the predicted values from theory. For values of A: up to o( 0 was independant of the velocity gradient G; the reduced viscosity on the other hand was independant of G only when r ~ 113. Suspensions of r > 113 showed the Weissenberg effect indicating elastic deformation of the threads b,y the gradient. Swelling the fibres with water caused a marked increase in ().. 0 at high values of A: It is concluded that elastic bending of the fibres causes an increase in d.o. A simple exponential relationship has been found between ~ 0 and the interaction coefficient ~ The significance of the resulta is discussed in relation to current theories of viscosity.
94 65 THE VISCOSITY OF DILUTE SUSPENSIONS OF THREAD-LIIΠPARTICLFS 1. INTRODUCTION The theory of viscosity of suspensions of rigid rod-like partiales without Brownian motion has been developed for ellipsoids by Jeffery (10) and Guth (7,8) and for ellipsoids and cylindrical rods by Burgers (2). When the axis ratio,.!: >> 1, Guth (7,e) obtained the relationship cio = Lim c~o ~ = c r + 2 (2 ln 2r-3) (la) from Jeffery's theory; here ~ is the volume fraction of the suspended particles and ~ _sp, the specifie viscosity. Equation (la) representa the maximum viscosity and was derived by assuming the major axis of the particle to lie in the XY plane of a field of laminar shear of gradient G defined by the velocity camponents u = Gy, v, w = 0 (Fig. 1) corresponding to a spherical elliptical orbit C = dj (12). The interaction coefficient o( 1 in the equation c (lb) for this case was calculated by Guth (e) to be: o(.l = (2 ln 2r-3) (le)
95 66 FIG. 1, PART IV Orbital distribution of a rod-like particle in. * sheared suspens1on *. Reproduced by kind permiss1on of Bartok, W. and Mason, S.G.
96 x 1- CD a:: 0~ Il > ~ - -- ~. _ _.... _. +-.
97 67 However, if the partic1es are oriented along the Z-axis, i.e. C = O, o( assumes a value of 2.0 when r >> 1 (8,10,13); this is the _,2 condition of minimum viscosity. Burgers (2) generalized Jefferyts theory to calculate c1.. 0 for values of C between 0 and o0 This was done b,y first calculating the viscosity contribution of a rod of a given orientation 0, ~: Tl.SP = 3(log 2r-1.8) sin40 2 sin 2~ (2) 4 where 1 is the length of the rod and ~ is the number of partic1es per unit volume, and 0, ~ the spherical polar coordinates of the principal axis relative to the Z-axis (Fig. 1). Equation (2) is an approximation which ignores the thickness of the particle and is only valid when r is large. The goniometrie factor sin 4 Q sin 2 2 ~ assumes a maximum value 4 when Q = 90 (i.e. C =ao) and~ = 45. Burgers showed that the timeaverage value of the factor for a particle rotating according to Jeffery's theory in a spherica1 elliptical orbit constant C is t = = 2d 1 c VcÇ = 2 c r v2 ' C +1 (3) for r > > 1.
98 Burgers averaged Equation (2) over all orbita by assuming after the suggestion of Eisenschitz (3) that the particles are isotropically distributed before the onset of motion and thereafter each particle retains its original orbit constant C. On averaging Equation 3 over all orbits and substituting the value of Q, the following expression is obtained: = 2r 3 n (ln 2r-1.8) (4) However, wh en C, C becomes unity and Equation(4) Vc 2 +l reduces to o(o r 3(ln 2r-1.8) (5) Masan et al. (l,ll,lb) have shawn that rigid cylindrical particles follow Jeffer,y's theoretical equations in all respects provided that the "equivalent ellipsoïdal axis ratio", r e is used instead of the true axis ratio ~; r can be calculated from the e measured period of rotation T in a gradient G using Jeffery's equation: TG = 2 n (r +.l.) e r e 2 n r e r >> 1 e (6) Over the range of axis ratios 20 to 120, J.3 = 1: varied from 1.4 to 1.9. r e
99 .fifj Burgers, in calculating the mean goniometrie factor, assumed in effect that 8 = 1. To allow for the deviation from Jeffery's equation due to the fact that the particles are cylindrical rather than ellipsoïdal, r e should be substituted in Equation(3}. Since r <.!. for cylindrical particles, it follows that ~ the mean value of L is greater than given by Equation (3) by the factor fi- because the particles spend relatively more time away from!zl = n /2 i.e. more time in positions which are more effective in increasing the viscosity. Modified in this way, Equation(~ becomes: = 3 n (ln 2r-l.S) (7a) for Eisenschitz distribution of c. F or C =oo o(o = Pr 3 (ln 2r-l.S) (7b) In Table IV measured values of o< are compared with those ~ calculated from Equations (la), (4), (7a) and (7b), using the experimentally measured values of J? (6) for the last two equations. It is seen that the best agreement is found with Equation (7b). Furthermore, Manley and Mason (11) showed that the steady state distribution of C, differed from that predicted from the Eisenschitz assumption of isotropy (3). Averaging Equation (3) by using the experimentally determined distribution of orbit constants, yielded
100 70 values of d~ about one half of those calculated from Eisenschitzts assumption. Little experimental work on the viscosity of suspensions of rods has been reported. Eirich et al. (4) measured the viscosity of suspensions of glass rods, silk and rayon fibres in capillar,y and rotational viscometers but the results by the two methods did not agree. Experimental values were higher than those calculated from Equation (la), but there is sorne question of their validity because of wall-affects, polydispersity and possibly aggregation. In another study of the effect of swelling, Eirich and Sverak (5) obtained o( _Q, values lower than those calculated from Equation (la). However, the swollen fibres became rolled into coils, whereas Equation (la) is intended for rigid rads. Before the present experimenta are described, brief mention of wall-effect should be made. When a suspension of spherical or non-spherical particles is sheared, pseudo-slip occurs at the walls i.e. a liquid layer, free from the suspended particles, may be present on the walls. The extent of this slip will decrease as the apparatus becomes larger and the particles smaller. For spherical particles, Vand (20,19) has calculated the magnitude of wall-effects for capillary and Couette flow but no theor,y has yet been developed for suspensions of rads. Striking wall-affects with phase separation and pronounced wall slip have recently been observed by Robertson and Masan (14) in water suspensions of wood fibres. Further remarks on wall affects have been made in Part I.
101 71. In the present investigation rayon fibres of uniform diameter of 3.5 f..l were used in contrast to the diameters of 50 to 90 f..l in Eirich et al. 's measurements. This permitted the use of shorter fibres for any particular axis ratio and reduced the possibility of undesirable wall-effect, which was checked by making measurements with different apparatus dimensions. The large deviation of the measured values (4,5) from the theory and the absence of any theory for viscosity of flexible fibres, stimulated the present work and fibre samples were so chosen that at sufficient lengths they became flexible at the velocity gradient employed. 2. EXPERIMENTAL PART Suspensions of rayon fibres of constant axis ratio were prepared from continuous filament having a remarkab~ uniform diameter of 3.5 f..l, kindly supplied by the Research Department, American Viscose Corporation, Marcus Hook, Pa. The threads, each consisting of about 1000 single filaments were tightly wound around nails in a rectangular frame until there were parallel loops which were embedded in "Tissuemat" wax and finally eut ta appropriate lengths using sliding microtomes. About 1! million particles were eut during every sectioning. with hot.xylene. The wax was dissolved after repeated extraction!ylene was removed with anhydrous ether and the fibres were oven-dried ta constant weight. Great care was taken to
102 remove bundles of adhering parallel fibres resulting mainly from incomplete dissolution of wax. It is estimated that less than one bundle of 2 or 3 fibres per thousand filaments remained. Castor oil (No. 300 oil, Baker Castor Oil Co., New York) was used as the dispersion medium because of its high viscosity (circa 25 Poise) which prevented sedimentation of the particles, -1 7 Newtonian behaviour over the gradients of 9 to 100 sec employed in, viscosity measurements, and be cause it did not swell the fibres. Further, it was non-hygroscopie, non-volatile and was stable on heating up to 50 C. Suspensions were prepared by adding weighed quantities of fibres to known weights of the oil, stirring randomly with a glass rod until uniform and allowing to stand at about 40 C for several hours until a11 the air bubbles escaped. When the fibres were waterswollen, however, the suspension was kept in the thermostat for longer periods. The dispersions so prepared were free from fibre aggregates and air bubbles. Further details of the preparation or samples will be found in Appendix - D-2. In making viscosity measurements at various concentrations, the original suspension was diluted gravimetrically with the medium. The density of the dry fibres was determined b.r volume displacement in xylene and was found to be gm(cc; this value, along with the density of castor oil (O. 992 gm/ cc), was used to compute c
103 73 values, with a precision of ± 0.1 per cent. The diameter of the fibre was measured using a calibrated filar eye-piece in a monocular microscope and the lengths in a calibrated projection microscope. The axis ratio ~ varied from about 40 to 400 and their exact values together with mean deviatioœ have been given in Tables I and II where the uniformity of the samples can be seen. The fibres were swollen by exposing them to water vapour at a constant relative humidity of 93.3 per cent over a saturated solution of ammonium dihydrogen phosphate in an air-free vacu~ ti.ght container which had provision for introducing the oil without exposing the fibres to air. This arrangement is described in Appendi.x - 1}-3. The increase in weight due to moisture adsorption, amounting to about 20 to 2S per cent 1 was determined by wei.ghing. To compute ~ values, densities were calculated from Herman's (9) density-moisture content curves using the curve for regenerated cellulose having a water-free density, determined by displacement of carbon tetrachloride/nitrobenzene solutions of gm/ cc which corresponds ver,y closely to the xylene-density of stated above. The viscosity was measured in the DRAGE (A.G. Epprecht, Chemical Institute, Zurich, " Switzerland) rotational viscometer having rotating bobs and fi.xed cups and a torque-measuring spring. It had provisions to measure viscosity at three calculable shear rates for each eup/bob combination. By using an auxiliacy scale to increase the accuracy of the torque reading, the relative viscosity was
104 '?4 measured with an accuracy of.:t 0.1 to.:t 0.5 per cent depending on the absolute deflection of the pointer. The cups were immersed in a thermostat maintained at 25.0 ± A brier description of the viscometer is given in Appendix - D-1. Suspension of the water-swollen fibres were kept in the thermostated viscometer, except during the short period of weighing, so that the adsorption equilibriœn was not disturbed. 3. RESULTS (a) Wall-affect: To check for wall-slip, which would cause errors in the measured viscosity, measurements were carried out in two eup and bob combinations,.n2! 1 and 2, with annular gaps of 3.3 and 12.3 mm respectively. For fibres of axis ratio ~ 113, o( 0 values obtained in combination 1 were compared with those using combination 2. For.fibres of axis ratio > 113, combinat ion 2 was principally employed and check measurements were made in combination 1. As shown in Tables I and II identical values of o( ---2 detectable wall-effect. were obtained indicating no When r ~ 113, the reduced viscosities of the suspensions were shear-independent and identical values of ~ --sp,-. 1 c were obtained in both the combinations. For longer fibres (up to ~ = 356) the reduced viscosities ~ sp/c were shear-dependent but not o( ; 0 the two
105 75 TABLE I - PART IV Viscosity of Suspension of Rayon Fibres in Castor Oil -1 Shear rates to 93.3 sec Cup and bob combination 1 = 3.3 mm Annular gap: Cup and bob combination 2 = 12.3 mm Sample Axis Volume ratio fraction Tl sr/_ c d..o o(l r g%. 1 2 Remarks A ;t (i) Tl /c and o( sp o independant of shear rates B ± (ii) Particles found rigid in the double Couette. c ;tl
106 TABlE II - PART IV Viscosity of Suspensions of Rayon Fibres. Cup and bob combination 2 G 2 = 57.5 G 3 = 93.3 Cup and bob combination 1 Shear rate, sec -1. G1 = 18.4 Axis Volume Sample ratio fraction Tl sri_ c d.o r rtf, Gl G2 G3 - Remarks {i) Tl s/ c slightly shear-dependent - but d 0 independ- D 173~ ent of shear rate 44 (ii) Weissenberg eff ect first observed (iii) Fibres underwent slight bending in oll "" 2853 o(l = 2302 cal = 2158 shear flow --1 ~ (i) General behaviour same as D but more pronounced Weissenberg effect E 241~ (ii) Viscosity increased slightly with time of shearing (iii) Particles found in the double Couette oll =17, 750 dl=l2,680 ()(1=11,650 to be flexible and to some extent permanently deformed
107 TABLE II - PART IV (continued) Sample Axis Volume ratio fraction Tl s /c r c% G1 G2 G Min-292 Min Max-332 Max Min-308 Min Max-376 Ma.x-235 d..o - Remarks (i) Viscosity shear and time dependent (ii) Pronounced Weissenberg effect increasing with time F 356.± Min-354 Min Max-404 Max Min-572 Min Ma.x-673 Max-452 cj.. 1 = - ve 0( = - ve 1 (iii) Particle found permanently deformed after shearing (iv) Stringy c1umps formed on the bob on continued shearing ~ ~
108 78 cups gave sfudlar values of at as is shown in Table II and plot D, 0 Fig. 2. Further, the suspensions in the annular gap of the viscometer were observed with a microscope to see whether there was aey wall slip, which might be revealed as a fibre-free layer (1.4); none could be seen. This, however, did not conclusively prove the complete absence of spurious wall-effects; however, this observation and the resulte with the two cups, showed that any slip, if occurring, was small and without measurable effect. (b) Behaviour of Sheared Suspensions: Before comparing the resulta with the various theories discussed in the Introduction, sorne significant observations made during the measurements should be mentioned. The suspensions A, B and C (designated according to increasing axis ratio, Tables I and II) were Newtonian and no abnormal behaviour was found. The suspensions D and E, whose viscosities were shear-dependent at finite concentrations, were found to exhibit the Weissenberg effect (22,21) i.e. on applying the shear, the liquid climbed up the inner cylinder. The extent of climbing increased with increasing axis ratio and shear rate, while the e.t'fect of concentration, if any, was small. Observations under a microscope immediately after shearing showed that the particles in suspension E were no longer straight but appeared to have been defor.med by the shearing action; those of D barely showed signa of deformation. In the suspensions A, B, C and D the viscosities were indep-
109 79 FIG. 2, PART IV Reduced viscosity - ~ plots B - Suspension of rayon fibres in castor oil, axis ratio = 75 D - Suspension of rayon fibres in castor oil, axis ratio = G = 18.4 sec-l 2 - G = 57.5 sec-l 3 - G = 93.3 sec -1
110 j, B C o/o D
111 80 endent of shearing time. In Suspension E, however, a s1ight timedependance was!ound; the viscosity increased in about 20 seconds to a constant reproducib1e value. The increase in viscosity is estimated to be about 0.5 to 1 per cent at ~ = 0.15 per cent. Suspension F behaved quite differently. The Weissenberg effect was very pronounced; the suspension c1imbed up about one am.on the inner cy1inder at G = 57.5 sec - 1 and increased further with increase in Q. The viscosity increased with continued shearing until stringy c1umps were formed on the bob in about 2 to 3 minutes causing the pointer of the viscometer to be def1ected erratica1ly. On!urther shearing, the c1ump became larger and assumed a disc-like shape and finally broke off from the inner cylinder when fresh clumps were for.med. On examination under a microscope, these clumps were found to be fibre aggregates, which, when held between two forceps could sustain appreciable tension before being pulled apart. On redispersing the system, the viscosity was always found to be greater than the initial value, measured in the first 15 seconds of shearing. However, a higher reproducible value, well before the clumps were reformed, was obtained. These two sets of reduced viscosity values are shown in Table II as mini:ma and maxima. When the usual..!l...sp/~ - ~ were made, curves having negative slopes were found within the concentration range studied. The reduced viscosity increased more rapidly with decrease in ~ and therefore o( could not be evaluated. The fibres in this 0 suspension were found to be completely flexible and per.manently deformed after shearing. The unsheared and sheared fibres are shown in Fig. 3.
112 81. FIG. 3, PART IV Photomicrographs showing the effect of shear rate on fibre deformation (Samp1e F) 1 - Unsheared suspension 2 - Sheared suspension, G = 57.5 sec -1
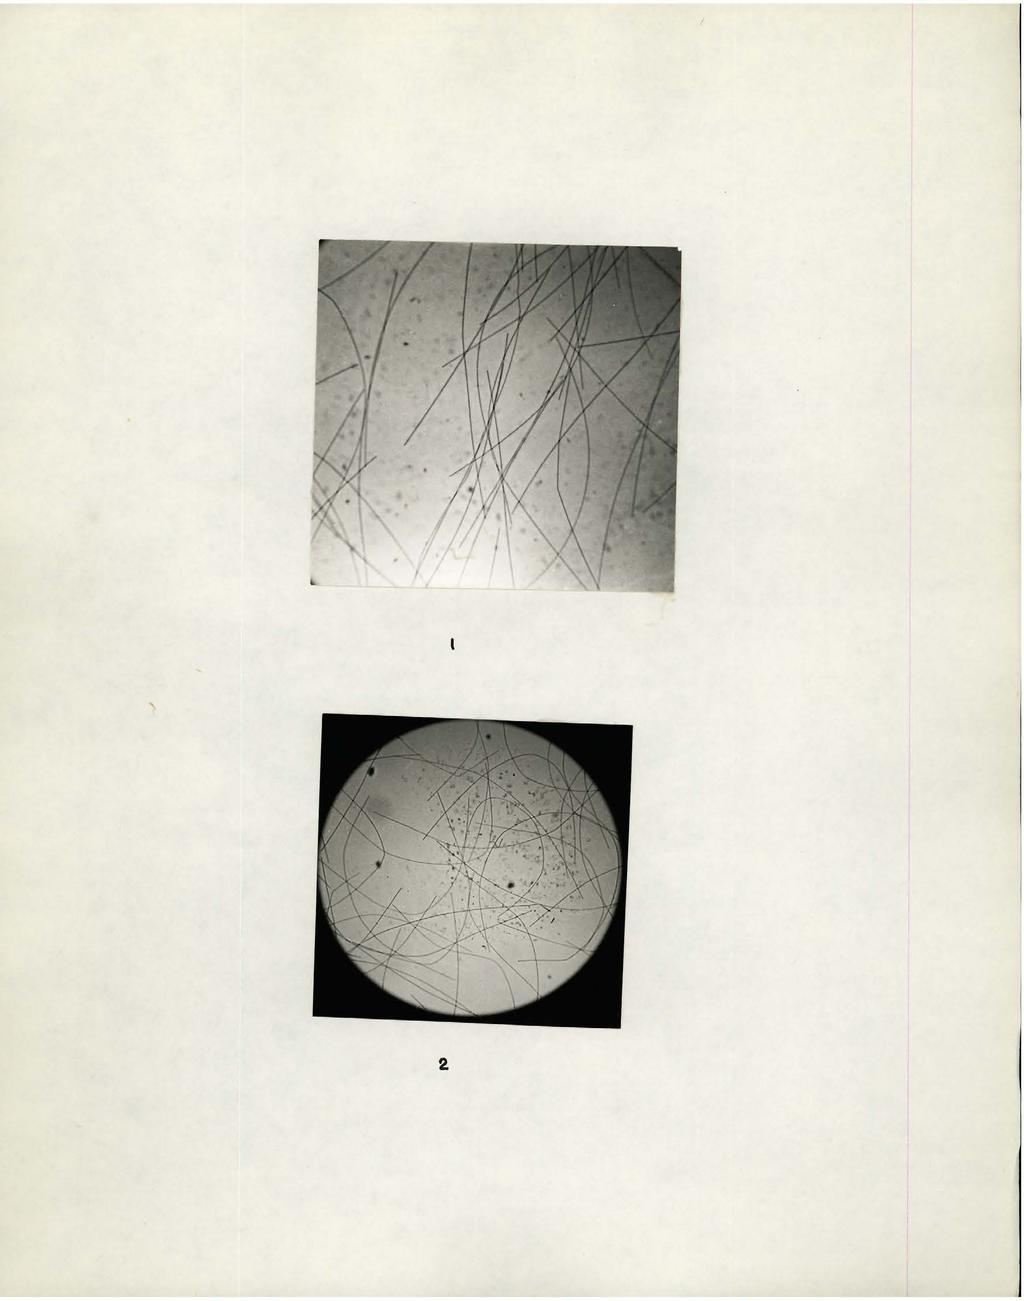
113 2.
114 (c) Behaviour of Single Fibres in a Double Couette Apparatus The presence of the Weissenberg effect suggested that the fibres in the suspensions D, E and F no longer behaved as rigid rods but underwent various stages of elastic deformation (12) when sheared. Consequent~ they were observed in a double Couette apparatus where single isolated fibres could be studied in a shear flow (6). The dispersion medium was the same castor oil and although G in these experimenta was less ( ~10 sec- 1 ) than in the viscometer, the previous observations on fibre flexibility were confirmed. The fibres in the suspension D appeared to be slightly flexible, while the fibres in the original sheared suspension F from the viscometer were found to be permanently defor.med, even after standing for several days. The r ~ values of all the samples were measured in the Couette apparatus (6) using Jeffery's theory (Eq. 6). ( d) Swollen Fibres: The Weissenberg effect and increasingly higher o( values ---2 were probably due to the fibres being flexible. Since swollen fibres may be expected to be more flexible than the non-swollen ones, the samples of the original fibres C, D and E were swollen and the viscosity measured. Table III shows the measured values of these swollen fibres, cs, DS and FS and compared to those of the unswollen ones. Sample CS was found to be rigid and ci. 0 decreased by the amount to be e.xpected from the decrease in axis ratio due to swelling. The sample œ was
115 TABLE III - PART IV Viscosity of Suspensions of Swollen Rayon Fibres Shear rates from 18.4 to 57.5 sec- 1 Before Swelling Sample r rj... 0 c D E After Swelling Mois ture absorbed Sample wt% r do cs œ ES Remarlœ (i) No change in behaviour after swelling (ii) Particles found rigid in the double Couette apparat us (i) ~ shear-:,depc en dent (ii) Weissenberg effect appeared to have decreased (iii) Particle found in the double Couette to be more flexible after swelling (i) Behaviour somewhat similar to sample F (ii) Slight c1ump fo~ at ion (iii) Particles found in the double Couette to be more flexible after swelling and permanently deformed after shearing (iv) Tl ~ c shear dependent
116 observed in the Couette apparatus to be more flexible after swelling (6), and o( 0 increased despite the decrease in~ Sample ES, however 1 showed behaviour somewhat similar to that of sample F. The viscosity increased (by 1 to 2 per cent) with shearing time 1 but to a lesser degree. Although d,.. 0 was shear independant, o< was found to be 60,000 1 and almost zero at G = 18.4 and 57.5 sec-l respectively, indicating that cj. 1 would become negative at higher gradients and would thus behave si.milarl.y to the sample F. o( 0 increased from 76 for the unswollen sample to 210 for the swollen one in spite of a decrease in axis ratio from 241 to DISCUSSION It was remarked earlier that in calculating o< 0 from Burgers' equation (Eq. 4) due consideration should be given to the mean goniometrie factor~ given in Eq. (3). The observation of Mason et al. (1,6,11,1.8) that Jefferyts theory (Eq. 6) was obeyed by rigid rods only when an equivalent ellipsoïdal axis ratio r was used instead of ~ the actual 1: 1 is of great significance in this connection. f1 = ~ e increases with 1: and for flexible fibres assumes high values which mean that ~ increases proportionately with increase in JS. account for this, J9 values were experimentally deter.mined in a double Couette apparat us for modifying Burgera' theory. To
117 85 (a) Intrinsic V:i.scosity, cj. 0 Table IV contains a summary of the measured values of d.. 0 and of the values calculated from Equations (la), (4), (7a) and (7b). The values from Eq. (4) are always lower than the measured ones and cannot be considered to lie within experimental error. Except for system A, the measured values are persistent~ higher than those. ) predicted b.y Eq. (la), which was derived on the assumption of C = o0 and so gives the maximum viscosity. The best agreement with the experimental values for the unswollen fibres is shown b.y Eq. (7b), which contains r, rather than r in the goniometrie factor and an ~ - orbit constant C =oo, (Table IV, Fig. 5). However, except the system CS, all the measured values in the swollen samples, which are more flexible than the unswollen ones, are higher than the values predicted from Eq. (7b). On the other hand, Manley and Mason (11), from the observed distribution of the orbit constant C, predicated o( 0 values about one half of those calculated from Eq. (7a). The predicted values are, however, much too low. Before any conclusion is drawn, it is necessary to mention same other factors which would tend to increase the measured d. 0 values and cause deviation from the theories. (b) Possible Causes of Deviation: (i) The value of J9 increases rapidly as the fibres become flexible and may assume high values for curved or defor.med fibres, as
118 86 FIG. 4, PART IV Variation of o( 0 with axis ratio Curve 1 - Equation 7b Curve 2 - Equation 4 open circles - unswollen samples solid circles - swollen samples arrow indicates variation of r and c( after swelling - 0
119 L ~ rf),.. 0 o o._ C\1<( 0:: ecn Cl) - x <( l() 0
120 87 TABLE IV- PART IV Comparison of Measured and Calculated Intrinsic Viscosities Samp1e Axis ratio r. r/r e Eg. 4 ~ calculated ;HAJ. la Fe. 7a Eg.7b d.o Measured A B c D E F ? cs œ
121 88 has been shown by Forgacs and Mason (6). For example, fj, for slightly deformed or curved fibres, could be as high as 4 and 5.5 for the systems D and DS respectively, while deformed fibres in ES yielded values of the order of 50. The values of IJ in Table IV re fer to selected undeformed fibres, which means that the calculated values of o( 0 from Eq. (7a) might have been much higher, if the fi values for deformed fibres were used. Unfortunately, in the suspensions D, E, DS and ES, the proportion of the deformed or curved fibres could not be estimated although their proportion in other systems of lower axis ratios was insignificant. Further, 13 values are dependent on the extent of curvature (6) which made their correct evaluation difficult. (ii) On increasing axis ratios, the orbital constant C tends to increase (11) and for flexible fibres it may even approach infinity, thereb,y making appropriate the use of Eq. (7b). There is some evidence for this in the present work and in the observations of Forgacs and Mason (6) although the findings are not yet conclusive. There is also the possibility that this effect becomes more pronounced at finite concentrations and may be enhanced further at high G's. (iii) d. 0 itself may be increased due to a change in particle shape from rod-like to curved. However there is no applicable theor,y. It might also be argued that for very flexible fibres, forming 'coils' by shearing,o( 0 would decrease rather than increase. Since, in the - present investigation, there is no evidence of 'coil' formation, the
122 last argument can be disregarded. (iv) Since it has been demonstrated by Manley and Mason (11) that there is a distribution of C between 0 andoo, instead of the single value of C s o0, Eq. (?b) should not apply, although agreement with the resulte is indicated. This agreement may be fortuitous for reasons alreaqy discussed. (c) Time Effects: (i) Manley and Masonts (11) prediction that o< 0 should be about one half the value calculated from Equation(7~,however,cannot be observed experimentally due to particle interaction in the present cases. The number of collisions, f,suffered by a particle (12) is given by the expression f = 2 16cGr 3 (8) where the symbols have the same meaning as before. Substituting the values for the shortest fibre, lowest shear rate and concentration i turn out to be about loo/sec. This means that any decrease in viscosity as predicted, will occur in about 1/100 of a second and so cannot be observed. (ii) Substantial increase of the reduced viscosity with shearing time in the suspension F is undoubtedly due to permanent deformation on continued shearing, thereby increasing the value of~.
123 90 When the single fibres in the sheared suspension were observed in a double Couette apparatus, they were found to be permanently deformed even after standing for days. The slight increase in the reduced viscosity with shearing in the suspensions E and ES is ascribed to the same effect. (d) Other Effects: The negative slope of the n / c - c curve for the suspension., sp - F remains unexplainable. Microscopie observation immediately after shearing in the viscometer at G = 57.5 sec- 1, showed the presence of all the stages of snake-turn motion (12) but in the double Couette, at -1 a G of 9 sec, "springy" rotations were observed probably due to lower G value. Whether the negative slope is due to wall effects or due to complicated orbits, is difficult to visualize. The ver,y pronounced effect of G on ~ 1 in the suspension ES is also unexplainable at the present stage. (e) The Interaction Co-efficienta 1 : It may be noted here that the values of the interaction coefficient,oe 1, observed in the present investigation are much lower than those calculated from Equation(lc) even for cases when the reduced viscosity was shear-independent. The calculated values of0( for the 1 suspensions A, B, C, D and E are 533, 2400, 7360, 23,800 and 59,800 respectively which are s everal times greater than the values measured. Correlation of the observed values with any theory at the present time
124 is not possible. The shear dependance of ~lat r ~ 173 is probably an interaction effect. Other speculations, in the absence of any theory, could be made but such speculations are unwarranted. However when log c(l was plotted against log o( 0 a linear relationship was obtained, as shown in Fig. 5, with a slope of 2.3 giving the empirical relationship: 2.3 log o( + constant 0 (9) The points shown by squares in Fig. 5, refer to the o(l values at G = 0, obtained by an extrapolation from a plot of log d.. 1 vs. G. The two points, shown qy crosses, refer to the values of spheres (Part III) and lie in close proximity to the line drawn through the points for thread-like particles. (f) The Weissenberg Effect: It remains to make a brief reference to the Weissenberg (22, 21) affect. The theory of Weissenberg demanda the presence of elastic elements in the system to exhibit this effect. Although to the knowledge of the author, there is no mention i n the literature that suspensions of fibres exhibit the Weissenberg effect, Taylor (17) remarked, rather indirectly, that if the theor.y of Weissenberg was correct, the effect would be shown in suspensions of flexible fibres. It may be noted in this connection, that recently Roberts (15,16) seemed
125 FIG. 5, PART IV Log d.. 1 versus Log ci 0 open circles - shear-independent ol 1 values, unswollen samples squares - extrapolated o< 1 values at G = 0, unswollen samples solid points - swollen samples crosses - cj.. 1 values for solid spheres (Part III, Table VII)
126 Cl 0 _J , LOG,oao ' ' L
127 93 to have confirmed Weissenbergts theory beyond any reasonable doubt. The theory also shows that as a result of telastic response' of deformable particles in shear flow, additional pressures are built up in the system which cause the liquid to undergo secondary flow and to rise on the inner cylinder. The concept of equivalent axis ratio, r, and its application ~ to the theory of viscosity in conjunction with the goniometrie expression, has brought about a measure of agreement between the theory and experiment. By the treatment presented here, within the limitations of experimental evaluation of P, the contribution of both rigid and flexible fibres to viscosity can be more satisfactorily explained than by any other treatment thus far known. However more extensive experimental investigation on this important branch of rheology is needed for a complete understanding of the phenomenon.
128 APPENDIX - A THE DILUTION CAPILLARY VISCOME'IERS FOR FOAMING LIQUIDS
129 94 APPENDIX - A THE DTI.UTION CAPILLARY VISCOMETERS It was remarked earlier in Part III - 2 that usual for.ms of capillary viscometers were unsuitable for the viscosity measurements of emulsions because of their hi.gh tendency to foam. Two capillary viscometers were therefore desi.gned to overcome the difficulty and these are described below. Conventional Ostwald viscometers are inconvenient when viscosityconcentration relationships are studied since the measurement at each concentration requires a separate cleaning~ drying and filling. Mbdified forms of Ubbelohde "suspended level" viscometers (1, 2) of appropriate design are excellent for dilutions. But they cannot be used for foaming liquids. It is well known that when the liquid falls from the bulb to the meniscus in an Ubbelohde viscometer a small amount o! liquid always remains in the capillary and when suction is applied for raising the liquid to the bulbs, foams are produced which make any further measurements impossible. Somewhat si.mi.lar troubles are met w.i.th Ostwald viscometers but to a lasser degree and measurements, although not impossible, are difficult. The new viscometers proved successful for the purpose and both are of the Ostwald-type modified to permit a) control of!oam, b) dilution!g situ and c) measurements at two or more mean rates of shear.
130 95 1. Description One of the two viscometers is sho'wll diagra:mmatically in Fig. 1, and consista of the following essential parts. A Upper reservoir F, G Bulbs B Lower reservoir, nat bottomed H, Hl Connecting tubes (2 mm bore) c Ground glass joint (male) J Tapered end D Ground glass joint (female) K Small enlargement E Main capillary L,M,N,O Reference marks P, Q Side arm The viscometer bulbs F and G were blo'wil from the connecting tube H. The end J in the reservoir A was tapered on the outside to facilitate the out-flow of foam from the tube. A small hole was drilled in C in line with the tube H 1 so that a stopcock was thereb,y formed to allow.flow from tube H 1 into the reservoir B. 2 Operation A suitable volume o:r the :toam-producing liquid i.s introduced into the upper reservoir A. The stopcock is opened and by applying gentle suction the liquid is transferred through H 1 to the lower reservoir B b,y.flowing down the side arm P. This operation is easily mastered with practice. If.foam accumulates in the side arm P or upper portion of B, it can be broken down by judicious application and release of suction through C with the stopcock closed.
131 96 FIG. 1, Appendix - A Dilution Viscometer for Foaming Liquids
132 Q TO CLAMP c A-- j H J D K J L G H----J F--- E--- -
133 TABLE I, Appendix - A Effiux times of agueous glycerine containing 1% Tween 20 Time in Seconds Runs Bulb 1 Bulb
134 sucked up to the reservoir A and the cycle is repeated 2 to 4 times until homogeneous. This viscometer has been used to determine the relative viscosity of foaming emulsions to a precision of 0.2 per cent or better, and greatly facilitates the viscosity measurements. It should be noted here that the kinetic energy correction, determined in the usual way with glycerine solutions, was positive, i.e. of the same sign usually found for an Ostwald viscometer. The maximum correction necessar,y for the bulbs was about 0.2% for the range studied. The viscometer shown in Fig. 2 was designed first and was operated essentially on the same principle except that the transfer of liquid from one bulb to the other was carried out through the ordinar,y stopcock. The viscometer was however bulky and heavy. Consequently a stainless-steel clamp was devised to hold the viscometer as shown in the photograph (Fig. 2). The viscometer had three bulbs and viscosities could be measured at three or more shear rates. This viscometer was used for most of the emulsions of butyl benzoate in water. For the emulsions containing glycerine and sugar solutions the effiux times were too high and the viscometer shown in Fig. 1 which, incidentally, was more convenient to manipulate, was used.
135 1.00 FIG. 2, Appendix - A Dilution Viecometer for Foami.ng Liquide
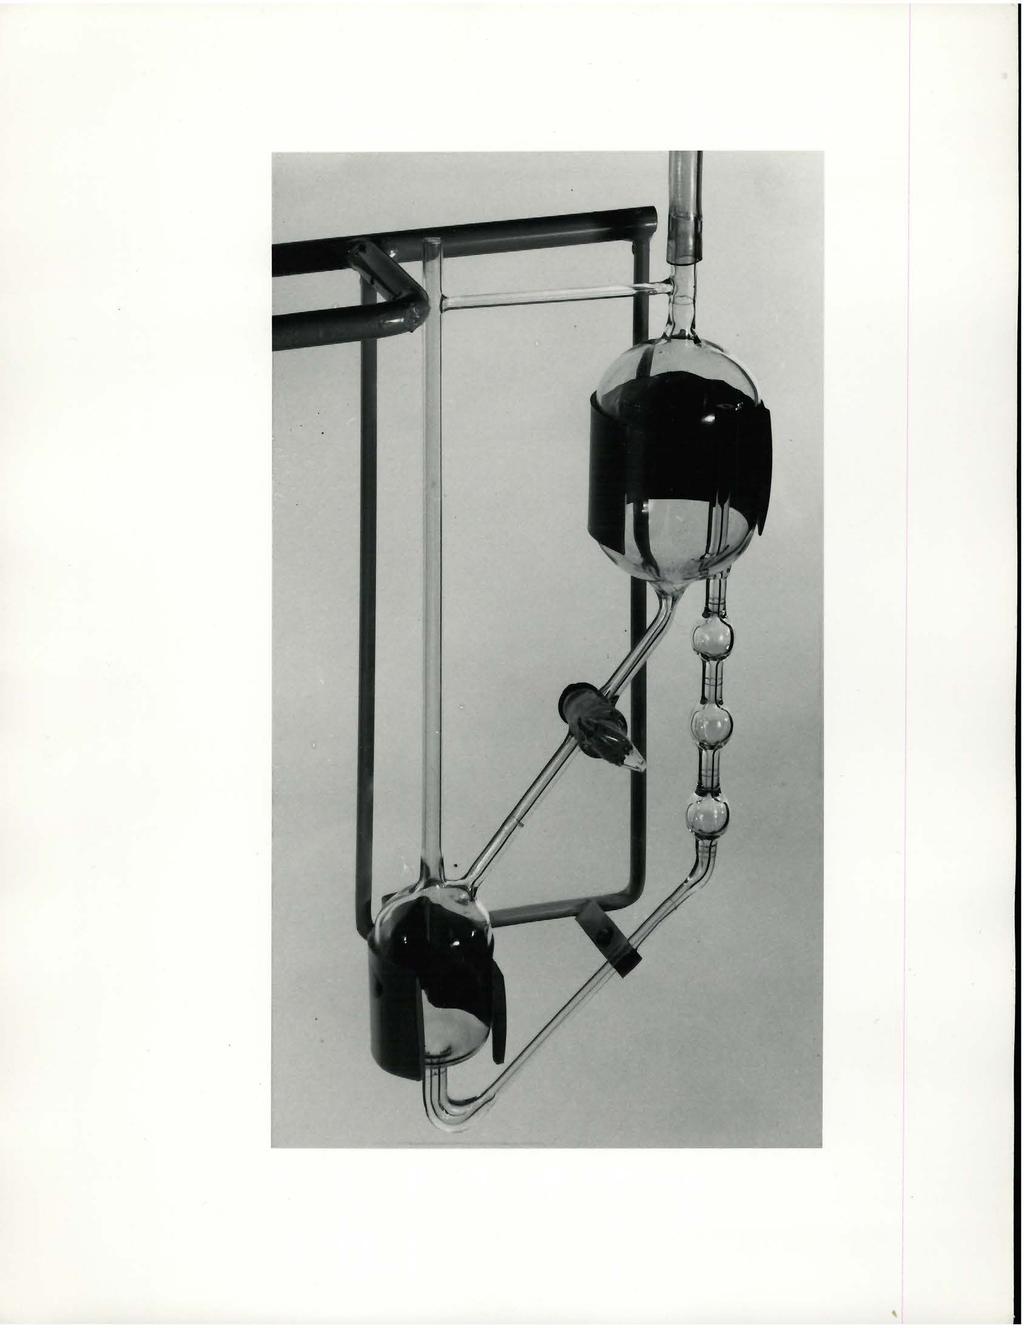
136 \
137 APPENDIX- B EXPERIMENTAL INVESTIGATIONS ON E:t-1ULSION VISCOSITY.An Historical. Review
138 Experimental Investigations of Emulsion Viscosity: An Historical Review A brief summary of some of the earlier works on emulsion viscosity,conclusions from which are of -interest to the present stuqy, is discussed in this section to amplify the remarks in Introduction to Part III. Sibree (1,2), from a series of measurements on the viscosity of oi~water and water/oil emulsions, found that if the volume fraction of the disperse phase, ~, was greater than 0.5 and a hydration factor, 'hl of about 1.3 be assumed, Hatschekts (3) equation was applicable i.e. r = 1 (1) 1-y~ 1 1 The hydration factor, h, was defined as the ratio of the measured to calculated values of ~ These resulta were considered to indicate that the effective volume of the disperse phase of the emulsions exceeded the true volume by about 30 per cent irrespective of the globular aize. The interpretation must imply, therefore, that the adsorbed layer on the emulsifier on the globules increased with increasing particle diameter, a condition difficult to visualise. Sherman (4), Broughton and Squires (5) on the other hand obtained values of 'h' sometimes even less than unity.
139 1_02 Sherman (6) in a study on the influence of disperse phase viscosity in concentrated emulsions, at constant ~ ( 0.?1), observed that Taylorts theory (Part III - 1) was not applicable since the viscosity ratio, P, of the two phases had no effect on emulsion viacosity. However, when carbon black was added as an additional stabilizer, the viscosity increased. The effect of carbon black was not always the same and the author concluded that due to adsorption of carbon at the interface, the particles might be regarded as a solid. Since ~ was high a possibility of the formation of tightly packed aggregates was also considered. Leviton and Leighton (?), using milk fat in skim milk as the emulsions, concluded in favour of internal circulation in emulsion drops as predicted by Taylor. Their conclusions might be correct but, however, were based on inadequate experimental data. They fitted their viscosity resulta to the equation ln~ r ~ = 5/2 K / ll/31 (2) The tenns IJ 5/3 and IJ ll/3 were included to obtain agreement with the theor,y. Inclusion of auch terms, assumption of a constant viscosity of a complex system like milk fat rendered their conclusions rather uncertain. MOreover, when their resulta were treated the same way as in the present investigation, wide scatters were observed and so the resulta were inconclusive. Reduced viacosity - ~ plots of their data are shown in Fig. 1 which further amplifies the remarks made. Sherman's (8) viscosity measurements of water/oil emulsions in
140 FIG. 1, Appendix - B Reduced Viscosity versus ~ Milk fat in skim milk* Emulsion d.** ca 0 measured calc~ated Remark not linear, d. obtained by smooth extrapolation linear, scat ter 3-A linear, scat ter 0 4- )( from smooth extrapolation extrapolation of last three points * Leviton and Leighton (7) ** Values treated according to Eq. 2c (Part III - 1)
141 L----~----..l L o cp.24.32
142 1.04 the dilute region are also shown in Fig. 2. One of the emulsions (no. 4) is seen to give a negative slope up to ~ ':::::: Sherman obtained values of al 0 from 2.27 to 2.75 and concluded that these values were not far from Einstein's value of 5/2 for solid spheres. The reduced viscosity - t:fi plots of the four emulsions in Fig. 2, however, clearly shows that no such conclusion can be drawn. As mentioned earlier in Part III - 4 Maron et al. (9, 10, 11) found that the values of the intrinsic viscosities obtained from their polymer latex suspensions were hi.gher than the Einstein's value of 5/2 unless a correction for the adsorbed layer of soap on latex particles was applied. Two of their measurements (9, 10) are graphically represented in Fig. 3 without any correction for the volume factor. Extrapolation of the linear portions to ~ = 0, yielded values of o( 0 = Whereas the authors, using Eilers (13) equation, obtained values of~ 2.S and 2.9. The excellent linear relationship in Fig. 3 clearly shows that such assumptions of increased ~ due to soap adsorption are unnecessary. The same discrepancies and misconceptions can also be found in a lat er study (12).
143 FIG. 2, Appendix - B Reduced Viscosity versus ~ Water/oil emulsions* Curve 1 - Curve 2 - Curve 3 - Curve 4-1% emulsifier 2% emulsifier 3. 5% emulsifier 5% emuls ifier * Shennan (8) b :,1
144 0 aq 0 ~ 0 : f'().. o C\J. 0-0 ari w. C\J
145 FIG. 3, Appendix - B Reduced Viscosity versus ~ Polymer latex (Maron et al.) open circle - solid circle - Maron and Belner (9) Maron and Fok (10) Note - Values of relative viscosity were taken from the completely Newtonian range. ~ 0 C'"J
146 0 N LO 0 -e- LO q \ \ \ 0 (.0 \
147 APPENDIX - C-1 'lhe VISCOOITY OF DIWTE EMULSIONS: A Supplement to Part III
148 1.07 APPENDIX - C-1 THE VISCOOITY OF DILUTE EMUlSIONS A Supplement to Part III This section contains additional information on the viscosity or dilute emulsions. (a) Newtonian behaviour of emulsions: It was remarked earlier that the emulsions whose viscosities were measured during the present investigation behaved as Newtonian liquids over the range or concentrations and velocity gradients studied. The relative viscosities or two typical emulsions at different mean rates or shear are given in Table I. (b) Calculation of the density of an emulsion To calculate the relative viscosity from measured efflux time in a capillary viscometer, the density of the e:mulsion must be known. In some cases the density was measured directly in a pyknometer while in others it was calculated b,y interpolation from a density-composition plot. Fig. 1 shows two such curves. ( c) Effect or emulsifier on r.j... and ~ While sorne of the emulsions were round to obey Taylorts theory,
149 1_08 TABLE I, APPENDIX - C-l Newtonian Behaviour of Dilute Emulsions Volume Mean rates Relative fraction of shear viscosity Emulsion % q, sec:-1 :r: Butyl benzoate in % aqueous glycerine solution + 1% Tween B Butyl benzoate in water + 1% Tween 20 aoo
150 1_09 FIG. 1, APPENDIX - C-l Density of Emulsion versus ~ Curve 1 - Butyl benzoate/33% aqueous glycerine Curve 2 - Butyl benzoate/22% aqueous glycerine
151 lo e-.. oz u <t' 0:: LL w :E ::>...J 8~ lw/wd 'AliSN30
152 llo a series of emulsions were found to yield cj.._ 0 values hi.gher than the calculated ones. Such positive deviation in a series of emulsions containing glycerine in the dispersion medium, were found to decrease with decreasing emulsifier concentrations. In Fig. 2, three reduced viscosity - ~ plots at three concentrations of the emulsifier are given where the continuous phase had similar amounts of glycerine. As the emulsifier concentration was decreased the measured and calculated values approached closer. The d.. 0 values at zero emulsifier concentration were dete~ned from a plot of o( 0 measured versus per cent emulsifier and by extrapolation to zero concentration. Fig. 3 shows these plots. The concentrations of the emulsifier also affected the values of o(l and the limiting values at zero emulsifier concentration were similarly determined. While these extrapolations were not very satisfactory, the general trend is nevertheless clearly shown in Fig. (d) Addition of CaC1 2 to emulsions containing anionic emulsifier As pointed out earlier additi on of small amounts of CaC1 2 to the emulsions containing an anionic emulsifier increased the viscosity sharply to a maximum followed by a drop. In spite of the emulsion being diluted by the CaC1 2 solution, as shown in Fig. 5, the viscosity increased and after reaching a maximum value rapidly fell. The value of ~ 0 was also increased by CaC1 2 to different extents depending on the amount of the electrolyte added. After attaining its maximum value, cj. dropped. 0 The behavi our is shown in Fig. 6.
153 FIG. 2, APPENDIX - C-l Emulsions* deviating from Taylor's Equation (Effect of emulsifier concentration) Reduced viscosity ~ f(j Line 1-1% Tween 20 rf.. o meas. câo cale. = Line 2-0.5% Tween 20 d... o meas. = Line % Tween 20 d.. o cale. d-o meas. d..o cale. = * Butyl benzoate/ aqueous glycerine ( 45%) + Tween 20
154 0 (\J. ~ 0 ~ 0 l{) ~ 0 (\J d 0 1{) -. q to Q. 10 v 0.. ~ -e- 0-e "1) rt') C\J \ \ \ \ \ \ \ \ \ \ \ \ \ \ \ \ q C\J \ \ \ \ \ \ \ \ 1{) 0 loo.
155 :11_2 FIG. 3, APPENDIX - C-1 Effect of Emul.sifier Concentration on d.. 0 Butyl benzoate/aqueous glycerine + Tween 20 Curve 1 - Butyl benzoate/45% glycerine solution Curve 2 - Butyl benzoate/22% glycerine solution Curve 3 - Butyl ienzoate/33% glycerine solution
156 C\J 0. L() 0. 0:: L&.J lj... ēn..j ::::> ~ L&.J ~ 0 ~~--~~~----~--~~--~~LOo ll1 Q. C\J C\J soaw 0 rj
157 FIG. 4, APPENDIX - C-l Effect of Emulsifier on the Interaction Coefficient, ô. 1 d. 1 versus % emulsifier Curve 1 - Butyl benzoate/45% aqueous glycerine Curve 2 - Butyl benzoate/22% aqueous glycerine Curve 3 - Butyl benzoate/33% aqueous glycerine
158 f'() C\J- - a: LLJ LL en _J ::::> ~ LLJ l{) 0 ~ 0 0 m 0. <.0 - Li 0
159 FIG. 5, APPENDIX - C-1 Effect of CaC~ on Emulsion Viscosity Eff1ux time versus ~ Butyl benzoate/water % G-3300 (anionic emulsifier). The numbers 1, and 4 refer to the following initial volume fraction of the emulsion containing n2 CaC1 2 No. Initial ~ (per cent)
160 2 Cl) z 0 [J (.) [J ~ lool-. 1 p ~96... w ~ -1- x 3 --'~1 LL on LL w D n [] D [J [] VOLUME FRACTION, cp
161 FIG. 6, APPENDIX - G-1 Effect of CaC1 2 on Intrinsic Viscosity, d.. 0 cj.. 0 versus vol. CaC~ added open circles - directly measured values solid circles - interpolated values
162 v d l'() d (\J d d ~ E,. - ~ 0 d -N, 0 0 (.) _J 0 > 0 0
163 1_1.6 (e) Variation of interracial film 'viscosity' with emul.sifier concentration The emulsions containing glycerine in the continuons medium and Tween 20 as the emulsifier, deviated from Taylor's equation indicating that the effective viscosity of the disperse phase drop was higher than the true viscosity due to the formation of a viscous film at the interface. From the recent extension of Taylor's theory by Oldroyd to account for the presence of such viscous interfacial film, the sum of the shear viscosity and the two-dimensional area viscosity has been calculated and its variation with emulsifier concentration is graphically represented in Fig. 7. As expected, the sum (2C + 3 o), becomes zero at zero emulsifier concentration since in this case the emulsion obeyed Taylor's theory. (f) Variation of cj- 1 with d 0 It was observed during the present investigation that the interaction coefficient ~l was not a constant but varied systematically with change in the value of (;1.. 0 The directly measured values of d.. 0 and oc, 1 together with the extrapolated values from Figs. 3 and 4 are shown in Fig. 8 as a linear plot of log 10 t'âl versus ~ 2 The three points shown as half circles refer to solid spheres and are taken from the literature. It is found that the value of o< for solid spheres, predicted from emulsion 1 viscosity, are in very good agreement with the recent measurements. (Table VII, Part III).
164 tl7 FIG. 7, APPENDIX - C-l Two dimensional shear and area viscosity parameter (21; +.3o) vs. per cent emulsifier Effect of emulsifier concentration (Tween 20) Curve 1 - Butyl benzoate/45% aqueous glycerine Curve 2 - Butyl benzoate/33% aqueous glycerine Curve.3 - Butyl benzoate/22% aqueous glycerine
165 () Q) (/) E 0'1 v"' b r<> + J...J) C\J - 04 )( /o EMULSIFIER 1.0
166 1_1_8 FIG. 8, APPENDIX - C-l Emulsions Obeying Tqlor' s Theory Log cj.. 1 versus d. 0 2 open circles - directj.y œasured values solid circle s - extrapolated values half circle s - literature valœ s on solid spheres (Table VII, Part III) Empirical relati onship - d e 0 53 cxo 2
167
168 (g) Viscosity and surface tension of emulsifier solutions 1_:t9 To investigate the reduction in viscosity of the continuous medium in an emulsion due to adsorption of the emulsifier on the particles, it was necessary to measure the viscosity of emulsifier solutions at the concentration range used in preparing the emulsions (Part III-2). These 10 measurements are shown in Fig. ~. Surface tensions of the emulsifier solutions were also measured by capillary rise method to determine the q critical micelle concentration. Fig. lo shows these measurements. It may be noted that the viscosities of the emulsifier solutions increased continuously after the CMC without showing any noticeable break.
169 1.20 FIG. 9, APPENDIX - C-l Surface Tension of Water Containing Emulsifiers Curve 1 - G-3300, anionic Curve 2 - Tween 20, nonionic
170 45 E (J... Cl) Q) r::::: > "'0... z 0 Cl) 40 z LLJ.._ 35 w. (.) <( LL. 0:: ::> Cl) /o E MU L S 1 F 1 E R
171 :121. FIG. 10, APPENDIX - C-1 Viscosity of Water Containing Emulsifiers Curve 1 - G-3300, anionic Curve 2 - Tween 20, nonionic
172 . o. (.).. >-... Cl) 0 (.) Cl) > Ofo E M U L S 1 F 1 E R
173 APPENDIX - c-2 THE HYDROPHILE-LYOPHilE BALANCE (HIB): A Note on Emulsion For.mulation
174 1.22 APPENDIX - C-2 The Bydrophile-~ophile Balance: (HLB) A Note on Emulsion Formulation There is no general principle of predicting the stability of a particular emulsion foi'ilulation. Partly by trial and partly by the intuition of the investigator, the desired stability of an emulsion may be achieved but often after long series of failures. However 1 recently a scheme of classification of the surface active agents has been proposed which can serve as a guide. MOst emulsifiers have one characteristic in common: they have both a hydrophilic and a lyophilic group. The HLB system of choosing an emulsifier is based on the balance between the aydrophile and the lyophile portions in the molecule, i.e. how much the molecule as a whole is hydrophilic or lyophilic. Numerical values are assigned to every emulsif- 1er on a semi-empirical basis. The higher the HLB number the more hydrophilic it is and the more suitable will it be for oil/water emulsions. On the other hand, the lower the number the more lyophilic the emulsifier and bence the more suitable it is for stabilizing water/oil emulsions. Usually the numbers vary from 1 to 20 1 but may be as high as 30. For oil/ water emulsions, emulsifiers having HLB values from about 10 to 16 are usually found suitable whereas for water/oil emulsions, emulsifiers of lower HLB numbers are employed. The HLB classification thus acts as a guide to emulsion formulation and was consequently employed in the
175 ~23 present investigation. The HLB numbers of the two emulsifiers used, Tween 20 and G-3300, were 11.7 and 16.7 respectively and were supplied by the Atlas Powder Co. Brantford, Canada, along with the stated HLB numbers. It should, however, be pointed out that the choosing of the emulsifiers was only the first step. Several emulsions having the same disperse phase concentration but varying proportions of the emulsifiers were prepared by shaking and were allowed to stand for an arbitrary period of three hours. From this series, the suitable concentration of the emulsifiers for the particular oil/water system was chosen according to the degree of stability or the emulsions. The actual concentrations or the emulsifiers in the emulsions, prepared by electrical atomization, were, however, lower for reasons discussed in Part II.
176 APPENDIX - ~1 THE DRAGE VISCOMETER
177 APPENDIX- D-l THE DRAGE STRUCTURE VISCOMETER The rotational type viscometer in which the viscosity of the suspensions of rayon fibres was measured (Part IV - 2) is shown in Fig. 1. Within the outer supporting frame H, there is a freely suspended synchronous motor, gears and bearings G. The motor turns the spindle K which is connected to the measuring bob (inner cylinder) M through the coupling L. The liquid under test is placed in the annular gap between the bob M and eup N (outer cylinder). On starting the motor the bob rotates and depending on the viscosity of the liquid, a greater or lesser friction is exerted on the bob. The tviscous drag' is transmitted to the.freel.y suspended motor, the movement of which is opposed by a calibrated spring E. The motor is de.flected from its initial position until an equilibrium is reached between the resistance encountered by the bob and the counter-force resulting.from the tension of the spring. The pointer C which is attached to the torque-reactive motor continuously indicates the de.flection.from its 'zero point' and can be read directly.from the visible dial D. The viscosity is there.fore easily calculated from the simple relationship: = L = ~~)x constant G 2~R2/(R 2 - r 2 ) where! 1 is the scale reading, ~ a correction for the scale reading, ~ the angular velocity of inner rotating cylinder and R, r are the radii of
178 :125 FIG. 1, Appendix D-1 Drage Structural Viscometer A Suspending wire B Cover c Pointer D Di al E Spring ( calibrated) F Speed control G Mo tor, gears and bea rings H Supporting frame K Spindle L Coup ling N Measuring eup M Measuring bob
179 -G " F H K L - M N
180 :t26 the outer and the inner cylinders respectively. For any particular eup and bob R and r are constants so that at aqy shear rate relative viscosity is obtained by the simple formula: T)r where Ki ' and ~ are the scale readings for the suspension and the continuous medium respectively. The 'constant' and ~ were supplied with the instrument. However the given value of the correction term K 2, which arises because the spring was deliberately set to bave a slight tension corresponding to a scale reading of zero, was found to be erroneous. K 2 was therefore determined from a plot of scale reading versus the R.P.M. or the shear rate using various liquida, e.g. sugar solution, glycerin, corn syrup, hydrocarbon oil and castor oil. Excellent linear relationships were obtained for all cases giving an intercept of -2.0 for the two eup and bob assemblies, the intercepta being calculated by the method of least squares. Fig. 2 representa same of the lines obtained. The viscosity of castor oil was independently measured b.1 the falling-ball method and agreed well with those obtained by using the K2 value from Fig. 2. In all subsequent calculations, therefore, the experimentally found value of K 2 was employed. The viscometer is equipped with a speed control deviee F by which three different speeds of rotation can be obtained thereby allowing viscosity measurements at three different shear rates with the same eup
181 î27 FIG. 2, Appendix D-l Determination of K2 (correction for scale reading) Scale Reading versus Shear Rate Line 1 - Castor oil Line 2 - Sugar solution Line 3 - ijydrocarbon oil Line 4 - ijydrocarbon oil
182 80 (!) z c <t UJ a:: 60 UJ 40...J <t (.) Cl) SHEAR RATE,Sec- 1
183 and bob. The measuring eup N, which fits into a strong support (not shown in the diagram), was immersed in a thermostat maintained at a temperature of 25 ±.005, at which all measurements were carried out.
184 APPENDIX - D-2 PREPARATION OF SAMPLES OF RAYON FIBRES
185 j_29 APPENDIX - D-2 PREPARATION OF SAMPLES OF RAYON FIBRES Each thread of the r~on fibres, consisting of about 1000 individual filaments was mounted carefully to avoid twisting in a mounting frame consisting of a series of strong nails. The frame is shown in Fig. 1. The nails were securel.y fixed on two solid metal blocks which were permanentl.y fixed to the box-like base such that the tension of the threads after winding did not cause the nails to bend. The nails had uniformly spaced grooves so that the threads could be twined around in parallel positions to each other which, if not maintained, increased polydispersity in the microtomed samples. After winding around an appropriate amount of fibre, usuall.y about one gm., the mounting frame was put in a metal trough and molten tissuernat free from any suspended material was poured in. Air bubbles entrapped in the fibres were carefully and completely removed by gently pressing with blunt glass rod. If this was not done, the section of fibres containing the air bubbles in the solidified wax could not be properly sliced in the microtome. The wax block was eut to an appropriate size and finally eut to desired length in a microtome. A commercial sliding microtome was used for lengths below and for longer lengths, a hand microtome was employed. The slices were dissolved in large volumes of hot xylene and filtered under suction in a sintered funnel and the residual fibres washed several times with hot xylene. The fibres were redispersed in
186 FIG. 1, APPENDIX - D-2 Frame for mounting rayon threads
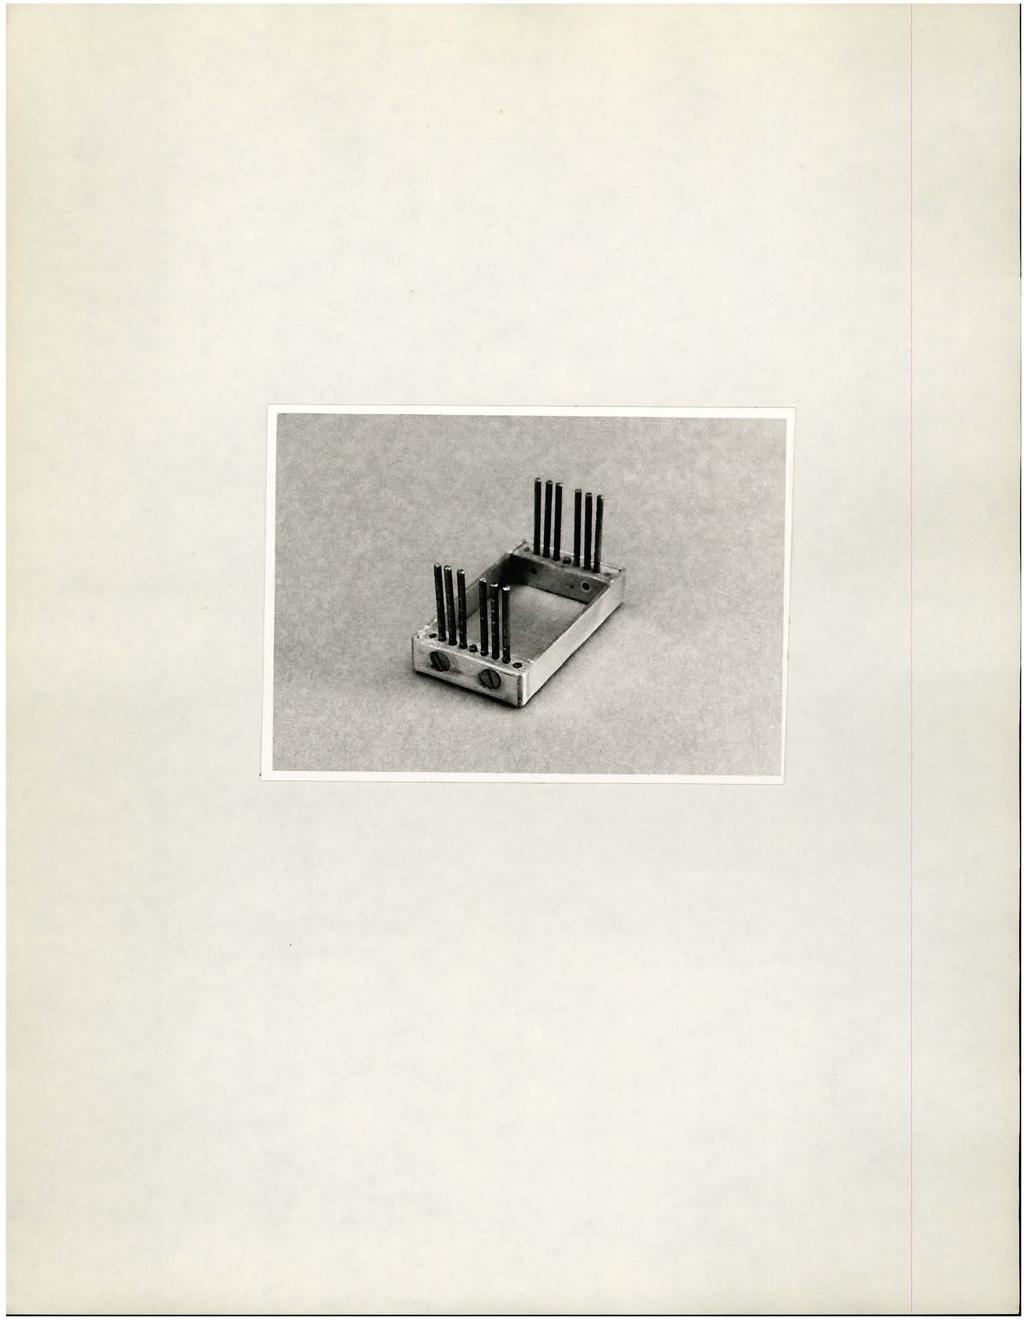
187
Contents. Preface XIII. 1 General Introduction 1 References 6
 VII Contents Preface XIII 1 General Introduction 1 References 6 2 Interparticle Interactions and Their Combination 7 2.1 Hard-Sphere Interaction 7 2.2 Soft or Electrostatic Interaction 7 2.3 Steric Interaction
Pharmaceutics I صيدالنيات 1. Unit 6
 Pharmaceutics I صيدالنيات 1 Unit 6 1 Rheology of suspensions Rheology, the study of flow, addresses the viscosity characteristics of powders, fluids, and semisolids. Materials are divided into two general
Pharmaceutics I. Unit 6 Rheology of suspensions
 Pharmaceutics I اينالديصيدلينيات 1 Unit 6 Rheology of suspensions 1 Rheology, the science of the flow or deformation of matter (liquid or soft solid) under the effect of an applied force. It addresses
AGITATION AND AERATION
 AGITATION AND AERATION Although in many aerobic cultures, gas sparging provides the method for both mixing and aeration - it is important that these two aspects of fermenter design be considered separately.
Foundations of. Colloid Science SECOND EDITION. Robert J. Hunter. School of Chemistry University of Sydney OXPORD UNIVERSITY PRESS
 Foundations of Colloid Science SECOND EDITION Robert J. Hunter School of Chemistry University of Sydney OXPORD UNIVERSITY PRESS CONTENTS 1 NATURE OF COLLOIDAL DISPERSIONS 1.1 Introduction 1 1.2 Technological
Measurement of Interfacial Tension from the Shape of a Rotating Drop 1
 Journal of Colloid and Interface Science 23, 99-107 (1967) Measurement of Interfacial Tension from the Shape of a Rotating Drop 1 H. M. PRINCEN, I. Y. Z. ZIA, AND S. G. MASON Pulp and Paper Research Institute
Particle size analysis -Chapter 3
 Particle size analysis -Chapter 3 Importance of PSA Size and hence surface area of particles affect: The rate of drug dissolution and release from dosage forms Flow properties of granules and powders.
Contents. Preface XIII
 V Contents Preface XIII 1 General Introduction 1 1.1 Fundamental Knowledge Required for Successful Dispersion of Powders into Liquids 1 1.1.1 Wetting of Powder into Liquid 1 1.1.2 Breaking of Aggregates
Contents. Preface XI Symbols and Abbreviations XIII. 1 Introduction 1
 V Contents Preface XI Symbols and Abbreviations XIII 1 Introduction 1 2 Van der Waals Forces 5 2.1 Van der Waals Forces Between Molecules 5 2.1.1 Coulomb Interaction 5 2.1.2 Monopole Dipole Interaction
Lecture 7. Rheology. Hamid Alghurabi. Assistant Lecturer in Pharmaceutics
 Physical Pharmacy Lecture 7 Rheology Assistant Lecturer in Pharmaceutics Overview Types of flow Newtonian systems Non-Newtonian systems Thixotropy Definition Applications in formulations Determination
Preparation and Characterization of Oil-in-Water and Water-in-Oil Emulsions. Prepared. For
 1 Preparation and Characterization of Oil-in-Water and Water-in-Oil Emulsions Prepared For Dr. Reza Foudazi, Ph.D. Chemical and Materials Engineering New Mexico State University By Muchu Zhou May 10, 2016
DEVELOPMENT OF AN EFFECTIVE VISCOSITY MODEL FOR NANO- AND MICROPARTICLE SUSPENSIONS. Jon Langston. Submitted in partial fulfillment of the
 DEVELOPMENT OF AN EFFECTIVE VISCOSITY MODEL FOR NANO- AND MICROPARTICLE SUSPENSIONS by Jon Langston Submitted in partial fulfillment of the requirements for Departmental Honors in the Department of Engineering
Contents. I Introduction 1. Preface. xiii
 Contents Preface xiii I Introduction 1 1 Continuous matter 3 1.1 Molecules................................ 4 1.2 The continuum approximation.................... 6 1.3 Newtonian mechanics.........................
Table of Contents. Preface... xiii
 Preface... xiii PART I. ELEMENTS IN FLUID MECHANICS... 1 Chapter 1. Local Equations of Fluid Mechanics... 3 1.1. Forces, stress tensor, and pressure... 4 1.2. Navier Stokes equations in Cartesian coordinates...
MODELING ON THE BREAKUP OF VISCO-ELASTIC LIQUID FOR EFFERVESCENT ATOMIZATION
 1446 THERMAL SCIENCE, Year 2012, Vol. 16, No. 5, pp. 1446-1450 MODELING ON THE BREAKUP OF VISCO-ELASTIC LIQUID FOR EFFERVESCENT ATOMIZATION by Li-Juan QIAN * China Jiliang University, Hangzhou, China Short
Emulsion Processing - Homogenization -
 Emulsion Processing - Homogenization - Jochen Weiss *Food Structure and Functionality Laboratories Department of Food Science & Biotechnology University of Hohenheim Garbenstrasse 21, 70599 Stuttgart,
(2.1) Is often expressed using a dimensionless drag coefficient:
 Is often expressed using a dimensionless drag coefficient:") 1. Introduction Multiphase materials occur in many fields of natural and engineering science, industry, and daily life. Biological materials such as blood or cell suspensions, pharmaceutical or food products,
1. Introduction Multiphase materials occur in many fields of natural and engineering science, industry, and daily life. Biological materials such as blood or cell suspensions, pharmaceutical or food products,
Introduction to Marine Hydrodynamics
 1896 1920 1987 2006 Introduction to Marine Hydrodynamics (NA235) Department of Naval Architecture and Ocean Engineering School of Naval Architecture, Ocean & Civil Engineering First Assignment The first
Mohamed Daoud Claudine E.Williams Editors. Soft Matter Physics. With 177 Figures, 16 of them in colour
 Mohamed Daoud Claudine E.Williams Editors Soft Matter Physics With 177 Figures, 16 of them in colour Contents 1. Droplets: CapiUarity and Wetting 1 By F. Brochard-Wyart (With 35 figures) 1.1 Introduction
RHEOLOGY Principles, Measurements, and Applications. Christopher W. Macosko
 RHEOLOGY Principles, Measurements, and Applications I -56081-5'79~5 1994 VCH Publishers. Inc. New York Part I. CONSTITUTIVE RELATIONS 1 1 l Elastic Solid 5 1.1 Introduction 5 1.2 The Stress Tensor 8 1.2.1
Applied Surfactants: Principles and Applications
 Applied Surfactants: Principles and Applications Tadros, Tharwat F. ISBN-13: 9783527306299 Table of Contents Preface. 1 Introduction. 1.1 General Classification of Surface Active Agents. 1.2 Anionic Surfactants.
KEMS448 Physical Chemistry Advanced Laboratory Work. Viscosity: Determining the Molecular Mass of Polyvinyl Alcohol
 KEMS448 Physical Chemistry Advanced Laboratory Work Viscosity: Determining the Molecular Mass of Polyvinyl Alcohol 1 Introduction The internal friction in fluids, or viscosity, is caused by the cohesion
Lecture 7: Rheology and milli microfluidic
 1 and milli microfluidic Introduction In this chapter, we come back to the notion of viscosity, introduced in its simplest form in the chapter 2. We saw that the deformation of a Newtonian fluid under
Mechanical properties of polymers: an overview. Suryasarathi Bose Dept. of Materials Engineering, IISc, Bangalore
 Mechanical properties of polymers: an overview Suryasarathi Bose Dept. of Materials Engineering, IISc, Bangalore UGC-NRCM Summer School on Mechanical Property Characterization- June 2012 Overview of polymer
Class XI Physics Syllabus One Paper Three Hours Max Marks: 70
 Class XI Physics Syllabus 2013 One Paper Three Hours Max Marks: 70 Class XI Weightage Unit I Physical World & Measurement 03 Unit II Kinematics 10 Unit III Laws of Motion 10 Unit IV Work, Energy & Power
CHEMISTRY PHYSICAL. of FOODS INTRODUCTION TO THE. CRC Press. Translated by Jonathan Rhoades. Taylor & Francis Croup
 Christos Ritzoulis Translated by Jonathan Rhoades INTRODUCTION TO THE PHYSICAL CHEMISTRY of FOODS CRC Press Taylor & Francis Croup Boca Raton London NewYork CRC Press is an imprint of the Taylor & Francis
Viscosity of magmas containing highly deformable bubbles
 Journal of Volcanology and Geothermal Research 105 (2001) 19±24 www.elsevier.nl/locate/jvolgeores Viscosity of magmas containing highly deformable bubbles M. Manga a, *, M. Loewenberg b a Department of
Colloidal Suspension Rheology Chapter 1 Study Questions
 Colloidal Suspension Rheology Chapter 1 Study Questions 1. What forces act on a single colloidal particle suspended in a flowing fluid? Discuss the dependence of these forces on particle radius. 2. What
ANALYSIS OF LOW DENSITY PARTICLES USING DIFFERENTIAL CENTRIFUGAL SEDIMENTATION
 ANALYSIS OF LOW DENSITY PARTICLES USING DIFFERENTIAL CENTRIFUGAL SEDIMENTATION Conventional Centrifugal Methods Centrifugal sedimentation of particles suspended in a fluid is a well known method (1, 2)
Chapter 7. Pickering Stabilisation ABSTRACT
 Chapter 7 Pickering Stabilisation ABSTRACT In this chapter we investigate the interfacial properties of Pickering emulsions. Based upon findings that indicate these emulsions to be thermodynamically stable,
Boundary Conditions in Fluid Mechanics
 Boundary Conditions in Fluid Mechanics R. Shankar Subramanian Department of Chemical and Biomolecular Engineering Clarkson University The governing equations for the velocity and pressure fields are partial
Interfacial tension, measurement, effect of surfactant on oil/water interface
 Interfacial tension, measurement, effect of surfactant on oil/water interface infusion mounting, solutions prepared from Na-oleate (M = 304,5), NaDS (Na dodecyl sulfate, M=288,4), NaDBS (Na dodecyl benzene
Pharmaceutical compounding I Colloidal and Surface-Chemical Aspects of Dosage Forms Dr. rer. nat. Rebaz H. Ali
 University of Sulaimani School of Pharmacy Dept. of Pharmaceutics Pharmaceutical Compounding Pharmaceutical compounding I Colloidal and Surface-Chemical Aspects of Dosage Forms Dr. rer. nat. Rebaz H. Ali
We may have a general idea that a solid is hard and a fluid is soft. This is not satisfactory from
 Chapter 1. Introduction 1.1 Some Characteristics of Fluids We may have a general idea that a solid is hard and a fluid is soft. This is not satisfactory from scientific or engineering point of view. In
 Studies on the Coalescence o f Liqu Title Influence of the Polarizing Potenti Phases in Aqueous Solutions (Commem to Professor Rempei Gotoh On the Oc Author(s) Matsumoto, Mutsuo Citation Bulletin of the
COLLOIDAL STATE. INTRODUCTION: Thomas Graham originally classified all substances in two
 COLLOIDAL STATE INTRODUCTION: Thomas Graham originally classified all substances in two group- 1. Crystalloids: These substances can easily be obtained in the crystalline from and their solution can diffused
Physics 3 Summer 1990 Lab 7 - Hydrodynamics
 Physics 3 Summer 1990 Lab 7 - Hydrodynamics Theory Consider an ideal liquid, one which is incompressible and which has no internal friction, flowing through pipe of varying cross section as shown in figure
::: Application Report
 Interfacial Shear Rheology of Coffee Samples Explore the secrets of a perfect crema! This application report presents typical measurements on the film formation and on the interfacial rheological properties
Supplementary table I. Table of contact angles of the different solutions on the surfaces used here. Supplementary Notes
 1 Supplementary Figure 1. Sketch of the experimental setup (not to scale) : it consists of a thin mylar sheet (0, 02 4 3cm 3 ) held fixed vertically. The spacing y 0 between the glass plate and the upper
On the effects of Non-Newtonian fluids above the ribbing instability
 On the effects of Non-Newtonian fluids above the ribbing instability L. Pauchard, F. Varela LÓpez*, M. Rosen*, C. Allain, P. Perrot** and M. Rabaud Laboratoire FAST, Bât. 502, Campus Universitaire, 91405
Overview. Lecture 5 Colloidal Dispersions
 Physical Pharmacy Lecture 5 Colloidal Dispersions Assistant Lecturer in Pharmaceutics Overview Dispersed Systems Classification Colloidal Systems Properties of Colloids Optical Properties Kinetic Properties
SOLUTIONS TO CHAPTER 5: COLLOIDS AND FINE PARTICLES
 SOLUTIONS TO CHAPTER 5: COLLOIDS AND FINE PARTICLES EXERCISE 5.1: Colloidal particles may be either dispersed or aggregated. (a) What causes the difference between these two cases? Answer in terms of interparticle
Capillarity and Wetting Phenomena
 ? Pierre-Gilles de Gennes Frangoise Brochard-Wyart David Quere Capillarity and Wetting Phenomena Drops, Bubbles, Pearls, Waves Translated by Axel Reisinger With 177 Figures Springer Springer New York Berlin
EXPERIMENT 2-6. e/m OF THE ELECTRON GENERAL DISCUSSION
 Columbia Physics: Lab -6 (ver. 10) 1 EXPERMENT -6 e/m OF THE ELECTRON GENERAL DSCUSSON The "discovery" of the electron by J. J. Thomson in 1897 refers to the experiment in which it was shown that "cathode
Interfacial Shear Rheology of Films Formed by Coffee
 ANNUAL TRANSACTIONS OF THE NORDIC RHEOLOGY SOCIETY, VOL. 16, 2008 Interfacial Shear Rheology of Films Formed by Coffee Patrick Heyer, Jörg Läuger Anton Paar Germany GmbH, Helmuth-Hirth-Strasse 6, 73760
Rotational viscometers
 42 Non-Newtonian Flow in the Process Industries Rotational viscometers Due to their relative importance as tools for the rheological characterisation of non-newtonian fluid behaviour, we concentrate on
CHAPTER 4 THERMAL CONDUCTIVITY AND VISCOSITY MEASUREMENTS
 50 CHAPTER 4 THERMAL CONDUCTIVITY AND VISCOSITY MEASUREMENTS 4.1 INTRODUCTION In the development of any energy-efficient heat transfer fluids for enhanced heat transfer performance, in practical applications,
Chapter 1 Introduction
 Chapter 1 Introduction This thesis is concerned with the behaviour of polymers in flow. Both polymers in solutions and polymer melts will be discussed. The field of research that studies the flow behaviour
CENG 501 Examination Problem: Estimation of Viscosity with a Falling - Cylinder Viscometer
 CENG 501 Examination Problem: Estimation of Viscosity with a Falling - Cylinder Viscometer You are assigned to design a fallingcylinder viscometer to measure the viscosity of Newtonian liquids. A schematic
ISO Colloidal systems Methods for zetapotential. Part 1: Electroacoustic and electrokinetic phenomena
 INTERNATIONAL STANDARD ISO 13099-1 First edition 2012-06-15 Colloidal systems Methods for zetapotential determination Part 1: Electroacoustic and electrokinetic phenomena Systèmes colloïdaux Méthodes de
MEASUREMENT OF VISCOSITY OF LIQUID
 MEASUREMENT OF VISCOSITY OF LIQUID Objectives: To measure the viscosity of sample liquids. Apparatus: (i) Glass tube (ii)steel balls, (iii) Retort stand and clamps, (iv) Weighing balance, (v) Screw gauge,
Capillary Phenomena in Assemblies of Parallel Cylinders
 Capillary Phenomena in Assemblies of Parallel Cylinders I. Capillary Rise between Two Cylinders H. M. PRINCEN Lever Brothers Company, Research and Development Division, Edgewater, New Jersey 07020 Received
DIVIDED SYLLABUS ( ) - CLASS XI PHYSICS (CODE 042) COURSE STRUCTURE APRIL
 - CLASS XI PHYSICS (CODE 042) COURSE STRUCTURE APRIL") DIVIDED SYLLABUS (2015-16 ) - CLASS XI PHYSICS (CODE 042) COURSE STRUCTURE APRIL Unit I: Physical World and Measurement Physics Need for measurement: Units of measurement; systems of units; SI units, fundamental
DIVIDED SYLLABUS (2015-16 ) - CLASS XI PHYSICS (CODE 042) COURSE STRUCTURE APRIL Unit I: Physical World and Measurement Physics Need for measurement: Units of measurement; systems of units; SI units, fundamental
Principles of Convective Heat Transfer
 Massoud Kaviany Principles of Convective Heat Transfer Second Edition With 378 Figures Springer Contents Series Preface Preface to the Second Edition Preface to the First Edition Acknowledgments vii ix
PhysicsAndMathsTutor.com 1
 PhysicsAndMathsTutor.com 1 1. Millikan determined the charge on individual oil droplets using an arrangement as represented in the diagram. The plate voltage necessary to hold a charged droplet stationary
429 LIGHT DIFFRACTION MEASUREMENT OF PARTICLE SIZE
 Search USP29 429 LIGHT DIFFRACTION MEASUREMENT OF PARTICLE SIZE Light diffraction is one of the most widely used techniques for measuring the size of a wide range of particles from very fine to very coarse.
Interfacial dynamics
 Interfacial dynamics Interfacial dynamics = dynamic processes at fluid interfaces upon their deformation Interfacial rheological properties: elasticity, viscosity, yield stress, Relation between macroscopic
Micromechanics of Colloidal Suspensions: Dynamics of shear-induced aggregation
 : Dynamics of shear-induced aggregation G. Frungieri, J. Debona, M. Vanni Politecnico di Torino Dept. of Applied Science and Technology Lagrangian transport: from complex flows to complex fluids Lecce,
CITY UNIVERSITY OF HONG KONG. Theoretical Study of Electronic and Electrical Properties of Silicon Nanowires
 CITY UNIVERSITY OF HONG KONG Ë Theoretical Study of Electronic and Electrical Properties of Silicon Nanowires u Ä öä ªqk u{ Submitted to Department of Physics and Materials Science gkö y in Partial Fulfillment
PHYSICS. Course Structure. Unit Topics Marks. Physical World and Measurement. 1 Physical World. 2 Units and Measurements.
 PHYSICS Course Structure Unit Topics Marks I Physical World and Measurement 1 Physical World 2 Units and Measurements II Kinematics 3 Motion in a Straight Line 23 4 Motion in a Plane III Laws of Motion
Lecture 3. Properties of Fluids 11/01/2017. There are thermodynamic properties of fluids like:
 11/01/2017 Lecture 3 Properties of Fluids There are thermodynamic properties of fluids like: Pressure, p (N/m 2 ) or [ML -1 T -2 ], Density, ρ (kg/m 3 ) or [ML -3 ], Specific weight, γ = ρg (N/m 3 ) or
Universal Viscosity Curve Theory
 TM Universal Viscosity Curve Theory Turbine Flow Meters and Flow Viscosity Introduction Like any transducer, a turbine flow meter is sensitive to physical parameters other than the one which is of interest.
CHAPTER 1 Fluids and their Properties
 FLUID MECHANICS Gaza CHAPTER 1 Fluids and their Properties Dr. Khalil Mahmoud ALASTAL Objectives of this Chapter: Define the nature of a fluid. Show where fluid mechanics concepts are common with those
Polymers Reactions and Polymers Production (3 rd cycle)
") EQ, Q, DEQuim, DQuim nd semester 017/018, IST-UL Science and Technology of Polymers ( nd cycle) Polymers Reactions and Polymers Production (3 rd cycle) Lecture 5 Viscosity easurements of the viscosity
EQ, Q, DEQuim, DQuim nd semester 017/018, IST-UL Science and Technology of Polymers ( nd cycle) Polymers Reactions and Polymers Production (3 rd cycle) Lecture 5 Viscosity easurements of the viscosity
Modern Aspects of Emulsion Science
 Modern Aspects of Emulsion Science Edited by Bernard P. Binks Department of Chemistry, University ofhull, UK THE ROYAL SOCIETY OF CHEMISTRY Information Services Chapter 1 Emulsions - Recent Advances in
Contents XVII. Preface
 V Preface XVII 1 General Introduction 1 1.1 Suspensions 1 1.2 Latexes 2 1.3 Emulsions 2 1.4 Suspoemulsions 3 1.5 Multiple Emulsions 3 1.6 Nanosuspensions 4 1.7 Nanoemulsions 4 1.8 Microemulsions 5 1.9
MECHANICAL CHARACTERISTICS OF STARCH BASED ELECTRORHEOLOGICAL FLUIDS
 8 th International Machine Design and Production Conference 427 September 9-11, 1998 Ankara TURKEY ABSTRACT MECHANICAL CHARACTERISTICS OF STARCH BASED ELECTRORHEOLOGICAL FLUIDS E. R. TOPCU * and S. KAPUCU
Mr.N.Srikar M.Pharm.,(Ph.D) KRISHNA TEJA PHARMACY COLLEGE
 KRISHNA TEJA PHARMACY COLLEGE") . Mr.N.Srikar M.Pharm.,(Ph.D) KRISHNA TEJA PHARMACY COLLEGE CONTENTS Introduction Definition Importance Newton's laws Types of flow Viscosity Measurements of viscosity Pharmaceutical applications 2 INTRODUCTION
. Mr.N.Srikar M.Pharm.,(Ph.D) KRISHNA TEJA PHARMACY COLLEGE CONTENTS Introduction Definition Importance Newton's laws Types of flow Viscosity Measurements of viscosity Pharmaceutical applications 2 INTRODUCTION
Figure 3: Problem 7. (a) 0.9 m (b) 1.8 m (c) 2.7 m (d) 3.6 m
 0.9 m (b) 1.8 m (c) 2.7 m (d) 3.6 m") 1. For the manometer shown in figure 1, if the absolute pressure at point A is 1.013 10 5 Pa, the absolute pressure at point B is (ρ water =10 3 kg/m 3, ρ Hg =13.56 10 3 kg/m 3, ρ oil = 800kg/m 3 ): (a)
1. For the manometer shown in figure 1, if the absolute pressure at point A is 1.013 10 5 Pa, the absolute pressure at point B is (ρ water =10 3 kg/m 3, ρ Hg =13.56 10 3 kg/m 3, ρ oil = 800kg/m 3 ): (a)
Table of Contents. Foreword... xiii. Preface... xv
 Table of Contents Foreword.... xiii Preface... xv Chapter 1. Fundamental Equations, Dimensionless Numbers... 1 1.1. Fundamental equations... 1 1.1.1. Local equations... 1 1.1.2. Integral conservation equations...
CPS Instruments Europe P.O. Box 180, NL-4900 AD Oosterhout, The Netherlands T: +31 (0) F: +31 (0) E:
 F: +31 (0) E:") Introduction to Differential Sedimentation Differential Centrifugal Sedimentation, or DCS (sometimes also called "two-layer" sedimentation) is a widely used analysis method that produces extremely high
Introduction to Differential Sedimentation Differential Centrifugal Sedimentation, or DCS (sometimes also called "two-layer" sedimentation) is a widely used analysis method that produces extremely high
CHAPTER 2 ESTIMATION OF BREAKDOWN VOLTAGES IN SMALL INSULATION GAPS AN EMPIRICAL APPROACH
 17 CHAPTER 2 ESTIMATION OF BREAKDOWN VOLTAGES IN SMALL INSULATION GAPS AN EMPIRICAL APPROACH 2.1 INTRODUCTION Insulation materials of different types viz. gaseous, liquid and solid are used to make the
THE INFLUENCE OF XANTHAN AND CREAMING AND FLOCCULATION OF AN OIL-IN-WATER EMULSION CONTAINING SOY PROTEIN
 Brazilian Journal of Chemical Engineering ISSN 0104-6632 Printed in Brazil Vol. 19, No. 04, pp. 411-417, October - December 2002 THE INFLUENCE OF XANTHAN AND λ-carrageenan ON THE CREAMING AND FLOCCULATION
Chapters 11 and 12: Intermolecular Forces of Liquids and Solids
 1 Chapters 11 and 12: Intermolecular Forces of Liquids and Solids 11.1 A Molecular Comparison of Liquids and Solids The state of matter (Gas, liquid or solid) at a particular temperature and pressure depends
Particle Characterization Laboratories, Inc.
 Analytical services Particle size analysis Dynamic Light Scattering Static Light Scattering Sedimentation Diffraction Zeta Potential Analysis Single Point Titration Isoelectric point determination Aqueous
Colloidal dispersion
 Dispersed Systems Dispersed systems consist of particulate matter, known as the dispersed phase, distributed throughout a continuous or dispersion medium. The dispersed material may range in size from
1.3 Molecular Level Presentation
 1.3.1 Introduction A molecule is the smallest chemical unit of a substance that is capable of stable, independent existence. Not all substances are composed of molecules. Some substances are composed of
MEMORANDUM. To: Dr. Andrew Kean, American Petroleum Institute (API) From: Josh Baida Abel Estrada
 From: Josh Baida Abel Estrada") MEMORANDUM To: Dr. Andrew Kean, American Petroleum Institute (API) akean@calpoly.edu From: Josh Baida Abel Estrada jbaida@calpoly.edu Cesia Cazares cscazare@calpoly.edu Date: October 27, 2015 RE: Viscosity
MEMORANDUM To: Dr. Andrew Kean, American Petroleum Institute (API) akean@calpoly.edu From: Josh Baida Abel Estrada jbaida@calpoly.edu Cesia Cazares cscazare@calpoly.edu Date: October 27, 2015 RE: Viscosity
Performance evaluation of different model mixers by numerical simulation
 Journal of Food Engineering 71 (2005) 295 303 www.elsevier.com/locate/jfoodeng Performance evaluation of different model mixers by numerical simulation Chenxu Yu, Sundaram Gunasekaran * Food and Bioprocess
PROPERTIES OF POLYMERS
 PROPERTIES OF POLYMERS THEIR CORRELATION WITH CHEMICAL STRUCTURE; THEIR NUMERICAL ESTIMATION AND PREDICTION FROM ADDITIVE GROUP CONTRIBUTIONS Third, completely revised edition By D.W. VÄN KREVELEN Professor-Emeritus,
Chapter 6. Neutral droplets in high electric fields as a. source of ions. Introduction to field-induced droplet
 Chapter 6. Neutral droplets in high electric fields as a source of ions. Introduction to field-induced droplet ionization mass spectrometry 6-1 Adapted from Grimm, R. L. and Beauchamp, J. L. J. Phys. Chem.
CHAPTER 3. CONVENTIONAL RHEOMETRY: STATE-OF-THE-ART. briefly introduces conventional rheometers. In sections 3.2 and 3.
 30 CHAPTER 3. CONVENTIONAL RHEOMETRY: STATE-OF-THE-ART This chapter reviews literature on conventional rheometries. Section 3.1 briefly introduces conventional rheometers. In sections 3.2 and 3.3, viscometers
BROWNIAN MOVEMENTS. According to MATTER (Re-examined) Nainan K. Varghese,
 Nainan K. Varghese,") BROWNIAN MOVEMENTS According to MATTER (Re-examined) Nainan K. Varghese, matterdoc@gmail.com http://www.matterdoc.info Abstract: Currently, analyses of Brownian motion are limited to its relevance to other
BROWNIAN MOVEMENTS According to MATTER (Re-examined) Nainan K. Varghese, matterdoc@gmail.com http://www.matterdoc.info Abstract: Currently, analyses of Brownian motion are limited to its relevance to other
Notes on Rubber Friction
 Notes on Rubber Friction 2011 A G Plint Laws of Friction: In dry sliding between a given pair of materials under steady conditions, the coefficient of friction may be almost constant. This is the basis
Interpreting Your PSA Results
 Interpreting Your PSA Results Decoding the Acronyms and Finding Insights Ian Treviranus ian.treviranus@horiba.com www.horiba.com/us/particle Outline The Basics Define Parameters Choose Parameters Interpret
Liquids and solids are essentially incompressible substances and the variation of their density with pressure is usually negligible.
 Properties of Fluids Intensive properties are those that are independent of the mass of a system i.e. temperature, pressure and density. Extensive properties are those whose values depend on the size of
A New Model of Investigating the Electric Field in Dielectric Liquid for Streamer Initiation
 A New Model of Investigating the Electric Field in Dielectric Liquid for Streamer Initiation E A. El-Zein and M. Talaat Electrical Power & Machines Department, Faculty of Engineering, Zagazig University,
Evaluating Pigment Dispersion Quality through Dynamic Oscillation Analysis John Meadows, Surface Specialties - UCB
 Evaluating Pigment Dispersion Quality through Dynamic Oscillation Analysis John Meadows, Surface Specialties - UCB Introduction The value of an ink s performance ultimately hinges on the quality of the
Fundamentals of Rheology Science of Deformation and Flow Homer Jamasbi, Ph.D. Elementis Specialties
 Fundamentals of Rheology Science of Deformation and Flow Homer Jamasbi, Ph.D. Elementis Specialties Introduction Rheology is the study of how materials deform and flow under the influence of external forces.
Aging in laponite water suspensions. P. K. Bhattacharyya Institute for Soldier Nanotechnologies Massachusetts Institute of Technology
 Aging in laponite water suspensions. P. K. Bhattacharyya Institute for Soldier Nanotechnologies Massachusetts Institute of Technology Outline Laponite Basic background. Laponite in suspension Bonn et al.,
In-depth analysis of viscoelastic properties thanks to Microrheology: non-contact rheology
 In-depth analysis of viscoelastic properties thanks to Microrheology: non-contact rheology Application All domains dealing with soft materials (emulsions, suspensions, gels, foams, polymers, etc ) Objective
Fundamentals of Static Electricity
 Fundamentals of Static Electricity Basic Concepts Calculation Methods Guidelines Case Histories Fundamentals of Static Electricity How Do Charges Accumulate? How Do Accumulated Charges Discharge? How Do
 A New Type of Apparatus for Titleunder Large Deformation (Special Stress Is Chemistry, VIII) Author(s) Tamura, Mikio; Kurata, Michio; Osak Yoshiyuki; Kimura, Sinichi Citation Bulletin of the Institute
Sliding Contact Bearings
 Sliding Contact Bearings Classification of Bearings 1. According to the direction of load to be supported. The bearings under this group are classified as: (a) Radial bearings (b) Thrust bearings. In radial
Lecture 5: Macromolecules, polymers and DNA
 1, polymers and DNA Introduction In this lecture, we focus on a subfield of soft matter: macromolecules and more particularly on polymers. As for the previous chapter about surfactants and electro kinetics,
PREFACE. performance of various bearings lubricated with non-newtonian fluids.
 PREFACE The present thesis deals with the theoretical study of lubrication characteristics of bearings with non-newtonian fluids. In these theoretical investigations of the problems, the Mathematical models
Understanding Surfactants and New Methods of Dispersing
 Understanding Surfactants and New Methods of Dispersing Chemists and process engineers far and wide find that their job is commonly a neverending rush to what could be made better. Ideas on how to control
Polymer Rheology. P Sunthar. Department of Chemical Engineering Indian Institute of Technology, Bombay Mumbai , India
 Polymer Rheology P Sunthar Department of Chemical Engineering Indian Institute of Technology, Bombay Mumbai 400076, India P.Sunthar@iitb.ac.in 05 Jan 2010 Introduction Phenomenology Modelling Outline of
UNIT 5 VISCOSITY OF LIQUIDS 5.1 INTRODUCTION. Objectives. Structure
 UNIT 5 VISCOSITY OF LIQUIDS Structure 5.1 Introduction Objectives 5.2 Viscosity of Liquids The Coefficient of Viscosity Units 5.3 Effect of Temperature 5.4 Measurement of the Coefficient of Viscosity Ostwald
Contents. Microfluidics - Jens Ducrée Physics: Laminar and Turbulent Flow 1
 Contents 1. Introduction 2. Fluids 3. Physics of Microfluidic Systems 4. Microfabrication Technologies 5. Flow Control 6. Micropumps 7. Sensors 8. Ink-Jet Technology 9. Liquid Handling 10.Microarrays 11.Microreactors