New advances in using seismic anisotropy, mineral physics and geodynamics to understand deformation in the lowermost mantle
|
|
|
- Sabrina Martin
- 5 years ago
- Views:
Transcription
1 Manuscript (LaTeX) Click here to view linked References New advances in using seismic anisotropy, mineral physics and geodynamics to understand deformation in the lowermost mantle Andy Nowacki,JamesWookey,J-MichaelKendall School of Earth Sciences, University of Bristol, Wills Memorial Building, Queen s Road, Bristol, BS8 1RJ, UK Abstract The D region, which lies in the lowermost few hundred kilometres of themantle,isacentral cog in the Earth s heat engine, influencing convection in the underlying core and overlying mantle. In recent years dense seismic networks have revealed a wealth of information about the seismic properties of this region, which are distinct from those of the mantle above. Here we review observations of seismic anisotropy in this region. In the past it has been assumed that the region exhibits a simple form of transverse isotropy withaverticalsymmetryaxis (VTI anisotropy). We summarise new methodologies for characterising a more general style of anisotropy using observations from a range of azimuths. The observations can be then used to constrain the mineralogy of the region and its style of deformationbyalattice preferred orientation (LPO) of the constituent minerals. Of specific interest is the recent discovery of the stability of the post-perovskite phase in this region, which might explain many enigmatic properties of D.Mantleflowmodelsbasedondensitymodelsderivedfrom global tomographic seismic velocity models can be used to test plausible mineralogies, such as post-perovskite, and their deformation mechanisms. Here weshowhowlinkedpredictions from mineral physics, geodynamical modelling and seismic observations can be used to better constrain the dynamics, mineralogy and physical properties of the lowermost mantle. Keywords: D,lowermostmantle,mantleflow,anisotropy Introduction 1.1. D and the lowermost mantle The primary evidence for stratification of the Earth s interior comes from seismology. For nearly three quarters of a century seismologists have used changes in velocity gradients to map out the concentric shells that constitute the Earth s interior. Some changes are dramatic, like that seen at the core-mantle boundary (CMB), whilst others are more subtle, Corresponding author. address: andy.nowacki@bristol.ac.uk (Andy Nowacki) Preprint submitted to Journal of Geodynamics April 19, 2011
2 like that seen at the base of the lithosphere. Not long after Bullen s (1940) original classification of the lower mantle as the D layer, it became apparent thatthebottomfewhundred kilometres of the mantle were seismically distinct from the bulk of the lower mantle. The lower mantle was split into D the top and D the bottom (Bullen, 1949). Whilst much of the original nomenclature used to label the layers of the Earth has been abandoned, D retains the name given to it over 60 years ago. The D region encompasses a thermal boundary layer between the hot and vigorously convecting outer core and the colder, more slowly convecting mantle. Itmarkstheterminus of downwelling mantle material and the place where upwelling plumesmostprobablyoriginate. It is often bounded by a seismic discontinuity that lies onaverage250kmabovethe CMB (e.g., Wysessionetal.,1998),inmanyplacescontainsultra-lowvelocity zones at its base (e.g., Garneroetal.,1998),andgenerallyexhibitsfine-scalestructure revealed through scattered seismic energy (e.g., Hedlinetal.,1997). Thefocusofthisreviewistheobser- vation and interpretation of seismic anisotropy in this regio: in contrast to the overlying lower mantle, it exhibits significant seismic anisotropy (Meade et al., 1995; Montagner and Kennett, 1996; Panning and Romanowicz, 2006) The implications of these observations are far reaching, as the CMB region plays a fundamental role in the dynamics of the mantle above and the core below. For example, core convection controls the generation of the Earth s magnetic field; mantle convection is the driving force behind plate tectonics. Making sense of the seismicobservationsrequires alinkedanalysisofmineralphysics,geodynamicsandseismology. Here we present recent advances in each of these fields and show how they can be used to constrain the interpretation of measurements of seismic anisotropy Seismic anisotropy Seismic anisotropy the variation of seismic wave speed with direction appearstobe commonplace in the upper- and lowermost mantle (see e.g. Savage, 1999), and is probably present in the inner core (for a review, see Tromp, 2001). Anisotropy may be related to the inherent, wavelength-independent nature of the medium through which a wave travels, such as within the crystal structure of many minerals in the Earth; oritmaybeduetoextrinsic, wavelength-dependent ordering of heterogeneous material, suchassedimentarylayeringin basins. In either case, the propagation of an elastic wave through the medium is described by the elasticity tensor. The elasticity tensor c ijkl gives the relationship between the applied stress σ ij and the resulting strain ɛ kl according to a linear relationship (Hooke s Law σ ij = c ijkl ɛ kl ;forinstance, see Nye, 1985 or Hudson, 1980a). The infinitesimal strain is ɛ kl = 1 ( uk + u ) l, 2 x l x k where u n is displacement and x n is the corresponding cartesian direction. The c ijkl tensor can be reduced by symmetry (σ ij = σ ji )toa6 6matrixusingtheVoigt notation, ij i, kl j, c ijkl C ij, 2
3 Cij = C 11 C 12 C 13 C 14 C 15 C 16 C 22 C 23 C 24 C 25 C 26 C 33 C 34 C 35 C 36 C 44 C 45 C 46 C 55 C 56 C 66 The matrix is symmetrical, hence the lower elements are not shown, and there are 21 independent elastic constants which describe a minimally symmetrical, fully anisotropic system, an example of which would be a triclinic crystal. Increasing symmetry within a system reduces the number of independent elastic constants. For orthorhombic symmetries, there are nine; for hexagonal symmetry, there are five (C 11, C 33, C 44, C 66 and C 13 ); for cubic there are three (C 11, C 44 and C 12 ); and for isotropic media, there are only two (C 11 and C 44 ). (For this special case, C 11 = C 22 = C 33, C 12 = C 13 = C 23,andC 44 = C 55 = C 66 =(C 11 C 12 )/2.) AvisualsummaryoftheindependenttermsinthematrixC ij for each crystal symmetry class can be found on p. 148 in Royer and Dieulesaint (2000). Because the full tensor is so complicated, it is usual to make assumptions about the kind of symmetry present in the Earth; hexagonal symmetries are a good approximation where sedimentary layering or oriented cracks or inclusions arepresent.wherethelayering is horizontal, the hexagonal symmetry can be described by a vertical axis of rotational symmetry; if it is inclined, then so is the symmetry axis (Figure 1). The plane normal to the symmetry axis is the plane of isotropy. When the plane of isotropy is horizontal (the axis of symmetry vertical), this is often referred to as vertical transverse isotropy (VTI), whereas a more general case where the plane inclined is termed tilted transverse isotropy (TTI). In order to calculate the phase velocity along any particular directiongivenanelastic tensor, one solves the Christoffel equation,. det c ijkl n i n j ρv 2 n δ il =0, where n i is the unit normal to the plane wavefront, ρ is the density, v n is the phase velocity along the plane wavefront normal, and δ is the Kronecker delta. The three eigenvalues of the solution correspond to the P and S wave velocities, V P, V S1 and V S2,alongthisdirection (strictly, to the phase velocities of the quasi-compressional and -shear waves, which are not necessarily parallel and orthogonal respectively to n i ) Shear wave splitting Shear wave splitting occurs when a transverse wave travels through an anisotropic medium. Analogous to optic birefringence, this creates two orthogonally-polarised waves (the fast wave, S 1 and slow, S 2 )(Figure2). Dependingonthedistancetravelledinthe anisotropic medium, s, andthetwovelocities,v S1 and V S2,theslowwavewillbedelayed by some time δt = s ( ) 1 V S2 1.ThemeasuredpolarisationofS1 V S1 is termed the fast orientation, φ, andthisismeasuredattheseismicstation,henceφ is usually in the geographic frame and measured as an azimuth from north. The fast orientation in the ray frame, φ,is measured relative to the intersection between the Earth radial plane (vertical) and the ray 3
4 normal plane, and therefore φ is constant whilst the ray is not being actively split in an anisotropic region. The strength of the S-wave anisotropy along a certain direction in the anisotropic medium is generally expressed as δv S =2(V S1 V S2 )/(V S1 + V S2 ) (V S δt)/s. Hence in making measurements of splitting, normally one must assume a background average V S (from global 1 D or tomographic models) and distance travelled in the anisotropic region, in order to calculate δv S,withtheseuncertaintiesinherent. Thereisclearlyatradeoff between the path length in the anisotropic region and the strength of the anisotropy in that direction, hence in D where the layer thickness determines the path length our knowledge of δv S in any particular direction is limited by the uncertainty in exactly where in the lowermost mantle the anisotropy lies. The elasticity tensor can be visualised by examining V P and V S as a function of direction. We present the elastic behaviour of materials using upper hemisphere diagrams, explained in Figure 3. For all directions, we calculate the phase velocities as described above and show V P and δv S with colour. Additionally, the orientation of the fast shear wave,s 1,isshown by black ticks. In these diagrams, we show the variation in elastic properties with respect to the three cartesian axes, 1, 2 and 3. Figure 3 shows the elastic constants for a set of mantle peridotites taken from Mainprice and Silver (1993). The 1 2 plane corresponds to the foliation in the sample, which probably results from a shear fabric. The 1-direction is aligned with the lineation, which probably shows the shear direction. 2. Measuring seismic anisotropy The measurement of seismic anisotropy in the Earth has become routineforalimited number of techniques. In the deep mantle, work has mostly been directedtowardsobserving the primary, unambiguous product of the presence of anisotropy: shear wave splitting in phases which traverse the D region. However new approaches are becoming available which can directly invert for anisotropic structure within the lowermost mantle using a broader range of data. Previous reviews of observations of D anisotropy are in Lay et al. (1998), Kendall (2000), Moore et al. (2004) and Wookey and Kendall (2007) 2.1. Correcting for the upper mantle Measuring anisotropy in the deepest part of the mantle is not straightforward, as the upper mantle is known to be widely anisotropic itself (for a review, see Savage, 1999). The most common means of accounting for the effect of upper mantle anisotropy on D -traversing phases is to use a correction based on SKS splitting measurements. This phase traverses the outer core as a P wave and converts to a vertically polarised S wave (SV) at the CMB, hence is unsplit upon re-entering the lower mantle (Figure 4). Making the assumption of lower mantle isotropy, SKS should only split when encountering D and the upper mantle. SKS studies are now numerous and successfully explain many features of upper mantle dynamics, on the basis that SKS s path length in D is relatively small because the phase travels nearly vertically, and anisotropy in the lowermost mantle should not affect splitting in SKS much. Niu and Perez (2004) and Restivo and Helffrich (2006) compared SKS and 4
5 SKKS phases globally to investigate whether the lowermost mantle has an effect on such phases. In some individual cases in regions of high shear velocity, such as beneath eastern Canada, some discrepancy between SKS and SKKS was seen, which theauthorsattribute to D anisotropy related to LPO of post-perovskite or some other non-vti mechanism. Overall, however, they found no significant departure from a mechanism in which SKS is not split in D.Thisimpliesoneofthreethings:anisotropyisnotstronginD,whichdoes not appear to be the case from other measurements; anisotropy ind is not strong enough to be noticeable for near-vertical rays like SKS-SKKS, which havearelativelyshortpath there; or the style of anisotropy (e.g., VTI)meansthatradiallypolarisedraysarenotsplit, as azimuthal anisotropy may cause splitting in SKS-SKKS phases (Hall et al., 2004). This presents a puzzle for future studies of lowermost mantle anisotropy, as shall be explored. If we continue with the assumption that SKS splitting reflects onlyuppermantleaniso- tropy, then it can be used to remove the receiver-side splitting which occurs in a D -traversing phase when reaching the seismometer. The ray paths in the upper mantle of S, ScS and Sdiff are close to that of SKS for the distances discussed here, and their Fresnel zones at periods of 10 s all overlap significantly down to 300 km, so the effect of heterogeneity beneath the receiver is addressed. This does not account for anisotropy beneath the earthquake, however. One approach to address this is to use very deep-focus events (e.g., >500 km), which presumably do not experience much of the upper mantle anisotropic fabric as olivine is only stable down to 410 km. However, Wookey et al. (2005a), Rokosky et al. (2006) and Wookey and Kendall (2008), for instance, show that there is observable splitting beneath even some deep events (<600 km), so this assumption may increase uncertainties in observations of lowermost mantle splitting where no source-side corrections are made. Further difficulties with SKS splitting-based corrections when examining lowermost mantletraversing phases are that in order to adequately correct for anisotropybeneaththereceiver, one must have a good knowledge of the type of anisotropy present there, as dipping or multiple layers of anisotropy will lead to observed splitting having a strong dependence of the incoming polarisation of S-ScS-Sdiff. Choosing recording stations with many SKS measurements from a wide range of backazimuths can help alleviate this. A 90 or 180 periodicity in the splitting parameters φ and δt compared to the backazimuth betray the presence of complex upper mantle anisotropy (Silver and Savage, 1994), which should be avoided. Equally, stations which show little or no splitting across all backazimuths may be used with no correction. For especially well studied regions, it may be possibletocorrectforeven complicated types of anisotropy (Wookey and Kendall, 2008), buttheabilitytouniquely interpret such SKS splitting measurements is rare. An additional factor to consider in using SKS measurements as anuppermantlecorrec- tion is that S and SKS phases are of different slowness, so their incidenceanglesbeneath the receiver differ by up to 20,dependingontheepicentraldistancesbeinginvestigated. In general, this will lead to a difference in the splitting accrued along the rays in the upper mantle, hence an SKS-derived correction may not be appropriate. However, for an assumed hexagonal anisotropy with a horizontal symmetry axis beneath the station, the difference is small, and it appears in many studies the correction is adequate. Figure 5 shows the receiver-side upper mantle splitting which occurs in SKS and Sina250km-thickanisotro- 5
6 pic layer. The elastic constants are of those shown in Figure 3(MainpriceandSilver,1993) with an imposed hexagonal symmetry. For SKS in the distance range (typical for upper mantle SKS splitting studies), the range of incidence angles is small (10 6 ), and consequently there is almost no variation of splitting parameters with backazimuth. For Sinthedistancerange60 80,incidenceanglesare 23 18,andsplittinginS shows some small variation with backazimuth. However, because the style of anisotropy is relatively simple, the difference in splitting parameters between S and SKS is very small the fast orientations φ are indistinguishable, and the delay times are less than 0.3 sdifferent, which is similar to the typical error in δt SH-SV traveltime analysis The most straightforward way to infer anisotropy in D is to compare the arrival times of the two components of a shear phase when polarised horizontally (SH) and vertically (SV) (or, respectively, the tangential and radial components), after correcting for upper mantle anisotropy. The phases studied are usually S, ScS and Sdiff, and the assumption is made that the wave travels approximately horizontally (CMB-parallel) when bottoming in D. Therefore, if SH arrives first, one can infer that along this azimuth the velocity is faster in the tangential direction than the radial (V SH >V SV ). Figure 6 gives an example of this method. In any study, constraining the source of the anisotropy to D is the main difficulty. There is good reason to suggest that the lower mantle above D is isotropic (e.g., Meade et al. 1995; Montagner and Kennett 1996; Panning and Romanowicz 2006), therefore taking pairs of phases where one spends some time in D and the other avoids it can be used to remove upper mantle effects. Figure 4 shows ray paths for the major phases used: S, ScS, and Sdiff. Some of the earliest studies (e.g., LayandYoung,1991;Vinniketal.,1995)inferred anisotropy by looking at the retardation (relative to SHdiff), amplitudes and phase shifts of SV waves diffracted along the CMB (SVdiff). However, anisotropy is not the only possible cause of these effects for waves diffracted past distances of 95,asshownbyMaupin (1994) and Komatitsch et al. (2010). They model shear wave propagation in isotropic Earth models using the Langer approximation with perturbation theory, and spectral element method respectively, to show the early onset of SHdiff relative to SVdiff because of SV s coupling with the outer core, hence caution is needed in ascribing anisotropy to D on the basis of measurements of Sdiff at large distances: detailed full-waveform modelling and accurate isotropic Earth models are needed. The majority of observations comparing SH and SV traveltimes showv SH >V SV,with 0.5% δv S 3%, particularly in higher-than-average V S regions, such as beneath subduction zones. Table 1 and Figure 7 summarise the observations for regional measurements of splitting in D. In general, however, it seems that around the Pacific rim, V SH >V SV. Beneath the central Pacific, the pattern is more variable: some studies find V SH >V SV,some V SH <V SV. 6
7 Global inversion for anisotropy An extension of the above technique that can be made in terms of searching for a VTI structure is to produce a global inversion for a ratio of V SH and V SV ;usuallytheparameter ξ = VSH/V 2 SV 2 is sought. Whilst global 1 D models of V S such as PREM (Dziewonski and Anderson, 1981) sometimes include radial anisotropy in the upper mantle, at greater depths the inversions are generally isotropic. Montagner and Kennett (1996) used normal mode and body wave data to infer that ξ>1(i.e., V SH >V SV )ind on a global scale. This matches themajorityof local observations ofsh-sv traveltimes. Recently, Panning and Romanowicz (2004, 2006) have inverted a global dataset of long-period three-component S waveforms to obtain a 3 D model of V P, V S, source parameters and ξ throughout the entire mantle. Any such study will be prone to difficulties in correcting for the strongly anisotropic crust and upper mantle, however, so great care is necessary to ensure that this does not contaminate the resulting model (Lekic et al., 2010). Equally, such models will necessarily suffer from sampling bias associated with the location of earthquakes and seismometers because of potentially limited azimuthal coverage of D.Withobservationsalongonlyoneraypath,it is not possible to resolve whether VTI is a good approximation. However, the model agrees with regional observations, showing V SH >V SV where V S is higher than average, especially around the Pacific rim subduction zones. Where V S is relatively low, such as beneath the central Pacific and beneath Africa, V SV >V SH. Similarly to the work of Montagner and Kennett (1996), it also predicts ξ>1ford on average (Figure 8). Kustowski et al. (2008) invert surface and body waves for 3 D anisotropic mantle velocities using similar data, but find strong tradeoffs in the lowermost mantle between V S and ξ,andtheanisotropicstructure in D correlates poorly between the two models. It seems that at present there is still some room to improve on current global models Regional full-waveform inversion An alternative to producing a global map of anisotropy is to conduct regional fullwaveform inversion of seismic data from phases which traverse D.However,currentstudies are limited to assuming VTI in the lowermost mantle for computational and theoretical convenience. Using Tonga USA raypaths, Kawai and Geller (2010) employ a full-waveform inversion for ξ beneath the central Pacific and find that ξ<1ind,thoughthereislittle sensitivity to structure below about 150 km above the CMB. This agrees with other studies along similar raypaths, with ξ 0.97, which is at the lower end of the range of values found previously. Here, it was necessary to impose a discontinuity ofarbitrarydepthatthetopof the model, and upper mantle anisotropy was not included, so this may have a large impact on the uncertainty Waveform analysis Whilst relatively straightforward to implement, a weakness ofanystudywhichcompares SH and SV waves is the assumption of VTI. Recently, efforts have beenmadetorelaxthis constraint and infer more complex type of anisotropy. An approach used by Garnero et al. (2004a) and Maupin et al. (2005) is regional forward waveform modelling of S ScS waves beneath the Cocos plate and thecaribbean. Theyinfer 7
8 small deviations of a TI symmetry of 20 away from VTI as the raypaths move east to west across the region. Using an SH-SV traveltime approach, this would and does appear as V SH >V SV,thoughenergywillappearonbothradialandtransversecomponents for both fast and slow arrivals Measurements of shear wave splitting Another recent advance towards allowing more complex forms of anisotropy to be studied is to apply the measurement of both φ and δt by grid search over the splitting parameters (Fukao, 1984; Silver and Chan, 1991) to lower mantle-traversing shear phases (Figure 9). (This and other techniques such as the splitting intensity method (Chevrot, 2000; Vinnik et al., 1989) are summarised by Long (2009)). This allows one to determine a more general form of anisotropy, as the fast orientation is not limited to being either parallel or perpendicular to the CMB. In principle, with measurements along one azimuth, onecandistinguish whether VTI is a possible mechanism for D anisotropy or not, two azimuths can define a TTI-type fabric, whilst three can define an orthorhombic symmetry of anisotropy. One application of the measurement of shear wave splitting is toexaminedifferential splitting between the S and ScS, usually investigated at epicentral distances 55 < < 82 (with details of the method given by Wookey et al. (2005a)). Here, ScS samples D,Sturns above it, and both phases share a very similar path in the upper mantle. BecausetheScS phase is approximately horizontal for most of its travel in D at these distances, the ray frame fast orientation φ (also φ )isused(wookeyetal.,2005a). Thismeasurestheangle away from the Earth radial direction (i.e., vertical)whenlookingalongtheray. Hence,for VTI with V SH >V SV, φ =90. If φ 90,thenanothermechanismsuchasTTImustbe responsible. Single-azimuth S ScS studies beneath the northwest Pacific (Wookey et al., 2005a), Cocos plate Rokosky et al. (2006) and southeast Asia (Thomas et al., 2007) have been conducted. Beneath the Cocos plate and southeast Asia, whilst there is some variability, in general fast directions do not depart much from being horizontal. Wookey et al. (2005a), however, found that the fast orientations dipped southeast towards the central Pacific by about 45,whichisasignificantdeparturewithinthestatederrorof7. Assuming a TTI fabric, this actually provides a lower limit to the dip of the plane of isotropy, so clearly VTI in this region cannot explain the observations. Recently, studies using two azimuths of S ScS paths have been conducted. Beneath northern Siberia, Wookey and Kendall (2008) find that for waves travelling north from Hindu Kush events to stations in Canada, φ =89 (the fast orientation is approximately horizontal in D ), whilst east-west paths from the Kuril arc to stations in Germany show φ =35 (the fast direction dips 55 to the south). Beneath the Caribbean and North America, Nowacki et al. (2010) examine three regions with uncertainties of 10 for all azimuths. For ray paths travelling north to stations in North America from events in South America, φ 90,within error, which agrees with previous single-azimuth observations (Kendall and Nangini, 1996; Garnero and Lay, 2003; Garnero et al., 2004a). However, ray paths which cross these are not compatible with VTI: paths travelling northeast from the East Pacific Rise show φ = 42 (dipping to the southeast), whilst those travelling northwest from the Mid-Atlantic Ridge 8
9 show φ =45 (dipping south). A third region off the coast of northwest USA shows two paths with fast orientations 10 different to horizontal. In the cases outlined above, where φ 45,thetraditionalSH-SVtraveltimemethod would not observe any effects of anisotropy (Wookey and Kendall, 2007) (Figure 10). Equally, cases where 0 <φ < 45 cannot be distinguished from simple VTI where V SH >V SV.Hence the importance of not only resolving the fast orientation, but also incorporating a large range of azimuths, is hard to understate if we wish to make inferences about the nature and origin of seismic anisotropy from analysis of shear waves. It seems that, in contrast to our previously simple idea of horizontal fast directions beneath subduction zones, and vertical ones beneath upwellings, the the picture is more complex. If VTI is not a good approximation to the type of anisotropy in D,thenmultiple-azimuthstudiesmustbecomethenorm, otherwise we are at the mercy of the specific, single event-receiver geometry as to whether we can resolve the true effect of CMB dynamics. At the same time, however,theearth does not give up its secrets easily, as the location of landmasses and large earthquakes poses limitations on which regions of the lowermost mantle we can probe at present. Given that several studies have now implied that D does not everywhere show VTI-type behaviour, it is prudent toassess the discrepancy between this knowledge and the conclusions of Niu and Perez (2004) and Restivo and Helffrich (2006) (Section 2.1). Because azimuthal anisotropy appears to be present beneath at least Siberia, the Caribbean, western USA, the eastern and northwest Pacific and southern Africa, we should expect that studies comparing SKS and SKKS should exhibit differential splitting between the two phases which emerge from the outer core in these regions. In fact, as pointed out, Long (2009) and Wang and Wen (2007) do observe this in regional studies. In addition, Restivo and Helffrich (2006), for example, also show strong anomalous splitting between the two phases beneath western USA and the eastern Pacific, whilst southern Africa is poorly sampled because of eventreceiver geometries. Furthermore, the Caribbean is not well covered: anomaloussplittingin SKS-SKKS is evident there also, even if the global trend does not show significant departure from VTI for the whole dataset. Another factor is that because SKSandSKKSarepolarised vertically upon exiting the outer core, they will not be split byttiwherethedipdirection is closely parallel or anti-parallel to the wave propagation direction. Perhapsthelargest difference is that even SKKS at = 110 spends around 350 km in a 250 km-thick D with V S =7.3 kms 1,whereasScSat70 has a path over 1000 km. It may therefore be not so surprising that SKS-SKKS differential splitting is hard to observe. However, the small number of cases where it is seen (5 % of observations by Restivo and Helffrich (2006)) requires a good explanation that is still lacking. 3. Chemistry and mineralogy of the lower mantle The properties of the lowermost mantle are of course determined by the bulk composition and which phases are stable at the pressures and temperatures there. In order to interpret seismic observations using geodynamic inferences, we must understand the singleand polycrystal behaviour of the solid phases present, and the possibility of the presence of melt. There are a number of steps which are necessary to use mineral physics data to 9
10 predict flow from anisotropy. Firstly, which phases are present must be established. Then, single-crystal elastic properties and deformation mechanisms must be evaluated. These can then be used to determine polycrystalline behaviour in deformation, which can allow an aggregate anisotropic fabric to be predicted on the basis of agivendeformationhistory. Often it is hard to separate these in experiments, for instance, which involve many crystals, and authors attempt to find single-crystal properties from polycrystalline measurements. However successful modelling of texturing and hence anisotropy requires knowledge of all of these properties. Lowermost mantle mineralogy can be investigated with mineral physics experiments at CMB pressures and temperatures using apparatuses such as the laser-heated diamond anvil cell (LHDAC), but there are of course limitations. An important source of error in experiments is the pressure scales used (the Au scale of Tsuchiya (2003), versus the MgO standard of Speziale et al. (2001), amongst others). This means the stated pressure, and hence depth, of the transition from pv to ppv in experiments can range by as much as ±10 GPa (±200 km in the lower mantle) depending on the scale, which is an ongoing problem (Hirose, 2007). Another significant source of error comes from the high thermal gradients created in the cell by focussed laser heating and diamond s excellent thermal conduction. Numerical calculations of the properties of materials at high pressure and temperature are another important technique. As for physical experiments, however, uncertainties are present, due to the approximations necessary in performing the calculations. Density functional theory (DFT; Kohn and Sham, 1965) provides the basis for most of the studies we mention, which determines material properties by solving Schrödinger swaveequation. DFT gives an exact solution to the problem, but relies on an unknown term (the exchangecorrelation energy). Different approximations to this term lead to different biases in the calculations. For a review, see Perdew and Ruzsinszky (2010) Composition and D mineralogy The Earth s mantle is generally believed to be pyrolitic in composition (Ringwood, 1962; McDonough and Sun, 1995). This chemistry determines which mineral phases are present under the conditions of the lowermost mantle, though some experimental evidence suggests that a representative pyrolitic material, the KLB-1 peridotite, may not alone be able to reproduce the seismically-observed density in the lower mantle (Ricolleau et al., 2009). Input of other material such as mid-ocean ridge basalt (MORB) from subducting slabs must therefore play a role. The phases present above D in a pyrolite composition are orthorhombic MgSiO 3 perovskite, with the likely incorporation of some Fe and Al (pv; Figure 11), cubic (Mg,Fe)O (ferropericlase, fpc) and CaSiO 3 -perovskite (Ca-pv). Experiments suggest they are in the proportions 75, 20 and 5 % respectively (Kesson et al., 1998; Murakami et al., 2005) (Figure 12). For MORB, which is much richer in Al and Si, experiments show a very different mineralogy (Hirose et al., 1999; Ono et al., 2001; Hirose et al., 2005), with about 40 % pv, no fpc and 20 % Ca-pv. Significant amounts of a Na- and Al-rich phase, and a silica phase ( 20 % each) are present. 10
11 In 2004, several authors discovered another phase transition in MgSiO 3 to the orthorhombic CaIrO 3 structure at about 125 GPa (around 2700 km depth) and 2500 K (Murakami et al., 2004; Oganov and Ono, 2004). The post-perovskite phase (ppv) has a structure of layers of SiO 6 octahedra parallel to (010), intercalated with layers of Mg ions (Figure 11, right). Recently, studies have been carried out on pyrolite and MORB samples up to CMB conditions. In pyrolite, Murakami et al. (2005) observe the pv ppv transition at 113 GPa (equivalent to 2500 km) and 2500 K, where the phase assemblage is ppv (72 %), fpc (21 %) and tetragonal or cubic Ca-pv (7 %). In MORB compositions, Ono andoganov(2005) investigated pressures up to 143 GPa (Au standard) and temperatures of 3000 K. They observed ppv, Ca-pv, α-pbo 2 -type (also called columbite) silica and a CaTi 2 O 4 -type aluminous phase. Ohta et al. (2008) also investigated MORB samples withsimilarresults, except they found a Ca-ferrite (CaFe 2 O 4 )-type aluminous phase at lowermost mantle conditions. They suggest a transition in silica from the CaCl 2 to α-pbo 2 structure at around 115 GPa and 2000 K. Figure 12 summarises our current understanding of thephaseproportionsin the lower mantle. Whilst we do not focus in this review on the gross variability of the phase assemblage at D conditions because of compositional changes other than pyrolite versus MORB, it is obviously important in the behaviour of the lowermost mantle, and there is increasing evidence that chemical heterogeneity must play a part in creating the seismic variability observed in D (e.g., Simmonsetal.,2009) Pv ppv phase boundary How much pv or ppv is present in the lowermost mantle is still unresolved. For pure MgSiO 3,thephaseboundaryofcoursesharpandoccursat GPa, or km, hence D would be mainly composed of ppv. However with realistic amounts of Fe and Al, the phase boundary will be spread out over a range of pressures. Whether the region of costability is extended upward in the Earth by the addition of FeandAl,ordownwards, depends on the partition coefficient of the element between the twophases. IfFe,for instance, partitions more favourably into pv, then it will be stabiliseddownintotheppv stability field, and costability of the two phases will occur to greater depths than for the pure Mg endmember. Partitioning into ppv would conversely increase the mixed phase region upwards into pv s stability field. Thus this controls the amount of pv and ppv which are present in D. Additionally, Fe 2+ and Fe 3+ will behave differently, and how much iron is ferrous (Fe 2+ )dependsontheoxidationstateofthelowermostmantle. Itmight also be that if another phase like fpc is present into which Fe (or Al) partitions preferentially over pv and ppv, then this will buffer the Fe content and decrease the widthofthetwo-phase region. Pv and ppv do include Fe and Al in their structure in a pyrolitic composition(murakami et al., 2005), so the phase boundary between pv and ppv in various compositions is important. Whilst progress is being made, there has yet to emerge a consensus on the partitioning of Fe in particular between fpc and ppv, versus fpc and pv, hence there remains uncertainty in the pressure range across which pv and ppv are both stable. It seems that the partition 11
12 coefficient of Fe between pv and ppv, K pv/ppv Fe,isstronglydependentonFeandAlcontentof the phases. Recent work at CMB conditions suggests K pv/ppv Fe 4(seeAndraultetal.,2010, and their introduction for a recent concise review), and the phase boundary is predicted to be about 15 GPa or 300 km thick. Catalli et al. (2009) measure the transition width to be about 20 GPa ( 400 km) in a synthesised sample of (Mg 0.9 Fe 0.1 )(Al 0.1 Si 0.9 )O 3,andlessthan that in a sample without Al ((Mg 0.91 Fe 0.09 )SiO 3 ), though this of course does not include the buffering effects of any other phases which are present in the Earth. Both studies suggest costability begins at pressures equivalent to km above the CMB. Sinmyo et al. s 2008 study highlights the uncertainties in the measurements of K D,finding that the large temperature gradient in the sample may cause the variability between studies. Further, uncertainties in the pressure scales mean it is hardtodefineatexactlywhat depth the beginning of the mixed-phase region starts. Notably, actual peridotite samples (Murakami et al., 2005) apparently contain ppv at D conditions. An additional factor to consider is that the phase proportioncurvemaynotbelinear across the transition, so larger or smaller amounts of ppv may bepresentthanexpectedfor agivenpressure. Oneattempttoquantifythis(Hernlund,2010) suggests ppv is likely to exist in significant proportions (>50 % of the mantle) after just a few tens of kilometres of the transition. Measurements of the Clapeyron slope of the pv ppv show it likely lies in the range 7 14 MPa K 1 (Oganov and Ono, 2004; Tsuchiya et al., 2004; Ono and Oganov, 2005; Hirose et al., 2006; Tateno at al., 2009). This positive value implies that colder areas of the lowermost mantle will be enriched in ppv relative to hotter ones, andalsooffersthepossibility that because of the steep geotherm near the CMB, so-called double-crossings of the phase boundary might occur, leading to lenses of ppv-rich mantle bounded above and below by pv-rich areas (Hernlund et al., 2005; Wookey et al., 2005b). The effect this might have on the development of anisotropy from LPO of ppv is intriguing but poorly understood at present Single-crystal elasticity of D minerals With knowledge of the approximate proportions of phases present in the lowermost mantle, an understanding of the individual minerals properties and relative stabilities is necessary to make predictions about the behaviour of seismic waves passingthroughthisregion. Hence there has been much interest in using both experimental andtheoreticalmethodsto investigate these properties. Recent reviews of some of the work done on lowermost mantle phases mainly pv, ppv and fpc can be found in Hirose (2007), Shim (2008), Ohtani and Sakai (2008) and Trønnes (2010), amongst others. Here we discuss the most basic property of the phases in D for our purposes, their elasticity, which provides a first-order idea of their contribution to seismic anisotropy Perovskite Magnesium silicate perovskite (with about 10 % Fe and a few percent Al in the structure) is the most abundant mineral phase in the Earth, and is likely present in some portions of the bottom few hundred kilometres of the mantle. Because pv and ppv make up most of the lower mantle, they are the primary phases to affect seismic waves, and thus most important 12
13 to understand well. Although perfect perovskites are cubic, pvisorthorhombicduetothe rotation of the SiO 6 octahedra (Figure 11, left). Single-crystal elastic constants for pv at lowermost mantle conditionsareshowninfigure 13. Elastic constants for pv have been calculated by Oganov etal.(2001),wentzcovitchetal. (2004), Wookey et al. (2005b) and Wentzcovitch et al. (2006) at CMB pressure, the latter two at high T. Figure 13 shows that there is some discrepancy between the calculations, which appears to be due to differences in the C 12, C 22 and C 33 terms. The maximum δv S is between about %, which is moderately but not very strongly anisotropic Post-perovskite With the discovery of ppv (Iitaka et al., 2004; Murakami et al., 2004; Oganov and Ono, 2004; Tsuchiya et al., 2004), there has been an understandable focus on its elasticity, phase stability, and so on, as explanations of lowermost mantle observations. Intuitively, the orthorhombic ppv structure should be more seismically anisotropic than pv due to the layering of the SiO 6 octahedra, and this appears to be the case: the b-axis is more compressible than the a- and c-axes (Guignot et al., 2007; Mao et al., 2010). Elastic constants at D P and T have been calculated from experiments for ppv (Mao et al., 2010); ab initio calculations have recently been made by Wookey et al. (2005b), Stackhouse et al. (2005b) and Wentzcovitch et al. (2006). Figure 14 shows the elastic anisotropy for ppv at high temperature, comparing the theoretical calculations (MgSiO 3 )at4000ktothoseofmaoetal.(2010)((mg 0.6 Fe 0.4 )SiO 3 )at 2000 K. It is clear that there is some variation between the calculations. The experimentallyderived results show the largest δv S,withδV S =42%along[010]. Otherwise,thepatternis quite similar between the studies of Stackhouse et al. (2005b) and Mao et al. (2010), despite the difference in Mg#. This agrees with the analysis of Wookey and Kendall (2007), who suggest from combining ab initio elastic constants for the MgSiO 3,FeSiO 3 (Stackhouse et al., 2006) and AlSiO 3 (Stackhouse et al., 2005a) ppv endmembers in pyrolitic proportions that they do not differ significantly from those of pure Mg case. The general pattern of anisotropy differs slightly when considering the constants of Wentzcovitch et al. (2006), mainly due to differences in C 11, C 33 and C 13 ;thereasonforthisdiscrepancyisstillunclearandhopefully future work will better constrain our knowledge of the single-crystal elasticity of ppv. It is notable that theoretical calculations with realistic amounts of Fe and Al in Mg-pv and -ppv are difficult because the number of atoms in the simulations becomes large, hence the effect of their incorporation is uncertain Ferropericlase As the second most abundant mineral phase in the lowermost mantle, fpc is an important control on the behaviour of seismic waves in D.Assumingapyroliticmantle,anapproximate Mg# of 0.9 with Fe# = 0.1 isthelikelycomposition. (Mg,Fe)Oisstablethroughout the lower mantle, though much recent interest has been shown in a possible change of its properties due to the change in the spin state in Fe which may occur at midmantle pressure and temperatures. We do not discuss in detail the spin transition in fpc further as it appears this occurs higher in the mantle than D ( 2200 km; e.g., Komabayashietal.,2010);of 13
14 relevance is that Fe in fpc is likely in the low-spin state in the lowermost mantle. (For a recent review of the spin transition in fpc, see Lin and Tsuchiya, 2008.) Because fpc is cubic, the three constants required to describe the elastic behaviour of the structure are C 11, C 12 and C 44. Single-crystal elastic constants for fpc (Mg 0.9 Fe 0.1 )O have recently been determined from experiment by Marquardt et al. (2009) up to 81 GPa ( 1900 km) at ambient temperatures. Karki et al. (1999) calculate the elastic constants up to 150 GPa (greater than mantle depths) and 3000 K using ab initio methods for the pure Mg endmember, whilst Koci et al. (2007) perform calculations at 0 K up to 150 GPa for a range of Fe proportions up to 25 % ((Mg 0.75 Fe 0.25 )O). Figure 15 shows a selection of single-crystal elastic constants for MgO from theoretical calculations and (Mg 0 0.9Fe 0.1 )O It appears that the main effect of Fe in fpc is to decrease C 11 and C 44,andincrease C 12 (Figure 15; Koci et al., 2007), which in general will decrease theanisotropyofthe crystal (C 12 becomes closer to (C 11 2 C 44 ), as for the isotropic case). Little work has been conducted with Fe in the structure at high pressure, however, sotheseresultsareforhigh- or intermediate-spin states of Fe, and it is not clear what effect low-spin Fe might have on the anisotropy of fpc. As with pv and ppv, a large unknown at present is the partition coefficient between these phases, hence our knowledge of the likely Fe content of any of them at a particular pressure and temperature is limited Other phases Whilst pv ppv and fpc are the dominant phases in a pyrolitic composition at D conditions, Ca-pv along with silica and aluminous phases are present in much larger proportions in a MORB composition, hence knowledge of these phases is still important. Ca-pv is predicted to undergo a transition from cubic to tetragonal due to rotation of the SiO 6 octahedra at around K at the CMB on the basis of ab initio molecular dynamics (MD) simulations (Adams and Oganov, 2006; Stixrude etal., 2007), sopotentially in cold regions of the mantle this lower symmetry phase may exist. In contrast, Li et al. (2006b) suggest also from MD that the tetragonal phase is stable throughout the lower mantle. However, experiments at both pressures and temperatures of the lowermost mantle have yet to be conducted, so the phase diagram of Ca-pv is uncertain. Li et al. (2006a), Adams and Oganov (2006) and Stixrude et al. (2007) report elastic constants for Ca-pv at CMB conditions. Cubic Ca-pv appears to be moderately anisotropic, showing maximum δv S of 20 %, comparable to ppv and fpc, however the fact that it is a minor constituent of the lowermost mantle means it is often neglected as a possible contributor to seismic anisotropy. The silica phases most likely present in D are in the orthorhombic CaCl 2 or α-pbo 2 (also called columbite) forms, with the transition occurring at about GPa ( km). The implications for the presence of mainly the α-pbo 2 -type in D are not clear, as there are as yet no measurements of velocities or elastic constants for it at lowermost mantle temperatures and pressures. Karki et al. (1997a) do report constants at high pressure and 0 K from ab initio calculations (based on structure parameters reported in Karki et al. (1997b)). At least at 0 K, the α-pbo 2 -type silica shows a maximum δv S of 15 %, so appears unlikely to be a major candidate anisotropic phase in D,givenitslowabundance. Future high-t work to elucidate the properties of free silica in the lowermost mantle will 14
15 have important repercussions for models where subducted MORB at the CMB plays a large role in seismic anisotropy Lattice preferred orientation and slip systems in D phases In order to generate anisotropy, individual anisotropic crystals must be aligned over large lengthscales in a lattice- (or crystal-) preferred orientation (LPO, or CPO) (Figure 16A). Assuming that the phase undergoes deformation which is accommodatedbyslipona crystallographic plane (such as dislocation glide), the relative strengths of the slip systems active in the crystal determine how the mineral aligns. Furthermore, how an aggregate of individual crystals deforms depends on the phases present and their orientations. At present, our understanding of slip systems and aggregate texture development for mono- and polymineralic assemblages of phases at CMB conditions is poor, mainly because it is currently impossible to recreate mantle temperatures, pressure(bothverylarge)and strain rates (very low) on large polycrystalline samples in the laboratory. However, various experimental and theoretical methods have been used to examine the likely deformation mechanisms. There are two main approaches to evaluating the LPO caused by deformation in mantle minerals. Firstly, one can investigate the phases at D conditions in the LHDAC, compressing the sample by increasing the confining pressure during the courseoftheexperiment, leading to uniaxial deformation in the cell. Typically, radial X-ray diffraction data are taken and the intensity of the individual diffraction lines is taken tocorrespondtothenumber of crystals which are aligned in the orientation appropriate tocausethediffraction. The ellipticity of the diffraction rings is a measure of the differential stress within the sample. Thus a pole figure (orientation distribution function, ODF) can be calculated for the crystallographic directions and a dominant slip system inferred. There are a number of limitations to this technique, however primarily, the sample size is very small (a few µm 3 ), hence the amount of shortening is limited, and the sample is rarely actually at D temperatures when observations are made: it is usually heated beforehand for some time, but is cooling when lattice parameters are measured. Alternatively, one can look at structural analogues of lowermost mantle phases which are stable at conditions more easily achieved in the laboratory. Hencelargersamples( 20 mm 3 ) can be compressed, and the texture created examined directly. CaIrO 3, MgGeO 3 and MnGeO 3 have been used in this way, for instance, to investigate the slip system in ppv as they share the same structure. So far, the Kawai and D-DIA (differential-dia) apparatuses have been used to compress samples with a shear plane imposed at an angle to the compression direction. (For a review of terminology and methods, see Durham et al. (2002).) The sample is typically sheared to a shear strain of γ O(1), and the sample recovered and analysed with electron backscatter diffraction (EBSD) to determine the crystallographic orientation of potentially thousands of crystals. An ODF can be calculated, and slip systems inferred. Note that in such experiments, complex behaviour of polycrystalline material can be investigated, and several slip systems may operate. It is also notable that the presence of other phases as compared to a single-phase assemblage can change the deformation behaviour of an aggregate. This means that our long-term understanding of 15
16 how material deforms in D must rely on calculations or experiments on likely lowermost mantle compositions. Theoretical methods are also used to investigate deformation mechanisms, typically using the generalised stacking fault (GSF) within a Peierls-Nabarro dislocation model. Often, ab inito methods are used to find the GSF energy, feeding the Peierls-Nabarro model. Walker et al. (2010) summarise the main techniques used. Others, such as Oganov et al. (2005), use metadynamics to find new structures by perturbing the structure being studied, and allowing it to relax to another, effectively pushing the structure over an energy barrier to a new arrangement. The purpose for this review of understanding single-crystal deformationmechanismsis that we require such knowledge in order to infer deformation from measurements of seismic anisotropy. With values for the relative strengths of slip systems, one can predict the aggregate ODF and subsequent anisotropy of a polycrystalline assemblage. The predicted slip systems may be used, for example, in a viscoplastic self-consistent model (Lebensohn and Tomé, 1993; Wenk et al., 1991) and subjected to a known strain history, resulting in predictions which can be compared to observations Perovskite For pv, theoretical calculations have been combined with experiment to determine the relative strengths of the dominant slip systems by Mainprice etal.(2008).usingapeierls- Nabarro dislocation model, they infer that the [010](100) system is easiest at lowermost mantle conditions. This agrees qualitatively with experiments performed at lower pressures than present at the CMB (Cordier et al., 2004; Merkel et al., 2003), though high-temperature studies are still awaited. Even with 100 % alignment of the phase, the maximum δv S is 2%, which is significantly less than is the case for ppv or fpc. Hence it seems that, compared to fpc and ppv, pv is a poor candidate phase to explain the near-ubiquitous observation of D anisotropy Post-perovskite Table 2 summarises the experimental studies to date on slip systems in ppv and its structural analogues. It is clear that little consensus exists regarding the dominant slip system, with slip on (100), (010), (001) and {110} all suggested by at least one study. However, there is agreement for the slip system in CaIrO 3. Recent DAC and large-volume deformation experiments seem to confirm (010) as the likely slip plane for relatively large strains, with perhaps [100] the slip direction. Most studies alsodetectadifferenttexturing associated with the transformation from the pv to ppv structure a so-called transformation texture consistent with slip on 110 {110} (Walte et al., 2009; Okada et al., 2010; Hirose et al., 2010). However, whether CaIrO 3 is a good analogue for ppv in the sense that it deforms in the same way is under debate (Walte et al., 2009; Hirose et al., 2010; Miyagi et al., 2010; Mao et al., 2010; Okada et al., 2010). Hence whilst the advantages of using relatively large, polycrystalline samples are obvious, care is needed in directly applying the results of analogues to the case of the lowermost mantle. 16
17 Earliest theoretical work suggested on the basis of structural arguments that slip on (010) should be easiest, as this is the plane in which the SiO 6 octahedra lie, and indeed this agrees with experiments on CaIrO 3.Carrezetal.(2007)suggestthesystem[100](010)onthebasis of Peierls-Nabarro modelling. Metsue et al. (2009) also find the same, though point out that despite the similarity between the predicted slip systems in ppvandcairo 3,thestarting single-crystal properties for the two phases are quite different, so drawing conclusions from such bases is difficult. The observed transformation texture of slip on {110} (e.g., Walteetal., 2009; Okada et al., 2010) adds complexity to our picture of the relation of deformationtoanisotropy. If it is replicated in the pv ppv transition, then it may be that descending mantle will acquire acertaintextureforatime,whichchangesasstrainincreases. Hence future work to pin down whether such a process occurs in the Earth is important Ferropericlase 619 As the reader might have come to expect, great difficulties in experiments and theoretical 620 calculations at extreme conditions mean there is disagreement between authors regarding 621 the likely slip system in fpc. For NaCl-type cubic crystals, slip along 110 is expected to 622 dominate, hence one might expect {110} to be the likely slip planes for fpc (Karato, 1998). 623 However, other slip planes may also be dominant, and high temperatures will affect the 624 activation energies of the slip planes. Ab initio calculations for MgO and Peierls-Nabarro 625 modelling (Carrez et al., 2009) suggests that the active slip systematlowtemperature is {110}, thoughthe {100} system becomes relatively easier with increasing pressure. 628 Experiments on the pure-mg endmember at 47 GPa and ambient temperature by Merkel 629 et al. (2002) in the LHDAC suggest slip on {110}. ContrastingresultswerefoundbyLong 630 et al. (2006), who used a large-volume press to deform a sample at300mpaand 1400 K 631 for a range of compositions (0 Mg# 1). For pure MgO, [001] tends to align with the 632 shear direction, whilst [110] aligns for FeO. Even for γ 4, though, the development of 633 LPO was fairly weak. 634 Yamazaki and Karato (2002) used compositions of Mg# = 0.25 and 1.0 at P =300MPa, 635 T 1000 K with a very similar experimental setup to that of Long et al.(2006).theyfind 636 slip on {100} or {111} is likely. 637 Whilst knowledge of individual slip systems is important, in thelongtermwerequire 638 experiments and calculations on polycrystalline, multi-phase assemblages of the kind we 639 expect to exist at D,asexperiencesuggestsmonomineralicassemblagesatvastly different 640 conditions are not necessarily accurate proxies for the real thing. Animprovement wouldbe 641 knowledge of the relative strengths of the several slip systems operating in the single crystal 642 of any given phase. This would then allow one to calculate the development of texture under 643 aknownstrain. Anissuewhichseemsverydifficulttoresolveexperimentally is the vast 644 difference in strain rates between studies and the Earth. It seems likely that strain rates in 645 the deep mantle are ɛ O(10 16 ) O(10 14 )s 1,whilstatpresentweachieve ɛ 10 4 s 1, 646 so whether we can ever recreate such strains is a hard question toanswerpositively. 17
18 Shape-preferred orientation Thus far we have only considered the LPO of mineral phases as a potential cause of lower mantle anisotropy. An entirely separate cause of anisotropy is the sub-wavelength layering or ordering of material with contrasting elastic properties (Figure 16B and 16C). The anisotropy may be due to the periodic layering of different materialsorthepreferred alignment of inclusions like melt pockets. If SPO is the cause of lowermost mantle anisotropy, it may still be a result of deformation processes. To infer the link between deformation and observed anisotropy we must appeal to effective medium theories that predict the anisotropy. A number of approaches exist, but they can be divided into those that assume constant strain (e.g., Hudson,1980b)or those that assume constant stress (e.g., TandonandWeng,1984;Sayers,1992). Afurther complication involves the degree of interconnectivity between fluid inclusions, which leads to frequency dependent anisotropy (for a review see Hall and Kendall, 2001). Assuming an effective medium theory, an aggregate elastic tensor can be constructed and then used to predict the seismic observables along a given ray path. Holtzman and Kendall (2010) describe such an approach for linking a number of anisotropy mechanisms to strain partitioning at plate boundaries. Spheroidal inclusions lead to a hexagonal symmetry or TTI (see examples in Figure 16B and 16C). A more complex orthorhombic medium results if the inclusions are scalene ellipsoids (three axes of different lengths). However, on the basisofnaturalsamples, which tend to contain either elongate (prolate spheroidal) or flat (oblate spheroidal) inclusions, it seems that in most settings one axis will be significantly different from the other two. An example of each are L- and S-tectonites in subduction settings (Tikoff and Fossen, 1999). With respect to the lower mantle, Kendall and Silver (1996; 1998), for example, model the effects of spheroidal inclusions of contrasting velocity. They show that small volumefractions of oblate or disk-shaped inclusions of melt are highly efficient in generating seismic anisotropy. In order for periodic layering or aligned inclusions to produce an effective anisotropy, and not simply heterogeneity, the wavelength of the layering must be less than the dominant seismic wavelength. Indeed a way of discriminating between LPO and SPO anisotropy may be through observations of frequency dependent effects. For example, smallscale heterogeneity may scatter high-frequency seismic energy, but such a medium may be effectively anisotropic to long wavelength energy (Rümpker etal.,1999). Also compatible with observations might be the complementary presence of both SPO and LPO. If, for instance, strain partitions into one weaker phase in a multi-phase mixture (e.g., asolidandliquid, ortwosolidphaseswithcontrastingstrengths; e.g., Ammannetal., 2010), then we might expect shear bands to form, as is frequently observed in surface geology. If the bands are of the appropriate length scale, they might have an SPO contribution to seismic anisotropy, whilst the highly deforming material in thebands orevenoutside, for the case of melt-rich bands may still deform to produce LPO. Hence the division between LPO and SPO is not necessarily clear whilst our knowledge of the lowermost mantle is at this limited stage. Amajorunknowninthissortofanalysisisthattheplausibility of melt in the lowermost 18
19 mantle is still speculative. Furthermore, much work is needed to better establish the material properties of such melt, be they primordial in origin, the remains of subducted palaeo-oceanic crust (basalt) or material derived from the outer core. 5. Geodynamics While knowledge of the deformation mechanism of lowermost mantle materials is limited (see section 3.3), one approach to assessing how likely they are to be realistic is to consider the first-order flow exptected just above the CMB. Topography on the CMB is limited to afewkilometresatmost(e.g., Tanaka,2010),andtheoutercoreisliquidwithafree-slip surface above, so it seems highly likely that flow just above the CMB is mainly horizontal. If we assume this, we might be able to mark as unlikely some of the proposed deformation mechanisms for ppv, and then use the remainder to suggest slightly more nuanced flow situations in D.Weexplorethisfurtherinsection6. Global models of mantle flow have matured rapidly with increasing computer power and new techniques over recent years, and inferring the first-order flow field at the CMB by including geophysical observables such as recent plate motions and likely phase stabilities and rheologies is now possible. Alongside this, models of mantle flow have developed which are derived from seismic tomography, with the constraints of mineralphysics,geoidand plate motion data. Where there is good evidence from seismic wave speed tomography (e.g., Ritsemaetal., 1999; Montelli et al., 2004) of subducting slabs reaching the lowermostmantle,suchas the Farallon slab beneath North America, we can make slightly moredetailedinferences regarding the likely large-scale flow field. A simple approach usedfrequently(e.g., Wookey and Kendall, 2007; Yamazaki and Karato, 2007; Miyagi et al., 2010) is to assume horizontal flow occurs at the CMB, and hence slip systems which produce fast orientations within the slip plane are the likeliest to match the majority of observations which suggest V SH >V SV in D. As section 2.6 shows, however, requiring horizontal fast directions in all directions does not match with observations, so such assumptions must be revisited. One constraint on the kind of deformation experienced in such asituationistoconstruct models of mantle flow with an imposed subduction of a thermally negativelybuoyantslab. McNamara et al. (2003), for example, use a general 2D cylindrical model with diffusion and dislocation creep to search the parameter space of variables such as slab thickness and strength, and relative activation energies of the two creep regimes. They find that dislocation creep dominates around the slab, and at the base of the mantle beneath the slab, whilst the rest of the mantle is likely deforming in diffusion creep, hence not producing significant LPO. They also claim that LPO in such a model requires γ 4todevelop. Withthis method, where the whole Earth s mantle is modelled, but without imposing the constraints of observed plate motions, the results can be qualitatively, andtosomeextentquantitatively compared to deformation mechanisms in lowermost mantle mineral phases. In order to construct models which are useful in understanding how the mantle flows in D,ahugenumberofparametersarenecessary,onlysomeofwhichareknownwell. Onedimensional radial viscosity profiles (e.g., MitrovicaandForte,2004),forinstance,place 19
20 astrongcontrolonthedepthandextentofsubduction,whichwould then affect the flow field above the CMB. Although these are constrained from present-day observables (mainly isostatic glacial rebound of the surface for shallow depths, andmineralphysicsdatamuch deeper), obviously there is likely to be lateral variations in viscosity as well such as that introduced by a cold slab which can only be modelled with accurate understanding of the effect on viscosity of temperature, composition, mineralogy, and so forth. Other large unknowns are the temperature at the CMB and the effect of composition and temperature on the density of mantle phases. In some studies (e.g., Wenketal.,2006;Merkeletal.,2006,2007),workerstake general models of flow of this kind and test for the type of anisotropy produced by a given deformation mechanism when traced through the flow field. Assuming a certain flow field as suggested by the convection model, they trace particles through the field and apply a viscoplastic self-consistent (VPSC) model (e.g., LebensohnandTomé, 1993, Wenketal., 1991) to calculate the texture developed for a polycrystalline aggregate using a set of slip system activities relevant to the phases being tested. The resulting aggregate elastic tensor is constructed from the single crystal constants and the orientation distribution function (ODF) of the phases in the aggregate, and can then be compared with seismic observations from similar settings that is, beneath subducting slabs. Another approach to modelling flow in the mantle is to seek a true picture of what is happening at present. Using seismic travel time picks, plate motion reconstructions (Lithgow-Bertelloni and Richards, 1998), gravity measurements, dynamic topography and other constraints, various authors (e.g., Tackley,2000;Trampertetal.,2004;Simmonsetal., 2009) have attempted to invert for the present-day or recent flow field in the mantle. Much of this work depends on the particular relationship between seismic wave speed and density in order to asses whether only thermal, or thermal and compositional effects are being seen by the seismic velocities. With knowledge of the density anomalies which are thermal and compositional (or mineralogical), one can produce a model of mantleflow. Thisseemsa promising approach to take, if we wish to assess whether we can usemeasurementsofanisotropy to determine flow in the mantle. For instance, if the flow is fairly constant over time and shear strains are fairly large ( 1, perhaps) then current mineral physics understanding suggests we could observe LPO, providing the strain rate is high enough and dislocation creep is occurring. If, on the other hand, strain rates predicted by such inversions are much lower, then perhaps SPO is the likely mechanism. Afurthersteptotakewithsuchanapproachistodirectlyincorporate experimentally or theoretically derived slip system activities for a mono- or polymineralic assemblage of grains and perform VPSC calculations as above. The texture will be more complicated, and likely weaker, but in theory more realistic. This does depend hugely on the flow model being used, though tests on producing a synthetic seismic model from a global flow model by Bull et al. (2010) suggest that the input and recovered strain fields are usually <20 apart. This is encouraging from the perspective of hoping to be able to one daymapdeformationfrom anisotropy, but adequate seismic coverage will long be a problem, as discussed in section
21 Linking observations to physical processes If the measurement of seismic anisotropy is to be useful in studying the dynamics of the lowermost mantle, then we need a close understanding of the rheology of mantle materials at CMB conditions. Section 3 discussed that we are still some way from fully understanding how to measure dynamics in D using seismic anisotropy, but we are now at the stage where our inferences are informed by a great deal of work on the propertiesoflowermost mantle minerals. In the first instance, seismic anisotropy can be used to evaluate a number of different mechanisms which might cause it Inferring SPO and TTI Asimplemechanismtoproducelowermantleanisotropywhich cannot at present be ruled out is SPO. This has been the preferred interpretation in a number of studies (e.g., Kendall and Silver, 1998; Lay et al., 1998; Karato, 1998), which model the expected bulk anisotropy for isotropic inclusions of material with a contrasting V S in an isotropic medium. Kendall and Silver (1998), for instance, use the effective medium theory of Tandon and Weng (1984) to predict the shear wave splitting caused by horizontal rays travelling through amediumwithorientedspheroidalinclusions. Whilsthigh-velocity inclusions are unlikely to be a mechanism which can match the observations (as the inclusions would need to have V Sinc 13 km s 1 ), melt-filled inclusions (V Sinc =0)canproduceδV S =2%withamelt fraction of just 0.01 % for oblate spheroidal inclusions. Moore et al. (2004) show a D with horizontal sub-wavelength layering of heterogeneous material can produce synthetics compatible with observations in certain regions. Both studies suggest that SPO especially of melt is an efficient way of producing anisotropy without much reducing the bulk average V S (Kendall and Silver, 1996). If we assume that SPO is the cause for an observed anisotropy, then this usually implies that the style of anisotropy is TTI (see section 4). Because of thehighsymmetryoftti, two near-perpendicular azimuths of shear waves are sufficient tocharacterisetheorientation of the symmetry axis (or plane of isotropy), as five independent elastic constants describe such a system and the local V S can be assumed. One simplistic way to infer the orientation of the TTI fabric is to assume a case where Thomsen s (1986) parameters δ ɛ, hencethefastorientationofawavesplitbysuch a medium is always in the plane of isotropy for waves not perpendicular to the plane. Therefore asimplegeometricalcalculationtofindthecommonplaneofthe fast orientations in the ray frame φ can be used. Nowacki et al. (2010) use this to calculate the TTI planesofisotropy beneath the Caribbean and western USA (Figure 17). Figure 18 illustrates the nominally simple geometry for region E in this study. An alternative method used by Wookey and Kendall (2008) to estimate the orientation of the TTI plane of isotropy for two orthogonal ray paths beneath Siberiacanbesummarised as: (1) take a set of elastic constants C ij for a TI system, with vertical V S and V P defined by a global 1 D velocity model (Kennett et al., 1995); (2) rotate these constants about all three cartesian axes and compute δv S (and hence δt) andφ at each point; (3) output the orientations which produce (φ,δt)whicharecompatiblewiththeobservations. This 21
22 inversion has the advantage that it can be simply extended foranysetofelasticconstants, and lies between analytic solutions from shear wave splitting measurements and inversions for the full elastic tensor, which would likely be poorly constrained Implications of SPO and TTI If our assumption that the lowermost mantle shows a variable TTI type of anisotropy is correct and it is worth noting that no studies as yet are incompatible with this symmetry then what does this imply for the dynamics within and above D? As discussed in the previous section, various authors have shown that SPO of melt pockets(orotherlowv S inclusions) at the CMB could cause this, and this then begs the questionastowherethese melts come from. A possibility mooted by Knittle and Jeanloz (1987) was that reaction between core and mantle materials would lead to inclusions of Fe-richproducts(e.g., FeO, FeSi) in D (Kendall and Silver, 1998). However, the bulk reduction in V SH from this does not match observations, hence is an unlikely scenario. As mentioned in section 4, Stixrude et al. (2009), for example, suggest that silicate melts might be present in the lowermost mantle at temperatures as low as 4000 K. Just 0.01 % melt could be compatible with observations given the bulk sound velocity is predicted to be around 10.9 kms 1. If such models are accurate, then we require knowledge of how the inclusions partially or wholly molten, or simply of contrasting velocity align in responsetoflow,tomake geodynamical inferences. To first order, weaker inclusions in a stronger matrix align parallel to the strain ellipse s long axis (i.e., theshearplane)whenthestrainishigh(γ>1). Hence for the cases where we have two azimuths (in the Caribbean and Siberia), we would predict flow dipping between roughly to the south in D.Thesesteepanglesseemsomewhat unlikely for high strains, given that flow right at the CMB must behorizontal,butcannot necessarily be precluded. Contrary to this first-order approximation, weak inclusions apparentlyrotatewhensheared so that they are no longer parallel to the finite strain ellipse, as noted by Karato (1998). Numerous experiments chiefly on olivine-morb samples indicate that shear bands of melt align antithetic to the shear plane at an angle of (Kohlstedt and Zimmerman, 1996; Holtzman et al., 2003a,b). Taking the example of the regions studied by Wookey and Kendall (2008) and Nowacki et al. (2010), this melt orientation predicts horizontal shear to the north or northwest in western USA, and gently dipping flow to the south elsewhere in the Caribbean and Siberia. Figure 19 shows this situation with the shear wave anisotropy predicted by sensible lowermost mantle parameters, where melt inclusions dip 25 southward, but due to northward flow. In the Caribbean, geodynamical calculations of the flow beneath subducting slabs would generally agree rather with east west flow for a north south-striking plate (McNamara et al., 2003), but at least this model seems physically possible. The known mineral phases present at the CMB do not show hexagonal symmetry, however an alternative explanation for TTI would be the alignment of one crystallographic axis of some anisotropic mineral phase, with the other axes random. As an artificial example, Figure 20 shows the case where an aggregate of ppv shows alignment of c-axes, but the a- and b-axes are otherwise randomly oriented. This might correspond to slip on the (001) 22
23 plane along both the [100] and [010] directions. This leads to TIwiththesymmetryaxis parallel to the c-axis, where the fast shear wave is within the TIplane Inferring orthorhombic and higher symmetries Whilst at present TTI cannot be ruled out as causative of the observed seismic anisotropy in D,amoregeneralorthorhombicsymmetry suchasthatcausedbyalignmentof orthorhombic crystals is a more likely mechanism. Equally, cubicandlowersymmetriescan also produce the observed patterns of anisotropy. However, it is unlikely that distinguishing such a highly symmetric type of anisotropy will be possible with the current earthquake and seismometer geometries for some time, so assuming that orthorhombic anisotropy is the lowest symmetry likely to exist is, for now, a necessary step. So far, no studies have been able to uniquely infer the orientation of an orthorhombic symmetry, because only measurements of D anisotropy along two directions have been made. However, Wookey and Kendall (2008) and Nowacki et al. (2010) use two azimuths and the technique described in Section 6.1 to test the orientations of different candidate orthorhombic systems beneath the Caribbean and Siberia. In the case of using two azimuths of measurements, one normally finds that two sets of planes are compatible. Figure21shows an example of fitting possible orientations of different (orthorhombic) elastic constants to measurements made beneath the three regions of Nowacki et al. (2010). Theyuseaset of constants obtained by Yamazaki et al. (2006), who deform CaIrO 3 (same structure as MgSiO 3 -post-perovskite), and find that the [100](010) slip system is dominant. The elastic constants are referenced to the shear plane and slip direction imposed upon the deformation, so we can directly infer in which direction a material which behaves in this way is being sheared Inferring deformation in D We measure D anisotropy in the hope that it can provide information about the manner in which it is deforming, and hence how the mantle moves at depths. In order to estimate flow orstrain from anisotropy, we must integrate our understanding of the cause of anisotropy, the orientation of the assumed anisotropy type, our knowledge of therheologyofthemedium, and the response of the shear direction to the potentially changing flow field. Figure 22 illustrates the many steps involved in getting from observations to predictions of deformation, and the many assumptions which are made along the way. At present, the response of D materials to deformation is not well known, hence early attempts at inferring flow from measurements of seismic anisotropy were necessarily general. Beneath the circum-pacific subduction zones where flow is assumed to be horizontal at the CMB, the global ξ models of Panning and Romanowicz (2004, 2006) show V SH >V SV,and thus it has been interpreted that likely mechanisms in response to shear in D mineral should produce fast orientations parallel to the shear plane. This then may lead to the inference that beneath the central Pacific, the change of ξ>1toξ<1correspondstoverticalflow (e.g., KawaiandGeller,2010)orsomesortofshearingindifferenthorizontal directions (e.g., Pulliam and Sen, 1998). Clearly, whilst there is short scale variability in the signal anyway, 23
24 determining the first-order flow field from an educated guess is anunderstandablefirststep which we should attempt to improve upon. In fact, this point highlights one of the current shortcomings in our addressing of the problem of using seismic anisotropy to map deformation. At present, we are limited to using best guess estimates of the flow field in certain areas at the CMB (specifically, where the ancient Farallon slab is presumed to be sinking to the CMB beneath North and Central America, and to some extent other circum-pacific subduction zones) to argue for and against different mechanisms for producing seismic anisotropy. For instance, Yamazaki and Karato (2007) prefer an explanation for D anisotropy of the LPO of a mixture of (Mg,Fe)O and MgSiO 3 -post-perovskite because horizontal shear would give a horizontally-polarised fast shear wave for this case, which is the sort of deformation postulated beneath deep slabs. They then argue that SPO of melt inclusions oriented vertically is the likeliest case for the central Pacific, because flow there is probably vertical and in higher-temperaturematerial. If the CMB is considered an impenetrable free slip surface, then why should flow not also be mainly vertical in the very lowermost mantle beneath a downwelling as well as an upwelling? Whilst these first-order explanations are sensible, they are onlyaninitialideaaboutflow, hence using this to constrain LPO and infer the presence of melt makes a large stride in assumptions which we must eventually address with direct observations of lowermost mantle rheology. Nonetheless, many authors have inferred different flow regimes at the CMB based on seismic anisotropy. Early work (e.g., Vinniketal. 1995; LayandYoung1991; Ritsemaetal. 1998) attributed anisotropy to stratification or LPO on the basis of the expected flow field near the CMB. Later, Kendall and Silver (1996), for instance, identifyslabmaterialwhichis laid down in piles parallel to the CMB as a cause of SPO. Recently, dual-azimuth splitting measurements were used in combination with global V S tomography to infer that northsouth flow beneath Siberia is the likely cause of anisotropy due to LPO of ppv (Wookey and Kendall, 2008). Similarly, Nowacki et al. (2010) infer that an LPO of ppv whereby the (001) planes align parallel to shear is most likely beneath the Farallon slab because of first-order flow arguments, and then extend the argument to suggest that shear planes dip towards the downwelling centre, analogous to the situation in mid-ocean spreadingcentres(blackman et al., 1996), and supported by general-case geodynamic calculations (McNamara et al., 2002) Future advances in incorporating all our current understanding of the behaviour of the constituents of the lowermost mantle into linking observations and dynamics will become incrementally better. These early attempts at measuring the flow of the deepest mantle should be surpassed as we use new information which becomes available from increasingly advanced experimental and numerical techniques for studying seismic anisotropy,flow,geodynamics and mineral physics. 7. Conclusions and future directions In this review, we have presented the current state of studies whichaimtouseseismic anisotropy to discover the flow in the deepest mantle, and the many other fields which feed 24
25 into this. It seems that we are moving from an early phase of D study into a more mature field, where the number of observations is now becoming limited by the location of seismic stations. As we look to the future, projects to increase global coverage of seismometers will benefit all studies of the Earth s interior, but especially that of the lowermost mantle. With this increased coverage, the prospect of using more advanced techniquestotakeadvantageis an exciting one which may yet yield even harder questions that wecurrentlytrytoanswer. One such technique that must be further explored with new datasets is the full inversion for the elastic tensor using the full seismic waveform. Recent advances towards this necessarily assume a simple anisotropy, but this can be relaxed as data coverage improves. However, as for global inversions for simple anisotropy, upper mantle and crustal corrections will be a problem. At the same time, existing global datasets as used for global tomography, for example might be exploited to move from regional shear wave splitting studies to global ones. This will require either a new, robust way of analysing shear wave splitting, which is still the most unequivocal of observations of anisotropy, or the further automation and quality control of standard techniques. Shear wave splitting tomography is another technique which will likely prove important in the future. Whilst seismological observations will be our primary test of models of D flow and anisotropy for some time, advances must be made in mineral physics and geodynamics if we are to improve. Studies of deformation in likely lowermost mantle mineral assemblages will hopefully go some way in the future to reducing the ambiguity regarding how to translate anisotropy to flow, and global mantle flow models may be able to become predictors of anisotropy with such knowledge. Acknowledgements The authors are thankful to Andrew Walker for insightful comments on the manuscript. AJN was supported by NERC. References Adams, D., Oganov, A., Ab initio molecular dynamics study of CaSiO 3 perovskite at P-T conditions of Earth s lower mantle. Phys. Rev. B 73, Ammann, M.W., Brodholt, J.P., Wookey, J., Dobson, D.P., First-principles constraints on diffusion in lower-mantle minerals and a weak D layer. Nature 465, Andrault, D., Muñoz, M., Bolfan-Casanova, N., Guignot, N., Perrillat, J.P., Aquilanti, G., Pascarelli, S., Experimental evidence for perovskite and post-perovskite coexistence throughout the whole D region. Earth Planet Sci Lett 293, Becker, T.W., Boschi, L., A comparison of tomographic and geodynamic mantle models. Geochem Geophy Geosy 3, Blackman, D., Kendall, J.M., Dawson, P., Wenk, H.R., Boyce, D., Morgan, J., Teleseismic imaging of subaxial flow at mid-ocean ridges: Traveltime effects of anisotropic mineral texture in the mantle. Geophys J Int 127, Bull, A.L., McNamara, A.K., Becker, T.W., Ritsema, J., Globalscalemodelsofthemantleflowfield predicted by synthetic tomography models. Phys. Earth Planet. Inter. 182, Bullen, K., The problem of the Earth s density variation. B Seismol Soc Am. Bullen, K., An Earth model based on a compressibility-pressure hypothesis. 25
26 Carrez, P., Ferre, D., Cordier, P., Implications for plastic flow in the deep mantle from modelling dislocations in MgSiO 3 minerals. Nature 446, Carrez, P., Ferre, D., Cordier, P., Peierls-Nabarro modelling of dislocations in MgO from ambient pressure to 100 GPa. Model Simul Mater Sc 17, Catalli, K., Shim, S.H., Prakapenka, V.B., Thickness and Clapeyron slope of the post-perovskite boundary. Nature 462, 782 U101. Chevrot, S., Multichannel analysis of shear wave splitting. J Geophys Res-Sol Ea 105, Cordier, P., Ungar, T., Zsoldos, L., Tichy, G., Dislocation creep in MgSiO 3 perovskite at conditions of the Earth s uppermost lower mantle. Nature 428, Ding, X., Helmberger, D., Modelling D structure beneath Central America with broadband seismic data. Phys. Earth Planet. Inter. 101, Durham, W., Weidner, D., Karato, S. Wang, Y New developments in deformation experiments at high pressure, in: Karato, S., Wenk, H. (Eds.), Plastic Deformation of Minerals and Rocks. volume 51 of Reviews in Mineralogy & Geochemistry, pp MineralogicalSocietyofAmerica,SanFrancisco, USA. Dziewonski, A., Anderson, D., Preliminary reference Earth model. Phys. Earth Planet. Inter. 25, Ford, S., Garnero, E.J., McNamara, A.K., A strong lateral shear velocity gradient and anisotropy heterogeneity in the lowermost mantle beneath the southern Pacific. J Geophys Res-Sol Ea 111, B Fouch, M.J., Fischer, K.M., Wysession, M., Lowermost mantle anisotropy beneath the Pacific: Imaging the source of the Hawaiian plume. Earth Planet Sci Lett 190, Fukao, Y., Evidence from core-reflected shear-waves for anisotropy in the Earth s mantle. Nature 309, Garnero, E.J., Lay, T., Lateral variations in lowermost mantle shear wave anisotropy beneath the north Pacific and Alaska. J Geophys Res-Sol Ea 102, Garnero, E.J., Lay, T., D shear velocity heterogeneity, anisotropy and discontinuity structure beneath the Caribbean and Central America. Phys Earth Planet Inter 140, Garnero, E.J., Maupin, V., Lay, T., Fouch, M.J., 2004a. Variable azimuthal anisotropy in Earth s lowermost mantle. Science 306, Garnero, E.J., Moore, M., Lay, T., Fouch, M.J., 2004b. Isotropy or weak vertical transverse isotropy in D beneath the Atlantic Ocean. J Geophys Res-Sol Ea 109, B Garnero, E.J., Revenaugh, J., Williams, Q., Lay, T., Kellogg, L., Ultralow velocity zone at the core mantle boundary, in: Gurnis, M., Wysession, M.E., Knittle, E., Buffett, B.A. (Eds.), The Core Mantle Boundary Region. American Geophysical Union. Geodynamics Series, pp Guignot, N., Andrault, D., Morard, G., Bolfan-Casanova, N., Mezouar, M., Thermoelasticproperties of post-perovskite phase MgSiO 3 determined experimentally at core-mantle boundary P-T conditions. Earth Planet Sci Lett 256, Hall, S., Kendall, J.M., Constraining the interpretation of AVOA for fracture characterisation, in: Ikelle, L., Gangi, A. (Eds.), Anisotropy 2000: Fractures, Converted Waves, and Case Studies. Proceedings of 9 th International Workshop on Seismic Anisotropy (9IWSA). Society of Exploration Geophysicists, Tulsa, USA. volume 6 of Open File Publications, pp Hall, S., Kendall, J.M., van der Baan, M., Some comments ontheeffectsoflower-mantleanisotropy on SKS and SKKS phases. Phys. Earth Planet. Inter. 146, Hedlin, M., Shearer, P., Earle, P., Seismic evidence for small-scale heterogeneity throughout the Earth s mantle. Nature 387, Hernlund, J.W., On the interaction of the geotherm with apost-perovskitephasetransitioninthe deep mantle. Phys. Earth Planet. Inter. 180, Hernlund, J.W., Thomas, C. Tackley, P.J., A doubling ofthepost-perovskitephaseboundaryand structure of the Earth s lowermost mantle. Nature 434, Hirose, K., Postperovskite phase transition and its geophysical implications. Rev. Geophys. 44, RG
27 Hirose, K., Discovery of post-perovskite phase transition and the nature of D layer, in: Hirose, K., Brodholt, J., Lay, T., Yuen, D.A. (Eds.), Post-Perovksite: The Last Mantle Phase Transition. American Geophysical Union. Geophysical Monograph, pp Hirose, K., Fei, Y., Ma, Y., Mao, H., The fate of subducted basaltic crust in the Earth s lower mantle. Nature 397, Hirose, K., Nagaya, Y., Merkel, S., Ohishi, Y., Deformation of MnGeO 3 post-perovskite at lower mantle pressure and temperature. Geophys Res Lett 37, 1 5. Hirose, K., Sinmyo, R., Sata, N., Ohishi, Y., Determination of post-perovskite phase transition boundary in MgSiO 3 using Au and MgO pressure standards. Geophys Res Lett 33, L Hirose, K., Takafuji, N., Sata, N., Ohishi, Y., Phase transition and density of subducted MORB crust in the lower mantle. Earth Planet Sci Lett 237, Holtzman, B., Groebner, N., Zimmerman, M., Ginsberg, S., Kohlstedt, D., 2003a. Stress-driven melt segregation in partially molten rocks. Geochem Geophy Geosy 4,8607. Holtzman, B., Kohlstedt, D., Zimmerman, M., Heidelbach, F., Hiraga, T., Hustoft, J.W., 2003b. Melt segregation and strain partitioning: Implications for seismic anisotropy and mantle flow. Science 301, Holtzman, B.K., Kendall, J.M., Organized melt, seismic anisotropy, and plate boundary lubrication. Geochem Geophy Geosy 11, Q0AB06. Hudson, J., 1980a. The excitation and propagation of elasticwaves.cambridgeuniversitypress,cambridge, U.K. Hudson, J., 1980b. Overall properties of a cracked solid. Math. Proc. Camb. Phil. Soc. 88, Iitaka, T., Hirose, K., Kawamura, K., Murakami, M., The elasticityofthemgsio 3 post-perovskite phase in the Earth s lowermost mantle. Nature 430, Karato, S., Some remarks on the origin of seismic anisotropy in the D layer. Earth Planets Space 50, Karki, B., Stixrude, L., Crain, J., 1997a. Ab initio elasticity of three high-pressure polymorphs of silica. Geophys Res Lett 24, Karki, B., Warren, M., Stixrude, L., Ackland, G., Crain, J., 1997b. Ab initio studies of high-pressure structural transformations in silica. Phys. Rev. B 55, Karki, B., Wentzcovitch, R., de Gironcoli, S., Baroni, S., First-principles determination of elastic anisotropy and wave velocities of MgO at lower mantle conditions. Science 286, Kawai, K., Geller, R.J., The vertical flow in the lowermost mantle beneath the Pacific from inversion of seismic waveforms for anisotropic structure. Earth Planet Sci Lett 297, Kendall, J.M., Seismic anisotropy in the boundary layers of the mantle, in: Karato, S., Forte, A., Liebermann, R.C., Masters, G., Stixrude, L. (Eds.), Earth s Deep Interior: Mineral Physics and Tomography from the Atomic to the Global Scale. American Geophysical Union, Washington, D.C., USA. volume 117 of Geophysical Monograph, pp Kendall, J.M., Nangini, C., Lateral variations in D below the Caribbean. Geophys Res Lett 23, Kendall, J.M., Silver, P.G., Constraints from seismicanisotropyonthenatureofthelowermostmantle. Nature 381, Kendall, J.M., Silver, P.G., Investigating causes of D anisotropy, in: Gurnis, M., Wysession, M.E., Knittle, E., Buffett, B.A. (Eds.), The Core Mantle Boundary Region. American Geophysical Union. Geodynamics Series, pp Kennett, B., Engdahl, E., Buland, R., Constraints on seismic velocities in the Earth from travel-times. Geophys J Int 122, Kesson, S., Gerald, J.F., Shelley, J., Mineralogy and dynamics of a pyrolite lower mantle. Nature 393, Knittle, E., Jeanloz, R., Synthesis and equation of state of (Mg,Fe)SiO 3 perovskite to over 100 gigapascals. Science 235, Koci, L., Vitos, L., Ahuja, R., Ab initio calculations of the elastic properties of ferropericlase 27
28 Mg 1 x Fe x O(x 0.25). Phys. Earth Planet. Inter. 164, Kohlstedt, D., Zimmerman, M., Rheology of partially molten mantle rocks. Annu Rev Earth Pl Sc 24, Kohn, W., Sham, L., Self-consistent equations including exchange and correlation effects. Phys. Rev 140, A1133 A1138. Komabayashi, T., Hirose, K., Nagaya, Y., Sugimura, E., Ohishi, Y., High-temperature compression of ferropericlase and the effect of temperature on iron spin transition. Earth Planet Sci Lett 297, Komatitsch, D., Vinnik, L.P., Chevrot, S., SHdiff-SVdiff splitting in an isotropic Earth. J Geophys Res-Sol Ea 115, B Kubo, A., Kiefei, B., Shim, S.H., Shen, G., Prakapenka, V.B., Duffy,T.S.,2008.Rietveldstructurerefinement of MgGeO 3 post-perovskite phase to 1 Mbar. Am Mineral 93, Kustowski, B., Ekstrom, G., Dziewonski, A., Anisotropic shear-wave velocity structure of the Earth s mantle: A global model. J Geophys Res-Sol Ea 113, B Lay, T., Helmberger, D., The shear-wave velocity-gradient at the base of the mantle. J Geophys Res 88, Lay, T., Williams, Q., Garnero, E.J., Kellogg, L., Wysession, M.E., Seismic wave anisotropy in the D region and its implications, in: Gurnis, M., Wysession, M.E., Knittle, E., Buffett, B.A. (Eds.), The Core Mantle Boundary Region. American Geophysical Union, Washington, D.C., USA. Geodynamics Series 28, pp Lay, T., Young, C., Analysis of seismic SV waves in the core s penumbra. Geophys Res Lett 18, Lebensohn, R., Tomé, C., A self-consistent anisotropic approach for the simulation of plasticdeformation and texture development of polycrystals application to zirconium alloys. Acta Metallurgica Et Materialia 41, Lekic, V., Panning, M., Romanowicz, B., A simple method forimprovingcrustalcorrectionsin waveform tomography. Geophys J Int 182, Li, L., Weidner, D.J., Brodholt, J.P., Alfe, D., Price, G.D., Caracas,R.,Wentzcovitch,R.,2006a.Elasticity of CaSiO 3 perovskite at high pressure and high temperature. Phys. Earth Planet. Inter. 155, Li, L., Weidner, D.J., Brodholt, J.P., Alfe, D., Price, G.D., Caracas,R.,Wentzcovitch,R.,2006b.Phasestability of CaSiO 3 perovskite at high pressure and temperature: Insights from ab initio molecular dynamics. Phys. Earth Planet. Inter. 155, Lin, J.F., Tsuchiya, T., Spin transition of iron in the Earth s lower mantle. Phys. Earth Planet. Inter. 170, Lithgow-Bertelloni, C., Richards, M., The dynamics of CenozoicandMesozoicplatemotions. Rev. Geophys. 36, Long, M.D., Complex anisotropy in D beneath the eastern pacific from SKS-SKKS splitting discrepancies. Earth Planet Sci Lett 283, Long, M.D., Xiao, X., Jiang, Z., Evans, B., Karato, S., Lattice preferred orientation in deformed polycrystalline (Mg,Fe)O and implications for seismic anisotropy in D.Phys.EarthPlanet.Inter.156, Mainprice, D., Silver, P., Interpretation of SKS-waves using samples from the subcontinental lithosphere. Mainprice, D., Tommasi, A., Ferre, D., Carrez, P., Cordier, P., Predicted glide systems and crystal preferred orientations of polycrystalline silicate Mg-perovskite at high pressure: Implications for the seismic anisotropy in the lower mantle. Earth Planet Sci Lett 271, Mao, W.L., Meng, Y., Mao, H., Elastic anisotropy of ferromagnesian post-perovskite in Earth s D layer. Phys. Earth Planet. Inter. 180, Marquardt, H., Speziale, S., Reichmann, H.J., Frost, D.J., Schilling, F.R., Single-crystal elasticity of (Mg 0.9 Fe 0.1 )O to 81 GPa. Earth Planet Sci Lett 287, Matzel, E., Sen, M., Grand, S.P., Evidence for anisotropy in the deep mantle beneath Alaska. Geophys Res Lett 23,
29 Maupin, V., On the possibility of anisotropy in the D layer as inferred from the polarization of diffracted S waves. Phys. Earth Planet. Inter. 87, Maupin, V., Garnero, E.J., Lay, T., Fouch, M.J., Azimuthal anisotropy in the D layer beneath the Caribbean. J Geophys Res-Sol Ea 110, B McDonough, W., Sun, S., The composition of the Earth. Chem Geol 120, McNamara, A., van Keken, P., Karato, S., Development ofanisotropicstructureintheearth slower mantle by solid-state convection. Nature 416, McNamara, A.K., van Keken, P., Karato, S., Development offinitestrainintheconvectinglower mantle and its implications for seismic anisotropy. J Geophys Res-Sol Ea 108, Meade, C., Silver, P.G., Kaneshima, S., Laboratory and seismologicalobservationsoflowermantle isotropy. Geophys Res Lett 22, Merkel, S., Kubo, A., Miyagi, L., Speziale, S., Duffy, T.S., Mao, H., Wenk, H.R., Plastic deformation of MgGeO 3 post-perovskite at lower mantle pressures. Science 311, Merkel, S., McNamara, A.K., Kubo, A., Speziale, S., Miyagi, L., Meng, Y., Duffy, T.S., Wenk, H.R., Deformation of (Mg,Fe)SiO 3 post-perovskite and D anisotropy. Science 316, Merkel, S., Wenk, H.R., Badro, J., Montagnac, G., Gillet, P., Mao, H., Hemley, R., Deformationof (Mg 0.9,Fe 0.1 )SiO 3 Perovskite aggregates up to 32 GPa. Earth Planet Sci Lett 209, Merkel, S., Wenk, H.R., Shu, J., Shen, G., Gillet, P., Mao, H., Hemley,R.,2002.Deformationofpolycrystalline MgO at pressures of the lower mantle. J Geophys Res-Sol Ea 107, Metsue, A., Carrez, P., Mainprice, D., Cordier, P., Numerical modelling of dislocations and deformation mechanisms in CaIrO 3 and MgGeO 3 post-perovskites Comparison with MgSiO 3 post-perovskite. Mitrovica, J.X., Forte, A.M., A new inference of mantle viscositybaseduponjointinversionof convection and glacial isostatic adjustment data. Earth Planet Sci Lett 225, Miyagi, L., Kanitpanyacharoen, W., Kaercher, P., Lee, K.K.M., Wenk, H.R., Slip systems in MgSiO 3 post-perovskite: Implications for D anisotropy. Science 329, Miyagi, L., Nishlyama, N., Wang, Y., Kubo, A., West, D.V., Cava, R.J., Duffy, T.S., Wenk, H.R., Deformation and texture development in CaIrO 3 post-perovskite phase up to 6 GPa and 1300 K. Earth Planet Sci Lett 268, Montagner, J.P., Kennett, B., How to reconcile body-wave and normal-mode reference earth models. Geophys J Int 125, Montelli, R., Nolet, G., Dahlen, F., Masters, G., Engdahl, E., Hung, S., Finite-frequency tomography reveals a variety of plumes in the mantle. Science 303, Moore, M., Garnero, E.J., Lay, T., Williams, Q., Shear wave splitting and waveform complexity for lowermost mantle structures with low-velocity lamellae and transverseisotropy. JGeophysRes-SolEa 109, B Murakami, M., Hirose, K., Kawamura, K., Sata, N., Ohishi, Y., Post-perovskitephasetransitionin MgSiO 3.Science304, Murakami, M., Hirose, K., Sata, N., Ohishi, Y., Post-perovskite phase transition and mineral chemistry in the pyrolitic lowermost mantle. Geophys Res Lett 32, L Niu, F., Perez, A., Seismic anisotropy in the lower mantle: A comparison of waveform splitting of SKS and SKKS. Geophys Res Lett 31, L Niwa, K., Yagi, T., Ohgushi, K., Merkel, S., Miyajima, N., Kikegawa, T., Lattice preferred orientation in CaIrO 3 perovskite and post-perovskite formed by plastic deformation under pressure. Phys Chem Miner 34, Nowacki, A., Wookey, J., Kendall, J.M., Deformation ofthelowermostmantlefromseismicanisotropy. Nature 467, Nye, J., Physical properties of crystals: their representation by tensors and matrices. Oxford science publications, Clarendon Press. Oganov, A., Brodholt, J., Price, G., The elastic constants of MgSiO 3 perovskite at pressures and temperatures of the Earth s mantle. Nature 411, Oganov, A., Martonak, R., Laio, A., Raiteri, P., Parrinello, M.,2005. AnisotropyofEarth sd layer and 29
30 stacking faults in the MgSiO 3 post-perovskite phase. Nature 438, Oganov, A., Ono, S., Theoretical and experimental evidence for a post-perovskite phase of MgSiO 3 in Earth s D layer. Nature 430, Ohta, K., Hirose, K., Lay, T., Sata, N., Ohishi, Y., Phase transitions in pyrolite and MORB at lowermost mantle conditions: Implications for a MORB-rich pile above the core-mantle boundary. Earth Planet Sci Lett 267, Ohtani, E., Sakai, T., Recent advances in the study of mantle phase transitions. Phys. Earth Planet. Inter. 170, Okada, T., Yagi, T., Niwa, K., Kikegawa, T., Lattice-preferred orientations in post-perovskite-type MgGeO 3 formed by transformations from different pre-phases. Phys. Earth Planet. Inter. 180, Ono, S., Ito, E., Katsura, T., Mineralogy of subducted basaltic crust (MORB) from 25 to 37 GPa, and chemical heterogeneity of the lower mantle. Earth Planet SciLett190, Ono, S., Oganov, A., In situ observations of phase transition between perovskite and CaIrO 3 -type phase in MgSiO 3 and pyrolitic mantle composition. Earth Planet Sci Lett 236, Panning, M., Romanowicz, B., Inferences on flow at the base of Earth s mantle based on seismic anisotropy. Science 303, Panning, M., Romanowicz, B., A three-dimensional radially anisotropic model of shear velocity in the whole mantle. Geophys J Int 167, Perdew, J.P., Ruzsinszky, A., Density functional theory of electronic structure: A short course for mineralogists and geophysicists, in: Wentzcovitch, R., Stixrude, L. (Eds.), Theoretical And Computational Methods In Mineral Physics: Geophysical Applications. volume 71 of Reviews in Mineralogy & Geochemistry, pp Pulliam, J., Sen, M., Seismic anisotropy in the core-mantle transition zone. Geophys J Int 135, Restivo, A., Helffrich, G., Core-mantle boundary structure investigated using SKS and SKKS polarization anomalies. Geophys J Int 165, Ricolleau, A., Fei, Y., Cottrell, E., Watson, H., Deng, L., Zhang, L., Fiquet, G., Auzende, A.L., Roskosz, M., Morard, G., Prakapenka, V.B., Density profile of pyrolite under the lower mantle conditions. Geophys Res Lett 36, L Ringwood, A., A model for the upper mantle. J Geophys Res 67, Ritsema, J., Evidence for shear velocity anisotropy in thelowermostmantlebeneaththeindianocean. Geophys Res Lett 27, Ritsema, J., van Heijst, H., Woodhouse, J.H., Complex shear wave velocity structure imaged beneath Africa and Iceland. Science 286, Ritsema, J., Lay, T., Garnero, E.J., Benz, H., Seismic anisotropy in the lowermost mantle beneath the Pacific. Geophys Res Lett 25, Rokosky, J.M., Lay, T., Garnero, E.J., Small-scale lateral variations in azimuthally anisotropic D structure beneath the Cocos Plate. Earth Planet Sci Lett 248, Rokosky, J.M., Lay, T., Garnero, E.J., Russell, S., High-resolution investigation of shear wave anisotropy in D beneath the Cocos Plate. Geophys Res Lett 31, L Royer, D., Dieulesaint, E., Elastic Waves in Solids I: Free and guided propagation. Advanced texts in physics, Springer. Russell, S., Lay, T., Garnero, E.J., Seismic evidence for small-scale dynamics in the lowermost mantle at the root of the Hawaiian hotspot. Nature 396, Russell, S., Lay, T., Garnero, E.J., Small-scale lateral shear velocity and anisotropy heterogeneity near the core-mantle boundary beneath the central Pacific imaged using broadband ScS waves. J Geophys Res-Sol Ea 104, Rümpker, G., Tommasi, A., Kendall, J.M., Numerical simulations of depth-dependent anisotropy and frequency-dependent wave propagation effects. J Geophys Res-Sol Ea 104, Savage, M., Seismic anisotropy and mantle deformation: What have we learned from shear wave splitting? Rev. Geophys. 37,
31 Sayers, C., Elastic anisotropy of short-fibre reinforced composites. Int. J. Solids Structures 100, Shim, S.H., The postperovskite transition. Annu Rev Earth Pl Sc 36, Silver, P.G., Chan, W.W., Shear-wave splitting and subcontinental mantle deformation. J Geophys Res-Sol Ea 96, Silver, P.G., Savage, M., The interpretation of shear-wave splitting parameters in the presence of two anisotropic layers. Geophys J Int 119, Simmons, N.A., Forte, A.M., Grand, S.P., Joint seismic, geodynamic and mineral physical constraints on three-dimensional mantle heterogeneity: Implications for the relative importance of thermal versus compositional heterogeneity. Geophys J Int 177, Sinmyo, R., Hirose, K., Nishio-Hamane, D., Seto, Y., Fujino, K., Sata, N., Ohishi, Y., Partitioning of iron between perovskite/postperovskite and ferropericlase in the lower mantle. J Geophys Res-Sol Ea 113, B Speziale, S., Zha, C., Duffy, T., Hemley, R., Mao, H., Quasi-hydrostatic compression of magnesium oxide to 52 GPa: Implications for the pressure-volume-temperature equation of state. J Geophys Res-Sol Ea 106, Stackhouse, S., Brodholt, J.P., Price, G.D., 2005a. High temperature elastic anisotropy of the perovskite and post-perovskite Al 2 O 3.GeophysResLett32,L Stackhouse, S., Brodholt, J.P., Price, G.D., Elastic anisotropy of FeSiO 3 end-members of the perovskite and post-perovskite phases. Geophys Res Lett 33, L Stackhouse, S., Brodholt, J.P., Wookey, J., Kendall, J.M., Price, G.D., 2005b. The effect of temperature on the seismic anisotropy of the perovskite and post-perovskite polymorphs of MgSiO 3.EarthPlanetSci Lett 230, Stixrude, L., de Koker, N., Sun, N., Mookherjee, M., Karki, B.B., Thermodynamics of silicate liquids in the deep Earth. Earth Planet Sci Lett 278, Stixrude, L., Lithgow-Bertelloni, C., Kiefer, B., Fumagalli, P., Phase stability and shear softening in CaSiO 3 perovskite at high pressure. Phys. Rev. B 75, Tackley, P., Mantle convection and plate tectonics: Toward an integrated physical and chemical theory. Science 288, Tanaka, S., Constraints on the core-mantle boundary topography from P4KP-PcP differential travel times. J Geophys Res-Sol Ea 115, B Tandon, G., Weng, G., The effect of aspect ratio of inclusions on the elastic properties of unidirectionally aligned composites. Polym Composite 5, Tateno, S., Hirose, K., Sata, N., Ohishi, Y., Determination of post-perovskite phase transition boundary up to 4400 K and implications for thermal structure in D layer. Earth Planet Sci Lett 277, Teanby, N., Kendall, J.M., der Baan, M.V., Automation of shear-wave splitting measurements using cluster analysis. B Seismol Soc Am 94, Thomas, C., Kendall, J.M., The lowermost mantle beneath northern Asia - II. Evidence for lowermantle anisotropy. Geophys J Int 151, Thomas, C., Wookey, J., Simpson, M., D anisotropy beneath Southeast Asia. Geophys Res Lett 34, L Thomsen, L., Weak elastic anisotropy. Geophysics 51, Tikoff, B., Fossen, H., Three-dimensional reference deformations and strain facies. Journal of Structural Geology 21, Trampert, J., Deschamps, F., Resovsky, J., Yuen, D., Probabilistic tomography maps chemical heterogeneities throughout the lower mantle. Science 306, Tromp, J., Inner-core anisotropy and rotation. Annu Rev Earth Pl Sc 29, Trønnes, R.G., Structure, mineralogy and dynamics of the lowermost mantle. Miner Petrol 99, Tsuchiya, T., First-principles prediction of the P-V-T equation of state of gold and the 660-km discontinuity in Earth s mantle. J Geophys Res-Sol Ea 108,
32 Tsuchiya, T., Tsuchiya, J., Umemoto, K., Wentzcovitch, R., Phase transition in MgSiO 3 perovskite in the earth s lower mantle. Earth Planet Sci Lett 224, Usui, Y., Hiramatsu, Y., Furumoto, M., Kanao, M., Evidence of seismic anisotropy and a lower temperature condition in the D layer beneath Pacific Antarctic Ridge in the Antarctic Ocean. Phys. Earth Planet. Inter. 167, Vinnik, L.P., Breger, L., Romanowicz, B., Anisotropic structuresatthebaseoftheearth smantle. Nature 393, Vinnik, L.P., Kind, R., Kosarev, G., Makeyeva, L., Azimuthal anisotropy in the lithosphere from observations of long-period S-waves. Geophys J Int 99, Vinnik, L.P., Romanowicz, B., Stunff, Y.L., Makeyeva, L., Seismic anisotropy in the D layer. Geophys Res Lett 22, Walker, A., Carrez, P., Cordier, P., Atomic-scale models of dislocation cores in minerals: progress and prospects. Mineral. Mag. 74, Walte, N.P., Heidelbach, F., Miyajima, N., Frost, D.J., Texture development and TEM analysis of deformed CaIrO 3 : Implications for the D layer at the core-mantle boundary. Geophys Res Lett 34, L Walte, N.P., Heidelbach, F., Miyajima, N., Frost, D.J., Rubie, D.C., Dobson, D.P., Transformation textures in post-perovskite: Understanding mantle flow in the D layer of the Earth. Geophys Res Lett 36, L Wang, Y., Wen, L., Complex seismic anisotropy at the border of a very low velocity province at the base of the Earth s mantle. J Geophys Res-Sol Ea 112, B Wenk, H.R., Bennett, K., Canova, G., Molinari, A., Modeling plastic-deformation of peridotite with the self-consistent theory. Journal Of Geophysical Research-Solid Earth And Planets 96, Wenk, H.R., Speziale, S., McNamara, A.K., Garnero, E.J., Modeling lower mantle anisotropy development in a subducting slab. Earth Planet Sci Lett 245, Wentzcovitch, R., Karki, B., Cococcioni, M., de Gironcoli, S., Thermoelastic properties of MgSiO 3 - perovskite: Insights on the nature of the Earth s lower mantle. Phys. Rev. Lett. 92, Wentzcovitch, R., Tsuchiya, T., Tsuchiya, J., MgSiO 3 postperovskite at D conditions. P Natl Acad Sci Usa 103, Wookey, J., Kendall, J.M., Seismic anisotropy of post-perovskite and the lowermost mantle, in: Hirose, K., Brodholt, J., Lay, T., Yuen, D.A. (Eds.), Post-Perovksite: The Last Mantle Phase Transition. American Geophysical Union Geophysical Monograph 174, Washington, USA, pp Wookey, J., Kendall, J.M., Constraints on lowermost mantle mineralogy and fabric beneath Siberia from seismic anisotropy. Earth Planet Sci Lett 275, Wookey, J., Kendall, J.M., Rumpker, G., 2005a. Lowermost mantle anisotropy beneath the north Pacific from differential S ScS splitting. Geophys J Int 161, Wookey, J., Stackhouse, S., Kendall, J.M., Brodholt, J.P., Price, G.D., 2005b. Efficacy of the post-perovskite phase as an explanation for lowermost-mantle seismic properties. Nature 438, Wysession, M., Langenhorst, A., Fouch, M.J., Fischer, K.M., Al-Eqabi, G., Shore, P., Clarke, T., Lateral variations in compressional/shear velocities at the base of the mantle. Science 284, Wysession, M.E., Lay, T., Revenaugh, J., Williams, Q., Garnero, E.J., Jeanloz, R., Kellogg, L., The D discontinuity and its implications, in: Gurnis, M., Wysession, M.E., Knittle, E., Buffett, B.A. (Eds.), The Core Mantle Boundary Region. American Geophysical Union, Washington, D.C., USA. Geodynamics Series, pp Yamazaki, D., Karato, S., Fabric development in (Mg,Fe)O during large strain, shear deformation: implications for seismic anisotropy in Earth s lower mantle. Phys. Earth Planet. Inter. 131, Yamazaki, D., Karato, S., Lattice-preferred orientation of lower mantle materials and seismic anisotropy in the D layer, in: Post-Perovksite: The Last Mantle Phase Transition. American Geophysical Union, Washington, D.C., USA. Geophysical Monograph, pp Yamazaki, D., Yoshino, T., Ohfuji, H., Ando, J., Yoneda, A., Origin of seismic anisotropy in the D layer inferred from shear deformation experiments on post-perovskite phase. Earth Planet Sci Lett 252, 32
33
34 1335 Figure and table captions Figure 1: Transverse isotropy, or hexagonal symmetry, and wave propagation through such a medium. On the left, the rotational axis of symmetry is vertical, leading to vertical transverse isotropy (VTI). On the right, the axis is tilted away from the vertical, leading to tilted transverse isotropy (TTI), or simply a general case of transverseisotropy(ti).waves within the plane of isotropy are split into orthogonal fast (blue) and slow (red) waves. The dip θ and azimuth a (the dip direction) of the plane of isotropy define the TTI orientation. Figure 2: Shear wave splitting in an anisotropic medium. The unsplit incoming shear wave encounters the anisotropic medium, and is split into two orthogonal waves, fast (S 1,blue) and slow (S 2,red). Thedelaybetweenthetwoismeasuredasδt, andthefastorientation in the ray frame (measured relative to the vertical) is φ. Figure 3: Representation of elasticity tensor by the variation of V P and V S with direction. The leftmost diagram explains the wave anisotropy plots on the right. The tensor in the three cartesian directions 1, 2 and 3 is represented by an upper hemisphere projection of the variation of wave speed with direction. The top of the projection is the 1-direction, left the 2-direction, and out of the page the 3-direction. At each point (each inclination from the 3-axis, i, andazimuthclockwiseawayfrom1inthe1 2plane,a), V P (km s 1 )and δv S (%) are shown by colour according to the scale at the bottom. On theδv S plot, the orientation of the fast shear wave as projected onto the upper hemisphereisshownbythe black ticks. Shown are the average C ij for a selection of five kimberlites from Mainprice and Silver (1993), where the X-, Y- and Z-directions are oriented to the 1-, 2- and 3-directions respectively. 34
35 Figure 4: Raypaths of some of the body wave phases used to study D anisotropy. Figure 5: Shear wave splitting parameters of SKS and S phases from upper mantlean- isotropy. The two phases have slightly different slownesses, correspondingtoadifferent incidence angle beneath the station. The upper hemisphere phase velocity plots, left, show the case of TI with a symmetry axis parallel to 1 (representing north). The2-axispoints west and 3 is up (out of the page). The elastic constants are those of Mainprice and Silver (1993) as shown in Figure 3, but with an imposed hexagonal symmetry. The circles at the centre of the δv S plot show the range of incidence angles of SKS (red, innermost), S (blue, outermost) and ScS (black) phases at distances described in the text. The splitting parameters corresponding to these distances and backazimuths and a250km-thicklayerareshown on the right for SKS (red) and S (blue). There is almost no variation in SKS, and for φ the two phases experience indistinguishable splitting. For δt, thelargestdifferenceisabout 0.3 s, and within typical errors the two phases would exhibit the same splitting parameters. The parameters for ScS lie between the two other phases. Figure 6: SH-SV traveltime analysis, Figure 5 from Garnero and Lay (1997). The authors examine shear waves travelling along the CMB beneath Alaska from two events in 1970 and 1973, at distances TheonsetoftheSwaveonthetransversecomponent (SH) is around 4 s before that of the radial component (SV). Because there is minimal energy on the transverse component for the SKS arrival, it appears that negligible upper mantle anisotropy affects the signal. Hence the authors conclude that the two components have experienced different velocities in the lowermost mantle (V SH >V SV ). 35
36 Figure 7: Summary of previous studies of D anisotropy. Numbered regions corresponding to Table 1 are shown in outline, plotted on top of a global tomographic model of V S at 2750 km (Becker and Boschi, 2002) (colour indicates the variation away from PREM (Dziewonski and Anderson, 1981) as per the legend). Regions where the dominant signal is V SH >V SV are shown in blue; those where V SH <V SV are in purple. Where a region is shown with red and blue stripes, both situations have been seen, as well as isotropy. Yellow areas indicate regions where the orientation of an assumed TTI fabric has been determined: this symbol shows the dip direction of the plane of isotropy with a tick of varying length, as shown in the legend (longer is steeper dip). In regions where one azimuth of raypaths show fast directions which are not CMB-parallel or -perpendicular, they also have a dip symbol as for the TTI regions, with the long bar parallel to the ray path in D. Regions with no fill show isotropy, and grey-filled regions show complex isotropy, either from SKS SKKS differential splitting (see Table 1), or because no studies comparing V SH to V SV have been undertaken. Figure 8: Average depth profile of ξ = VSH/V 2 SV 2 from the SAW642AN model of Panning and Romanowicz (2006) (red) and S362WMANI of Kustowski et al. (2008)(blue). For SAW642AN The uppermost and lowermost mantle show ξ>1, whilst most of the lower mantle is approximately isotropic. S362WMANI does not show the same dominant signal in D. 36
37 Figure 9: Example of a shear wave splitting measurement, slightly modified from Supplementary Figure 3 of Nowacki et al. (2010). The measurement ismadeatfcc(fort Churchill, Manitoba, Canada) on the ScS phase from an 645 km-deep earthquake beneath Brazil at 13:27 on 21 July, 2007, and pre-corrected for upper mantle anisotropy beneath the receiver. Panel A shows the original three-component seismogram, with the predicted ScS arrival time for a 1 D global velocity model, and the arrival itself. Second panel (B) shows the horizontal components when rotated to the fast orientation φ, asfoundintheanalysis, before and after time-shifting the slow component forward by thedelaytimefoundinthe analysis. Lower left (C) shows the fast and slow waves before (upper left) and after (upper right) shifting by δt. Thelowersubpanelsshowthehorizontalparticlemotionbefore and after correction with the optimum (φ, δt). Last panel (D) shows the λ 2 surface (corresponding to misfit) in φ δt space, with the optimum splitting parameters given by the blue cross, and surrounding 95 % confidence interval (thick contour). Subplots to the right show the result of cluster analysis (Teanby et al., 2004) the single cluster showsthisisastableresult. Figure 10: Comparison of SH SV traveltime analysis and shear wave splitting for a transversely isotropic (TI) medium. On the left (A), the plane of isotropy is shown by the grey circle, dipping at an angle from the horizontal. This defines the orientation of the anisotropy. The ray frame fast orientation of the split shear wave, φ,iscontrolledbytheangle between the ray and the dip direction of the plane of isotropy, α, sothatφ is along the line of intersection between the plane of isotropy and the plane normal to the ray path. On the right (B) is shown the radial (R) and transverse (T) components of the split shear wave for various φ.forallcasesδt =1.5s, as shown by the dashed lines. Measuring the delay time directly on the two components only gives the correct amount and orientation of splitting for the special cases of φ =0 or 90.Within 15 of 0 or 90,suchmeasurementsarestill useful for detecting the presence of anisotropy, but do not provide much information about the symmetry. Slightly modified from Wookey and Kendall (2007). Figure 11: Structure of MgSiO 3 -perovskite and -post-perovskite. Yellow spheres are Mg ions; SiO 6 octahedra are shown in blue. Figure 12: Proportions of phases present in the lower mantle for pyrolite and MORB compositions (after Ono and Oganov (2005) and Hirose (2006), andpartlybasedontrønnes (2010)). Yellow regions show aluminous phase regions, whilst grey regions show phases of silica. Sloping phase boundaries represent the range of depths over which the transition between the phases probably occurs. Ca(Fe,Ti) 2 O 4 -type Al-bearing phase refers to the uncertainty over the structure of the phase. Abbreviations are: Ca-pv: CaSiO 3 -perovskite; pv: (Mg,Fe)(Si,Al)SiO 3 -perovskite; ppv: (Mg,Fe)(Si,Al)SiO 3 -post-perovskite; st: staurolite; α-pbo 2 :SiO 2 in the α-pbo 2 form (also called columbite structure). 37
38 Figure 13: Elastic P and S wave anisotropy for pv from calculations at lower mantle conditions. (Top: Wookey et al. (2005b); bottom: Wentzcovitch et al. (2006).) Plots on the left show upper hemisphere, equal area projections of V P with direction within the orthorhombic crystal. The 1, 2 and 3 axes are shown, corresponding to the [100], [010] and [001] directions respectively: 1 is up, 2 is left and 3 is out of thepage. ColourindicatesV P as shown in the scale bar at the bottom. Plots on the right show δv S (colour as per the scale bar) and the fast shear wave orientation with direction (blackticks). Becauseofthe orthorhombic symmetry, each plot only varies within each quadrant. Figure 14: Elastic P and S wave anisotropy for ppv from experiments and calculations at T =4000K(toptobottom: Stackhouseetal.,2005b;Wentzcovitch et al., 2006; Mao et al., 2010). Features as for Figure 13. Figure 15: Elastic P and S wave anisotropy for fpc from ab initio calculations and experiment at lower mantle conditions. The three axes (1, 2 and 3) each corresponds to the 100 directions because of the cubic symmetry the plots only vary within each eighth of the upper hemisphere. Figure 16: Lattice preferred orientation (LPO) of crystals (A) and shape preferred orientation (SPO) of prolate (B) and oblate (C) slower isotropic inclusions in a faster anisotropic matrix (schematic). Spheres above are 3-D versions of the plots explained in Figure 3. They show the amount of shear wave anisotropy δv S by colour, and the fast shear wave orientation by black ticks. Note that the colour scales are different. Blue arrows show a direction of flow which may align the crystals or inclusions, and thus how this might be interpreted from measuring the anisotropy. Figure 17: Inferred TTI planes beneath the Caribbean, taken from Supplementary Information to Nowacki et al. (2010). The bar symbols show the direction of dip with the short tick, with the dip in degrees of the plane of isotropy given by the numbers. Beneath, colour shows the variation of V S in the S20RTS model (Ritsema et al., 1999) at 2750 km depth. The coloured areas labelled W, S and E show the approximate horizontal region of sensitivity of ScS at 2750 km. Thin black lines show individual raypaths of ScS in the bottom 250 km of the mantle. Figure 18: TTI plane of isotropy in region E of Nowacki et al. (2010), shown by schematic layering of the material. Rays from South America travelling northshowφ 90,whilst those from the Mid-Atlantic Ridge (MAR) travelling northwest exhibit φ =45.Assuming hexagonal symmetry where δ ɛ, the fast orientation is in the plane of isotropy in each case. Whilst TTI is a possible explanation, it is only one type of anisotropy which can produce the observations with two azimuths of waves. 38
39 Figure 19: Shear wave anisotropy for horizontal (left) and inclined (right) melt inclusions in D.Thecartoonsbelowshowthealignmentofoblatespheroidswhich respond to the motion of the mantle differently. In both cases, the sense of shear is top to the north (approximately right here), shown by the arrow. On the left, the inclusions are aligned parallel to the horizontal flow and produce VTI. On the right, the melt inclusions dip at 25 towards the sense of shear, opposite the sense of flow. For most azimuths of horizontally-propagating shear waves, this produces splitting with the fast orientation parallel to the alignment of the oblate inclusions. As discussed in the text, this is compatible with observations beneath Siberia and the Caribbean. The elastic constants are calculated using effective medium theory (Tandon and Weng, 1984) for an arbitrary set of lowermost mantle-like properties (matrix: V P =14kms 1, V S =7.3 kms 1, ρ =5500kgm 3 ;inclusions: V P =7kms 1, V S =0kms 1, ρ =5500kgm 3,aspectratio=0.01, volume fraction = 0.005). Figure 20: Variation of shear wave splitting with direction for MgSiO 3 post-perovskite (elastic constants of Stackhouse et al. 2005b at 3000 K). Colour indicates the strength of shear wave anisotropy in a given direction (δv S )asperthescalebar. Theblackbarsshowthe orientation of the fast shear wave. The crystallographic directions are indicated. (A) Shear wave splitting for unaltered single-crystal constants. There is strong (δv S =20%)anisotropy for rays along [100] and 111. (B) Anisotropy for a planar average of the constants when rotated around [001]. Strong (δv S =15%)splittingoccurswithintheplanenormalto[001], with fast directions also in the plane. However, this corresponds to an aggregate of perfect alignment of [001] directions of pure ppv, which does not occur in D. Figure 21: Upper hemisphere diagrams showing shear planes and slip directions which are compatible with the measurements of sub-caribbean D shear wave splitting of Nowacki et al. (2010). The schematic diagram on the left shows how to interpret the diagrams on the right: they show the upper hemisphere projection of the slip plane (coloured lines) and slip direction (black dots), hence the centre of the plots corresponds to the vertical direction; in this case the top of the diagrams is north. The elastic constants tested are those of Yamazaki et al. (2006), who deform ppv to produce an aggregate consistent with the dominant slip system in the crystal of [100](010). Three regions ( W, S and E ) are shown. Lighter colours show that more alignment of the phase via the slip system is required to produce the observed splitting larger splitting times are observed inregions.fortheseconstants, orientations of the shear plane dipping south or southeast can produce the observed splitting in regions S and E; horizontal shear can explain the splitting in region W. Figure 22: Flow chart showing the progression of calculations and assumptions required to predict flow from measurements of shear wave splitting. Table 1: Summary of previous studies of anisotropy in the lowermost mantle. 39
40 Table 2: Summary of inferred slip systems in MgSiO 3 post-perovskite and structural analogues from deformation experiments using the diamond-anvil cell (DAC), laser-heated diamond-anvil cell (LHDAC), Kawai-type and deformation-dia (D-DIA) apparatuses. 40
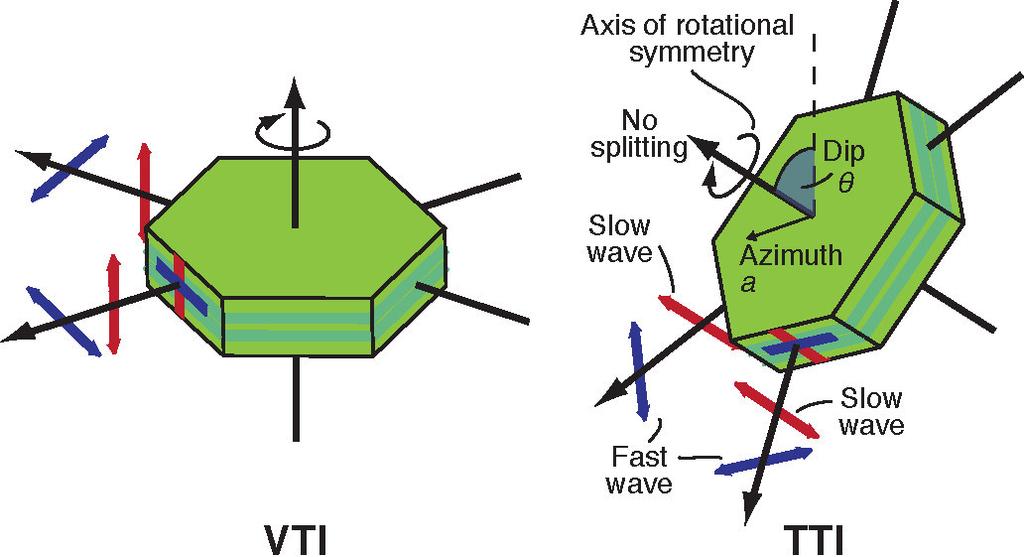
41
42

43

44
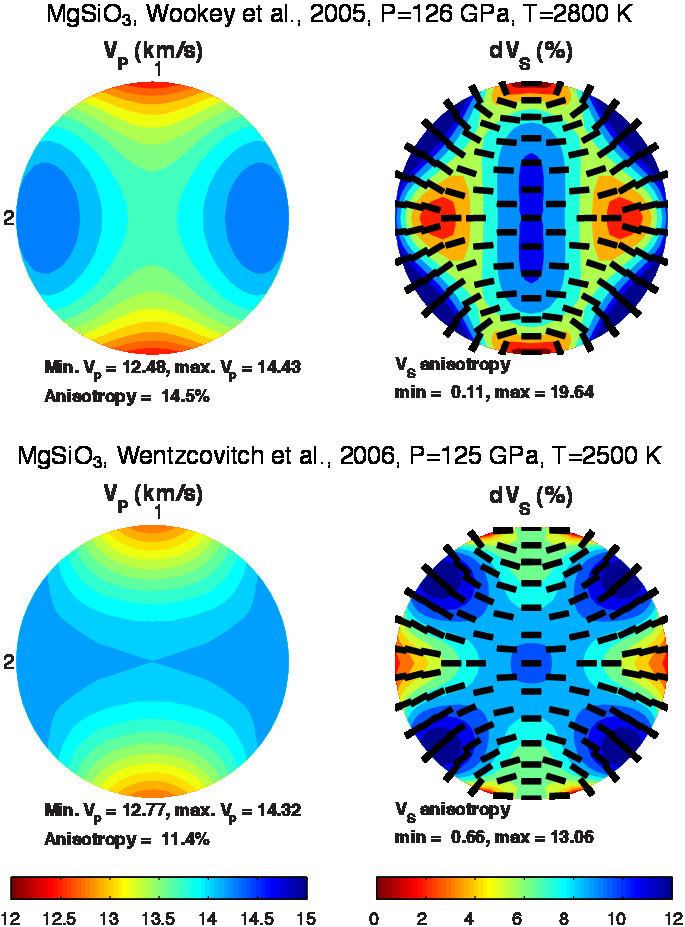
45

46

47

48

49
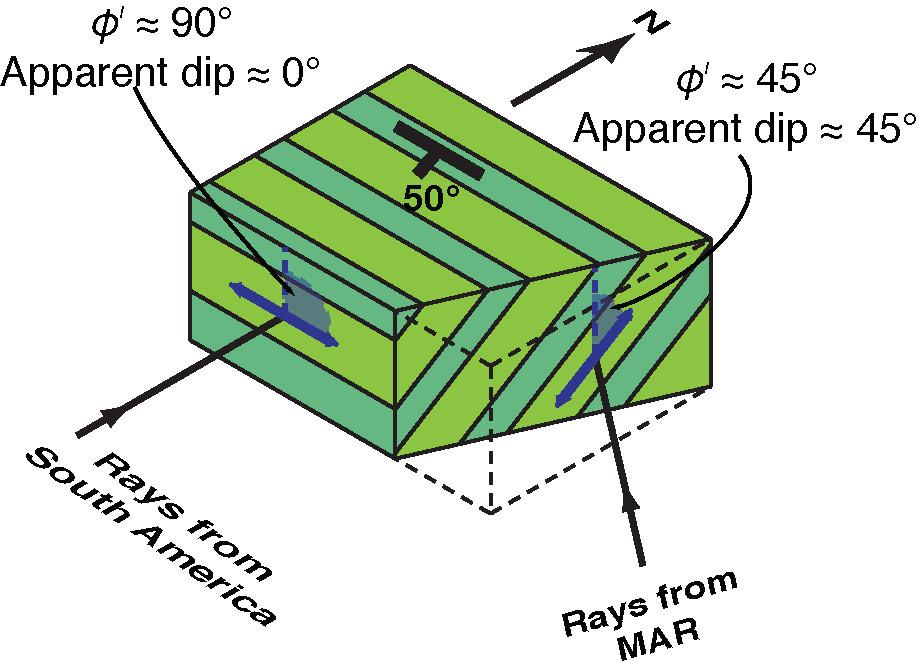
50

51
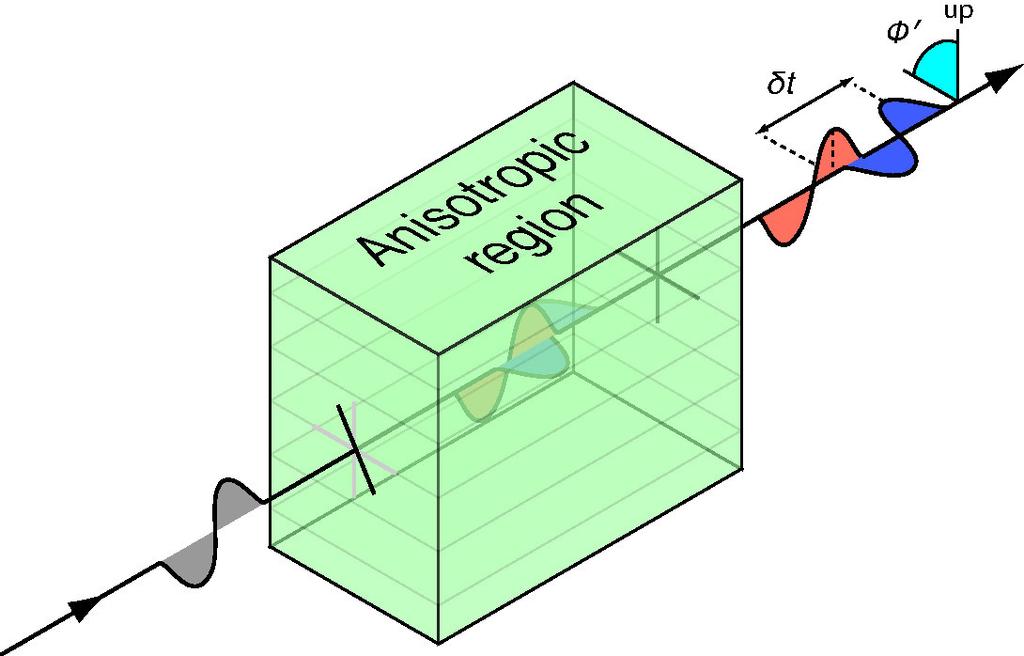
52
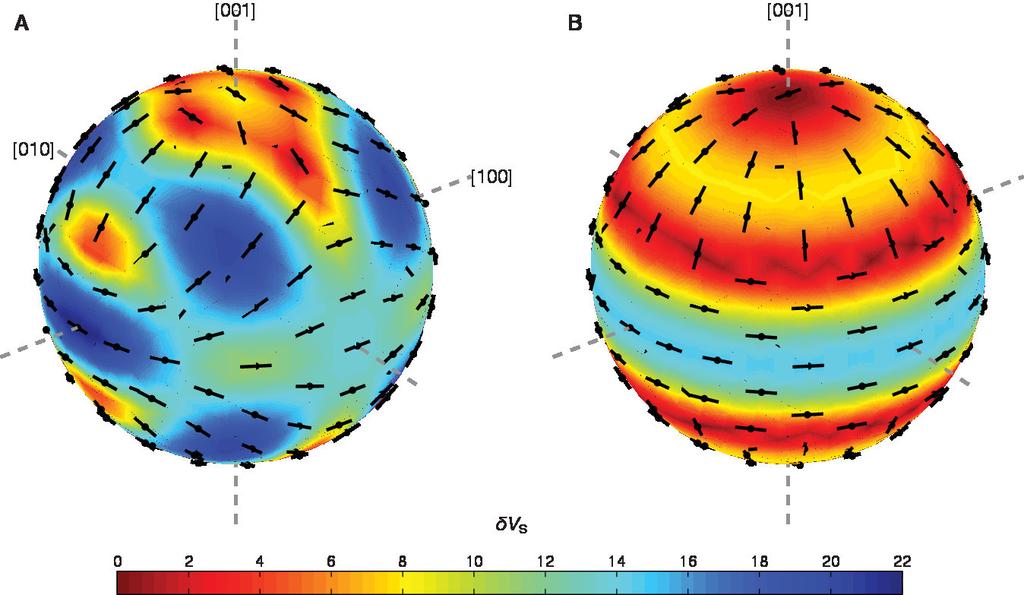
53
54
55

56
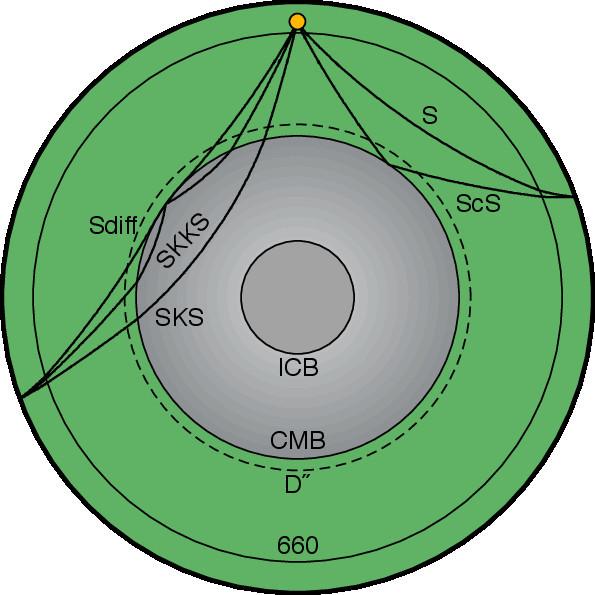
57

58
59

60
Investigating Causes of D Anisotropy
 Investigating Causes of D Anisotropy J.-M. Kendall and P. G. Silver in: The Core-Mantle Boundary Region, AGU, 1998. MDL 3/15/04 Although most of the lower mantle (below 660km) appears to be isotropic,
Seismology 5: Body wave anisotropy
 Seismology 5: Body wave anisotropy what it is, how we study it, and what it can tell us about flow in the deep Earth Maureen D. Long, Yale University CIDER 7/8/16 Road map for today s talk Part I: Some
Seismology and Deep Mantle Temperature Structure. Thorne Lay
 Seismology and Deep Mantle Temperature Structure Thorne Lay Travel time of seismic phases vs. angular distance PREM Preliminary Reference Earth Model Dziewonski and Anderson [1981, PEPI] Basic fact:
MYRES Seismic Constraints on Boundary Layers. Christine Thomas
 MYRES 2004 Seismic Constraints on Boundary Layers Christine Thomas Outline Seismic constraints: what can we resolve? how can we detect seismic structures? how well can we resolve these structures? (resolution
PEAT SEISMOLOGY Lecture 9: Anisotropy, attenuation and anelasticity
 PEAT8002 - SEISMOLOGY Lecture 9: Anisotropy, attenuation and anelasticity Nick Rawlinson Research School of Earth Sciences Australian National University Anisotropy Introduction Most of the theoretical
Post-perovskite 1. Galley Proofs
 16 September 2005 21:39 YB061180.tex McGraw Hill YB of Science & Technology Keystroked: 29/08/2005 Initial MS Page Sequence Stamp: 02350 Article Title: Post-perovskite Article ID: YB061180 1st Classification
Can seismic anisotropy in Dʺ be used to constrain flow patterns in the lowermost mantle?
 Can seismic anisotropy in Dʺ be used to constrain flow patterns in the lowermost mantle? Andrew Walker 1, Andy Nowacki 1, Alessandro Forte 2, James Wookey 1 and J.-Michael Kendall 1 1 School of Earth Sciences,
Auxiliary Material. Subduction of oceanic asthenosphere: evidence from sub-slab seismic anisotropy. Teh-Ru Alex Song, Hitoshi Kawakatsu
 Auxiliary Material Subduction of oceanic asthenosphere: evidence from sub-slab seismic anisotropy Teh-Ru Alex Song, Hitoshi Kawakatsu correspondence to: tehrusong@gmail.com 1 1. The effect of anisotropy
Mantle Anisotropy at Mid-Ocean Ridges
 Mantle Anisotropy at Mid-Ocean Ridges Andy Nowacki, Michael Kendall, James Wookey (Nowacki et al., EPSL, 2011) Plate spreading and seismic anisotropy Hess, 1964 MOR Anisotropy Anisotropy due to LPO versus
Chapter 12 Lecture. Earth: An Introduction to Physical Geology. Eleventh Edition. Earth s Interior. Tarbuck and Lutgens Pearson Education, Inc.
 Chapter 12 Lecture Earth: An Introduction to Physical Geology Eleventh Edition Earth s Interior Tarbuck and Lutgens Earth s Internal Structure Earth s interior can be divided into three major layers defined
What does Seismic Anisotropy tell us about the Lithosphere-Asthenosphere Boundary?
 What does Seismic Anisotropy tell us about the Lithosphere-Asthenosphere Boundary? Jean-Paul Montagner (1), Gael Burgos (1), Eric Beucler (2), Antoine Mocquet (2) and Yann Capdeville (2), Mathias Obrebski
Introduction to Seismology Spring 2008
 MIT OpenCourseWare http://ocw.mit.edu 1.510 Introduction to Seismology Spring 008 For information about citing these materials or our Terms of Use, visit: http://ocw.mit.edu/terms. 1.510 Introduction to
Azimuthal anisotropy in the D 00 layer beneath the Caribbean
 JOURNAL OF GEOPHYSICAL RESEARCH, VOL. 110,, doi:10.1029/2004jb003506, 2005 Azimuthal anisotropy in the D 00 layer beneath the Caribbean Valérie Maupin, 1 Edward J. Garnero, 2 Thorne Lay, 3 and Matthew
Tracing rays through the Earth
 Tracing rays through the Earth Ray parameter p: source receiv er i 1 V 1 sin i 1 = sin i 2 = = sin i n = const. = p V 1 V 2 V n p is constant for a given ray i 2 i 3 i 4 V 2 V 3 V 4 i critical If V increases
The Earth s Structure from Travel Times
 from Travel Times Spherically symmetric structure: PREM - Crustal Structure - Upper Mantle structure Phase transitions Anisotropy - Lower Mantle Structure D D - Structure of of the Outer and Inner Core
Geophysical Journal International
 Geophysical Journal International Geophys. J. Int. (2014) 199, 164 177 GJI Seismology doi: 10.1093/gji/ggu244 Synthetic seismic anisotropy models within a slab impinging on the core mantle boundary Sanne
3D IMAGING OF THE EARTH S MANTLE: FROM SLABS TO PLUMES
 3D IMAGING OF THE EARTH S MANTLE: FROM SLABS TO PLUMES Barbara Romanowicz Department of Earth and Planetary Science, U. C. Berkeley Dr. Barbara Romanowicz, UC Berkeley (KITP Colloquium 9/11/02) 1 Cartoon
Figures S1 S4 show the measurements taken from the synthetic vespagrams where a)
") Figures S1 S4 show the measurements taken from the synthetic vespagrams where a) is the differential travel time versus the Dʺ discontinuity height, b) is the differential travel time versus δv S, c) is
Figures S1 S4 show the measurements taken from the synthetic vespagrams where a) is the differential travel time versus the Dʺ discontinuity height, b) is the differential travel time versus δv S, c) is
Seismic Anisotropy and Mantle Flow in the Izu-Bonin-Mariana Subduction System
 Seismic Anisotropy and Mantle Flow in the Izu-Bonin-Mariana Subduction System Matthew J. Fouch (Department of Geological Sciences, Arizona State University, Tempe, AZ 85287, email: fouch@asu.edu) INTRODUCTION
Shear wave splitting and waveform complexity for lowermost mantle structures with low-velocity lamellae and transverse isotropy
 JOURNAL OF GEOPHYSICAL RESEARCH, VOL. 109,, doi:10.1029/2003jb002546, 2004 Shear wave splitting and waveform complexity for lowermost mantle structures with low-velocity lamellae and transverse isotropy
C3.4.1 Vertical (radial) variations in mantle structure
 variations in mantle structure") C3.4 Mantle structure Mantle behaves as a solid on short time scales (seismic waves travel through it and this requires elastic behaviour). Over geological time scales the mantle behaves as a very viscous
C3.4 Mantle structure Mantle behaves as a solid on short time scales (seismic waves travel through it and this requires elastic behaviour). Over geological time scales the mantle behaves as a very viscous
Textures in experimentally deformed olivine aggregates: the effects of added water and melt.
 Textures in experimentally deformed olivine aggregates: the effects of added water and melt. F. Heidelbach 1, a, B. Holtzman 2, b, S. Hier-Majumder 2, c and D. Kohlstedt 2, d 1 Bayerisches Geoinstitut,
Continent-sized anomalous zones with low seismic velocity at the base of Earth s mantle
 SUPPLEMENTARY INFORMATION DOI: 10.1038/NGEO2733 Continent-sized anomalous zones with low seismic velocity at the base of Earth s mantle Edward J. Garnero 1, Allen K. McNamara 1, and Sang-Heon D. Shim 1
Geophysical Journal International
 Geophysical Journal International Geophys. J. Int. (2013) 194, 1091 1118 Advance Access publication 2013 May 29 doi: 10.1093/gji/ggt152 The origin of D reflections: a systematic study of seismic array
Slabs, plumes and their interaction: new insights from global anisotropy tomography
 Slabs, plumes and their interaction: new insights from global anisotropy tomography Ana M G Ferreira Seismological Laboratory, Department of Earth Sciences University College London, UK Sung-Joon Chang,
Earth as a planet: Interior and Surface layers
 Earth as a planet: Interior and Surface layers Bibliographic material: Langmuir & Broecker (2012) How to build a habitable planet Internal structure of the Earth: Observational techniques Seismology Analysis
α phase In the lower mantle, dominant mineralogy is perovskite [(Mg,Fe)SiO 3 ] The pyrolite mantle consists of: 60% olivine and 40% pyroxene.
![α phase In the lower mantle, dominant mineralogy is perovskite [(Mg,Fe)SiO 3 ] The pyrolite mantle consists of: 60% olivine and 40% pyroxene.](/thumbs/78/77484223.jpg "α phase In the lower mantle, dominant mineralogy is perovskite [(Mg,Fe)SiO 3 ] The pyrolite mantle consists of: 60% olivine and 40% pyroxene.") Summary of Dan Shim s lecture on 3/1/05 Phase transitions in the Earth s mantle In this lecture, we focused on phase transitions associated with the transition zone 1. 410 km alpha olivine beta wadsleyite
Summary of Dan Shim s lecture on 3/1/05 Phase transitions in the Earth s mantle In this lecture, we focused on phase transitions associated with the transition zone 1. 410 km alpha olivine beta wadsleyite
Evaluating Contributions to SK K S Splitting from Lower Mantle Anisotropy: A Case Study from Station DBIC, Côte D Ivoire
 Bulletin of the Seismological Society of America, Vol. 102, No. 3, pp. 1030 1040, June 2012, doi: 10.1785/0120110255 E Evaluating Contributions to SK K S Splitting from Lower Mantle Anisotropy: A Case
Elastic anisotropy of D predicted from global models of mantle flow
 Article Volume 12, Number 10 14 October 2011 Q10006, doi:10.1029/2011gc003732 ISSN: 1525 2027 Elastic anisotropy of D predicted from global models of mantle flow A. M. Walker School of Earth Sciences,
Seismogram Interpretation. Seismogram Interpretation
 Travel times in the Earth Ray paths, phases and their name Wavefields in the Earth: SH waves, P-SV waves Seismic Tomography Receiver Functions Seismogram Example Long-period transverse displacement for
Sharpness of the D 00 discontinuity beneath the Cocos Plate: Implications for the perovskite to post-perovskite phase transition
 Click Here for Full Article GEOPHYSICAL RESEARCH LETTERS, VOL. 35, L03304, doi:10.1029/2007gl032465, 2008 Sharpness of the D 00 discontinuity beneath the Cocos Plate: Implications for the perovskite to
Multi-disciplinary Impact of the Deep Mantle Postperovskite
 Multi-disciplinary Impact of the Deep Mantle Postperovskite Phase Transition Thorne Lay 1 Dion Heinz 2 Miaki Ishii 3 Sang-Heon Shim 4 Jun Tsuchiya 5 Taku Tsuchiya 5 Renata Wentzcovitch 5 David Yuen 6 1
Chemical Composition of the Lower Mantle: Constraints from Elasticity. Motohiko Murakami Tohoku University
 Chemical Composition of the Lower Mantle: Constraints from Elasticity Motohiko Murakami Tohoku University Acknowledgements Jay D. Bass (University of Illinois) Stanislav V. Sinogeikin (University of Illinois)
Plate Tectonics. Structure of the Earth
 Plate Tectonics Structure of the Earth The Earth can be considered as being made up of a series of concentric spheres, each made up of materials that differ in terms of composition and mechanical properties.
Observation of shear-wave splitting from microseismicity induced by hydraulic fracturing: A non-vti story
 Observation of shear-wave splitting from microseismicity induced by hydraulic fracturing: A non-vti story Petr Kolinsky 1, Leo Eisner 1, Vladimir Grechka 2, Dana Jurick 3, Peter Duncan 1 Summary Shear
Reconciling the Post-Perovskite Phase With Seismological Observations of Lowermost Mantle Structure
 GM01018_CH11.qxd 20/10/07 1:53 PM Page 129 Reconciling the Post-Perovskite Phase With Seismological Observations of Lowermost Mantle Structure Thorne Lay Department of Earth and Planetary Sciences, University
Unit Topics. Topic 1: Earth s Interior Topic 2: Continental Drift Topic 3: Crustal Activity Topic 4: Crustal Boundaries Topic 5: Earthquakes
 The Dynamic Earth Unit Topics Topic 1: Earth s Interior Topic 2: Continental Drift Topic 3: Crustal Activity Topic 4: Crustal Boundaries Topic 5: Earthquakes Topic 1: Earth s Interior Essential Question:
Constraints on the Presence or Absence of Post-Perovskite in the Lowermost Mantle From Long-Period Seismology
 GM01018_CH14.qxd 20/10/07 1:56 PM Page 191 Constraints on the Presence or Absence of Post-Perovskite in the Lowermost Mantle From Long-Period Seismology Christine Houser* Department of Earth and Planetary
Lattice preferred orientation in deformed polycrystalline (Mg,Fe)O and implications for seismic anisotropy in D
O and implications for seismic anisotropy in D") Physics of the Earth and Planetary Interiors 156 (2006) 75 88 Lattice preferred orientation in deformed polycrystalline (Mg,Fe)O and implications for seismic anisotropy in D Maureen D. Long a,, Xiaohui
Physics of the Earth and Planetary Interiors 156 (2006) 75 88 Lattice preferred orientation in deformed polycrystalline (Mg,Fe)O and implications for seismic anisotropy in D Maureen D. Long a,, Xiaohui
Seismic characterization of mantle flow in subduction systems: Can we resolve a hydrated mantle wedge?
 Earth and Planetary Science Letters 243 (2006) 632 649 www.elsevier.com/locate/epsl Seismic characterization of mantle flow in subduction systems: Can we resolve a hydrated mantle wedge? Teresa Mae Lassak
LECTURE 5 - Wave Equation Hrvoje Tkalčić " 2 # & 2 #
 LECTURE 5 - Wave Equation Hrvoje Tkalčić " 2 # "t = ( $ + 2µ ) & 2 # 2 % " 2 (& ' u r ) = µ "t 2 % & 2 (& ' u r ) *** N.B. The material presented in these lectures is from the principal textbooks, other
Thorne, Garnero, Jahnke, Igel, McNamara Supplementary Material - 1 -
 Supplementary Material S1. Bin Location Map Location of 2.5 2.5 bins for which data was obtained to infer the ULVZ distribution. The preferred ULVZ model is drawn (yellow areas). Gray shaded regions indicate
The influence of short wavelength variations in viscosity on subduction dynamics
 1 Introduction Deformation within the earth, driven by mantle convection due primarily to cooling and subduction of oceanic lithosphere, is expressed at every length scale in various geophysical observations.
The limits of ray theory when measuring shear wave splitting in the lowermost mantle with ScS waves
 Geophys. J. Int. (XX) XX, 1 12 The limits of ray theory when measuring shear wave splitting in the lowermost mantle with ScS waves Andy Nowacki 1 and James Wookey 2 1 School of Earth and Environment, University
doi: /nature09940
 LETTER doi:10.1038/nature09940 Spin crossover and iron-rich silicate melt in the Earth s deep mantle Ryuichi Nomura 1,2, Haruka Ozawa 1,3, Shigehiko Tateno 1, Kei Hirose 1,3, John Hernlund 4, Shunsuke
Standard 2, Objective 1: Evaluate the source of Earth s internal heat and the evidence of Earth s internal structure.
 Standard 2: Students will understand Earth s internal structure and the dynamic nature of the tectonic plates that form its surface. Standard 2, Objective 1: Evaluate the source of Earth s internal heat
A three-dimensional radially anisotropic model of shear velocity in the whole mantle
 Geophys. J. Int. (2006) 167, 361 379 doi: 10.1111/j.1365-246X.2006.03100.x A three-dimensional radially anisotropic model of shear velocity in the whole mantle Mark Panning and Barbara Romanowicz Berkeley
Characterization of the D beneath the Galapagos Islands using SKKS and SKS waveforms
 Earthq Sci (2011)24: 87 99 87 doi:10.1007/s11589-011-0772-8 Characterization of the D beneath the Galapagos Islands using SKKS and SKS waveforms Elizabeth Vanacore 1,2, and Fenglin Niu 1 1 Department of
Global surface-wave tomography
 Global surface-wave tomography Lapo Boschi (lapo@erdw.ethz.ch) October 7, 2009 Love and Rayleigh waves, radial anisotropy Whenever an elastic medium is bounded by a free surface, coherent waves arise that
Earth s Interior Earth - Chapter 12 Stan Hatfield Southwestern Illinois College
 Earth s Interior Earth - Chapter 12 Stan Hatfield Southwestern Illinois College Probing Earth s Interior Most of our knowledge of Earth s interior comes from the study of earthquake waves. Travel times
Core mantle boundary structure investigated using SKS and SKKS polarization anomalies
 Geophys. J. Int. (2006) doi: 10.1111/j.1365-246X.2006.02901.x Core mantle boundary structure investigated using SKS and SKKS polarization anomalies Andrea Restivo and George Helffrich Earth Sciences, University
Finite-frequency sensitivity of body waves to anisotropy based upon adjoint methods
 Geophys. J. Int. (2007) 171, 368 389 doi: 10.1111/j.1365-246X.2007.03528.x Finite-frequency sensitivity of body waves to anisotropy based upon adjoint methods Anne Sieminski, 1 Qinya Liu, 2 Jeannot Trampert
Geophysical Journal International
 Geophysical Journal International Geophys. J. Int. (2012) doi: 10.1111/j.1365-246X.2012.05499.x Normal mode sensitivity to Earth s D layer and topography on the core mantle boundary: what we can and cannot
This is a repository copy of The anisotropic signal of topotaxy during phase transitions in D.
 This is a repository copy of The anisotropic signal of topotaxy during phase transitions in D. White Rose Research Online URL for this paper: http://eprints.whiterose.ac.uk/116260/ Version: Accepted Version
Recent Advances and Road Ahead for Global Seismology
 Long Range Science Plan for Seismology, Denver, 18-19 September 2008 Recent Advances and Road Ahead for Global Seismology (Opportunities and Challenges for Next Decade) Rob van der Hilst Massachusetts
Phase Transitions in the Lowermost Mantle
 Phase Transitions in the Lowermost Mantle S.-H. Dan Shim 1, B. Grocholski 2, K. Catalli 3, and V. Prakapenka 4 1 Arizona State University, 2 Smithsonian Institution, 3 Livermore National Lab 4 University
Seismic tomography: Art or science? Frederik J Simons Princeton University
 Seismic tomography: Art or science? Frederik J Simons Princeton University What s inside the Earth? www.usgs.gov www.glencoe.com Dalton, Nature 2003 Only seismic waves have actually been there, done that
Lower Mantle Structure & Geo-neutrinos
 Lower Mantle Structure & Geo-neutrinos Geo-neutrino working group meeting, KITP July 1 st, 2014 Vedran Lekic University of Maryland, College Park + Sanne Cottaar (Cambridge) + Edwin Kite (Princeton / U
Seismic tomography: Art or science?
 Seismic tomography: Art or science? Frederik J Simons Princeton University What s inside the Earth? www.usgs.gov www.glencoe.com Dalton, Nature 2003 Only seismic waves have actually been there, done that
4 Deforming the Earth s Crust
 CHAPTER 7 4 Deforming the Earth s Crust SECTION Plate Tectonics BEFORE YOU READ After you read this section, you should be able to answer these questions: What happens when rock is placed under stress?
Seismic anisotropy in the lowermost mantle near the Perm Anomaly
 1 2 3 4 5 6 7 8 9 10 11 12 13 14 15 16 17 18 19 20 21 22 23 Seismic anisotropy in the lowermost mantle near the Perm Anomaly Maureen D. Long* and Colton Lynner Department of Geology and Geophysics, Yale
Topic 12 Review Book Earth s Dynamic Crust and Interior
 Topic 12 Review Book Earth s Dynamic Crust and Interior Define the Vocabulary 1. asthenosphere 2. continental crust 3. Convection current 4. Convergent plate boundary 5. Divergent plate boundary 6. earthquake
Small-scale lateral variations in azimuthally anisotropic D structure beneath the Cocos Plate
 Earth and Planetary Science Letters 248 (2006) 411 425 www.elsevier.com/locate/epsl Small-scale lateral variations in azimuthally anisotropic D structure beneath the Cocos Plate Juliana M. Rokosky a,,
Directed Reading. Section: The Theory of Plate Tectonics. to the development of plate tectonics, developed? HOW CONTINENTS MOVE
 Skills Worksheet Directed Reading Section: The Theory of Plate Tectonics 1. The theory that explains why and how continents move is called. 2. By what time period was evidence supporting continental drift,
Chapter 7 Plate Tectonics
 Chapter 7 Plate Tectonics Earthquakes Earthquake = vibration of the Earth produced by the rapid release of energy. Seismic Waves Focus = the place within the Earth where the rock breaks, producing an earthquake.
Topic 5: The Dynamic Crust (workbook p ) Evidence that Earth s crust has shifted and changed in both the past and the present is shown by:
 Evidence that Earth s crust has shifted and changed in both the past and the present is shown by:") Topic 5: The Dynamic Crust (workbook p. 65-85) Evidence that Earth s crust has shifted and changed in both the past and the present is shown by: --sedimentary horizontal rock layers (strata) are found
Topic 5: The Dynamic Crust (workbook p. 65-85) Evidence that Earth s crust has shifted and changed in both the past and the present is shown by: --sedimentary horizontal rock layers (strata) are found
CHAPTER 2. Seismology (continued)
") CHAPTER 2 Seismology (continued) 2.1 A tour through the Earth. The gross structure of the Earth and its division into core, mantle and crust were determined by seismologists early in this century. More
CHAPTER 2 Seismology (continued) 2.1 A tour through the Earth. The gross structure of the Earth and its division into core, mantle and crust were determined by seismologists early in this century. More
5. EARTHQUAKES AND EARTH S INTERIOR
 LAST NAME (ALL IN CAPS): FIRST NAME: 5. EARTHQUAKES AND EARTH S INTERIOR EARTHQUAKE An earthquake is ground shaking caused by sudden and rapid movement of one block of rock slipping past another along
Dynamic Crust Practice
 1. Base your answer to the following question on the cross section below and on your knowledge of Earth science. The cross section represents the distance and age of ocean-floor bedrock found on both sides
An acoustic wave equation for orthorhombic anisotropy
 Stanford Exploration Project, Report 98, August 1, 1998, pages 6?? An acoustic wave equation for orthorhombic anisotropy Tariq Alkhalifah 1 keywords: Anisotropy, finite difference, modeling ABSTRACT Using
IGPP. Departmental Examination
 IGPP Departmental Examination 1994 Departmental Examination, 1994 This is a 4 hour exam with 12 questions. Write on the pages provided, and continue if necessary onto further sheets. Please identify yourself
Lecture notes Bill Engstrom: Instructor Earth s Interior GLG 101 Physical Geology
 Lecture notes Bill Engstrom: Instructor Earth s Interior GLG 101 Physical Geology We memorized the layers of the Earth early in the semester. So, how do we know what s beneath the Earth s surface. In the
UNIT 6 PLATE TECTONICS
 UNIT 6 PLATE TECTONICS CONTINENTAL DRIFT Alfred Wegner proposed the theory that the crustal plates are moving over the mantle. He argued that today s continents once formed a single landmass, called Pangaea
EARTHQUAKE LOCATIONS INDICATE PLATE BOUNDARIES EARTHQUAKE MECHANISMS SHOW MOTION
 6-1 6: EARTHQUAKE FOCAL MECHANISMS AND PLATE MOTIONS Hebgen Lake, Montana 1959 Ms 7.5 1 Stein & Wysession, 2003 Owens Valley, California 1872 Mw ~7.5 EARTHQUAKE LOCATIONS INDICATE PLATE BOUNDARIES EARTHQUAKE
Inner core attenuation anisotropy
 Earth and Planetary Science Letters 245 (2006) 581 594 www.elsevier.com/locate/epsl Inner core attenuation anisotropy Wen-che Yu, Lianxing Wen Department of Geosciences, State University of New York at
Important information from Chapter 1
 Important information from Chapter 1 Distinguish between: Natural hazard // Disaster // Catastrophe What role does human population play in these categories? Know how to read a Hazard Map, such as Figure
Engineering Geology. Earth Structure. Hussien aldeeky
 Earth Structure Hussien aldeeky 1 Earth major spheres 1. Hydrosphere Ocean is the most prominent feature of the hydrosphere. - Is nearly 71% of Earth's surface - Holds about 97% of Earth's water Fresh
Full file at
 Chapter 2 PLATE TECTONICS AND PHYSICAL HAZARDS MULTIPLE-CHOICE QUESTIONS 1. What direction is the Pacific Plate currently moving, based on the chain of Hawaiian Islands with only the easternmost island
Defects, Diffusion, Deformation and Thermal Conductivity in the Lower Mantle and D
 Defects, Diffusion, Deformation and Thermal Conductivity in the Lower Mantle and D John Brodholt UCL Thanks to: Michael Ammann, Simon Hunt, James Wookey, Kai Wang, Andrew Walker and David Dobson College
Author's personal copy
 Earth and Planetary Science Letters 297 (2010) 341 354 Contents lists available at ScienceDirect Earth and Planetary Science Letters journal homepage: www.elsevier.com/locate/epsl Frontiers Mantle dynamics
Structural features and shear-velocity structure of the Pacific Anomaly. Lianxing Wen a. Yumei He a,b
 Structural features and shear-velocity structure of the Pacific Anomaly Yumei He a,b Lianxing Wen a a Department of Geosciences, State University of New York at Stony Brook, Stony Brook, New York, USA
ARTICLE IN PRESS. Received 8 August 2004; received in revised form 25 October 2004; accepted 23 November 2004 Editor: B. Wood
 DTD 5 Earth and Planetary Science Letters xx (2004) xxx xxx www.elsevier.com/locate/epsl The effect of temperature on the seismic anisotropy of the perovskite and post-perovskite polymorphs of MgSiO 3
Seismic techniques for imaging fractures, cracks and faults in the Earth. Michael Kendall
 Seismic techniques for imaging fractures, cracks and faults in the Earth Michael Kendall Issues and Challanges Geometry (aspect ratio, size, orientation, density) Non-uniqueness (e.g., single set of aligned
Plate Tectonics: A Scientific Revolution Unfolds
 Chapter 2 Lecture Earth: An Introduction to Physical Geology Eleventh Edition Plate Tectonics: A Scientific Revolution Unfolds Tarbuck and Lutgens From Continental Drift to Plate Tectonics Prior to the
Global 1-D Earth models
 Topic Global 1-D Earth models Compiled Peter Bormann (formerly GeoForschungsZentrum Potsdam, Telegrafenberg, by D-14473 Potsdam, Germany); E-mail: pb65@gmx.net Version March 2002 Below, data and background
This article appeared in a journal published by Elsevier. The attached copy is furnished to the author for internal non-commercial research and
 This article appeared in a journal published by Elsevier. The attached copy is furnished to the author for internal non-commercial research and education use, including for instruction at the authors institution
5. Convergent boundaries produce a relatively low number of earthquakes compared to other boundaries. a. True
 1. Earth s crust is thinner than its mantle. ANSWER: True 2. The concept of isostacy states that high-density rock will stand higher than low-density rock, which explains the formation of subduction zones.
Topic 12: Dynamic Earth Pracatice
 Name: Topic 12: Dynamic Earth Pracatice 1. Earth s outer core is best inferred to be A) liquid, with an average density of approximately 4 g/cm 3 B) liquid, with an average density of approximately 11
Continental Drift and Plate Tectonics
 Continental Drift and Plate Tectonics Continental Drift Wegener s continental drift hypothesis stated that the continents had once been joined to form a single supercontinent. Wegener proposed that the
Receiver. Johana Brokešová Charles University in Prague
 Propagation of seismic waves - theoretical background Receiver Johana Brokešová Charles University in Prague Seismic waves = waves in elastic continuum a model of the medium through which the waves propagate
Numerical Simulation of the Thermal Convection and Subduction Process in the Mantle
 Chapter 1 Earth Science Numerical Simulation of the Thermal Convection and Subduction Process in the Mantle Project Representative Yoshio Fukao Institute for Research on Earth Evolution, Japan Agency for
Earth s Interior and Geophysical Properties. Chapter 13
 Earth s Interior and Geophysical Properties Chapter 13 Introduction Can we just go there? Deep interior of the Earth must be studied indirectly Direct access only to crustal rocks and upper mantle fragments
Isotropy or weak vertical transverse isotropy in D 00 beneath the Atlantic Ocean
 JOURNAL OF GEOPHYSICAL RESEARCH, VOL. 109,, doi:10.1029/2004jb003004, 2004 Isotropy or weak vertical transverse isotropy in D 00 beneath the Atlantic Ocean Edward J. Garnero and Melissa M. Moore Department
Lab 2: Plate tectonics
 Geology 101 Name(s): Lab 2: Plate tectonics Plate tectonics is the theory that is used to explain geological phenomena worldwide. For this reason, most of the useful maps that illustrate plate tectonics
Earthquakes. Earthquakes are caused by a sudden release of energy
 Earthquakes Earthquakes are caused by a sudden release of energy The amount of energy released determines the magnitude of the earthquake Seismic waves carry the energy away from its origin Fig. 18.1 Origin
Effects of Fracture Parameters in an Anisotropy Model on P-Wave Azimuthal Amplitude Responses
 PROC. ITB Eng. Science Vol. 38 B, No. 2, 2006, 159-170 159 Effects of Fracture Parameters in an Anisotropy Model on P-Wave Azimuthal Amplitude Responses Fatkhan Program Studi Teknik Geofisika FIKTM-ITB
Resolving three-dimensional anisotropic structure with shear wave splitting tomography
 Geophys. J. Int. (2008) 173, 859 886 doi: 10.1111/j.1365-246X.2008.03757.x Resolving three-dimensional anisotropic structure with shear wave splitting tomography David L. Abt and Karen M. Fischer Department
D) outer core B) 1300 C A) rigid mantle A) 2000 C B) density, temperature, and pressure increase D) stiffer mantle C) outer core
 outer core B) 1300 C A) rigid mantle A) 2000 C B) density, temperature, and pressure increase D) stiffer mantle C) outer core") 1. In which area of Earth's interior is the pressure most likely to be 2.5 million atmospheres? A) asthenosphere B) stiffer mantle C) inner core D) outer core Base your answers to questions 2 and 3 on
1. In which area of Earth's interior is the pressure most likely to be 2.5 million atmospheres? A) asthenosphere B) stiffer mantle C) inner core D) outer core Base your answers to questions 2 and 3 on
SUPPLEMENTARY INFORMATION
 SUPPLEMENTARY INFORMATION doi:10.1038/nature11294 Review of previous works on deep-liquid properties The major parameters controlling the buoyancy of deep-mantle melts are (i) the changes in atomic packing