Originally published as:
|
|
|
- Neil Fitzgerald
- 5 years ago
- Views:
Transcription
: High-resolution three-dimensional simulations of mid-ocean ridge hydrothermal systems.")
1 Originally published as: Coumou, D., Driesner, T., Geiger, S., Paluszny, A., Heinrich, C. A. (2009): High-resolution three-dimensional simulations of mid-ocean ridge hydrothermal systems. - Journal of Geophysical Research B, 114, B DOI: /2008JB006121
2 JOURNAL OF GEOPHYSICAL RESEARCH, VOL.???, XXXX, DOI: /, High-Resolution 3D Simulations of Mid-ocean Ridge Hydrothermal Systems D. Coumou Department of Earth Sciences, Institute of Isotope Geochemistry and Mineral Resources, ETH Zurich, Clausiusstrasse 25, Zurich, 8092, Switzerland T. Driesner Department of Earth Sciences, Institute of Isotope Geochemistry and Mineral Resources, ETH Zurich, Clausiusstrasse 25, Zurich, 8092, Switzerland S. Geiger Institute of Petroleum Engineering, Heriot-Watt University, Edinburgh, EH14 4AS, U.K. A. Paluszny Department of Earth Science and Engineering, Imperial College London, U.K. C.A. Heinrich Department of Earth Sciences, Institute of Isotope Geochemistry and Mineral Resources, ETH Zurich, Clausiusstrasse 25, Zurich, 8092, Switzerland
3 X - 2 COUMOU ET AL.: HIGH-RESOLUTION 3D SIMULATIONS OF BLACK SMOKER SYSTEMS D. Coumou, Department of Earth Sciences, Institute of Isotope Geochemistry and Mineral Resources, ETH Zurich, Clausiusstrasse 25, Zurich, 8092, Switzerland. (coumou@erdw.ethz.ch)
4 COUMOU ET AL.: HIGH-RESOLUTION 3D SIMULATIONS OF BLACK SMOKER SYSTEMS X - 3 Abstract. High-resolution numerical simulations give clear insights into the 3D structure of thermal convection associated with black-smoker hydrothermal systems. We present a series of simulations that show that, at heat fluxes expected at mid-ocean ridge spreading axes, upflow is focussed in circular, pipe-like regions, with the bulk of the recharge taking place in the near-axial region. Recharging fluids have relatively warm temperatures. In this configuration, the system maximizes its heat output, which can be shown to be linked to non-linearity in the fluid properties. Further, we present a series of simulations with different permeability scenarios. These show that when permeability contrasts are moderate, convection maintains this pipe-like fluid flow structure. The permeability contrast has a dominant effect on flow patters only at early, immature, stages of convection, focussing upflow in high permeability regions and downflow in low permeability regions. In such early stages of convection, diffusive vent styles can emerge, which look remarkably similar to diffuse vent fields in natural systems. Finally, simulations in which permeability is defined as a function of temperature indicate that the brittleductile condition is likely to occur at temperatures not lower than 650 C. At lower brittle-ductile transition temperatures, the system cannot remove the heat delivered from the magma chamber and vent temperatures are substantially lower than 400 C. This result is in agreement with estimates of the brittle-ductile transition temperature from rock-mechanical studies and the occurrence of earthquakes in the oceanic lithosphere.
5 X - 4 COUMOU ET AL.: HIGH-RESOLUTION 3D SIMULATIONS OF BLACK SMOKER SYSTEMS 1. Introduction Mid ocean ridge hydrothermal systems transport a significant part of the energy released by crystallization and cooling of the oceanic crust [Fisher, 2001]. Magmatic heat sources at depths of less than one to a few kilometers below the seafloor drive convection of seawater, with venting occurring at black-smoker fields located near the axial spreading center. Two key observations constrain the sub-seafloor thermal cell structure: (1) Measured venting temperatures are never substantially higher than 400 C [Jupp and Schultz, 2000] and (2) venting occurs in focused regions (active black-smoker fields) separated by regions of inactivity [Lowell et al., 1995; Lowell and Germanovich, 2005]. The first observation is remarkable since inferred magmatic temperatures are around 1200 C. The second observation has led to the suggestion that convection is mainly 2-dimensional in the axial plane, so-called slot-convection. In this paper, we argue that both observations can be explained by sub-seafloor 3-dimensional convection cells operating at maximum energy transport. Early numerical studies of black-smoker systems used simplified fluid properties, with viscosity assumed constant and density varying linearly with temperature [Rosenberg et al., 1993; Cherkaoui and Wilcock, 1999; Schoofs and Hansen, 2000]. In addition to these simplified fluid properties, the fluid was often assumed to be incompressible, with density variations only accounted for in the buoyancy term (Boussinesq approximation). Although these studies contributed considerably to our understanding of fluid flow in the oceanic crust, other numerical studies showed that this approach is deficient when dealing
6 COUMOU ET AL.: HIGH-RESOLUTION 3D SIMULATIONS OF BLACK SMOKER SYSTEMS X - 5 with high-temperature convection systems [Straus and Schubert, 1977; Jupp and Schultz, 2000, 2004; Coumou et al., 2006]. Some recent numerical studies included real fluid properties in their simulations which resulted in a number of important insights into the physics of black-smoker convection systems [Ingebritsen and Hayba, 1994; Jupp and Schultz, 2000, 2004; Coumou et al., 2006; Fontaine and Wilcock, 2007]. Ingebritsen and Hayba [1994] showed that convection cells operating near the critical point of water (21 MPa, 374 C) can transport energy much more rapidly than pure water convection cells operating at any other pressure-temperature conditions. Seawater, in contrast to pure water, can undergo phase separation at higher than critical pressures which complicates the thermodynamics of black-smoker systems. It is clear, however, that most of them operate near the critical point of seawater of 29.8 MPa and 407 C, [Von Damm et al., 2003] and are therefore likely to be able to transport energy efficiently. Following up on these results, Jupp and Schultz [2000, 2004] argued that the non-linear thermodynamics of water can explain why vent temperatures are close to 400 C. In a recent paper, we showed that, in addition to realistic fluid properties, the usage of high-resolution meshes and second-order accurate advection schemes is key to capturing the dynamical features of convection [Coumou et al., 2006]. At permeabilities exceeding m 2, convection is unstable, thermal plumes can split on their way to the seafloor and venting temperatures can oscillate on timescales ranging from years to centuries. Fontaine and Wilcock [2007] confirmed these dynamic features and pointed out that downflow areas can become relatively warm, commonly exceeding 150 C. Realistic numerical studies in 3D have been hampered by a lack of available computational power. Previous studies investigating 3D hydrothermal convection at mid ocean
7 X - 6 COUMOU ET AL.: HIGH-RESOLUTION 3D SIMULATIONS OF BLACK SMOKER SYSTEMS ridges assumed incompressible fluids and low permeability values (< m 2, i.e. Travis et al. [1991]; Rabinowicz et al. [1998, 1999]), greatly reducing computational requirements. Rabinowicz et al. [1998] studied single phase fluid circulation, including non-linearities in the fluid properties, at sediment hosted ridges where permeability is expected to be much lower than at more common un-sedimented ridges. Higher permeabilities and the usage of compressible fluids can substantially increase computational requirements since, depending on the numerical method, computational timesteps can become very small. More problematic is the necessity to use high-resolution meshes when modeling highpermeability systems (i.e. Coumou et al. [2006]). To achieve the same resolution in 3D, the size of a mesh increases by 1 to 2 orders of magnitude compared to a 2D mesh. This massive increase makes 3D simulation of these systems, using standard single-processor numerical techniques, practically impossible. In this study, we use parallel computing techniques [Coumou et al., 2008c] to boost computational power to simulate hydrothermal convection in 3D, using high-resolution meshes and real properties of compressible fluids. We present simulations of 3D box-shaped models, consisting of several million elements, solved using 16 processors. In a previous paper [Coumou et al., 2008a] we showed that, for homogeneous permeability systems, convection in 3D develops pipe-like upflow zones surrounded by narrow, relatively warm downflow zones. This configuration gives the highest heat-output resulting from the non-linearity in the fluid properties. In this paper, we extend these findings to heterogeneous permeability systems and investigate different heat-flux and temperature-dependent-permeability scenarios.
8 COUMOU ET AL.: HIGH-RESOLUTION 3D SIMULATIONS OF BLACK SMOKER SYSTEMS X Model Setup 2.1. Equation of state and governing equations By assuming that the fluid is pure water and by taking pressures larger than the criticalpoint of water (22.1MPa), we ensure that the fluid is in the single phase regime. This assumption substantially reduces the complexity of the problem, allowing the energy equation to be written into a temperature (T ) formulation [Geiger, 2004; Lowell and Germanovich, 2005; Coumou et al., 2006]: (φρ f c pf + (1 φ)ρ r c pr ) T t = k T (ρ fc pf vt ) (1) Here, φ is the porosity, v the Darcy velocity [Bear, 1972] and ρ and c p stand for density and heat capacity respectively, with the subscripts f and r referring to fluid and rock. The pressure equation is solved decoupled from the energy equation, with the thermal expansion term entering as a source term into the pressure (p) equation: ( ) p k φρ f β f t = T ( p ρ f g)ρ f + φρ f α f µ f t (2) Here, α f is the fluid expansivity, β f its compressibility, µ f its viscosity and g the gravitational acceleration. Properties of pure water at supercritical conditions vary non-linearly and over several orders of magnitude with changing pressure and temperature. The fluid properties, ρ f, µ f, α f, β f and c pf are obtained using lookup tables based upon the pure water equation of state by Haar et al. [1982]. Equations 1 and 2 are solved using a finite-element finite-volume method (FE-FV), in which advective parts of the equations are solved using the finite-volume method and diffusive parts using the finite-element
9 X - 8 COUMOU ET AL.: HIGH-RESOLUTION 3D SIMULATIONS OF BLACK SMOKER SYSTEMS method. The exact details of this scheme have been described in previous publications [Geiger et al., 2004, 2006; Coumou et al., 2006] Model dimensions We solve equations (1) and (2) within a 3 dimensional, box-shaped domain extending 4km in the along-axis direction and 3km in the across-axis direction with a height of 1km (Figure 1). We tested the validity of the 4km along-axis dimension with a number of 2D along-axis simulations. These showed that if k > m 2, the aspect ratio, i.e. the horizontal dimension divided by the vertical dimension of a single convection cell, becomes sufficiently small such that the vertical boundaries do not influence the solution. The axial plane is located in the center of the model, resulting in an off-axis extent of 1500m in both directions. This should be sufficient since observed axial magma chambers typically have an across-axis dimension of 500m on either side [Sinton and Detrick, 1992; Lowell and Germanovich, 2005] Discretization The model domain is discretized using irregularly sized tetrahedron elements [Paluszny et al., 2007], with the resolution of the mesh increasing towards the axial center (Figure 1). To capture the true dynamics of transient thermal convection systems, high-resolution meshes and second-order accurate transport schemes are required [Coumou et al., 2006; Fontaine and Wilcock, 2007]. Therefore, we ensure that in the central region of our 3D models, the resolution of the mesh is similar to the resolution found to be sufficiently fine in 2D models described in [Coumou et al., 2006]. This implies node-to-node distances of roughly 20 m. In the across-axis direction, the mesh-resolution is gradually relaxed,
10 COUMOU ET AL.: HIGH-RESOLUTION 3D SIMULATIONS OF BLACK SMOKER SYSTEMS X - 9 resulting in a mesh consisting of 2.5 M tetrahedron elements. Figure 1 shows the partitioning of the global domain into 16 sub-domains, each one assigned to a single processor. We employ parallel computing techniques as described in detail in Coumou et al. [2008c]. The use of this high-performance processing power was essential for calculating these simulations within an acceptable time frame. Typically, with 16 processors it took two weeks to calculate 150 years of convection, whereas on a single processor, expected computation time would have been at least half a year Boundary conditions The top boundary represents the seafloor at roughly 2.5 km water depth resulting in a constant pressure of p = 25MPa. Fluids are free to enter and leave the model via the top boundary, all other edges are no-flow boundaries. vent, we use a mixed thermal boundary condition at the top. To allow hot fluids to In elements along the top boundary experiencing upflow, the vertical temperature gradient is set to zero, while elements experiencing downflow take in 10 C water. At the bottom boundary, the system is heated by a fixed heat flux. This is physically more realistic than a constant-temperature boundary condition since the latter essentially assumes that an infinite amount of heat can be transported into the system. The total bottom heat flux is constrained by the amount of basalt that crystallizes and cools, which is directly dependent on the spreading rate. Such an estimate gives values ranging from 10 to 120 MW per kilometer of ridge axis [Baker and Massoth, 1987; Ginster et al., 1994; Baker and Urabe, 1996; Fisher, 2001; Ramondenc et al., 2006]. However, estimates from individual vent fields and ridge segments indicate a much higher heat output of 100s to 1000s of MW [Fisher, 2001], implying that magma supply is episodic and local. We therefore decided to work with
11 X - 10 COUMOU ET AL.: HIGH-RESOLUTION 3D SIMULATIONS OF BLACK SMOKER SYSTEMS two heat fluxes: a moderate value of 75MW/km and a high heat flux value of 350MW/km. The 350MW/km estimate best represents a localized high-heat flux area (less than 10km) on a medium to fast spreading ridge such as the Main Endeavour Field on the Endeavour Segment of the Juan de Fuca Ridge and the 9 50 N and S areas on the East Pacific Rise. The heat flux is delivered in a Gaussian profile to the bottom of our model-domain with the peak at the axial center. The half-width of this function is set to 500m which is roughly half the across-axial width of a typical magma-chamber (i.e. Sinton and Detrick [1992]; Lowell and Germanovich [2005]) and the background heat flux is set to 1 W/m Simulation Results 3.1. Constraining Permeability A critical parameter for hydrologic simulations is the permeability of the rock. For the ocean floor, direct measurements by borehole packer range from m m 2 at shallow depths (up to 500m) to much smaller values (10 17 m 2 ) at deeper levels [Fisher, 1998]. Such experiments have only been performed off-axis, however, due to technical complexities related to drilling fresh basaltic crust. Near-axial permeabilities have therefore typically been estimated using simple mathematical analysis where k is constrained to account for the high measured heat fluxes [Wilcock and McNabb, 1996; Lowell and Germanovich, 2005]. However, since these approaches rely on simplified fluid properties, which seriously underestimates the energy which can be transported by near-critical fluids [Straus and Schubert, 1977], they tend to overestimate the required permeability (k m 2 ). Recent 2D simulations using realistic fluid properties [Fontaine and Wilcock, 2007; Coumou et al., 2008b] showed that high axial heat fluxes can already be transported at much more moderate permeability (k m 2 ). Here we take a new approach
12 COUMOU ET AL.: HIGH-RESOLUTION 3D SIMULATIONS OF BLACK SMOKER SYSTEMS X - 11 to constrain k by assuming that (1) the depth of the magmatic-hydrothermal interface is constant at 1000m and (2) temperatures in this region are close to 1200 C. Seismic studies have identified low-velocity zones at 1-2 km below spreading centers, interpreted to be (partly) molten magmatic lenses, stretching over several kilometers along-axis [Singh et al., 1998; Kent et al., 2000; Dunn et al., 2000]. Sufficiently high temperatures close to 1200 C are required to keep basalt at sufficiently high melt fraction to be imaged as a melt-lens reflector by seismic surveys [Sinton and Detrick, 1992; Singh et al., 1998]. The two defined criteria can, for a fixed heat flux, only be fulfilled within a narrow permeability range (Cathles, 2007: personal communication). At higher permeabilities the hydrothermal system will cool the bottom layer more efficiently, resulting in lower bottom temperatures. On the other hand, if permeability is too low, the systems cannot remove heat efficiently and bottom temperatures will rise to unrealistically high values. Figure 2 illustrates this principle in more detail, plotting the temperature at the bottom of the model for simulations using slightly different permeabilities with heat fluxes of 75MW/km and 350MW/km. Figure 2c shows that, for a 350MW/km heat flux and a permeability of m 2, only a very few bottom nodes reach 1200 C. When permeability is decreased by only a small factor, i.e. to m 2, large areas appear where the temperature is 1200 C or higher (Figure 2d). Likewise, for the 75MW/km models, a similar permeability range is observed, but permeabilities are smaller due to the lower heat flux applied (Figure 2a and b) Low heat flux First, we investigate 3D thermal convection at a relatively low heat flux value of 75MW per km of ridge axis. For a homogeneous permeability, k = m 2, a near-steady-
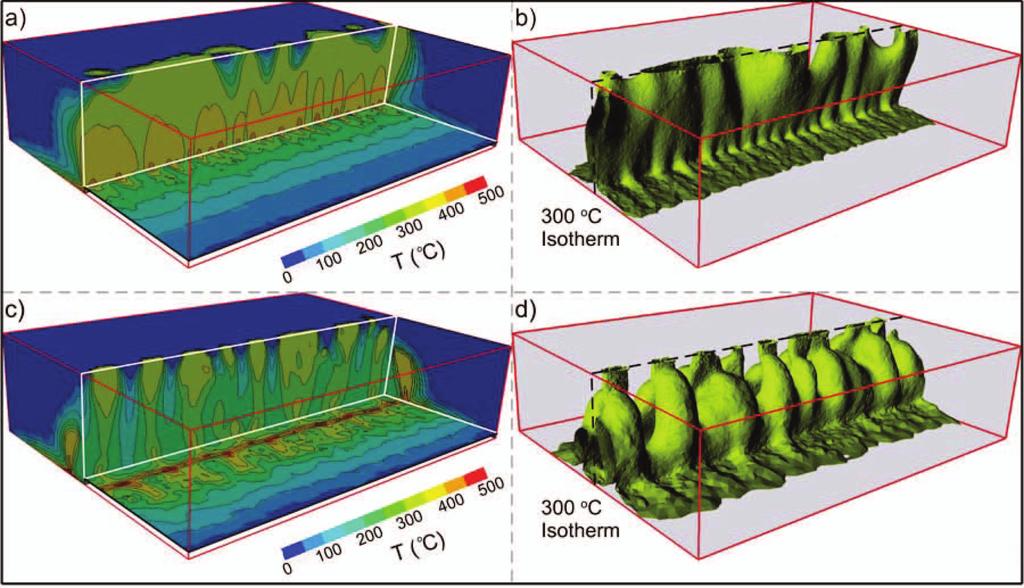
13 X - 12 COUMOU ET AL.: HIGH-RESOLUTION 3D SIMULATIONS OF BLACK SMOKER SYSTEMS state upflow region develops along the full length of the ridge (see Figure 3a and b). Here, upwelling fluids have a moderate temperature of 300 C. Fluid flow is dominantly across-axis, with recharge occurring away from the axis and discharge occurring along the full length of the axial center. Only if we increase k in the near-axial region do separate vent areas develop (see Figure 3c and d). In this example, k is increased by an order of magnitude within a 100m wide corridor along the axis. At the bottom boundary, the highest temperatures are now reached at the edges of the high-permeability layer instead of at the axial center (see Figure 3c). Rapid fluid flow within the permeable layer cools the bottom boundary much more efficiently, limiting the bottom-boundary temperatures in the near axial region. As a result, thermal plumes develop not at the axial center but slightly off-axis (see Figure 3c and d). Plumes merge close to the top boundary, resulting in regularly spaced discharge areas along the axial center with a spacing of 500m High heat flux Homogeneous permeability Figure 4 shows the thermal structure of simulations with a high heat flux (350MW/km) with homogeneous permeabilities of respectively m 2 and m 2. Both simulations show that at these high heat flux conditions, upflow naturally forms into circular, near-vertical, pipelike regions. Thermal instabilities form away from the axis near the bottom boundary (Figure 4a and c) and travel towards the main upflow regions at the axis. This results in sub-horizontal tube-like structures in which hot fluids flow along the bottom boundary towards the axis (4b and d). Adjacent to these features, cold fluid flows downward which is expressed in the rhythmic depressions of the isotherm in Figures 4b and d. At the axis, the fluids reach temperatures of 400 C and move upwards in
14 COUMOU ET AL.: HIGH-RESOLUTION 3D SIMULATIONS OF BLACK SMOKER SYSTEMS X - 13 circular, pipe-like discharge regions. At the top boundary, fluids discharge in regions with an average diameter of 250m. Although none of the high-heat flux simulations reached a steady-state, the location of the upflow zones remained constant throughout the lifetime of the simulation. Directly outside these upflow regions, fluids of moderate temperature flow downward at an increasing rate. This is explained in more detail in Figure 5, showing the vertical mass flux through horizontal cross-sections at different depths. Directly adjacent to the discharge areas, downflow through the top surface is maximized, as expressed by the dark blue regions in the left-hand plots of Figure 5. Further away from the axis, the magnitude of downflow decreases. The same pattern of increased downflow directly surrounding the upflowing regions, is observed in the horizontal cross-sections at 100m, 500m and 900m depth. Fluids in these regions have temperatures between 100 C and 300 C, as shown by the isotherms plotted in Figure 5. The 300 C isotherm also more or less overlaps the white line separating up and down flowing regions, indicating that fluids of 300 C are close to neutral buoyancy. Figure 6 plots the average recharge through the top boundary of the two homogeneous permeability models as a function of off-axial distance, reflecting the increased recharge close to the axis Heterogeneous permeability In addition to homogeneous permeability models, a series of simulations was done with different heterogeneous permeability structures. The permeability structure of these simulations as a function of off-axial distance is plotted in Figure 7. Figure 8 plots the thermal structures of these simulations when convection is fully evolved. With increasing average permeability values in the model, near bottom temperatures become lower, reflecting the more efficient removal of heat from the bottom. Upflow zones in the simulation using per-
15 X - 14 COUMOU ET AL.: HIGH-RESOLUTION 3D SIMULATIONS OF BLACK SMOKER SYSTEMS meability model 1, which has the largest average permeability, therefore become less hot and hardly reach 380 C (Figure 8b). In Figure 8 the permeability contrast increases from top to bottom, which results in the upflow zones becoming more and more aligned in the high-permeability region. Comparing figures 8e and f (sharpest k-contrast) with figures 4c and d (no k-contrast) shows that the differences are limited. In the sharp k-contrast simulation upflow dominates in the high permeability regions resulting in venting occurring along more than half the distance of the axial spreading center. Apart from that, the typical pipe-like fluid flow structures are retained, which is also expressed in figure 9. This figure plots the mass flux through horizontal cross-sections of models with an increased axial permeability when convection is fully developed. It shows that for moderate permeability contrasts, downward mass fluxes are maximized close to the axial plane, in regions where the downward flowing fluids are heated to temperatures of 100 C to 300 C, just as in the homogeneous permeability cases. For progressively sharper permeability-contrasts, upflow becomes more and more focussed in the high-permeability plane, resulting in more elongated discharge areas. This then results in recharge through the top as plotted in figure 10 rather similar to homogeneous permeability models Intermediate convective stage So far, we have only described convection when it is fully evolved. The fully evolved state is reached after about 100years, depending on the exact permeability scenario used, and is characterized by downflow zones heated to temperatures around 200 C. At early convective stages, downflow zones are still at ambient temperature and a different convective flow pattern can be discerned. Both up- and downflowing fluids are focussed in the vertical high permeability region, with upflowing fluids dominating in the upper
16 COUMOU ET AL.: HIGH-RESOLUTION 3D SIMULATIONS OF BLACK SMOKER SYSTEMS X - 15 section and downflowing fluids in the lower section (see fig. 11b). This style is characterized by large surface areas of low-temperature, low-volume-flux venting surrounding and connecting smaller, circular areas of high-temperature, high-volume-flux venting. This behavior is plotted in Figure 11c with low-temperature, diffusive style venting appearing in red. This snapshot in time occurs shortly after the first thermal plumes reach the top boundary of the model. This intermediate stage of convection was also observed in homogeneous permeability simulations, but was most prevalent in simulations with a high-permeable axial plane. Nevertheless, over time the red regions in Figure 11c become downflow zones and the typical convection style, as described in the previous sections, emerges. Still, the diffuse-venting state can remain active for several years. In section 5.3, we explain the physical reason for the occurrence of this state and show that it can explain some observations at natural systems Temperature-dependent k Permeability in the oceanic crust is expected to be a function of temperature. The temperature range over which brittle rock becomes ductile is however poorly known. To investigate this, we perform a number of simulations with a temperature-dependent permeability and set the brittle-ductile transition progressively to higher temperatures. Similar to Hayba and Ingebritsen [1994], we use a low ductile permeability at high temperature of m 2. We use a high permeability of m 2 at low temperature which is in agreement with available borehole packer measurements of the shallow oceanic crust [Fisher, 1998]. The associated log-linear permeability-temperature functions are plotted in Figure 12 and the heat flux is set to a value of 350MW/km of ridge axis. The results show that only when the brittle-ductile transition is set at the temperature interval from
17 X - 16 COUMOU ET AL.: HIGH-RESOLUTION 3D SIMULATIONS OF BLACK SMOKER SYSTEMS 650 C to 750 C, discharge temperature become higher than 375 C (Figure 13). If the brittle-ductile transition is set to a lower temperature interval, then the system cannot remove the heat supplied to the bottom. This results in the formation of a broad hot zone near the bottom, and plumes that can rise at considerable distances away from the axial center. Discharge therefore occurs at many locations on- and off-axis, but temperatures are relatively low. With the brittle-ductile transition set at 650 C to 750 C, the system can remove the supplied heat, resulting in near-axial discharge areas with temperatures close to 400 C (Figure 14). 4. Mathematical Analysis 4.1. Pipe-like upflow The typical convection style of concentric recharge zones around pipe-like upflow zones, which occurs at high heat flux and permeability, can be understood by analyzing nonlinearity of the fluid properties. Figure 15a shows that heating a fluid from 0 C to 200 C will decrease its viscosity by an order of magnitude but will decrease its density by a much smaller fraction (i.e. from 1000kg m 3 to 900kg m 3 ). As a consequence, 200 C fluids can be brought downwards very efficiently: the reduced viscosity makes them very mobile and the large density ensures a substantial downward buoyancy force. This behavior can be quantified by writing a simple formula for the vertical mass flux in the axial region: k M z = ρ(t )v z = ρ(t ) µ(t ) ( ) p ρ(t )g z Where p/ z is the vertical pressure gradient in the near-axial region. (3) The vertical pressure gradient takes a value somewhere between hot- and cold hydrostatic such that
18 COUMOU ET AL.: HIGH-RESOLUTION 3D SIMULATIONS OF BLACK SMOKER SYSTEMS X - 17 hot fluids can be transported upwards and cold fluids transported downwards. Several studies assumed that the pressure gradient is very close to cold hydrostatic [Wilcock and McNabb, 1996; Jupp and Schultz, 2004], based on the idea that discharge zones are much smaller than recharge zones and therefore their resistance would be much higher. The much lower viscosity of the fluid in discharge zones, however, has a counteracting effect, greatly reducing upflow resistance. In the homogeneous permeability simulations, fluids with temperatures of 300 C are at neutral buoyancy (ρ n ) in the near-axial region (see fig. 6). This implies, since p/ z = ρ n g, that the vertical pressure gradient has a value of 6000 Pa/m, roughly half-way in between cold ( Pa/m) and hot ( 3000 Pa/m) hydrostatic. Figure 15d plots M z, taking p/ z = 6000Pa/m, showing that downward mass flux is optimized at 200 C and upward mass flux is optimized at 400 C. Analogous to Coumou et al. [2008a], we can derive a simple formula for p/ z assuming a pipe-model in which recharge occurs in a halo surrounding a pipe-shaped upflow zone: [ ] p z = 1 ρ u + (ρ d ρ u ) g (4) γr + 1 Here the geometric constant γ is the ratio A u k u /A d k d, with A u the cross-sectional area of the upflow zone and A d the cross-sectional area of the downflow zone. R is the ratio of fluid properties (µ d ρ u )/(µ u ρ d ), where subscripts u and d indicate properties in the upwelling and downwelling limb respectively. Physically, the product γr can be seen as the ratio of the hydraulic resistance of the downflow region versus the upflow region. Whenever the resistance in the downflow region increases, compared to the upflow region, γr becomes larger pushing p/ z towards hot hydrostatic (i.e. ρ u g). Vice versa, if the resistance in the upflow region increases the pressure gradient is pushed towards cold hydrostatic (i.e.
19 X - 18 COUMOU ET AL.: HIGH-RESOLUTION 3D SIMULATIONS OF BLACK SMOKER SYSTEMS ρ d g). Equation 4 assumes that the pressure gradient in the upflow zone is the same as in the near-axial downflow zone. This assumption can be made since in this region fluid flow is dominantly vertical and horizontal pressure gradients are therefore negligible. We define the total heat-output of the system as Q = A u (h u h d )M z, where h is the enthalpy of the fluid. Following Coumou et al. [2008a] we can find an expression for the fluxibility F, defined as the ability of a system to transport energy by buoyancy driven convection [Jupp and Schultz, 2004]: F = Q = ρ u(h u h d )(ρ d ρ u ) 1 gk u A u µ u 1 + γr (5) This expression is an extension of the ordinary definition of fluxibility first defined by Lister [1995], which neglects the resistance in the downflow zone (i.e. γ = 0). Here, we allow significant resistance in the downflow as well as the upflow zone, resulting in the second term on the right-hand-side of equation 5. Figure 15 plots the pressure gradient (b and e) and the heat flux Q (c and f) as functions of the upwelling temperature T u and downwelling temperature T d, for γ taken as 1 and 3 respectively, and k = m 2. In both cases, the point of maximum fluxibility coincides with upwelling temperatures of 400 C and downwelling temperatures of 200 C. The fluxibility at γ = 3 is substantially lower than at γ = 1, since the resistance of the downflow zone is three times larger. This difference in hydraulic resistance also causes the vertical pressure gradient to be substantially different for different γ. If γ = 1 the calculated pressure-gradient is 6000Pa/m (Figure 15b), whereas for larger γ, it drops to smaller values of 4000Pa/m (Figure 15e). These results have a number of implications which are outlined in the discussion.
20 COUMOU ET AL.: HIGH-RESOLUTION 3D SIMULATIONS OF BLACK SMOKER SYSTEMS X Discussion 5.1. Maximum energy transport Based on the simulation results, we can make a first order estimate of the value of γ. Since the bulk of the recharge takes place in the relatively warm near axial region, we choose A d to be the area in between the 100 C and 300 C isotherms at a depth of 500m. A u is taken as the area for which the temperature is larger than 300 C at the same depth. For the homogeneous permeability simulations these areas are roughly the same and hence γ is likely to be close to 1. The systems fluxibility maximizes at T u 400 C and T d 200 C (Figure 15c) accompanied with a pressure gradient of p/ z 6000Pa/m. These values are very similar to what we observe in our homogenous permeability simulations. This suggests that fluid flow patterns evolve to a state in which the transport of energy is maximized. Upflow in circular, pipe-like zones efficiently heats the surrounding downflowing water, and thereby maximizes mass and energy transport through the system. Previous studies showed that vent temperatures of 400 C indicate that black-smoker hydrothermal systems could be in a state of maximum energy transport [Jupp and Schultz, 2000, 2004]. Our analysis supports this idea and shows that convection cells organize themselves such that downflow zones can be heated efficiently such that mass-fluxes and therefore energy fluxes can be maximized. Due to the presence of salt in oceanic water fluids can phase-separate at pressures typically encountered at black smoker systems. The effect of two-phase flow on the analysis discussed here is however likely to be small. In our analysis, the properties of the downflowing fluid at temperatures around 200 C are critical and these are only slightly affected when using salt water instead of pure water properties [Driesner and Heinrich,
21 X - 20 COUMOU ET AL.: HIGH-RESOLUTION 3D SIMULATIONS OF BLACK SMOKER SYSTEMS 2007; Driesner, 2007]. Recent 2D saltwater simulations showed that for most parameter settings, two-phase areas will be limited to near magmatic regions and hence the structure of the convective cell is not affected [Coumou et al., 2009]. Only with shallow ocean depths ( 1500m) are two-phase upflow zones likely to form but since areas of countercurrent flow are limited they are also not likely to have a strong effect on 3D cell structure [Coumou et al., 2009] Permeability heterogeneity For the heterogeneous permeability case, the use of formulas 4 and 5 is less straightforward, but can still provide some useful insights. We estimate A u and A d in the same way as for the homogeneous permeability case, giving, in a first order approximation, that A u /A d 1 and hence γ scales with k u /k d. Increasing the permeability in the upflow region, therefore, pushes the vertical pressure gradient towards hot hydrostatic, since γ > 1. For γ = 3, the peak in fluxibility is still at the same upwelling and downwelling temperatures, but the pressure gradient is much smaller, i.e. 4000Pa/m. This value, however, should be treated with care since the assumption that horizontal pressure gradients in the near axial region are close to zero could be violated at such low vertical pressure gradients. Nevertheless, heterogeneous permeability systems still operate at upwelling temperatures of 400 C and the bulk of the downflow has temperature of 200 C, as confirmed by the simulations, and pressure gradients in the near-axial region decrease due to the low hydraulic resistance of the upflow zone. Geologic evidence suggests that upflow zones are naturally drawn to high-permeability fault zones [Hayman and Karson, 2007, 2009] as also seen in our simulations. If this is true, than the pressure gradient in upflow regions
22 COUMOU ET AL.: HIGH-RESOLUTION 3D SIMULATIONS OF BLACK SMOKER SYSTEMS X - 21 is likely to be closer to hot hydrostatic rather than cold hydrostatic, as often has been assumed [Jupp and Schultz, 2000, 2004; Lowell and Germanovich, 2005] Diffuse venting In the previous sections we showed that optimal energy transport is achieved in a pipe-like upflow region with concentric zones of relatively warm downflowing fluids. This state, however, is only achieved when convection is fully developed, which can take many years. Before that, in the initialization phase, we observed a diffusive venting style in our simulations, with relatively low temperature fluids venting in regions connecting hightemperature black-smoker style vent fields. Again, formula 4 can provide some understanding of what is causing this phenomenon. During initial plume formation, downflow zones are still essentially at ambient seawater temperatures, since regions surrounding upflow zones have not heated up yet. At this point, the hydraulic resistance of downflow is large due to the high viscosity at ambient temperatures. Therefore, the pressure gradient will settle at a value close to hot-hydrostatic (see also Figure 15e) to drive the required downflow to the base of the hydrothermal system. Such a low pressure gradient implies that relatively warm fluids can become neutrally buoyant. Indeed, fluids at the periphery of upflow regions, which lose heat by diffusion and mixing, can easily become neutrally buoyant. Graphically, this is expressed in the steep gradient of the curve in Figure 15d in the range from 350 C-400 C: Even a small temperature drop can decrease the upwards buoyancy force substantially. Consequently, fluids in the periphery of upflow zones can lose their upward buoyancy force, which is expressed as low-velocity, diffusive-style, venting at the seafloor. This phenomenon was in particular observed in simulations with an increased axial permeability. In these simulations, rising thermal plumes preferentially
23 X - 22 COUMOU ET AL.: HIGH-RESOLUTION 3D SIMULATIONS OF BLACK SMOKER SYSTEMS take flow paths in the high-permeable zone, whereas downflow is mainly restricted to the lower permeable regions. This affects the relative resistance between up- and downflow zones, pushing the pressure gradient even more towards hot hydrostatic. Once convection is fully developed into high-temperature upflow and surrounding, moderate temperature downflow, diffuse venting ceases and only focussed black-smoker style venting occurs. We therefore propose that diffuse vent sites might be an indication for sub-seafloor convection being recharge dominated and not yet in its state of optimal energy transport. This hypothesis is supported by several observations of natural diffuse vent fields. First, diffuse vent fields are always at lower temperatures and typically found at the periphery of active black-smoker vent fields [Hannington et al., 1995]. Second, diffusive style venting is often observed directly after a dike injection, before the emergence of high-temperature black-smokers [Hannington et al., 1995]. A possible explanation is that a magmatic event increases the permeability predominantly in the upflow region and therefore the system becomes recharge dominated. Over time, venting tends to become more and more focussed in black-smoker fields, reflecting the heating of near-axial recharge zones and an accompanying shift of the pressure gradient towards cold hydrostatic. In natural systems, the shift from diffuse style to focussed venting has been observed on much smaller timescales than seen in our models. A possible explanation for this is that the permeability after a dyke injection is temporarily much larger than values used in this study. Wilcock [1998] showed that diffuse type vent fluids can be generated by mixing of a hightemperature hydrothermal fluid with seawater in the high-permeability extrusive layer. Our explanation can in a sense be seen as an extension to this idea: Highly permeable
24 COUMOU ET AL.: HIGH-RESOLUTION 3D SIMULATIONS OF BLACK SMOKER SYSTEMS X - 23 regions, either in the form of a horizontal extrusive layer or a near-vertical fault zone, are likely to lead to diffusive style venting at the seafloor Permeability We constrained the permeability by fitting bottom temperatures to expected temperatures of magmatic melt lenses. We find values for k ranging from m m 2, using heat fluxes of respectively 75MW/km and 350MW/km, which are at the lower range of axial permeability estimates from previous studies [Lowell and Germanovich, 1994; Wilcock and McNabb, 1996; Fisher, 1998; Lowell and Germanovich, 2005]. The approach, however, has an important limitation. It assumes that the boundary layer between the magma lens and the hydrothermal system is in a thermal steady state: i.e. the amount of heat coming from the magma chamber is removed by the hydrothermal system but the magma lens itself is not cooled, remaining at temperatures around 1200 C. Though plausible, such a balance is by no means required in nature. In fact, measurements indicate that some hydrothermal systems remove heat at a faster rate than can be delivered by the oceanic crustal accretion process [Baker and Massoth, 1987; Ginster et al., 1994; Baker and Urabe, 1996; Ramondenc et al., 2006]. This could mean that the magma lens cools and the hydrothermal cell pushes the magma lens down by means of thermal cracking fronts [Lister, 1974]. If this is the case, our permeability estimates should be seen as a lower limit for the heat fluxes used. The simulations with a temperature-dependent permeability show, for this specific model geometry and boundary conditions, that if the brittle-ductile transition is at relatively low temperatures then the systems cannot remove the supplied heat. If the brittleductile transition is set from 650 C to 750 C, then the seafloor expression, in terms of
25 X - 24 COUMOU ET AL.: HIGH-RESOLUTION 3D SIMULATIONS OF BLACK SMOKER SYSTEMS location of vent fields and venting temperature matches much better with observations. This estimate of the brittle-ductile transition at 700 C centers in between recent estimates based on the occurrence of earthquakes in oceanic crust (600 C, [McKenzie et al., 2005]) and those from rheologic calulations (700 C-800 C, [Hirth et al., 1998]) Vent field distribution One key observation at mid-ocean ridges is that venting is focussed in black-smoker fields separated from each other by stretches of unaffected seafloor. In our low-heatflux simulations, an axial plane with increased permeability is required to produce such discrete vent fields. Though no strict slot-convection mode develops, fluid flow patterns are dominantly in the high-permeability axial plane. Without a high permeability plane, fluid flow in low-heat-flux systems is mainly across-axis and venting occurs everywhere along the axial center, in contradiction with observations. Further, at a heat flux of 75MW/km maximum vent temperatures are substantially lower than typically observed (only 300 C), which indicates that the heat fluxes at active systems are likely larger and that a heat flux of 75MW/km is probably more representative of a dying system. The high heat flux models (350MW/km) give a better match with observations at natural systems, both in terms of vent temperature and in terms of vent field spacing. In particular, they do not require a high permeability axial plain to produce separate vent fields. Instead, for a homogeneous permeability, convection organizes itself in circular, pipe-like upflow regions surrounded by regions of increased downflow. Increasing the permeability in a narrow zone at the axial center does not affect this convective behavior significantly. For the moderate permeability contrasts tested in this study, this pipe-like flow structure remains dominant. Only at an early stage of convection does the perme-
26 COUMOU ET AL.: HIGH-RESOLUTION 3D SIMULATIONS OF BLACK SMOKER SYSTEMS X - 25 ability contrast strongly influence fluid flow patterns with rising fluid dominating in the high-permeable regions. Downflow zones have not heated up yet in this immature convective stage and hence the permeability structure dominates fluid patterns rather than the fluid properties. In our tested heterogeneous permeability scenarios this resulted in elongated vent fields which stretch over most of the axial center with only small localized recharge areas. Continued circulation heats up the surrounding downflow zones and the influence of fluid properties becomes the controlling factor, creating a pipe-like flow structure. Further simulations with sharper permeability contrasts are required to test the generality of this conclusion. Also, more realistic permeability scenarios like highly permeable extrusive and/or steeply dipping normal faults need to be tested in 3D Field evidence Substantial evidence exists in nature for pipe-like convective systems, as observed in our simulations. Tivey and Johnson [2002] gathered magnetic anomaly data from the Endeavour segment of the Juan de Fuca Ridge to infer the sub-seafloor structure of upflow regions. They observe circular magnetic lows at active and inactive venting areas, which look remarkably similar to the thermal structure at the top of homogenous permeability models. Tivey and Johnson [2002] interpret these sub-seafloor structure as near-vertical pipe-like source regions, in agreement with our results. Further evidence for focussed, pipe-like upflow regions comes from ophiolites [Saccocia and Gillis, 1995; Juteau et al., 2002]. An additional feature of pipe-like upflow observed in our simulations is the existence of halos of increased downwelling surrounding the upflow zones. Recharge regions therefore might be less extensive than previously thought. In our homogeneous permeability simu-
27 X - 26 COUMOU ET AL.: HIGH-RESOLUTION 3D SIMULATIONS OF BLACK SMOKER SYSTEMS lations, 2/3 of the downward mass flux at mid-depth occurs within 500m of the axis. Temperatures within these focused recharge zones are substantially higher than often assumed for recharge regions, but are in agreement with results from recent 2D simulations [Fontaine and Wilcock, 2007]. They are also compatible with temperature distributions inferred from the study of mineral-assemblages at different levels in oceanic crust [Alt, 1995]. Coogan [2008] shows that metamorphic temperatures in sheeted dykes range from 100 C to 400 C (figure 2 of Coogan [2008]) and argues that such relatively high temperatures are incompatible with the standard model of hydrothermal convection in which fluid reacts with rock dominantly within the broad, cold downflow regions. Coogan [2008] therefore suggests that, assuming downflow is cold, fluid rock reaction largely occurs as fluid migrates upwards. Our simulations show that efficient fluid-rock reaction at temperatures higher than 100 C will occur in a wide ( 1km) region in both up- (more than 300 C) and downflow (less than 300 C) zones, which seems compatible with measured metamorphic temperatures. To draw these relatively warm fluids down, the pressure gradient needs to be sufficiently low (i.e. 6000Pa/m). No direct pressure data exist from black-smoker upflow zones, but boreholes from geothermal systems reveal pressure gradients roughly mid-way between hot- and cold-hydrostatic [Grant et al., 1984]. Finally, recent seismic data from the East Pacific Rise 9 50 N indicate that recharge can indeed occur focussed and very close to the axis, directly above the magmatic melt lens [Tolstoy et al., 2008]. 6. Conclusions We report high-resolution 3D simulations of thermal convection at mid-ocean ridges, including the full non-linearity of the properties of super-critical H 2 O. The simulations
28 COUMOU ET AL.: HIGH-RESOLUTION 3D SIMULATIONS OF BLACK SMOKER SYSTEMS X - 27 show that pipe-like upflow, observed in several natural systems, forms naturally at sufficiently high heat flux and permeability. This style of convection is accompanied by halos of increased downflow surrounding upflow regions. As a result of the non-linear dependence of the viscosity, density and heat capacity of the fluid on temperature and pressure, the systems heat output is maximized for this configuration. Venting occurs in circular high-temperature regions separated from each other by recharge areas, even when the permeability is homogeneous. Therefore, slot-convection, in which convection is dominantly 2D within a high permeability axial plane, is not required to explain separately spaced vent fields in nature. In fact, an increased axial permeability causes vent fields to become elongated and connected with one another and thereby less resemble the typical distribution of natural vent fields. In such high-axial-permeability simulations, the pressure gradient can approach hot-hydrostatic values during the early stages of convection, causing rather warm fluids to become near neutrally buoyant. Based on this mechanism, we propose a new hypothesis to explain diffuse venting at the edges of black-smoker fields and after dike-injections.
29 X - 28 COUMOU ET AL.: HIGH-RESOLUTION 3D SIMULATIONS OF BLACK SMOKER SYSTEMS Acknowledgments. We thank reviewers William Wilcock and John Maclennan as well as Wim van Westrenen as associate editor for their useful comments which have substantially improved the quality of the manuscript. This work was supported by the Swiss National Science Foundation (grant ). References Alt, J. (1995), Subseafloor processes in mid-ocean ridge hydrothermal systems Seafloor Hydrothermal Systems. (ed. S.E. Humphris, R.A. Zierenberg, L.S. Mullineaux and R.E. Thomson), Geophys. Monogr., vol. 91, pp Baker, E., and G. Massoth (1987), Characteristics of hydrothermal plumes from two vent fields on the Juan de Fuca Ridge, northeast Pacific Ocean, Earth Planet. Sci. Lett., 85, Baker, E., and T. Urabe (1996), Extensive distribution of hydrothermal plumes along the superfast spreading East Pacific Rise S, J. Geophys. Res., 101 (B4), Bear, J. (1972), Dynamics of Fluids in Porous Media, Dover, New York, USA. Cherkaoui, A., and W. Wilcock (1999), Characteristics of high Rayleigh number twodimensional convection in an open-top porous layer heated from below, J. Fluid Mech., 394, Coogan, L. (2008), Reconciling temperatures of metamorphism, fluid fluxes, and heat transport in the upper crust at intermediate to fast spreading mid-ocean ridges., Geochem. Geophys. Geosyst., 9 (2), doi: /2007gc001,787.
30 COUMOU ET AL.: HIGH-RESOLUTION 3D SIMULATIONS OF BLACK SMOKER SYSTEMS X - 29 Coumou, D., T. Driesner, S. Geiger, C. Heinrich, and S. Matthai (2006), The dynamics of mid-ocean ridge hydrothermal systems: Splitting plumes and fluctuating vent temperatures, Earth Planet. Sci. Lett., 245, Coumou, D., T. Driesner, and C. Heinrich (2008a), The structure and dynamics of midocean ridge hydrothermal systems., SCIENCE, 321, Coumou, D., T. Driesner, and C. Heinrich (2008b), Heat transport at boiling, near critical conditions, Geofluids, 8, Coumou, D., S. Matthai, S. Geiger, and T. Driesner (2008c), A parallel FE-FV scheme to solve fluid flow in complex geologic media., Comp. Geoscience, 34, Coumou, D., T. Driesner, P. Weis, and C. Heinrich (2009), Phase separation, brine formation and salinity variation at black smoker hydrothermal systems., J. Geophys. Res., doi: /2008jb Driesner, T. (2007), The system H 2 O-NaCl. part II: Correlations for molar volume, enthalpy, and isobaric heat capacity from 0 to 1000 c, 0 to 5000 bar, and 0 to 1x NaCl., Geochim. Cosmochim. Ac., 71, Driesner, T., and C. Heinrich (2007), The system H 2 O-NaCl. part I: Correlation formulae for phase relations in temperature-pressure-composition space from 0 to 1000 c, 0 to 5000 bar, and 0 to 1x NaCl., Geochim. Cosmochim. Ac., 71, Dunn, R., D. Toomey, and S. Solomon (2000), Three-dimensional seismic structure and physical properties of the crust and shallow mantle beneath the East Pacific Rise at 9 30 n., J. Geophys. Res., 105 (B10), 23,537 23,556. Fisher, A. (1998), Permeability within basaltic oceanic crust., Rev. Geophys., 36,
31 X - 30 COUMOU ET AL.: HIGH-RESOLUTION 3D SIMULATIONS OF BLACK SMOKER SYSTEMS Fisher, A. (2001), Energy and Mass Transfer in Marine Hydrothermal Systems. (ed. P.E. Halbach, V. Tunnicliffe and J.R. Hein), Dahlem Workshop Report, vol. 89, pp Fontaine, F., and W. Wilcock (2007), Two-dimensional numerical models of open-top hydrothermal convection at high rayleigh and nusselt numbers: Implications for midocean ridge hydrothermal circulation., G-cubed, 8 (7), doi: /2007gc001,601. Geiger, S. (2004), Numerical simulation of the hydrodynamics and thermodynamics of NaCl-H 2 O fluids., Ph.D. thesis, ETH Zurich, Switzerland. Geiger, S., S. Roberts, S. Matthai, C. Zoppou, and A. Burri (2004), Combining finite element and finite volume methods for efficient multiphase flow simulations in highly heterogeneous and structurally complex geologic media., Geofluids, 4, Geiger, S., T. Driesner, C. Heinrich, and S. Matthai (2006), Multiphase thermohaline convection in the Earth s crust: I. A novel finite element - finite volume solution technique combined with a new equation of state for NaCl-H 2 O., Transport Porous Med., 63, Ginster, U., M. Mottl, and R. Von Herzen (1994), Heat flux from black smokers on the Endeavour and Cleft segments, Juan de Fuca Ridge., J. Geophys. Res., 99 (B3), Grant, M., I. Donaldson, and P. Bixley (1984), Geothermal reservoir engineering, Hemisphere Publishing Corporation. Haar, Gallagher, and Kell (1982), NBS/NRC Steam Tables, Academic Press. Hannington, M., I. Jonasson, P. Herzig, and S. Petersen (1995), Physical and Chemicla Processes of seafloor mineralization at mid-ocean ridges. In Seafloor Hydrothermal Systems: Physical, chemical biological and geological interactions. (ed. E. Humphris, R.
32 COUMOU ET AL.: HIGH-RESOLUTION 3D SIMULATIONS OF BLACK SMOKER SYSTEMS X - 31 Zierenberg, L. Mullineaux and R. Thomson.), Geophys. Monogr., vol. 91, pp Hayba, D. O., and S. Ingebritsen (1994), Multiphase groundwater flow near cooling plutons., J. Geophys. Res., 102 (B6), 12,235 12,252. Hayman, N., and J. Karson (2007), Faults and damage zones in fast-spread crust exposed on the north wall of the Hess Deep Rift: Conduits and seals in seafloor hydrothermal systems., Geochem. Geophys. Geosyst., 8, doi: /2007gc001,623. Hayman, N., and J. Karson (2009), Crustal faults exposed in the Pito Deep Rift: Conduits for hydrothermal fluids on the southeast Pacific Rise., Geochem. Geophys. Geosyst., 10, doi: /2008gc002,319. Hirth, G., J. Escartn, and J. Lin (1998), The rheology of the lower oceanic crust: Implications for lithospheric deformation at mid-ocean ridges. In Faulting and Magmatism at Mid-Ocean Ridges. (ed. W.R. Buck, P.T. Delaney, J.A. Karson and Y. Lagabrielle), Geophys. Monogr., vol. 106, pp Ingebritsen, S., and D. O. Hayba (1994), Fluid flow and heat transport near the critical point of H 2 O., Geophys. Res. Lett., 21 (20), Jupp, T., and A. Schultz (2000), A thermodynamic explanation for black-smoker temperatures., Nature, 403 (6772), Jupp, T., and A. Schultz (2004), Physical balances in subseafloor hydrothermal convection cells., J. Geophys. Res., 109 (B05101), doi: /2003jb002,697. Juteau, T., G. Manac, O. Moreau, C. Lcuyer, and C. Ramboz (2002), The high temperature reaction zone of the Oman ophiolite: new field data, microthermometry of fluid inclusions, PIXE analyses and oxygen isotopic ratios.,
33 X - 32 COUMOU ET AL.: HIGH-RESOLUTION 3D SIMULATIONS OF BLACK SMOKER SYSTEMS Mar. Geoph. Res., 21 (3 4), Kent, G., S. Singh, A. J. Harding, M. C. Sinha, J. Orcutt, P. J. Barton, R. S. White, S. Bazin, R. W. Hobbs, C. H. Tong, and J. W. Pye (2000), Evidence from threedimensional seismic reflectivity images for enhanced melt supply beneath mid-ocean -ridge discontinuities., Nature, 406, Lister, C. (1974), On the penetration of water into hot rock., Geophys. J. R. Astron. Soc., 39, Lister, C. (1995), Heat transfer between magmas and hydrothermal systems, or, six lemmas in search of a theorem, Geophys. J. Int., 120, Lowell, R., and L. Germanovich (1994), On the temporal evolution of high-temperature hydrothermal systems at ocean ridge crests., J. Geophys. Res., 99, Lowell, R., and L. Germanovich (2005), Hydrothermal Processes at Mid-Ocean Ridges: Results From Scale Analysis and Single-Pass Models. In Mid-ocean ridges: Hydrothermal Interactions between the Lithosphere and Oceans. (ed. C.R. German, J. Lin and L.M. Parson), Geophys. Monogr., vol. 148, pp Lowell, R., A. Rona, and R. Von Herzen (1995), Seafloor hydrothermal systems., J. Geophys. Res., 10 (B1), McKenzie, D., J. Jackson, and K. Priestley (2005), Thermal structure of oceanic and continental lithosphere., Earth Plan. Sc. Lett., 233, Paluszny, A., S. Matthai, and M. Hohmeyer (2007), Hybrid finite elementfinite volume discretization of complex geologic structures and a new simulation workflow demonstrated on fractured rocks., Geofluids, 7, 1 23.
34 COUMOU ET AL.: HIGH-RESOLUTION 3D SIMULATIONS OF BLACK SMOKER SYSTEMS X - 33 Rabinowicz, M., J. Boulegue, and P. Genthon (1998), Two- and three-dimensional modeling of hydrothermal convection in the sedimented Middle Valley segment, Juan de Fuca Ridge., J. Geophys. Res., B10, 24,045 24,065. Rabinowicz, M., J. Sempr, and P. Genthon (1999), Thermal convection in a vertical permeable slot: Implications for hydrothermal circulation along mid-ocean ridges, J. Geophys. Res., 104, 29,275 29,292. Ramondenc, P., L. Germanovich, K. Von Damm, and R. Lowell (2006), The first measurements of hydrothermal heat output at 9 50 N,East Pacific Rise., Earth Planet. Sci. Lett., 245 (3-4), Rosenberg, N., F. Spera, and R. Haymon (1993), The relationship between flow and permeability field in seafloor hydrothermal systems, Earth Planet. Sci. Lett., 116, Saccocia, P., and K. Gillis (1995), Hydrothermal upflow zones in the oceanic crust., Earth Planet. Sci. Lett., 136 (1-2), Schoofs, S., and U. Hansen (2000), Depletion of a brine layer at the base of the ridge-crest hydrothermal system., Earth Planet. Sci. Lett., 180 (3-4), Singh, S., G. Kent, J. Collier, A. J. Harding, and J. Orcutt (1998), Melt tomush variations in crustal magma properties along the ridge crest at the southern East Pacific Rise., Nature, 394, Sinton, J., and R. Detrick (1992), Mid-ocean ridge magma chamber., J. Geophys. Res., 168, Straus, J., and G. Schubert (1977), Thermal convection of water in a porous medium: Effects of temperature and pressure-dependent thermodynamic and transport properties,
35 X - 34 COUMOU ET AL.: HIGH-RESOLUTION 3D SIMULATIONS OF BLACK SMOKER SYSTEMS J. Geophys. Res., 82 (2), Tivey, M., and H. Johnson (2002), Crustal magnetization reveals subsurface structure of Juan de Fuca Ridge hydrothermal vent fields., Geology., 30 (11), Tolstoy, M., F. Waldhause, D. Bohnenstiehl, R. Weekly, and W. Kim (2008), Seismic identification of along-axis hydrothermal flow on the East Pacific Rise., Nature, 451, Travis, B., D. Janecky, and N. Rosenberg (1991), Three-dimensional simulation of hydrothermal circulation at mid-ocean ridges, Geophys. Res. Lett., 18 (8), Von Damm, K., M. Lilley, W. Shanks, M. Brockington, A. Bray, K. O Grady, E. Olson, A. Graham, G. Proskurowski, and the SouEPR Science Party (2003), Extraordinary phase separation and segregation in vent fluids from the southern East Pacific Rise., Earth Planet. Sci. Lett., 206, Wilcock, W. S. D. (1998), Cellular convection models of mid-ocean ridge hydrothermal circulation and the temperatures of black smoker fluids., J. Geophys. Res., 103 (B2), Wilcock, W. S. D., and A. McNabb (1996), Estimates of crustal permeability on the Endeavour segment of the Juan de Fuca mid-ocean ridge., Earth Planet. Sci. Lett., 138,
36 COUMOU ET AL.: HIGH-RESOLUTION 3D SIMULATIONS OF BLACK SMOKER SYSTEMS X - 35 Figure 1. 3D mesh consisting of 2.5 M tetrahedron elements (finest resolution between dashed lines). Resolution is refined towards the axial center and colors indicate computational domains assigned to separate processors. At the bottom boundary the bellshaped form of the heat flux profile is plotted. Figure 2. Bottom temperatures in the axial region for models with different (homogeneous) permeability-heat flux combinations: (a) q = 75MW km 1 and k = m 2 after 660 years (b) q = 75MW km 1 and k = m 2 after 660 years (c) q = 350MW km 1 and k = m 2 after 150 years and (d) q = 350MW km 1 and k = m 2 after 150 years Figure 3. Thermal structure of homogeneous permeability simulations with a 75MW/km heat flux. Figure a) shows cross-sections plotting isotherms every 50 C, figure b) shows the 300 C isotherm, both from a simulation with k = m 2 after 660 years. Figures c) and d) plot the same results for a simulation with a 100m thick axial plain having a permeability of k = m 2 in the center after 330 years. Figure 4. Thermal structure of homogeneous permeability simulations with a 350MW/km heat flux after 120 years. Figure a) shows cross-sections plotting isotherms every 50 C, Figure b) shows the 380 C isotherm, both from a simulation with k = m 2. Figures c) and d) plot the same results for a simulation with k = m 2.
37 X - 36 COUMOU ET AL.: HIGH-RESOLUTION 3D SIMULATIONS OF BLACK SMOKER SYSTEMS Figure 5. Recharge through the top and vertical mass fluxes [kg m 2 s 1 ] through horizontal sections at 100, 500 and 900m depth, for homogeneous permeability models with a heat flux of 350MW/km after 120 years. The two black lines represent the 100 C and 300 C isotherms. The top pictures were generated using a permeability of k = m 2. The bottom pictures were generated using a permeability of k = m 2. Note the difference in scale between pictures on the left and the rest. Figure 6. Average recharge [kg m 2 s 1 ] versus distance from the axis for homogeneous permeability models of k = m 2 (solid) and k = m 2 (dashed) Figure 7. Investigated permeability models with an increased permeability towards the axis. Figure 8. Thermal structure of heterogeneous permeability simulations. Figure a) shows cross-sections plotting isotherms every 50 C, b) shows the 380 C isotherm using permeability profile 1 (see Figure 7) after 120 years. Figures (c)-(f) plot the same results for, respectively permeability profile 2 (c and d) and profile 3 (e and f). Figure 9. Recharge through the top and vertical mass fluxes [kg m 2 s 1 ] through horizontal sections at 100, 500 and 900m depth, for heterogeneous permeability models: Using permeability profile 1 (top row), permeability profile 2 (2 nd row) and permeability profile 3 (3 rd row). All were generated at a simulation time of 120 years. Note the difference in scale between pictures on the left-hand panels and the others.
38 COUMOU ET AL.: HIGH-RESOLUTION 3D SIMULATIONS OF BLACK SMOKER SYSTEMS X - 37 Figure 10. Average recharge [kg m 2 s 1 ] versus distance from the axis for heterogeneous permeability models. Using permeability profile 1 (solid line), permeability profile 2 (dashed line) and permeability profile 3 (dotted line). Figure 11. Immature convective flow pattern at early simulation times (50 years), using permeability profile 3 (Figure 7). a) Recharge through the top boundary (i.e. seafloor), b) vertical mass fluxes at 100m, 500m and 900m horizontal slices through the model, c) volumetric discharge through the top boundary. In c) the blue areas are recharge areas, red areas are discharge areas. Large colored structures indicate areas of vigorous discharge, where the height of the structures is a measure for the volume flux through the top surface. The black line is the 100 C isotherm. Figure 12. Investigated temperature dependent permeability models k(t ). Figure 13. Maximum discharge temperature as a function of temperature-dependent permeability profile. Numbers refer to permeability profiles as defined in figure 12 Figure 14. Temperature at the top surface of temperature-dependent-permeability simulations, using k(t )-function 1 (a), k(t )-function 2 (b), k(t )-function 3 (c) and k(t )-function 4 (d) (see Figure 12)
39 X - 38 COUMOU ET AL.: HIGH-RESOLUTION 3D SIMULATIONS OF BLACK SMOKER SYSTEMS Figure 15. (a) Density (solid line) and viscosity (dashed line) as function of temperature. (b) Vertical pressure gradient (equation 4) as function of upwelling and downwelling temperature, γ = 1. (c) Fluxibility F (equation 5) as function of upwelling and downwelling temperature, γ = 1 and k = m 2. (d) Vertical mass flux (equation 3) as function of temperature. Figures (e) and (f) plot the same as (b) and (c) respectively with γ = 3. For generation of all of these plots a pressure of 25MPa was used.
40
41
42
43
44
45
46

47

48
49

50
51
52
53

54
The importance of understanding coupled processes in geothermal reservoirs. Thomas Driesner October 19, 2016
 The importance of understanding coupled processes in geothermal reservoirs Thomas Driesner October 19, 2016 Findings from natural hydrothermal systems Interaction of permeability and fluid properties The
Dynamics and storage of brine in mid-ocean ridge hydrothermal systems
 JOURNAL OF GEOPHYSICAL RESEARCH, VOL. 111,, doi:10.1029/2005jb003866, 2006 Dynamics and storage of brine in mid-ocean ridge hydrothermal systems Fabrice J. Fontaine 1 and William S. D. Wilcock 1 Received
The interplay of non-static permeability and fluid flow as a possible pre-requisite for supercritical geothermal resources
 Available online at www.sciencedirect.com ScienceDirect Energy Procedia 40 (2013 ) 102 106 European Geosciences Union General Assembly 2013, EGU Division Energy, Resources & the Environment, ERE The interplay
(my) Current understanding of plate divergence processes at mid-oceanic ridges (in 24 slides)
 Current understanding of plate divergence processes at mid-oceanic ridges (in 24 slides)") (my) Current understanding of plate divergence processes at mid-oceanic ridges (in 24 slides) q 1962-2018 mid-ocean ridge processes (magmatism, tectonics, hydrothermalism) : discoveries, evolving concepts,
(my) Current understanding of plate divergence processes at mid-oceanic ridges (in 24 slides) q 1962-2018 mid-ocean ridge processes (magmatism, tectonics, hydrothermalism) : discoveries, evolving concepts,
ES265 Order of Magnitude Phys & Chem Convection
 ES265 Order of Magnitude Phys & Chem Convection Convection deals with moving fluids in which there are spatial variations in temperature or chemical concentration. In forced convection, these variations
Earthquakes. Earthquakes are caused by a sudden release of energy
 Earthquakes Earthquakes are caused by a sudden release of energy The amount of energy released determines the magnitude of the earthquake Seismic waves carry the energy away from its origin Fig. 18.1 Origin
THERMAL THERMAL AND AND RHEOLOGIC SIGNATURES OF
 THERMAL THERMAL AND AND RHEOLOGIC SIGNATURES OF OF HIGH HIGH ENTHALPY ENTHALPY RESOURCES ENGINE ENGINE Workshop Workshop Exploring Exploring high high temperature temperature reservoirs: reservoirs: new
Plate Tectonics. entirely rock both and rock
 Plate Tectonics I. Tectonics A. Tectonic Forces are forces generated from within Earth causing rock to become. B. 1. The study of the origin and arrangement of Earth surface including mountain belts, continents,
Earth as a planet: Interior and Surface layers
 Earth as a planet: Interior and Surface layers Bibliographic material: Langmuir & Broecker (2012) How to build a habitable planet Internal structure of the Earth: Observational techniques Seismology Analysis
G 3. AN ELECTRONIC JOURNAL OF THE EARTH SCIENCES Published by AGU and the Geochemical Society
 Geosystems G 3 AN ELECTRONIC JOURNAL OF THE EARTH SCIENCES Published by AGU and the Geochemical Society Article Volume 8, Number 7 26 July 2007 Q07010, doi: ISSN: 1525-2027 Click Here for Full Article
EVALUATING HEAT FLOW AS A TOOL FOR ASSESSING GEOTHERMAL RESOURCES
 PROCEEDINGS, Thirtieth Workshop on Geothermal Reservoir Engineering Stanford University, Stanford, California, January 31-February 2, 2005 SGP-TR-176 EVALUATING HEAT FLOW AS A TOOL FOR ASSESSING GEOTHERMAL
The influence of short wavelength variations in viscosity on subduction dynamics
 1 Introduction Deformation within the earth, driven by mantle convection due primarily to cooling and subduction of oceanic lithosphere, is expressed at every length scale in various geophysical observations.
DIKE EMPLACEMENT AND HYDROTHERMAL PROCESSES ON MARS Kathleen Craft, Virginia Tech Advisor: Robert Lowell, Virginia Tech
 DIKE EMPLACEMENT AND HYDROTHERMAL PROCESSES ON MARS Kathleen Craft, Virginia Tech Advisor: Robert Lowell, Virginia Tech Abstract Many features on the surface of Mars indicate that water contributed to
Thermal and compositional structure of the Mantle and Lithosphere
 Chapter 1 Thermal and compositional structure of the Mantle and Lithosphere 1.1 Primordial heat of the Earth The most widely accepted planetary formation theory says that the solar system accreted from
Ann Moulding and Tom Brikowski University of Texas at Dallas, Department of Geosciences
 GRC Transactions, Vol. 39, 2015 Influence of Continuously Variable Permeability and Basin Rock Properties on Three Dimensional Heat and Mass Balance Models of Basin & Range Geothermal Systems Ann Moulding
Origin and Evolution of the Ocean Floor
 Origin and Evolution of the Ocean Floor Outline Mapping the Ocean Floor Continental Margins Origin of Oceanic Lithosphere Structure of Ocean Crust Mapping the ocean floor Depth originally measured by lowering
Heat (& Mass) Transfer. conceptual models of heat transfer. large scale controls on fluid movement. distribution of vapor-saturated conditions
 Transfer. conceptual models of heat transfer. large scale controls on fluid movement. distribution of vapor-saturated conditions") Heat (& Mass) Transfer conceptual models of heat transfer temperature-pressure gradients large scale controls on fluid movement distribution of vapor-saturated conditions fluid flow paths surface manifestations
Heat (& Mass) Transfer conceptual models of heat transfer temperature-pressure gradients large scale controls on fluid movement distribution of vapor-saturated conditions fluid flow paths surface manifestations
A Si-Cl geothermobarometer for the reaction zone of high-temperature, basaltic-hosted mid-ocean ridge hydrothermal systems
 A Si-Cl geothermobarometer for the reaction zone of high-temperature, basaltic-hosted mid-ocean ridge hydrothermal systems Fabrice Fontaine, William Wilcock, Dionysis Foustoukos, David Butterfield To cite
EARTH S ENERGY SOURCES
 EARTH S ENERGY SOURCES The geological processes that shape the Earth s surface are powered by two major sources of energy; geothermal heat from the Earth s interior and external energy from the sun. The
Topics. Magma Ascent and Emplacement. Magma Generation. Magma Rise. Energy Sources. Instabilities. How does magma ascend? How do dikes form?
 Magma Ascent and Emplacement Reading: Encyclopedia of Volcanoes: Physical Properties of Magmas (pp. 171-190) Magma Chambers (pp. 191-206) Plumbing Systems (pp. 219-236) Magma ascent at shallow levels (pp.237-249)
Petrology. Petrology: the study of rocks, especially aspects such as physical, chemical, spatial and chronoligic. Associated fields include:
 Petrology Petrology: the study of rocks, especially aspects such as physical, chemical, spatial and chronoligic. Associated fields include: Petrography: study of description and classification of rocks
Constitution of Magmas. Magmas. Gas Law. Composition. Atomic Structure of Magma. Structural Model. PV = nrt H 2 O + O -2 = 2(OH) -
 -") Constitution of Magmas Magmas Best, Ch. 8 Hot molten rock T = 700-1200 degrees C Composed of ions or complexes Phase Homogeneous Separable part of the system With an interface Composition Most components
Constitution of Magmas Magmas Best, Ch. 8 Hot molten rock T = 700-1200 degrees C Composed of ions or complexes Phase Homogeneous Separable part of the system With an interface Composition Most components
TERRESTRIAL HEAT FLOW: Why do we care? What do we (think we) know? What don t we know (and welcome help with)?
 know? What don t we know (and welcome help with)?") TERRESTRIAL HEAT FLOW: Why do we care? What do we (think we) know? What don t we know (and welcome help with)? Carol Stein University of Illinois at Chicago Seth Stein Northwestern University ~20,000 sites
TERRESTRIAL HEAT FLOW: Why do we care? What do we (think we) know? What don t we know (and welcome help with)? Carol Stein University of Illinois at Chicago Seth Stein Northwestern University ~20,000 sites
Petrology. Petrology: the study of rocks, especially aspects such as physical, chemical, spatial and chronoligic. Classification:
 Petrology Petrology: the study of rocks, especially aspects such as physical, chemical, spatial and chronoligic. Associated fields include: Petrography: study of description and classification of rocks
Thermal-Mechanical Behavior of Oceanic Transform Faults
 Presented at the COMSOL Conference 2008 Boston Thermal-Mechanical Behavior of Oceanic Transform Faults COMSOL Conference - Boston, Massachusetts October 2008 Emily C. Roland - MIT/WHOI Joint Program Mark
A) B) C) D) 4. Which diagram below best represents the pattern of magnetic orientation in the seafloor on the west (left) side of the ocean ridge?
 B) C) D) 4. Which diagram below best represents the pattern of magnetic orientation in the seafloor on the west (left) side of the ocean ridge?") 1. Crustal formation, which may cause the widening of an ocean, is most likely occurring at the boundary between the A) African Plate and the Eurasian Plate B) Pacific Plate and the Philippine Plate C)
1. Crustal formation, which may cause the widening of an ocean, is most likely occurring at the boundary between the A) African Plate and the Eurasian Plate B) Pacific Plate and the Philippine Plate C)
Summary and Conclusions
 Chapter 9 Summary and Conclusions 9.1 Summary The contents of this thesis revolve around the question of what type of geodynamics was active in the Early Earth and other terrestrial planets. The geology
The Model of Oceanic Crust Expansion
 International Journal of Geosciences, 2014, 5, 1594-1601 Published Online December 2014 in SciRes. http://www.scirp.org/journal/ijg http://dx.doi.org/10.4236/ijg.2014.513130 The Model of Oceanic Crust
Origin of the Oceans II. Earth A Living Planet. Earthquakes and Volcanoes. Plate Tectonics II
 Origin of the Oceans II Plate Tectonics II Earth A Living Planet Heat of formation of the planet is trapped at center, gradually escaping Center is nickel and iron Earthquakes and Volcanoes 1 Tracing the
Yellowstone National Park: Regional Groundwater Dynamics in High-Temperature Geothermal Areas
 International Symposium on Regional Groundwater Flow: Theory, Applications and Future Development Yellowstone National Park: Regional Groundwater Dynamics in High-Temperature Geothermal Areas K. Udo Weyer
Lecture 13. Hydrothermal Circulation
 Lecture 13. Hydrothermal Circulation The discovery of hot springs on the ocean floor during the 1970s was one of the most exciting events in the history of oceanography. Although hydrothermal activity
Heat Transfer There are three mechanisms for the transfer of heat:
 Heat Transfer There are three mechanisms for the transfer of heat: Conduction Convection Radiation CONDUCTION is a diffusive process wherein molecules transmit their kinetic energy to other molecules by
Geodynamics Lecture 10 The forces driving plate tectonics
 Geodynamics Lecture 10 The forces driving plate tectonics Lecturer: David Whipp! david.whipp@helsinki.fi!! 2.10.2014 Geodynamics www.helsinki.fi/yliopisto 1 Goals of this lecture Describe how thermal convection
TWO DIFFERENT ROLES OF FRACTURES IN GEOTHERMAL DEVELOPMENT
 TWO DIFFERENT ROLES OF FRACTURES IN GEOTHERMAL DEVELOPMENT Mineyuki Hanano Japan Metals & Chemicals Co., Ltd., 1-3-6 Saien, Morioka-city, Iwate 020-0024, Japan, email: hananom@jmc.co.jp Key Words: geothermal
The Afar Rift Consortium
 The Afar Rift Consortium University of Bristol University of Oxford University of Cambridge British Geological Survey University of Rochester University of Auckland, NZ Opportunistic programme following
Divergent Boundaries: Origin and Evolution of the Ocean Floor Earth - Chapter 13 Stan Hatfield Southwestern Illinois College
 Divergent Boundaries: Origin and Evolution of the Ocean Floor Earth - Chapter 13 Stan Hatfield Southwestern Illinois College Mapping the Ocean Floor Depth was originally measured by lowering weighted lines
Systematic along-axis tidal triggering of microearthquakes observed at N East Pacific Rise
 Click Here for Full Article GEOPHYSICAL RESEARCH LETTERS, VOL. 36,, doi:10.1029/2009gl039493, 2009 Systematic along-axis tidal triggering of microearthquakes observed at 9 50 0 N East Pacific Rise D. F.
( ) = 1005 J kg 1 K 1 ;
 = 1005 J kg 1 K 1 ;") Problem Set 3 1. A parcel of water is added to the ocean surface that is denser (heavier) than any of the waters in the ocean. Suppose the parcel sinks to the ocean bottom; estimate the change in temperature
Problem Set 3 1. A parcel of water is added to the ocean surface that is denser (heavier) than any of the waters in the ocean. Suppose the parcel sinks to the ocean bottom; estimate the change in temperature
SEA-FLOOR SPREADING. In the 1950 s and early 1960 s detailed study of the oceans revealed the following surprising information:-
 SEA-FLOOR SPREADING In the 1950 s and early 1960 s detailed study of the oceans revealed the following surprising information:- Detailed bathymetric (depth) studies showed that there was an extensive submarine
G 3. AN ELECTRONIC JOURNAL OF THE EARTH SCIENCES Published by AGU and the Geochemical Society
 Geosystems G 3 AN ELECTRONIC JOURNAL OF THE EARTH SCIENCES Published by AGU and the Geochemical Society Article Volume 10, Number 12 22 December 2009 Q12012, doi:10.1029/2009gc002707 ISSN: 1525-2027 A
Global Tectonics. Kearey, Philip. Table of Contents ISBN-13: Historical perspective. 2. The interior of the Earth.
 Global Tectonics Kearey, Philip ISBN-13: 9781405107778 Table of Contents Preface. Acknowledgments. 1. Historical perspective. 1.1 Continental drift. 1.2 Sea floor spreading and the birth of plate tectonics.
Beall et al., 2018, Formation of cratonic lithosphere during the initiation of plate tectonics: Geology, https://doi.org/ /g
 GSA Data Repository 2018160 Beall et al., 2018, Formation of cratonic lithosphere during the initiation of plate tectonics: Geology, https://doi.org/10.1130/g39943.1. Numerical Modeling Methodology Stokes
Plate Tectonics: A Scientific Revolution Unfolds
 Chapter 2 Lecture Earth: An Introduction to Physical Geology Eleventh Edition Plate Tectonics: A Scientific Revolution Unfolds Tarbuck and Lutgens From Continental Drift to Plate Tectonics Prior to the
Chapter 12 Lecture. Earth: An Introduction to Physical Geology. Eleventh Edition. Earth s Interior. Tarbuck and Lutgens Pearson Education, Inc.
 Chapter 12 Lecture Earth: An Introduction to Physical Geology Eleventh Edition Earth s Interior Tarbuck and Lutgens Earth s Internal Structure Earth s interior can be divided into three major layers defined
MAR110 Lecture #4 Fundamentals of Plate Tectonics
 1 MAR110 Lecture #4 Fundamentals of Plate Tectonics The Ocean Sea Floor is formed Along the Mid-Ocean Ridge Spreading Centers The Ocean Sea Floor is destroyed in the Subduction Zones Figure 4.2 Convection
GLY 155 Introduction to Physical Geology, W. Altermann. Grotzinger Jordan. Understanding Earth. Sixth Edition
 Grotzinger Jordan Understanding Earth Sixth Edition Chapter 4: IGNEOUS ROCKS Solids from Melts 2011 by W. H. Freeman and Company Chapter 4: Igneous Rocks: Solids from Melts 1 About Igneous Rocks Igneous
Anisotropic Modelings of the Hydrothermal Convection in Layered Porous Media
 J. Phys. Earth, 40, 555-564, 1992 Anisotropic Modelings of the Hydrothermal Convection in Layered Porous Media Hidenori Masamoto* and Satoru Honda** Department of Earth and Planetary Systems Science, Faculty
Heat Transfer II: Time-Dependent Heatflow and Evolution of the Oceanic Lithosphere
 Heat Transfer II: Time-Dependent Heatflow and Evolution of the Oceanic Lithosphere Learning objectives: I can explain the solution for the instantaneous heating or cooling of a semi-infinite half-space.
Numerical Simulation of the Thermal Convection and Subduction Process in the Mantle
 Chapter 1 Earth Science Numerical Simulation of the Thermal Convection and Subduction Process in the Mantle Project Representative Yoshio Fukao Institute for Research on Earth Evolution, Japan Agency for
UNIT 4: Earth Science Chapter 12: Earth s Internal Processes (pages )
") CORNELL NOTES Directions: You must create a minimum of 5 questions in this column per page (average). Use these to study your notes and prepare for tests and quizzes. Notes will be turned in to your teacher
CORNELL NOTES Directions: You must create a minimum of 5 questions in this column per page (average). Use these to study your notes and prepare for tests and quizzes. Notes will be turned in to your teacher
CONVECTIVE HEAT TRANSFER
 CONVECTIVE HEAT TRANSFER Mohammad Goharkhah Department of Mechanical Engineering, Sahand Unversity of Technology, Tabriz, Iran CHAPTER 5 NATURAL CONVECTION HEAT TRANSFER BASIC CONCEPTS MECHANISM OF NATURAL
Geotherms. Reading: Fowler Ch 7. Equilibrium geotherms One layer model
 Geotherms Reading: Fowler Ch 7 Equilibrium geotherms One layer model (a) Standard model: k = 2.5 W m -1 C -1 A = 1.25 x 10⁻⁶ W m -3 Q moho = 21 x 10-3 W m -2 shallow T-gradient: 30 C km -1 deep T-gradient:
Exploring two-phase hydrothermal circulation at a seafloor pressure of 25 MPa: Application for EPR 9 50 N Liang Han
 Exploring two-phase hydrothermal circulation at a seafloor pressure of 25 MPa: Application for EPR 9 50 N Liang Han Thesis submitted to the faculty of the Virginia Polytechnic Institute and State University
Double-diffusive lock-exchange gravity currents
 Abstract Double-diffusive lock-exchange gravity currents Nathan Konopliv, Presenting Author and Eckart Meiburg Department of Mechanical Engineering, University of California Santa Barbara meiburg@engineering.ucsb.edu
Structure of the Earth
 Structure of the Earth Compositional (Chemical) Layers Crust: Low density Moho: Density boundary between crust and mantle Mantle: Higher density High in Magnesium (Mg) and Iron (Fe) Core: High in Nickel
The importance of the South-American plate motion and the Nazca Ridge subduction on flat subduction below South Peru
 Chapter 7 The importance of the South-American plate motion and the Nazca Ridge subduction on flat subduction below South Peru Abstract Flat subduction near Peru occurs only where the thickened crust of
Plate Tectonics Practice Test
 Plate Tectonics Practice Test 1. What is the main idea Alfred Wegner proposed in the Theory of Continental Drift that he published in 1915? a. The continents float on a liquid layer that allows them to
predictive mineral discovery*cooperative Research Centre A legacy for mineral exploration science Mineral Systems Q4 Fluid flow drivers & pathways
 Mineral Systems Q4 Fluid flow drivers & pathways 1 Key Parameter Mineral System Exploration is reflected in scale-dependent translation A. Gradient in hydraulic potential B. Permeability C. Solubility
CO 2 and heat fluxes in the Apennines, Italy
 CO 2 and heat fluxes in the Apennines, Italy Giovanni Chiodini (INGV, sezione di Bologna, Italy) CO 2 Earth degassing and climate changes CO 2 Earth degassing and tectonics CO 2 flux Mt yr 1 Fossil fuels
What Forces Drive Plate Tectonics?
 What Forces Drive Plate Tectonics? The tectonic plates are moving, but with varying rates and directions. What hypotheses have been proposed to explain the plate motion? Convection Cells in the Mantle
CHAPTER 2 THE WAY THE EARTH WORKS: EXAMINING PLATE TECTONICS
 CHAPTER 2 THE WAY THE EARTH WORKS: EXAMINING PLATE TECTONICS Coverage of plate tectonics is required early in introductory Geology as context for the mineralogy, petrology, structure, internal processes,
Plate Tectonics. Development of a Theory. Mapping the Ocean Floor
 Plate Tectonics Development of a Theory Mapping the Ocean Floor Scientists began exploring the seafloor in greater detail during the late 1940s. They used a device called an echo sounder to measure the
HOMEWORK 3 Draft presentations due November 4 Oral presentations of Group problems, November 6, November 8
 HOMEWORK 3 Draft presentations due November 4 Oral presentations of Group problems, November 6, November 8 Group A1 Modeling marine magnetic anomalies Write a Matlab program to generate marine magnetic
Metals in geothermal fluids and metal precipitations in surface pipelines in Iceland can these been utilized?
 Metals in geothermal fluids and metal precipitations in surface pipelines in Iceland can these been utilized? Dr. Vigdís Hardardóttir, Iceland GeoSurvey - ÍSOR Msc. NordMin course Iceland Nov. 2016 Black
Hydrothermal circulation within the Endeavour Segment, Juan de Fuca Ridge
 Article Volume 11, Number 5 6 May 2010 Q05002, doi:10.1029/2009gc002957 ISSN: 1525 2027 Click Here for Full Article Hydrothermal circulation within the Endeavour Segment, Juan de Fuca Ridge H. Paul Johnson
Ping Cheng Department of Mechanical Engineering University of Hawaii Honolulu, Hawaii 96822
 NUMERICAL AND ANALYTICAL STUDIES ON HEAT AND MASS TRANSFER IN VOLCANIC ISLAND GEOTHERMAL RESERVOIRS Ping Cheng Department of Mechanical Engineering University of Hawaii Honolulu, Hawaii 96822 The Hawaii
Evolution of the Earth
 Evolution of the Earth http://static.newworldencyclopedia.org/f/fe/geologic_clock.jpg Evolution of the Earth Solar system, 4.6 byr Collapse of a nebula Star forms as gravity concentrates material at center
Lab 2: Plate tectonics
 Geology 101 Name(s): Lab 2: Plate tectonics Plate tectonics is the theory that is used to explain geological phenomena worldwide. For this reason, most of the useful maps that illustrate plate tectonics
Marine Geophysics. Plate tectonics. Dept. of Marine Sciences, Ocean College, Zhejiang University. Nov. 8, 2016
 Marine Geophysics Plate tectonics 何小波 Dept. of Marine Sciences, Ocean College, Zhejiang University Nov. 8, 2016 Ocean College (ZJU) Plate tectonics xbhe@zju.edu.cn 1 / 1 Mantle flow and Plate tectonics
Image courtesy Lau ISS Scientists. Donna Blackman, current chair of the R2K Steering Committee Scripps Institution of Oceanography
 Image courtesy Lau ISS Scientists Donna Blackman, current chair of the R2K Steering Committee Scripps Institution of Oceanography 1 meter Endeavour hydrothermal vent chimneys, Juan de Fuca Ridge An integrated,
The Sea Floor. Chapter 2
 The Sea Floor Chapter 2 Geography of the Ocean Basins World ocean is the predominant feature on the Earth in total area Northern Hemisphere = 61% of the total area is ocean. Southern Hemisphere = about
Hydrothermal Chemistry/ Reverse Weathering. Marine Chemistry Seminar
 Hydrothermal Chemistry/ Reverse Weathering Marine Chemistry Seminar 1974 Drever, The Sea Chapter 10:The Magnesium Problem 1979 Edmonds et al., Ridge Crest Hydrothermal Activity and the Balances of Major
Drifting Continents and Spreading Seas. The Road To Plate Tectonics
 Drifting Continents and Spreading Seas The Road To Plate Tectonics Alfred Wegener and the Continental Drift hypothesis: Up until the early 1900s, long-held tradition in the earth sciences stated that continents
Boiling and condensation of saline geothermal fluids above magmatic intrusions. Research Centre for Geosciences, Potsdam, Germany
 PUBLICATIONS RESEARCH LETTER Key Points: Phase separation near the magmatic heat source controls heat transfer efficiency in hydrothermal systems with saline fluids Phase separation above shallow intrusions
The effects of tectonism and magmatism on crack structure in
 The effects of tectonism and magmatism on crack structure in oceanic crust: A seismic anisotropy study C.H. Tong * Department of Earth Science and Engineering, Imperial College London, London SW7 2AZ,
Rock Cycle. Draw the Rock cycle on your remediation page OR use a sheet of notebook paper and staple
 Earth Science Test 8.ESS2.3) Describe the relationship between the processes and forces that create igneous, sedimentary, and metamorphic rocks. I can develop and use models to explain how plate movements
Geo736: Seismicity along mid-ocean ridges
 Geo736: Seismicity along mid-ocean ridges Course Notes: S. G. Wesnousky Spring 2018 Bathymetric maps show the ocean basins of the world are characteristically divided by a bathymetric ridge. The bathymetric
Brittle Deformation. Earth Structure (2 nd Edition), 2004 W.W. Norton & Co, New York Slide show by Ben van der Pluijm
, 2004 W.W. Norton & Co, New York Slide show by Ben van der Pluijm") Lecture 6 Brittle Deformation Earth Structure (2 nd Edition), 2004 W.W. Norton & Co, New York Slide show by Ben van der Pluijm WW Norton, unless noted otherwise Brittle deformation EarthStructure (2 nd
Lecture 6 Brittle Deformation Earth Structure (2 nd Edition), 2004 W.W. Norton & Co, New York Slide show by Ben van der Pluijm WW Norton, unless noted otherwise Brittle deformation EarthStructure (2 nd
Plate Tectonics. Development of a Theory
 CHAPTER 7 LESSON 2 Plate Tectonics Development of a Theory Key Concepts What is seafloor spreading? What evidence is used to support seafloor spreading? What do you think? Read the two statements below
2. Governing Equations. 1. Introduction
 Multiphysics Between Deep Geothermal Water Cycle, Surface Heat Exchanger Cycle and Geothermal Power Plant Cycle Li Wah Wong *,1, Guido Blöcher 1, Oliver Kastner 1, Günter Zimmermann 1 1 International Centre
Practice Exam #1 A Ann Bykerk-Kauffman, Dept. of Geological and Environmental Sciences, California State University, Chico *
 Practice Exam #1 2002 Ann Bykerk-Kauffman, Dept. of Geological and Environmental Sciences, California State University, Chico * Some Comments on the Real Exam This exam covers all material included in
Full file at
 Chapter 2 PLATE TECTONICS AND PHYSICAL HAZARDS MULTIPLE-CHOICE QUESTIONS 1. What direction is the Pacific Plate currently moving, based on the chain of Hawaiian Islands with only the easternmost island
Dissolution and precipitation during flow in porous media
 1/25 Class project for GEOS 692: Transport processes and physical properties of rocks Dissolution and precipitation during flow in porous media Gry Andrup-Henriksen Fall 2006 1 2/25 Outline Introduction
ERTH 456 / GEOL 556 Volcanology. Lecture 06: Conduits
 1 / 28 ERTH 456 / GEOL 556 Volcanology Lecture 06: Conduits Ronni Grapenthin rg@nmt.edu MSEC 356, x5924 hours: TR 3-4PM or appt. September 12, 2016 2 / 28 How does magma get from source to surface? What
Lecture 12 COMPLEX MELTING MODELS. (see books by Shaw, Trace Elements in Magmas (2006) and Zou, Quantitative Geochemistry (2007))
 and Zou, Quantitative Geochemistry (2007))") Lecture 12 COMPLEX MELTING MODELS (see books by Shaw, Trace Elements in Magmas (2006) and Zou, Quantitative Geochemistry (2007)) Thus far we have considered two end-member melting models, batch melting
Lecture 12 COMPLEX MELTING MODELS (see books by Shaw, Trace Elements in Magmas (2006) and Zou, Quantitative Geochemistry (2007)) Thus far we have considered two end-member melting models, batch melting
OCN 201: Seafloor Spreading and Plate Tectonics I
 OCN 201: Seafloor Spreading and Plate Tectonics I Revival of Continental Drift Theory Kiyoo Wadati (1935) speculated that earthquakes and volcanoes may be associated with continental drift. Hugo Benioff
Seismotectonics of intraplate oceanic regions. Thermal model Strength envelopes Plate forces Seismicity distributions
 Seismotectonics of intraplate oceanic regions Thermal model Strength envelopes Plate forces Seismicity distributions Cooling of oceanic lithosphere also increases rock strength and seismic velocity. Thus
Controlled-source electromagnetic imaging of the Middle America Trench o"shore Nicaragua
 Controlled-source electromagnetic imaging of the Middle America Trench o"shore Nicaragua Kerry Key Scripps Institution of Oceanography Collaborators: Samer Naif (SIO, now LDEO), Steven Constable (SIO),
5/24/2018. Plate Tectonics. A Scientific Revolution Unfolds
 1 Plate Tectonics A Scientific Revolution Unfolds 2 3 4 5 6 7 8 9 10 11 12 Chapter 2 Plate Tectonics From Continental Drift to Plate Tectonics Prior to the late 1960s, most geologists believed that the
Announcements. Manganese nodule distribution
 Announcements Lithospheric plates not as brittle as previously thought ESCI 322 Meet in Env. Studies Bldg Rm 60 at 1 PM on Tuesday One week (Thursday): Quiz on Booth 1994 and discussion. (Lots of odd terms
Structure of the Earth and the Origin of Magmas
 Page 1 of 12 EENS 2120 Petrology Tulane University Prof. Stephen A. Nelson Structure of the Earth and the Origin of Magmas This document last updated on 23-Jan-2015 Magmas do not form everywhere beneath
NAME IGNEOUS & METAMORPHIC PETROLOGY INTRUSION OF MAGMA
 NAME 89.304 - IGNEOUS & METAMORPHIC PETROLOGY INTRUSION OF MAGMA 1. The summit of Mauna Loa is 8192 m above the floor of the Pacific Ocean, but only 4169 m of this is above sea level. About 150 m of ocean-floor
MODELLING OF CONDITIONS CLOSE TO GEOTHERMAL HEAT SOURCES
 MODELLING OF CONDITIONS CLOSE TO GEOTHERMAL HEAT SOURCES Sæunn Halldórsdóttir (ÍSOR), Inga Berre (UiB), Eirik Keilegavlen (UiB) and Guðni Axelsson (ÍSOR) Photo: Auður Agla, ÍSOR Heat transfer in geothermal
PHYS 432 Physics of Fluids: Instabilities
 PHYS 432 Physics of Fluids: Instabilities 1. Internal gravity waves Background state being perturbed: A stratified fluid in hydrostatic balance. It can be constant density like the ocean or compressible
Seawater recharge along an eastern bounding fault in Middle Valley, northern Juan de Fuca Ridge
 Click Here for Full Article GEOPHYSICAL RESEARCH LETTERS, VOL. 34, L20602, doi:10.1029/2007gl031347, 2007 Seawater recharge along an eastern bounding fault in Middle Valley, northern Juan de Fuca Ridge
Name Date Class. How have geologists learned about Earth s inner structure? What are the characteristics of Earth s crust, mantle, and core?
 Chapter 4 Plate Tectonics Section 1 Summary Earth s Interior How have geologists learned about Earth s inner structure? What are the characteristics of Earth s crust, mantle, and core? Earth s surface
Continental Drift and Plate Tectonics
 Continental Drift and Plate Tectonics Continental Drift Wegener s continental drift hypothesis stated that the continents had once been joined to form a single supercontinent. Wegener proposed that the
Comparison of Heat and Mass Transport at the Micro-Scale
 Comparison of Heat and Mass Transport at the Micro-Scale E. Holzbecher, S. Oehlmann Georg-August Univ. Göttingen *Goldschmidtstr. 3, 37077 Göttingen, GERMANY, eholzbe@gwdg.de Abstract: Phenomena of heat
Influence of Heat Transfer Process in Porous Media with Air Cavity- A CFD Analysis
 Proceedings of the 4 th International Conference of Fluid Flow, Heat and Mass Transfer (FFHMT'17) Toronto, Canada August 21 23, 2017 Paper No. 161 DOI: 10.11159/ffhmt17.161 Influence of Heat Transfer Process
Earth Systems Science Chapter 7. Earth Systems Science Chapter 7 11/11/2010. Seismology: study of earthquakes and related phenomena
 Earth Systems Science Chapter 7 I. Structure of the Earth II. Plate Tectonics The solid part of the earth system includes processes, just like the atmosphere and oceans. However, the time scales for processes