TEST EMBANKMENT ON GEOTEXTILE ENCASED GRANULAR COLUMNS STABILIZED SOFT GROUND. Iman Hossein Pour Babaei
|
|
|
- Ira Allison
- 5 years ago
- Views:
Transcription
1 TEST EMBANKMENT ON GEOTEXTILE ENCASED GRANULAR COLUMNS STABILIZED SOFT GROUND Iman Hossein Pour Babaei Tese de Doutorado apresentada ao Programa de Pósgraduação em Engenharia Civil, COPPE, da Universidade Federal do Rio de Janeiro, como parte dos requisitos necessários à obtenção do título de Doutor em Engenharia Civil. Orientadores: Marcio de Souza Soares de Almeida Mario Vicente Riccio Filho Rio de Janeiro Maio de 2015
2 TEST EMBANKMENT ON GEOTEXTILE ENCASED GRANULAR COLUMNS STABILIZED SOFT GROUND Iman Hossein Pour Babaei TESE SUBMETIDA AO CORPO DOCENTE DO INSTITUTO ALBERTO LUIZ COIMBRA DE PÓS-GRADUAÇÃO E PESQUISA DE ENGENHARIA (COPPE) DA UNIVERSIDADE FEDERAL DO RIO DE JANEIRO COMO PARTE DOS REQUISITOS NECESSÁRIOS PARA A OBTENÇÃO DO GRAU DE DOUTOR EM CIÊNCIAS EM ENGENHARIA CIVIL. Examinada por: Prof. Marcio de Souza Soares de Almeida, Ph.D. Prof. Ennio Marques Palmeira, Ph.D. Prof. Fernando Schnaid, Ph.D. Prof. Jorge Gabriel Zornberg, Ph.D. Prof. Fernando Artur Brasil Danziger, D.Sc. Prof. Mario Vicente Riccio Filho, D.Sc. RIO DE JANEIRO, RJ-BRASIL MAIO DE 2015 ii
3 Babaei, Iman Hossein Pour Test embankment on geotextile encased granular columns stabilized soft ground/ Iman Hossein Pour Babaei- Rio de Janeiro: UFRJ/COPPE, XXXI, 356 p.: il.; 29,7 cm. Orientadores: Marcio de Souza Soares de Almeida Mario Vicente Riccio Filho Tese (doutorado) UFRJ/ COPPE/ Programa de Engenharia Civil, Referências Bibliográficas: p Geosynthetic. 2. Granular columns. 3. Soft soil. 4. Test embankment. 5. Numerical analysis. I. Almeida, Marcio de Souza Soares de et al. II. Universidade Federal do Rio de Janeiro, COPPE, Programa de Engenharia Civil. III. Título. iii
4 To my mother and my grandfather, without whom I would ever have come here, and my sisters iv
5 ACKNOWLEDGMENTS First of all, I would like to express my most sincere gratitude to my thesis supervisor, Professor Marcio Almeida, for his dedicated support and guidance throughout the study. I would also appreciate Dr. Mario Riccio for his continuous help to progress properly the aims of this research. Technical staff of Geotechnical Laboratory of COPPE/UFRJ is kindly appreciated particularly engineers Mr. Helcio Souza, Mr. Ricardo Gil Dominges, and Mr. Sergio Iorio due to their assistance with calibration and installation of the instruments as well as the site investigation. My appreciation also goes to engineer Mr. Thanos Nicolas Nikolaou for his company with the instruments reading. I would also thank engineering department of ThyssenKrupp Steel Company specially engineers Mr. Holger Jud, Mr. Marcus Meireles, and Mr. Alexandre Oliveira for their all support and cooperation within the field works, instrumentation, and loading test. Huesker Brazil is kindly appreciated for financial support of the present research and also providing needed geosynthetics material used in the field work. I would also like to thank all people of Geotechnical Laboratory of COPPE/UFRJ for their nice company, conversations over four years, and for their help with professional matters particularly my friends Hamed Mirmoradi, Diego Fagundes, Pablo Trejo, Magnos Baroni, Leonardo Doetti, and Mario Nacinovic. Finally, I would like to extend my deepest appreciation to my family whom without their support and encouragement I would never have chance to get here. v
6 Resumo da Tese apresentada à COPPE/UFRJ como parte dos requisitos necessários para a obtenção do grau de Doutor em Ciências (D.Sc.) ATERRO EXPERIMENTAL SOBRE SOLO MOLE TRATADO COM COLUNAS GRANULARES ENCAMISADAS Iman Hossein Pour Babaei Maio/2015 Orientadores: Marcio de Souza Soares de Almeida Mario Vicente Riccio Filho Programa: Engenharia Civil O comportamento de colunas granulares encamisadas com geossintéticos suportando um aterro teste foi estudado por meio de modelagem em escala real e análise numérica. O escopo deste trabalho foi avaliar o desempenho do solo tratado em termos de deslocamentos verticais e horizontais na fundação do solo, as tensões verticais totais na base do aterro, o excesso de poro pressão, como, também, as forças de tração no anel do geotêxtil. O aterro teste foi executado em uma área experimental localizada no pátio da Companhia TKCSA, Rio de Janeiro, Brasil. Uma análise complementar de elementos finitos foi realizada usando o programa PLAXIS com dados de entrada obtidos de uma investigação geotécnica detalhada, sendo, os resultados foram comparados com dados de campo. Cálculos analíticos foram realizados e as limitações e aplicabilidade de ambos modelos numéricos e analíticos foram avaliados. Análises paramétricas foram realizadas, e a influência de parâmetros tais como a rigidez do geossintético, espessura da argila e altura do aterro na resposta do solo tratado com colunas granulares encamisadas foram avaliadas. Adicionalmente, as medições de campo foram comparadas com os dados obtidos a partir de um aterro teste reforçado, sendo então, a eficácia das colunas granulares encamisadas com geossintéticos discutida. vi
7 Abstract of Thesis presented to COPPE/UFRJ as a partial fulfillment of the requirements for the degree of Doctor of Science (D.Sc.) TEST EMBANKMENT ON GEOTEXTILE ENCASED GRANULAR COLUMNS STABILIZED SOFT GROUND Iman Hossein Pour Babaei May/2015 Advisors: Marcio de Souza Soares de Almeida Mario Vicente Riccio Filho Department: Civil Engineering The behaviour of the geotextile encased granular columns (GECs) supporting a test embankment was investigated by means of full-scale modeling and numerical analysis. The scope of the study was to evaluate the performance of the composite ground in terms of vertical and horizontal displacements of the foundation soil, total vertical stress below the embankment, excess pore pressure as well as geotextile ring tensile force. The test embankment was constructed in the test area located inside of the stockyard of TKCSA Company, Rio de Janeiro, Brazil. Complementary finite element analyses were performed using the PLAXIS code with input data provided from a comprehensive site investigation and the results were compared with field measurements. Analytical calculations were carried out and the limitations and capabilities of both the numerical and analytical methods were assessed. Parametric analyses were also conducted and influence of the parameters such as geosynthetic stiffness, clay thickness, and embankment height on the response of the GECs composite ground was evaluated. Additionally, the field measurements were compared with the data obtained from a reinforced test embankment and the effectiveness of the geosynthetic encased granular columns was then discussed. vii
8 LIST OF CONTENTS CHPATER 1: Introduction and Scope of Work Introduction Significance of geosynthetic encased granular columns (GECs) Research objectives Organization of the thesis...4 CHPATER 2: Embankment on Geosynthetic Encased Granular Columns Introduction Methods of execution Displacement method Replacement (excavation) method Principles of behaviour and design aspects Bearing behaviour under vertical loads Stress concentration ratio Geotextile encasement selection Reviews on previous researches Experimental investigations and field tests Numerical tools applied to GEC Analytical methods used in design Case histories and practical experiences...80 CHPATER 3: Site Investigation Introduction General objectives Overview of the test area Location of the research clusters Standard penetration test (SPT) Piezocone test (CPTu) Piezocone equipment used...95 viii
9 Corrected cone tip and friction resistance Soil behaviour based on CPTu data Coefficient of horizontal consolidation Vane shear test (VST) VST equipment utilized Results of VSTs Empirical cone factors Profile of undrained shear strength Soil sampling Index tests Results of the index tests Sample quality assessment Oedometer consolidation test Variations of E oed and k v in consolidation tests Stress history Corrected coefficients of consolidation Consolidated undrained triaxial tests Final remarks CHPATER 4: Ground Instrumentation and Field Loading Test Introduction Significance of instrumentation Application of instruments Monitoring of excess pore pressure Vibrating wire (VW) piezometer Installation of VW piezometer Monitoring of soil horizontal deformation Inclinometer components Installation of inclinometer casing Monitoring of vertical deformation Vibrating wire (VW) settlement sensor ix
10 Installation of settlement sensors Monitoring of column diameter deformation Assembling of column diameter extensometer Installation of column diameter extensometer Monitoring of total vertical stress Vibrating wire (VW) stress cell Instruments utilized Field loading test Granular columns and geosynthetic materials Basal reinforcement Fill material and embankment construction CHPATER 5: Results and Discussions of Field Measurements Introduction Measurements by settlement sensors Total surface settlement Differential settlement Measurements by Inclinometers Profile of the soil horizontal deformation Maximum soil horizontal displacement Prediction of the maximum horizontal displacement Soil distortion Measurements by total stress cells Total vertical stress below the embankment Stress concentration ratio Measurements by piezometers Measurements by extensometers Column diameter deformation (geotextile expansion) Mobilized ring tensile force Prediction of the mobilized ring tensile force Final remarks x
11 CHPATER 6: Numerical and Analytical Studies Introduction Validation of numerical modeling Analytical solution- Raithel and Kempfert (2000) Numerical analysis Model validation Sensitivity analyses Influence of soft soil thickness Settlement reduction ratio (SRR) Critical height of embankment Vertical stress ratio and stress concentration factor Distribution of the geosynthetic hoop force Finite element analysis of the test embankment Axi-symmetric simulation Comparison of numerical results and measured data Measured and predicted surface settlements Measured and predicted total vertical stresses Measured and predicted excess pore pressures Measured and predicted geotextile expansion Influence of the spacing between the columns Plane strain simulation Measured and predicted surface settlements Measured and predicted excess pore pressures Measured and predicted soil horizontal deformation Influence of the basal geogrid stiffness Assessment of yielding state Comparison of analytical solution and field measurements Computed surface settlement Computed total vertical stresses Stability analysis of the test embankment xi
12 6.6. Computed settlement improvement factor for the test embankment Final remarks CHPATER 7: Conclusions and Recommendations for Future Studies Introduction Site investigation Field measurements Numerical and analytical studies Recommendations for future studies LIST OF REFERENCES ANNEX A ANNEX B ANNEX C xii
13 LIST OF FIGURES Figure 2-1. Schematic of geosynthetic encased columns supporting embankment... 8 Figure 2-2. Displacement method for GEC installation (Alexiew et al. 2005) Figure 2-3. (a) Inserting the encasement into the metallic tube, (b) filling the encasement with granular material, (c) preparing to lift up the metallic tube with vibration aid and (d) end of process and the metallic tube is lift up (Mello et al. 2008) Figure 2-4. Replacement method stages for encased column installation (Gniel and Bouazza, 2010) Figure 2-5. Excavation and substitution technique with double flap pipe (Alexiew et al. 2005). 12 Figure 2-6. Geometric data of columns arrangement (a) square pattern and (b) triangular pattern (Almeida and Marques, 2013) Figure 2-7. (a) Unit cell scheme and (b) stress distribution Figure 2-8. Interactions at stake under a footing (Kirsch and Kirsch, 2010) Figure 2-9. Loading situations of stone columns (Kirsch and Kirsch, 2010) Figure Measured stress concentration factors at (a) St. Helens and (b) Canvey Island Figure (a) Different configurations of cells used in triaxial tests and (b) triaxial test sample with four encasements (Rajagopal et al. 1999) Figure (a) p-q curves for sand column samples with geocells and (b) stress-strain curves for sand column with different configurations of geocells (Rajagopal et al. 1999) Figure Experimental setup by Sharma et al. (2004) Figure (a) Stress settlement curves for a clay bed alone, a granular pile alone (n= 0), and composite ground and (b) Effect of number of geogrids (n) on the stress settlement response of composite ground Figure Load settlement curves for various foundation supports (Ayadat and Hanna, 2005) Figure Testing box setup (Black et al. 2007) Figure Load-settlement curves of treated and untreated ground (Black et al. 2007) Figure (a) Schematic of load test on stone column in a unit cell and (b) casing pipe with wrapped geotextil fixed with strain gauges (Murugesan and Rajagopal, 2007) xiii
14 Figure Load settlement response of stone columns encased with nonwoven geotextile (Murugesan and Rajagopal, 2007) Figure Hoop strain variation in geosynthetic encasement Figure Sketch and photo of enlarged consolidation cell (Gneil and Bouazza, 2009) Figure Vertical stress strain behaviour of isolated column tests Figure Photographs of extruded isolated column cross-sections (Gneil and Bouazza, 2009) Figure (a) Location of the instrumentation and (b) general view of the loading tests (Araujo et al. 2009) Figure Load displacement curves for tests on conventional and geotextile encased sand columns (Araujo et al. 2009) Figure (a) Scheme of load test on single stone column in large test tank and (b) load tests on a group of stone columns, a c = 23% (Murugesan and Rajagopal, 2010) Figure Load settlement obtained for single ordinary and encased column Murugesan and Rajagopal, 2010) Figure Influence of stone column diameter on vertical load applied (Murugesan and Rajagopal, 2010) Figure Sample preparation and inserted sand column (Sadek et al. 2010) Figure Variation of improvement of undrained shear strength with pressure (Sadek et al. 2010) Figure Schematic view of stone column foundation (Ali et al. 2012) Figure Effect of the encasement length on settlement vertical stress curve of floating column (Ali et al. 2012) Figure Effect of the encasement length on settlement vertical stress curve of end bearing column (Ali et al. 2012) Figure (a) geogrid encasement installation and (b) GEC installation is completed Figure Lateral deflection of un-reinforced and geogrid reinforced stone column (Yoo and Lee, 2012) Figure (a) Clay bed-stone column foundation system and (b) column layout (Dash and Bora, 2013) xiv
15 Figure Post-test deformed shape of stone columns with varied length of encasement (Dash and Bora, 2013) Figure (a) Schematic view of the single stone column foundation and (b) schematic view of foundation with group of stone columns. All dimensions are in millimeters (Ali et al. 2014) Figure (a) Effect of encasement on ground improved with group of end-bearing columns and (b) Effect of horizontal circular discs on ground improved with groups of end-bearing columns (Ali et al. 2014) Figure Typical finite element mesh used in the analyses (Murugesan and Rajagopal, 2006) Figure (a) Lateral bulging observed in stone columns and (b) confining pressure along the column length (Murugesan and Rajagopal, 2006) Figure Influence of geosynthetic encasement on (a) reduction in settlement and (b) maximum lateral bulging (Murugesan and Rajagopal, 2006) Figure Typical FE model of soft clay and encased stone column Figure (a) Stiffness of encasement of settlement reduction ratio and (b) stress concentration on stone column (Malarvizhi and Ilamparuthi, 2007) Figure Three-dimensional column and unit cell representations: (a) stone column layout; (b) 3D column; (c) axi-symmetric unit cell (Yoo and Kim, 2009) Figure (a) Stress concentration ratio against time and (b) development of excess pore pressure with time Figure Typical finite element mesh used in the analyses (Khabbazian et al. 2010) Figure (a) Effect of encasement stiffness on the stress settlement behavior of a GEC and (b) influence of encasement stiffness on column bulging (Khabbazian et al. 2010) Figure Lateral displacement vs. depth for a GEC with varying column diameter (Khabbazian et al. 2010) Figure Geometry and boundary conditions used for model calibration (Keykhosropur et al. 2012) Figure Influence of geosynthetic stiffness on settlement below the center of embankment (Keykhosropur et al. 2012) Figure influence of friction angle of stone material on column bulging (Keykhosropur et al. 2012) xv
16 Figure (a) Influence of the soft clay stiffness of maximum settlement and (b) influence of the column stiffness on maximum settlement (Tandel et al. 2012) Figure Model geometry and mesh generation of GEC unit cell (Elsawy, 2013) Figure Settlement of unreinforced and reinforced soft soil with conventional and encased columns at point A (Elsawy, 2013) Figure Stress concentration ratio versus time (Elsawy, 2013) Figure Calculation model of geotextile-encased column (Zhang and Zhao, 2014) Figure (a) Settlement at top of stone column and (b) bulging depths of stone column (Zhang and Zhao, 2014) Figure Axi-symmetric unit cell approach (Raithel and Kempfert, 2000) Figure Outline of the embankment analysis (Alexiew et al. 2005) Figure Settlements vs. encasing modulus for E oed = 500 kpa (Alexiew et al. 2005) Figure Settlements vs. encasing modulus for E oed = 1000 kpa (Alexiew et al. 2005) Figure Mohr circle for un-encased and encased granular column (Raithel and Henne, 2000) Figure Unit cell model of GEC adopted in analytical solution Figure Vertical stresses on column and soft soil Figure Foundation and typical measurements at the project ABS/NBS Karlsruhe-Basel.. 82 Figure Concept to reclaim land by the construction of a polder Figure Typical soil boundary conditions at the area-extension of the airplane dockyard at Hamburg-Finkenwerder Figure Measured settlements, for example in section VI Figure Mea sured se ttlements at F inkenwerder V ordeich Figure Execution details of encased columns (Mello et al. 2008) Figure Typical solution in the coal/coke stockpile area (Alexiew and Moormann 2009).. 86 Figure Soil improvement factors versus area replacement ratio (Raithel et al. 2005) Figure 3-1. (a) Coal/ore stockyard in TKCSA company and (b) location of the test area Figure 3-2. Test area and location of the research clusters Figure 3-3. Subsurface profile in the test area after SPTs and position of the CPTu and VSTs.. 93 xvi
17 Figure 3-4. Typical probe used in the piezocone test (a) location of pore pressure measurements, and (b) range of piezocone probes (from left: 2cm 2, 10cm 2, 15cm 2, and 40cm 2 ) (Robertson and Cabal, 2015) Figure 3-5. COPPE/UFRJ s piezocone equipment Figure 3-6. Data obtained from piezocone tests (a) corrected cone tip resistance, (b) friction resistance, and (c) pore pressures Figure 3-7. Soil behavior type after CPTu tests performed Figure 3-8. Typical pore pressure dissipation curve obtained from piezocone test (CPTu01-DP3) Figure 3-9. Typical pore pressure dissipation curve obtained from piezocone test (CPTu02-DP2) Figure Coefficient of horizontal consolidation obtained from CPTu tests Figure Components of the VST equipment used in field (Baroni, 2010) Figure Variations of undrained strength from VSTs performed in the test area. (a) VST01; (b) VST02; and (c) VST Figure Variations of clay sensitivity in the test area. (a) VST01; (b) VST02; and (c) VST Figure Empirical cone factor N kt based on VST and CPTu tests correlation Figure Empirical cone factors determination, (a) N u and (b) N ke Figure (a) Undrained strength along soil profile and (b) clay sensitivity Figure Index properties along the soil profile obtained by characterization tests Figure Specimen preparation for oedometer consolidation test Figure Compressibility curves obtained from oedometer consolidation tests Figure Results of oedometer tests, (a) relation of Cs/Cc, (b) compressibility ratio CR, and (c) relation of Cc and w n Figure Variations of oedometer modulus versus vertical stress applied obtained from consolidation tests Figure Variations of the vertical permeability against voids ratio Figure (a) OCR along the soil profile, and (b) variations of the S u / ' vo with depth Figure Corrected coefficient of horizontal consolidation obtained from CPTu tests Figure Coefficient of vertical consolidation obtained from oedometer and CPTu tests xvii
18 Figure Undrained strength obtained from CAU triaxial tests compared with CPTu and VST tests Figure 4-1. Typical VW piezometer, (a) standard piezometer; (b) push-in piezometer (Slope indicator manual, 2004) Figure 4-2. Sequences of VW piezometer installation performed in the test area Figure 4-3. (a) Grooved inclinometer casing and (b) traveling probe and readout unit Figure 4-4. Sequences of inclinometer installation performed in test area Figure 4-5. (a) Typical reservoir box and (b) a settlement sensor used in this research Figure 4-6. Typical operation of settlement sensor and reservoir Figure 4-7. (a) Connection of settlement sensor to reservoir and (b) filling the trench after tubing buried Figure 4-8. Extensometer used to measure column diameter deformation Figure 4-9. Assembling process of diameter extensometers Figure Installation process of radial extensometer to geosynthetic encasement Figure Stress cell placed on top of an encased column Figure Embankment side view, columns arrangement, and instrumentation layout (no scaling) Figure Axial force-strain curve of the geotextile encasement Figure Sinter feed material used as embankment fill Figure Overview of the test area with GECs installed Figure Top view of an encased granular column (after ground scrape) Figure First loading stage of test embankment construction performed in test area Figure Second loading stage of test embankment construction performed in test area Figure Third loading stage of test embankment construction performed in test area Figure Fourth loading stage of test embankment construction performed in test area Figure 5-1. Variation of the total surface settlements versus time Figure 5-2. Influence of GECs on the settlement below the embankment centerline Figure 5-3. Variation of the normalized differential settlement versus time Figure 5-4. Profile of soil horizontal displacement measured just after loading stages Figure 5-5. Profile of soil horizontal displacement measured during post construction (after embankment completion) xviii
19 Figure 5-6. Variation of the maximum soil horizontal deformation versus time Figure 5-7. Variation of the maximum soil horizontal displacement versus total applied stress Figure 5-8. Influence of GECs on the maximum soil horizontal displacement Figure 5-9. Measured relation between maximum settlement under the center of embankment and maximum horizontal displacement beneath embankment toes Figure Profile of the soil vertical distortion measured by (a) IN1 and (b) IN Figure Variation of the maximum distortion versus time Figure Influence of GECs on the soil maximum distortion Figure Measured relation between maximum soil horizontal displacement and maximum distortion Figure Variation of the normalized horizontal displacement versus maximum distortion Figure Influence of GECs on maximum distortion versus normalized vertical stress Figure Total vertical stress measured on top of the encased column and the surrounding soft soil Figure Stress concentration ratio (n) versus time Figure Variation of the excess pore water pressure measured at soft soil versus time Figure Normalized maximal excess pore pressure (measured by PZ2) generated during embankment loading stages Figure Development of the geotextile hoop strains versus time Figure Measured relation between variation of column diameter (geotextile expansion) and settlement at midpoint between the columns Figure Variation of the average mobilized ring tensile force in geotextile encasement versus time Figure Variation of the mobilized ring tensile force in geotextile encasement versus total applied stress Figure Variation of the normalized ring tensile force in geotextile encasement versus maximum distortion Figure Variation of the normalized ring tensile force in geotextile encasement versus column normalized vertical stress xix
20 Figure 6-1. (a) Scheme of GEC adopted in numerical analysis and (b) boundary condition and finite element mesh Figure 6-2. Validation of numerical analysis (FEM) with analytical method (AM), (a) settlement vs. embankment height, (b) vertical stress vs. embankment height, and (c) geosynthetic ring force vs. embankment height Figure 6-3. Settlement vs. embankment height curves for encased column, J= 1000 kn/m Figure 6-4. F inal se ttlement on column s top vs. geosynthetic stiffness Figure 6-5. Settlement reduction ratio vs. geosynthetic stiffness Figure 6-6. Tensile force in geosynthetic vs. geosynthetic stiffness Figure 6-7. (a) Deformed mesh for GEC modeled by FEM and (b) Settlement vs. embankment height for top of the soft soil (point B) and encased column (point A) by FEM, H s = 10 m, J= 4000 kn/m Figure 6-8. Normalized differential settlement vs. embankment height by FEM, H s = 10 m, J= 4000 kn/m Figure 6-9. Vertical stress ratio vs. geosynthetic stiffness Figure Stress concentration factor (SCF) vs. geosynthetic stiffness by FEM Figure Distribution of geosynthetic hoop tensile force vs. depth for different geosynthetic stiffness. Solid line: FEM, dashed line: AM Figure Distribution of hoop force and shear zones in encased column Figure Axi-symmetric FE analysis of the test embankment (a) geometric data of the test embankment and encased columns; (b) axi-symmetric unit cell approach; (c) model adopted and FE mesh in numerical analysis Figure Predicted (FEA) and measured settlements on encased column and surrounding soil Figure Vertical stresses acting on encased column and surrounding soil: measured and predicted (FEA) results Figure Measured and predicted (FEA) stress concentration ratio Figure (a) Vertical stresses on encased column (point A) and soft clay (point B) and (b) distribution of the vertical stress in the encased column and soft clay Figure Measured and computed (FEA) excess pore pressure xx
21 Figure Variations of the horizontal deformation (a) measured and computed (FEA) geotextile expansion and (b) distribution of the horizontal deformation Figure Influence of the spacing between the columns on settlements on the top of the surrounding soil Figure Influence of the spacing between the columns on variation of the total vertical stress acting on encased column Figure Influence of the spacing between the columns on variations of the total vertical stress acting on the top of the surrounding soil Figure Influence of the spacing between the columns on variations excess pore pressure at the middle of soft clay I Figure Plane strain analysis of the test embankment (a) granular columns arrangement; (b) method of plane strain conversion; (c) FE model adopted for plane strain analysis of the test embankment (no scaling) Figure Measured and computed (FEA) settlements versus time Figure Measured and computed (FEA) vertical stresses acting on column and surrounding soil Figure Distribution of settlement at the end of monitoring time obtained by plane strain FE analysis Figure Variations of the measured (PZ1 and PZ2) and computed (FEA) excess pore pressure versus time Figure Distribution of the total vertical stress after monitoring time: (a) using original friction angle of column material (OSC) and; (b) using geosynthetic-equivalent friction angle (GEC) Figure Measured and computed (FEA) soil horizontal deformation at embankment toes: (a) just after construction and (b) end of monitoring time Figure Influence of stiffness modulus of the basal geogrid on: (a) settlement on soil; (b) horizontal deformation below the embankment Figure Distribution of the plastic points during loading stages (a) end of loading stage 1, (b) end of monitoring time (red square: MC plastic point, blue square: SS plastic point) Figure Variation of settlement versus applied stress computed analytically Figure Variation of total vertical stress versus applied stress computed analytically xxi
22 Figure Computed safety factor of the test embankment during construction and consolidation stages Figure Distribution of the excess pore pressure just after loading stage Figure Distribution of the excess pore pressure at the end of monitoring time Figure Comparison of the settlement improvement factor for the test embankment with previous researches (a c = 12.5% and J= 1750 kn/m) xxii
23 LIST OF TABLES Table 2-1. General recommendations for material and geometry of granular columns (FHWA, 1983) Table 2-2. Stress concentration ratio for specific combinations of area replacement ratio and effective friction angle of the stone column material (Ichimoto and Suematsu, 1981) Table 2-3. Material properties used in FE analysis (Murugesan and Rajagopal, 2006) Table 2-4. Material properties used in FE analysis (Malarvizhi and Ilamparuthi (2007) Table 2-5. Constitutive model and parameters of stone column, clay, sand, and embankment fill materials Table 2-6. Material parameters and constitutive models used in FE analyses (Khabbazian et al. 2010) Table 2-7. Material properties used in the numerical analyses (Keykhosropur et al. 2012) Table 2-8. Comparison of settlement at tops of columns via different methods Table 2-9. Accomplished project with geotextile encased gravel/sand columns Table Summary of the column characteristics and results of monitoring (Mello et al. 2008) Table 3-1. Advantages and disadvantages of in-situ and laboratory tests applied to soft soils Table 3-2. Main geotechnical parameters estimated based on in situ and laboratory tests Table 3-3. Depth of the dissipation tests performed Table 3-4. Values the rigidity index after CU triaxial test performed Table 3-5. Time factor for analysis of dissipation test (Houlsby and Teh, 1988) Table 3-6. Classification of soft clays for sensitivity (Skempton and Northey, 1952) Table 3-7. Depth of VSTs performed at different borings Table 3-8. Depth of sampling collected at each research cluster Table 3-9. Summary of sample quality assessment Table Summary of the clay parameters obtained from oedometer consolidation tests Table Summary of the clay properties obtained from CU triaxial tests Table Geotechnical properties of clay deposit after site investigation performed in each research cluster Table 4-1. Summary of the instrumentation used in the present work xxiii
24 Table 4-2. Elastic modulus and friction angle of the encased column material derived from previous researches Table 4-3. Mechanical properties of the geotextile encasement (provided by Huesker) Table 4-4. Loading duration, in situ density, and natural humidity of fill material at each loading stage Table 5-1. Main features of the TE1 compared with the present work Table 5-2. Geotechnical properties for the soft clay of TE1 compared with the present work Table 6-1. Geometric and material parameters used in the analytical method Table 6-2. Constitutive models and material properties used in FE analysis Table 6-3. Case considered in parametric analyses Table 6-4. Material parameters used in FE analysis of the test embankment Table 6-5. Material properties used in analytical analysis of the test embankment Table 6-6. Computed settlement of the test embankment on GEC improved and un-improved soft ground xxiv
25 LIST OF SYMBOLS A Area of the unit cell- m 2 A c Area of the granular column- m 2 (chapter 2) A s d e d c r e r c a c a s S L c Area of the surrounding soft soil- m 2 (chapter 2) Unit cell diameter- m Column diameter- m Unit cell radius- m Column diameter- m Column area replacement ratio Soil area replacement ratio Columns center-to-center spacing- m Column length- m r Radius of geosynthetic encasement - m geo A c A s a b c B H em H crit H s r c Area of the cone tip- m 2 (chapter 3) Area of cone sleeve- m 2 (chapter 3) Piezocone area ratio Plane strain column width- m Equivalent plane strain width- m Height of the embankment- m Critical height of the embankment- m Soft soil thickness- m Variation of the column radius- m xxv
26 d c Variation of the column diameter- m r s z R H d s s s s J S u S t E E oed E u G G s w n w L w P Geotextile hoop (ring) strain Diagonal half span between the columns- m Depth (m) Piezocone probe radius- m Length of the drainage path- m Settlement above the surrounding soft soil- m (chapter 2) Settlement above the encased column- m (chapter 2) Geosynthetic ring stiffness modulus- kn/m Undrained shear strength- kpa Sensitivity Elastic Y oung s mod ulus- kpa Oedometer modulus- kpa Undrained elastic modulus- kpa Soil shear modulus- kpa Specific density of the grain- gr/cm3 Natural water content Liquidity limit Plasticity index Poisson s r atio n Natural density- gr/cm 3 n Natural unit weight- kn/m 3 Submerged unit weight- kn/m 3 sat Saturated unit weight- kn/m 3 em Unit weight of embankment material- kn/m 3 xxvi
27 e e 0 ( ) v0 Voids ratio Initial voids ratio e Voids ratio at the initial effective stress level C c C s C * * M c v c h Oedometer compression index Oedometer swelling index Coefficient of secondary compression Logarithmic compression index Logarithmic swelling index Modified logarithmic compressibility index Modified logarithmic swelling index Inclination of the critical state line in p-q plot Coefficient of soil vertical consolidation- m 2 /s Coefficient of soil horizontal consolidation- m 2 /s c Coefficient of soil horizontal consolidation in normally consolidation state- m 2 /s h( NC) k v k h Coefficient of soil vertical permeability- m/s Coefficient of soil horizontal permeability- m/s p Reference mean stress- kpa ref m C k Dr c K 0 K a Power of stress dependency of stiffness Ratio between changes in voids ratio against coefficient of vertical permeability Relative density Effective cohesion- kpa Effective friction angle- o Soil dilation angle- o Coefficient of at-rest earth pressure Coefficient of active earth pressure xxvii
28 v0 v0 h0 vm v vc, In situ total vertical stress- kpa In situ effective vertical stress- kpa In situ effective horizontal stress- kpa Over consolidation stress- kpa Total applied vertical stress- kpa Total vertical stress acting on column- kpa Total vertical stress acting on surrounding soft soil- kpa vs, hc, hs, Total horizontal stress acting on column- kpa Total horizontal stress acting on soil- kpa Geosynthetic hoop stress- kpa h, geo Differential horizontal stress- kpa h, diff n N, N, N u 0 u 1 u 2 u 3 u i Q c Q T F s q c kt u ke Stress concentration ratio Empirical cone factors Hydrostatic water pressure- kpa Measured pore pressure at cone tip- kpa Measured pore pressure at cone shoulder- kpa Measured pore pressure at top of the sleeve- kpa Initial pore pressure- kpa Piezocone total force acting on tip- KN Piezocone corrected total force acting on tip- KN Total force acting on friction sleeve- KN Piezocone measured tip resistance- kpa xxviii
29 q T f s B q F r * T T v t 50 U h U v I r Piezocone corrected tip resistance- kpa Piezocone sleeve resistance- kpa Normalized pore pressure Friction ratio Time factor for horizontal consolidation Time factor of vertical consolidation Time for 50% dissipation- sec Degree of horizontal consolidation Degree of vertical consolidation Rigidity index u Incremental excess pore pressure- kpa H / D Height-to-width ratio in VST equipment T max p q Maximum torque applied in VST- kn.m (chapter 3) Mean effective stress- kpa Deviator stress- kpa v a vc vc h Volumetric strain in triaxial test Axial strain in triaxial test Settlement on the top of the encased granular column- m (chapter 5) Settlement on the top of the surrounding soft soil- m (chapter 5) Soil horizontal deformation- m (chapter 5) Maximum horizontal deformation- m (chapter 5) h,max v Soil distortion Maximum soil distortion v,max xxix
30 T mob T max F R Mobilized ring tensile force in geotextile encasement- kn/m Maximum allowable ring tensile force - kn/m (chapter 5) Geosynthetic ring tensile force- kn/m h Settlement of un-treated ground- m h Settlement of stabilized ground- m imp Settlement reduction ratio xxx
31 LIST OF ACRONYMS GEC OSC ESC SM CAU CIU UU SPT CPTu VST PMT OCR n.c. o.c. N SPT SBT DS DR HR NR FE FEA AM SCF MC SS Geosynthetic encased granular column Ordinary (un-encased) granular column Encased stone column Sampling Consolidated anisotropic undrained Consolidated isotropic undrained Undrained unconsolidated Standard penetration test Piezocone test Vane shear test Pressure meter test Over consolidation ratio Normally consolidated Over consolidated SPT blow counts Soil behaviour type Differential settlement Ratio between maximum horizontal displacement and maximum settlement Ratio between geotextile expansion and maximum settlement Ratio between mobilized ring tensile force and allowable ring tensile force Finite element Finite element analysis Analytical method Stress concentration factor Mohr-Coulomb model Soft-Soil model xxxi
32 1. Introduction and Scope of Work 1.1. Introduction The increasing infrastructure growth in urban, metropolitan areas and highways has resulted in a dramatic rise in land prices and lack of suitable sites for development. As a result, construction is now carried out on sites which, due to poor ground conditions, would not previously have been considered economic to develop (Mitchell and Huber, 1985). Ground improvement is the modification of foundation soils to provide better performance under operational loading conditions. Ground improvement methods are increasingly used for new projects to allow utilization of sites with poor subsurface conditions and allowing design and construction of needed projects despite poor subsurface conditions, which otherwise would have rendered the project economically unjustifiable or technically not feasible. Structures constructed on soft soils may experience problems, such as excessive settlements, large lateral displacement and slope instability (Almeida and Marques, 2013). A number of methods are available to improve the soft clay deposits, such as stone (or granular) columns (Greenwood, 1970; Hughes et al. 1975), piled embankments (McCuire and Filz, 2008), vacuum pre-consolidation (Indraratna et al. 2004), soil cement columns (Rampello and Callisto, 2003), pre-consolidation using prefabricated vertical drains (Shen et al. 2005), and lime treatment (Rajasekaran and Rao, 2002). Soft soil improvement techniques using column type elements are used worldwide for a large variety of applications when soft soils are present. The conventional column type techniques include conventional granular column, geosynthetic encased columns (GECs), concrete piles, lime or lime-cement columns, and deep soil mixing. Granular piles (vibro-stone columns, geosynthetic-encased columns) are one of the most used column type methods for improving the soft soil or loose sand deposits, although their use in Brazil is relatively recent. This kind of soil improvement method will provide an economic solution for foundation particularly on deep soft soil strata when fully penetration piles maybe expensive or impractical. The basic principle of the granular column in soft clay layer is to relieve the vertical stress on the surrounding soils by transferring most of the embankment load to the competent soil underneath. This can be achieved by installing granular columns in a grid pattern (triangular or rectangular pattern) into a bearing layer, on top of which often a load transfer platform 1
33 consisting of geotextile or geogrid reinforcements is used (Mitchel and Hubber, 1985). Floating columns or piles are also sometimes used (e.g. Weber et al. 1999) but are less common. The stress relieves of the soft soils results from a redistribution of the loads in the embankment through arching, which can be enhanced by the membrane effect provided by the geotextile or geogrid reinforcement. As a result, the compressibility of the improved or composite soft ground can be reduced and also the bearing capacity and shear strength increased. Therefore, the consolidation of the soft soils can be accelerated by these methods and thus the settlements after construction may be minimized considerably, since the granular column type structures act as a vertical drain (Poorooshasb and Meyerhof, 1997) Significance of geosynthetic encased granular columns (GECs) The first idea for encasing of the granular columns was introduced by Ghionna and Jamiolkowski (1981) in which an analytical solution was proposed to calculate the settlement and vertical stress acting on the granular column. Soil improvement techniques with emphasis on GEC were used in European countries in the early 1990 s and their usage spread there after following their successful implementation in different countries (Alexiew et al. 2005). Contrary to the rigid piles which are designed to bypass weak layers to transfer loads into firm strata, the use of granular columns improves the load carrying capacity of the surrounding soil. Granular columns generally expand thus exerting lateral pressure to the soft surrounding clay. In addition, and contrary to conventional piles, granular columns will also accelerate the dissipation of excess pore water pressure during loading (Almeida and Marques, 2013). Granular columns are extensively used in soft clay with undrained shear strength (S u ) less than 50 kpa (FHWA, 1983). However, in very soft clay (S u <15 kpa) the lateral confinement provided by surrounding soft soil is not adequate enough, thus leading the columns to fail due to excessive bulging. In these cases, the positive effect of the granular columns can be improved by encasing the columns with geosynthetics material to provide additional lateral support to the granular columns (Gniel and Bouazza, 2010). The installation of geosynthetics around the perimeter of the granular columns can reduce the bulging of the columns, thus increasing the stiffness and the bearing capacity of the columns. This will increase the ability of the composite ground to sustain the greater embankment vertical stress. Furthermore, the geosynthetic 2
34 encasement prevents intermixing of the surrounding soft clay into the granular materials thus the drainage capacity of the granular columns remains intact (Murugesan and Rajagopal, 2007). The conventional and encased granular columns are possibly the most cost effective systems in existence. They are also more durable than any other soil improvement techniques that would involve the use of cement or steel. As a result, geosynthetic encased granular columns can be considered as one of the vital ground improvement techniques that can be adopted for improving the load carrying capacity of very soft clays supporting embankments Research objectives Research work with emphasis on soft soil engineering is a very traditional line of research covered in over one hundred M.Sc. and Ph.D. theses in COPPE s Geotechnical group. The present and new topic is inserted into this line of research aiming to develop the application of GEC method in soft soil improvement. The main goal of this research was to evaluate the inservice performance of a test embankment constructed on soft ground stabilized by geotextileencased granular columns. Therefore, the stability assessment of the test embankment was not in scope of the present work. The field load test was performed in the test area located inside the stockyard of ThyssenKrupp CSA Company in Santa Cruz at state of Rio de Janeiro, Brazil. The soil profile in the test area is mainly characterized by highly compressible 10 m thick very soft clay. The serviceability behavior of the composite ground was evaluated by careful measurements provided by the instrumentation. The purpose of the ground instrumentation was to assess the general and immediate effectiveness of the GECs on time-dependent response of the treated soft ground in the stockyard nearby. Measurements were performed using a suitable and careful designed instrumentation previously tested under similar conditions (Lima, 2012; Roza, 2012). A specific instrument was adapted to measure variations of the geosynthetic hoop strain as a part of this research. Prior to embankment construction, an extensive site investigation was carried out including standard penetration tests (SPT), vane shear tests (VST), and cone penetration tests with pore pressure measurements (CPTu). Correlation between VST and CPTu made it possible to define the profile of undrained shear strength, over consolidation ratio, and consolidation coefficients of the soft clay. Undisturbed samples were also collected at different depths and then the geotechnical 3
35 properties of the clay layers were obtained from several laboratory tests for the later use in the numerical analysis. More specific aims of the present research included: Validation of a site investigation program for the embankment foundation aiming to define soil parameters, to allow interpretation of the field measurements and also to perform numerical and analytical computations; Conception of a instrumentation program for monitoring of the field loading test, analysis, and discussion of the field measurement results; Comparison of numerical analysis versus analytical method in order to assess capabilities and limitations of computational methods of GECs; Sensitivity finite element axi-symmetric analysis (FEA) to assess the influence of the main parameters involved in GEC such as clay thickness, geosynthetic stiffness, and embankment height; Plane strain analysis allowing to model the full-scale embankment using with due consideration of the 3D layout plus column encasement Organization of the thesis The present thesis is organized in seven chapters and three annexes, complemented by a series of published and accepted journal papers. Details of the contents of each chapter are provided below: Chapter 2 introduces the general features of the geosynthetic encased granular columns (GECs) used for soft soil improvement. It also reviews the related literature including the most significant laboratory and field loading tests on GECs applications in soft clays. Moreover, the analytical and numerical methods developed for predicting the behaviour of the GECs- soft clay composite are described. Chapter 3 presents the results of the site investigation carried out in the test area where the loading test was performed. The results of in situ and laboratory tests are explored in details and then the geotechnical properties of soft clay are determined by the combination of the tests performed. The outcome of this chapter has been published in a journal paper together with the instrumentation results. 4
36 Chapter 4 covers instrumentation and construction of the test embankment in the test area. The instruments, their specifications, and installation methods are described in detail initially. The field load test is then presented including the materials properties and construction of the test embankment. Chapter 5 presents the results obtained from the field loading test and thus the performance of the test embankment is interpreted according to the data provided by the instruments. The effectiveness of the GECs is also discussed by comparing the present results with that of a reinforced test embankment on a very similar soft ground. The results of this chapter were published in two journal papers as listed below. Another journal paper is being prepared to compare the results of this research with the reinforced test embankment. ALMEIDA, M.S.S., HOSSEINPOUR, I., RICCIO, M., ALEXIEW, D., 2015, "Behaviour of geotextile-encased granular columns supporting test embankment on soft deposit", Journal of Geotechnical and Geoenvironmental Engineering, v. 141, n. 3, /(ASCE)GT HOSSEINPOUR, I., RICCIO, M., ALMEIDA, M.S.S., 2015, "Full-scale load test and finite element analysis of soft ground improved by geotextile encased granular columns", Geosynthetics Internationals, In press (accepted). Chapter 6 covers the results of the finite element analyses and analytical calculations. Initially, the finite element method is validated with the available analytical method. Then sensitivity analyses are performed in order to assess the influences of the important parameters on the response of the GECs-soft clay composite ground. The numerical modeling of the test embankment is also performed and the results are compared with field measurements. The capabilities and limitations and of both the numerical and analytical methods are discussed. Some results of this chapter are presented in two published journal papers and one conference paper. ALMEIDA, M.S.S., HOSSEINPOUR, I., RICCIO, M., 2013, "Performance of a geosynthetic-encased column (GEC) in soft ground: numerical and analytical studies", Geosynthetics International, v. 20, n. 4, pp
37 HOSSEINPOUR, I., RICCIO, M., ALMEIDA, M.S.S., 2014, "Numerical evaluation of a granular column reinforced by geosynthetics using encasement and laminated disks", Geotextiles and Geomembranes, v. 42, n. 4, pp (This paper was a subsidiary analysis performed, not specifically, discussed in the body of the thesis) RICCIO, M., ALMEIDA, M.S.S., HOSSEINPOUR, I., 2012, "Comparison of two analytical methods for the design of embankments on geosynthetic encased columns", 2nd Pan American Geosynthetics Conference and Exhibition, Lima, Peru, CD-ROM. (This study/paper was on the use of GEC to decrease lateral stresses in piles near bridges abatements, a topic not specifically discussed in the body of the thesis) Chapter 7 summarizes the main findings of the present research together with some suggestions for the future studies on same topic. Annex A presents a photo documentary of the field works involving the site investigation, instruments calibration, installation of instruments, embankment construction, and executive drawings for the instrumentation. Annex B comprises the raw data of the in situ and laboratory tests in more details. The SPT logs, piezocone dissipation curves, and data of laboratory tests are presented in this annex. Annex C presents the already published journal papers. 6
38 2. Embankment on Geosynthetic Encased Granular Columns 2.1. Introduction Columns supported embankments are constructed on soft ground to accelerate construction, improve embankment stability, control total and differential settlements, and protect adjacent facilities. They are selected to be stiffer and stronger than the surrounding soft soil, and if properly designed, they can prevent excessive movement of the embankment (Almeida and Marques, 2013). The columns are installed at a spacing determined by the design engineer, with lower costs for construction if the columns are properly spaced. A geosynthetic reinforced bridging layer, also known as a load-transfer platform or a load-carrying geosynthetic layer, is often used to transfer embankment and surcharge loads to the columns and to prevent settlements between them. The bridging layer consists of compacted sand or gravel, which may or may not include geosynthetic reinforcement (Filz and Smith, 2006). When included, the geosynthetic reinforcement consists of one or more layers of planar polymeric material, which may be a woven geotextile or, more often, a geogrid. When the granular columns are installed in very soft soils, they may not derive significant load capacity owing to low lateral confinement provided by the surrounding soil. McKenna et al. (1975) reported cases where the granular columns were not restrained by the surrounding soft clay which led to failure due to excessive bulging, and also the soft clay squeezed into the voids of the aggregate. The squeezing of clay into the stone aggregate ultimately reduces the load bearing and also drainage capacity of the granular column. The problem can be solved by wrapping the compacted sand or gravel column with an appropriate-stiffness geosynthetic encasement (Raithel et al. 2002; Alexiew et al. 2005; Murugesan and Rajagopal, 2006). Additional confinement provided by geosynthetic encasement leads the granular columns to become stiffer and thus the load carrying capacity improves. This is particularly more important when the objective is reducing the vertical stress on surrounding soil, leading to reduction in horizontal stress acting on the foundations of adjacent structures (Riccio et al. 2012). Encasement also prevents intermixing of the surrounding soft clay into the column aggregate and thus the drainage capacity of the granular column remains intact (Almeida et al. 2015). Additional and recent application of the encased granular columns is preventing the residual foundation soils to collapse (Araujo et al. 2009). 7
.")
39 Ghionna and Jamiolkowski (1981) and Van Impe and Silence (1986) were probably the first to recognize that columns could be encased by geosynthetics material. They introduced an analytical design technique that was used to assess the required geosynthetic tensile stiffness, and details on this technique were provided by Kempfert et al. (1997). Later, Raithel and Kempfert (2000) proposed an analytical solution for computation of settlement based on the geotextile stiffness and area replacement ratio. This analytical method gives satisfactory estimation of the settlement, vertical stresses on the top of the encased column and soft soil, and geosynthetic hoop force, as well. Raithel et al. (2005) and Alexiew et al. (2005) reported the successful use of GEC in some projects in Europe. Mello et al. (2008) also reported its first use in South America in Sao Jose dos Campos, SP, Brazil. The general scheme of geosynthetic encased columns supporting road embankment is shown in Figure 2-1. Figure 2-1. Schematic of geosynthetic encased columns supporting embankment (Alexiew et al. 2005). According to Alexiew (2002) the main specific characteristics of the GECs system are: The primary and main function is the radial confinement provided by the geosynthetic reinforcement acting on the granular column; The separation, filtration, and drainage role of the geosynthetic reinforcement; The GECs composite system is not completely settlement-free; 8
40 The GECs are typically an end bearing element transferring the embankment load to a firm underlying stratum; The GECs are water-permeable; they practically do not affect the flow of groundwater streams, which has its ecological advantages; The GECs also may perform as high-capacity vertical drains, although it is not their primary function; The geosynthetic encasement is a key bearing / reinforcing element capable of meeting high quality engineering design standards and specifications; It is strongly recommended to install horizontal geosynthetic reinforcement on the top of GECs (in the base of embankment) in order to equalize settlements, to bridge the soft soil, to increase global stability, and to control spreading forces Methods of execution Similar to the ordinary stone columns two execution methods are widely used for GECs installation which refer to the displacement and replacement method as described below Displacement method Encased columns can be executed with or without lateral displacement of the soft clay thus two different methods are generally available with regards to the construction technology. The first technique is the displacement method where a closed-tip steel pipe is driven down into the soft soil followed by the insertion of the circular weave geotextile. The geotextile casing is then filled up with sand or crushed stone aggregate. The tip then opens and the pipe is pulled upwards under optimized vibration designed to compact the column material. The sequence of the displacement method is shown in Figure 2-2. The displacement method is commonly used for extremely soft soils. Encased columns with the displacement method usually have a diameter of approximately 0.80 m and the diameter of the geotextile is ideally equal to the diameter of the internal tube (Alexiew et al. 2005). The column spacing is typically between 1.5 m and 2.5 m and the tensile stiffness modulus of the geotextile (J) generally varies between 1500 kn/m and 4000 kn/m (Kempfert et al. 2002). Figure 2-3 also shows the sequence of encased column installation commonly adopted in Brazil. 9

 (b) (c) Figure 2-3.")
 filling the encasement")

41 Figure 2-2. Displacement method for GEC installation (Alexiew et al. 2005). (a) (b) (c) Figure 2-3. (a) Inserting the encasement into the metallic tube, (b) filling the encasement with granular material, (c) preparing to lift up the metallic tube with vibration aid and (d) end of process and the metallic tube is lift up (Mello et al. 2008). (d) 10
 is driven deep into the bearing layer and the soil within the shaft is removed by auger boring.")
42 Replacement (excavation) method The second construction technique is the replacement method with excavation of the soft soil inside the pipe. In the replacement method, an open steel shaft (usual diameter = 150 cm) is driven deep into the bearing layer and the soil within the shaft is removed by auger boring. The stages of replacement method are showed in Figure 2-4. The replacement method is preferred for soils with relatively higher penetration resistance or when vibration effects on nearby buildings and road installation have to be minimized. The advantage of the displacement method compared to the replacement method is based on the faster and more economical column installation and the effects of pre-stressing the soft soil (Alexiew et al. 2005). Furthermore it is not necessary to excavate and dispose soil. Admittedly, the excess pore water pressure, the vibrations and deformations have to be considered. Figure 2-5 shows auger boring used to excavate soft clay inside the casing. Casing pushed into the soft soil resting on rigid layer. Helical auger is used to remove the soft clay inside the casing. Geogrid sleeve is then placed inside the empty casing. Geogrid sleeve is filled with stone aggregate using funnel. Casing is raised around the encased granular column. Geogrid encased granular column is completed. Figure 2-4. Replacement method stages for encased column installation (Gniel and Bouazza, 2010). 11
 with the traditional stone columns")
 Diameter of columns 0.6 m to 1.")
43 Figure 2-5. Excavation and substitution technique with double flap pipe (Alexiew et al. 2005). Table 2-1 shows parameter for the proper performance of vibro-replacement technique based on the experience of more than 50 years (Greenwood, 1970; FHWA, 1983) with the traditional stone columns technique. Table 2-1. General recommendations for material and geometry of granular columns (FHWA, 1983). Conditioning Factors Recommendations % of soft clay going through the 200 sieve 15% to 30% S u of soft clay Between 15 kpa up to 50 kpa (*) Diameter of columns 0.6 m to 1.0 m Spacing between columns 1.5 m to 3.0 m Length of columns Between 3 m up to 15 m Grain diameter of the column material 20 mm to 75 mm Friction angle of the granular soil 36 to 45 Stone column Young s modulus MPa (lower range for design) (*) FHWA (1983) reports cases with S u values as low as 7.5 kpa and column lengths up to 20 m. 12
44 2.3. Principles of behavior and design aspects The general concept of the GECs composite ground is as the same as conventional piled embankments to take over the load from the embankment and to transfer it directly through the soft soil down to a firm stratum. The embankments on concrete, steel, and wooden piles are nearly settlement-free. If the design is appropriate, the compression stiffness of the piles is so high, that practically no settlement occurs at the level of pile tops or caps. High strength horizontal geosynthetic reinforcement is typically installed above the piles to bridge over the soft soil between piles and equalize the e mbankment s de formations. Compared to other column type techniques (e.g. concrete piles and deep soil mixing columns) the vertical compressive behavior of the GECs is less rigid. The compacted sand or gravel column starts to settle under load mainly due to radial deformation. The geosynthetic encasement, and to some extent the surrounding soft soil, provides a confining radial resistance acting similar to the confining ring in an oedometer, but being more extensible. The mobilization of ring-forces requires some radial expansion of the encasement (usually in the range of 1% to 4% strain in the ring direction) leading to some radial spreading deformation in the sand (gravel) columns and consequently vertical settlement of their top. The GECs system therefore cannot be completely settlement-free. Fortunately, most of the settlement occurs during the construction stages and is compensated by some increase of embankment height. Finally, ensured by the strength and stiffness of sand or gravel, confining ring-force in the encasement and soft soil horizontal stress, a state of equilibrium is reached. Following are several options to control settlement and the vertical bearing capacity of the GEC system: Increase the percentage of column area to the total area (usually 10% to 20%) by increasing the diameter of column (usually 0.6 m to 0.8 m) and/or decreasing their spacing (usually 1.5 m to 2.5 m). Use a better quality fill for the columns (e.g. gravel instead of sand). Increasing the tensile stiffness and strength of the ring direction of the geosynthetic encasement reduces the settlement and increases the bearing capacity of encased columns. The higher tensile stiffness in the ring direction results lower radial strain and the lower radial deformation of the column fill which leads lower settlement at the top of the column. 13
45 Granular columns are normally disposed in regular arrays in relation to the surface, with spaceing between the elements (S) that may vary according to soil profile and its geotechnical properties. Columns pattern selection (square or triangular) is usually done considering the critical height criteria (McGuire et al. 2012). There are two common regular arrangements: columns lying on square or rectangular pattern, and columns lying on a triangular pattern (Ballam and Booker, 1981) as shown in Figure 2-6. d c S S r e S r e S S / 3 S /2 (a) (b) Figure 2-6. Geometric data of columns arrangement (a) square pattern and (b) triangular pattern (Almeida and Marques, 2013). Most of the methods used for design of the granular columns are based on the unit cell concept, which the corresponding equivalent diameter (concept of equal area) is equal to d e = 1.13S, and d e = 1.05S in the case of square and triangular mesh, respectively (see Figure 2-6). The column area and the total area of unit cell are then determined by A d 2 /4 and A d 2 e /4, respectively and then the area of the soft surrounding soil is A s = A A c. Thus, the area replacement ratio is defined by: c c a c Ac de c. A S 2 (2-1) Where c is equal to /4 and / 2 3, respectively for square and triangular mesh and the soft soil area ratio is then defined by: a s As 1 ac (2-2) A 14
46 Therefore, the closer the columns are installed the higher area replacement ratios are obtained. Typical values of the area replacement ratio of the granular columns are around 15% to 30% reaching higher values in the case of the sand compaction piles (Matsui et al. 2001). Regarding columns length in practice, granular columns are usually constructed fully penetrating in soft clay layer. However, granular columns may be installed as floating piles with their tips embedded within soft clay layer. d e Granular column v,c v v,s d c L c Surrounding soft soil Granular column Surrounding soft soil (a) (b) s Figure 2-7. (a) Unit cell scheme and (b) stress distribution Bearing behavior under vertical loads The basic response of granular columns to vertical loading consists of: Internal deformations (shear and volumetric); The mobilization of a shaft friction at the cylindrical interface between columns and surrounding soil; and The mobilization of a tip resistance. The mechanisms of the mobilization of shaft friction and tip resistance are similar to the case of long, slender piles (Fleming et al. 1992), particularly in respect of the load transfer between the shaft and the pile base as a function of the load. The bearing behavior of granular columns is governed by a complicated set of interaction mechanisms between column and the 15
47 ground, column and column in a group, column and any form of footing and finally the footing with the ground (Figure 2-8, Kirsch and Kirsch, 2010). Figure 2-8. Interactions at stake under a footing (Kirsch and Kirsch, 2010). Some typical loading conditions of stone columns are summarized in Figure 2-9. The first difference is whether the ground improvement concerns a single column or a column group. The type of loading also plays a role, in terms of the general behavior of stone columns: Conventional vertical load applied directly to the top of a stone column leads to settlement at the surface and lateral squeeze into the host soil, due to lateral deformation of the column (Figure 2-9a); Vertical load acting on a rigid footing built on top of a stone column applies a constant settlement over the length of the footing and hence volume loss occurs in the soft ground. The load causes a lateral deformation of the column (Figure 2-9b); Loads applied onto stone column groups (Figures 2-9c and 2-9d) trigger a similar response to the case of single stone columns (Figures 2-9a and 2-9b), with the addition of the interaction between the columns. Figure 2-9d shows the response of a group of stone columns to an inclined load (in this case of embankment loading). This specific case shows similar mechanisms to those observed with a rigid footing, although in a different geometric arrangement. A common fact to all loading situations is that the initial undrained response of the host soil causes the column to deform laterally or bulge, which in turn loads the subsoil laterally. This 16
48 leads to further settlements of the footing. However, these settlements increase the vertical loading of the host soil, which cause an increase in the soil horizontal stresses supporting the stone column. Figure 2-9. Loading situations of stone columns (Kirsch and Kirsch, 2010) Stress concentration ratio The design method of the granular columns has to be able to meet the required criteria for bearing capacity and allowable settlement under the expected working stress. The most important design factors are the stress concentration ratio and the settlement reduction factor. Previous studies indicated that when the soil-column system is loaded, a stress concentration occurs in the columns due to the greater column stiffness compared to the surrounding soft soil, thus arching develops. Aboshi et al. (1979) assumed that both granular column and soft soil behave elastically, thus the vertical stress distribution is approximated by assigning to their elastic Young s modulus is then given by: n vc, v, s E E c s E and c (1 vs )(1 2 vs )(1 vs ) (1 v )(1 2 v )(1 v ) c c c E and Poisson s ratio s v and s v c. The stress concentration ratio (2-3) (2-4) Numerical studies correlated the stress concentration factor n to the ratio between the Young s modulus of the column E c and Young s modulus of the soft soil E s. The results can be expressed by the Equation 2-5 (Han, 2010): 17
49 E c n Es (2-5) Han and Ye (2001) recommended E / E values lower than 20, since higher values are not c s mobilized in-situ, although they may be measured in the laboratory. For E / E 20, n= 5 is obtained, which should be the maximum value of n. A large number of experimental and numerical studies (Mitchel and Huber, 1985; Kitazume, 2005; Murugesan and Rajagopal, 2010; Six et al. 2012) have addressed the stress concentration ratio n. Based on these studies the recommended n values for gravel and sand columns varies between 2 and 5. These values of n refer to the top of the column and for long term conditions. Besides n also varies with depth, as a mechanism similar to arching also occurs with depth. The applied embankment vertical stress ( ), equal to the specific weight of the embankment ( em v ) times the height of the embankment ( h em ), is shared between column (vertical stress acting on top, vc ) and soft soil (vertical stress acting on top,,, the vertical forces within the unit cell results (Juran and Guermazi, 1988): v v, c c v, s s vs c s ). The equilibrium of. A. A. A (2-6) By dividing both sides by A:. a.(1 a ) (2-7) v v, c c v, s c Substituting Equation 2-3 in Equation 2-7 results: v, 1 ( 1). v s s v n a c n.. v v, c c v 1 ( n 1) ac (2-8) (2-9) According to the Equations 2-8 and 2-9 the value of vertical stresses shared between granular column and surrounding soft soil can be determined, separately. The total vertical stress acting on stone column depends strongly on the geometric boundary conditions, namely the diameter and distance from axis to axis of the columns. Barksdale and Takefumi (1991) showed that the stress concentration ratio (n) decreases with an increasing replacement ratio a c, while Ichimoto and Suematsu (1981) suggested values of n for design 18
50 depending on the area replacement ratio (a c ) and the friction angle of the column material ( c ) (Table 2-2). Table 2-2. Stress concentration ratio for specific combinations of area replacement ratio and effective friction angle of the stone column material (Ichimoto and Suematsu, 1981). a c (%) ( o ) n (-) c > Greenwood (1991) showed that, besides the geometric parameters, the type and magnitude of loading also plays an important role in the distribution and magnitude of the stress concentration ratio. Greenwood (1991) conducted three different loading tests at three different locations in the United Kingdom and in three different sets of ground conditions. In the first case (located in St Helens), a stiff footing was used to load stone columns ( c = 42 ) constructed in sandy silt ( c = 30 ). The area replacement ratio was of about 45 %.The stress concentration ratio was approximately equal to 3.5 for a load of 40 kpa and decreased to about 2.0 for the failure load of 200 kpa (Figure 2-10a). The stress concentration ratio decreased slightly with increasing cycles of loading. The second test was conducted on Canvey Island, where a group of stone columns (featuring a diameter of 750 mm and reaching a depth of 10 m) was constructed in silty clay and loaded with a 36 m diameter oil storage tank, which is assumed to be a flexible loading scenario (Figure 2-10b). The columns were installed in a triangular pattern with a spacing of 1.5 m (a c = 45 %) and the pressure cells were placed close to the centre of the tank. The tank was subsequently filled slowly with water over 100 days up to a failure load of 130 kpa. Again, the stress concentration ratio was found to decrease with increasing loads. However, the values were significantly higher, as they started from 25 to reach 5 at high loads. Greenwood (1991) explained that this is due to the low strength of the subsoil on Canvey Island (S u = 20 kpa), which supported very little stress at the beginning of the loading, before starting to consolidate, which led to a redistribution of the stress at the surface and to a decrease in the stress concentration ratio. This showed that the stress concentration is not only controlled by geometrical parameters, as assumed by Ichimoto and Suematsu (1981) as the stress concentrations ratios measured by 19
51 Greenwood (1991) on Canvey Island show significant higher values of up to 25 in comparison with the maximum value of 3 suggested by Ichimoto and Suematsu (1981) (Table 2-2). (a) (b) Figure Measured stress concentration factors at (a) St. Helens and (b) Canvey Island (Greenwood, 1991) (m=n= stress concentration ratio) Geotextile encasement selection As explained earlier the ring tensile stiffness and strength can affect significantly the behavior of the composite system. The geotextile casing is required to support the horizontal stress for the projected life of the structure. In order to maintain the equilibrium state, designers need to have confidence in the long-term behavior of the geotextile which provides radial support to the columns over their service life. In this regard, not only is the design strength of the encasing geosynthetic important, but so is the short and long-term stress/strain behavior. Insufficient radial support due to low ring-tensile modulus (in the short or long term) would result in bulging of the columns and redistribution of the horizontal and vertical stresses, resulting in a large settlement of top of GECs (i.e. of embankment), and in a proportional increase in the vertical stresses acting on the adjacent soft soil thereby leading to further settlement. Partial or total loss of radial support would exacerbate this settlement, which could lead to settlements exceeding serviceability limits or even result in ultimate limit state conditions for the system. The long-term behavior of geotextiles has been an issue with designers, however extensive researches on their durability and long-term behavior including creep, mechanical 20
52 damage and environmental degradation, have helped to allay most of these concerns. The polymer employed largely determines the properties of the encasement. The design engineer s ideal geosynthetic reinforcement would possess the following characteristics (Alexiew et al. 2000): High tensile modulus (low strain values compatible to the common strains in soils, rapid mobilization of tensile force); Low propensity for creep (high long-term tensile strength and tensile modulus, minimum creep extension, lasting guarantee of tensile force); High permeability (lowest possible hydraulic resistance and as a result, no increasing pressure problems); Little damage during installation and compaction of contacting fills; High chemical and biological resistance. In the specific case of GECs the geotextile reinforcing encasement may not include joints or seams. This guarantees no weak zones without any reduction factors for joints and a constant tensile stiffness around the entire bearing ring direction. Up to now, the project designs required short and long-term tensile ring modulus from 1000 kn/m to 4000 kn/m and ultimate tensile ring strengths from 100 kn/m to 400 kn/m. Higher modulus and/or strengths have been also used for particular projects. Furthermore, an important distinction needs to be considered between use of non-woven and woven geotextiles. Important differences particularly in the stress-deformation response of the granular columns encased with woven geotextile were observed against non-woven geotextile. Tensile modulus and permissible elongations in the reinforcement are important consideration and high modulus reinforcement will greatly inhibit internal soil tensile strain. Based on the literature (Kempfert, 1996; Raithel et al. 2002) great advantages could be reached as woven geotextile is used as it also acts as filtering and separating element thus maintaining column drainage capacity Review on previous researches Several researchers have attempted to investigate the behaviour of the soft clays when are stabilized with single or group of GECs. In general, these studies showed that the use of GECs in soft soils leads to the increase in the load carrying capacity, settlement improvement, reduction 21
53 in column bulging, and increase of the stiffness of the composite GECs-soft clay system. The following sections provide a comprehensive review with emphasis on the most important experimental tests, numerical analyses, analytical methods, and case histories carried on single and group of reinforced sand/stone column in chronological order Experimental investigations and field tests Since the beginning of 1990, several studies investigated experimentally the effects of the geosynthetic reinforcement on load carrying and deformation characteristics of composite ground. The geosynthetic reinforcement was used in two modes: encasement element and circular disks placed at regular interval in partial or overall length of the column. Most of these studies were performed by means of laboratory tests with modeling of the small scale of a single or group of granular or sand columns reinforced by geotextile or geogrid. In some of the experimental investigations, reinforced column were directly loaded on top to represent direct footing loading. In reality, both the columns and the surrounding soil will be loaded by a full scale foundation or embankment which was also studied in several studies. Rajagopal et al. (1999) investigated the influence of geocell confinement on the strength and stiffness behavior of encased granular soils. A large number of triaxial compression tests were performed on granular soil encased in single and multiple geocells. The soil used in the tests was uniformly graded river sand with an effective size of 0.3 mm and coefficients of uniformity and curvature of 2.17 and 1.04, respectively (classified as SP according to the Unified Soil Classification System). The maximum and minimum dry unit weights of the soil were 18.4 and 15.7 kn/m 3, respectively. All the tests were performed by using pre-weighted quantity of soil placed in the sample mould in 20 layers with light tamping. This procedure produced uniform soil samples with a relative density of 55%. The geocells were fabricated by different woven and nonwoven geotextiles and soft mesh to investigate the effect of the stiffness of the geocell on the overall performance of geocell-soil composite. The encased sand was 100 mm in diameter and 200 mm in height. The different configurations used in tests program and configuration with four interconnected cells are shown in Figures 2-11a and 2-11b, respectively. 22
 In general, it was observed that the sand columns showed a large amount of apparent cohesive strength due to the confinement provided by the geocell (Figure 2-12a).")
54 (a) Figure (a) Different configurations of cells used in triaxial tests and (b) triaxial test sample with four encasements (Rajagopal et al. 1999). (b) In general, it was observed that the sand columns showed a large amount of apparent cohesive strength due to the confinement provided by the geocell (Figure 2-12a). The magnitude of this cohesive strength was observed to be dependent on the properties of the geosynthetic used to fabricate the geocell encasement. Also, encased sand columns showed a higher peak stress compared with un-reinforced sand columns (Figure 2-12b). In addition to the increase in the strength of sand columns, there was a corresponding increase in the stiffness of the column, which was indicated by steeper stress-strain curves in Figure 2-12b. Because of the additional confining pressure on the column due to the membrane stresses, the peak stresses occurred at larger strains. This was similar to the unreinforced soils developing peak stress at higher strains at higher confining pressures. It was concluded that the use of three encasement cells in model tests was adequate to represent the stiffness behavior of geocells with many interconnected cells. 23
55 (a) (b) Figure (a) p-q curves for sand column samples with geocells and (b) stress-strain curves for sand column with different configurations of geocells (Rajagopal et al. 1999). Sharma et al. (2004) performed a series of laboratory tests to investigate the effect of laminated (horizontal layers) geogrid on the load bearing capacity and bulging reduction on granular column. A total of 14 plate load tests were conducted for untreated clay bed, unreinforced granular columns and the geogrid reinforced column with different numbers of geogrid layers (n) and spacing (s). The experimental setup is shown in Figure The clayey silt was selected as the soil bed meanwhile the crushed stone aggregate with particle size from 2.36 to 4.75 mm was used as the backfill materials for the granular column. The reinforcing material used in the granular column was a biaxial geogrid. The clay bed with a height and diameter of 300 mm was prepared by compaction method. A sand layer of 50 mm thick was laid at the bottom of the tank. The 60 mm diameter stone column was installed by compaction of the crushed stone aggregates in layers to a desired density with an aid of casing. The required geogrid layers were placed at the upper part of the granular column in designed spacing. 24
56 Figure Experimental setup by Sharma et al. (2004). Two series of load tests were conducted. First, the load tests were conducted by loading the column alone using a 60 mm diameter bearing plate which had a same size with the column diameter. Secondly, the load tests were conducted by loading the entire area (both column and soil) by using a 120 mm diameter bearing plate. The load was applied in increments of 45 until 275 N. The settlement was recorded with a dial gauge and the diameter of the bulge was measured at different depths from the top of the granular column. As shown in Figure 2-14a, the stress required for a given settlement increased when the clay bed was reinforced with a granular pile, as granular material offered higher resistance to deformation by virtue of its higher friction angle and accelerated drainage by virtue of its high permeability compared with that of a clay bed. The stress increased further when the pile alone was loaded, as the granular material in a pile resisted load better than the soft clay bed. It was also observed that the geogrid effectively improved the load carrying capacity of the granular column (Figure 2-14b). The improvement factors increased with the increase of numbers of geogrid (n) and decrease of geogrid spacing (s). Based on Figure 2-14b, the stress to induce a settlement of 3 mm increased 80% comparing to the unreinforced granular column. It was also 25
57 observed that for 5 numbers of geogrid layers with a spacing of 10 mm, the bulge was negligible equal to around 4% of the column diameter. Meanwhile, the bulge length was 1.33 times of the column diameter. (a) (b) Figure (a) Stress settlement curves for a clay bed alone, a granular pile alone (n= 0), and composite ground and (b) Effect of number of geogrids (n) on the stress settlement response of composite ground (Sharma et al. (2004). Ayadat and Hanna (2005) conducted a series of laboratory tests on the geofabric encapsulated stone column to investigate its performance in a collapsible soil. The load carrying capacity and the deformation characteristics of the composite mass were studied. The collapsible fill was kaolin clay which filled in a stress-controlled cylindrical chamber of 390 mm inside diameter, 520 mm depth and 17.5 mm wall thickness. The coarse, uniformly graded sand with the particle size range from 1.18 to 2.36 mm were used as the backfill material of the stone column. The columns formed were 250 mm diameter with 250 mm, 300 mm and 410 mm length. Four non-woven geofabrics were tested in this investigation (Terram 700, 1000, 1500 and 2000). The sand columns were loaded axially using a strain-controlled loading system until the failure point. LVDTs were used to measure the settlement of the specimen and then the settlement-load bearing curves were compared. From the investigation, it was found that the geofabric encapsulated sand column has prevented the premature failure of the column in the collapsible soil. The load carrying capacity of the encapsulated sand columns increased with the increase of 26
58 geofabric material stiffness (Figure 2-15). Also, the increase of column rigidity (use of stiffer geosynthetic) and column length increased the load carrying capacity of the collapsible soil. Figure Load settlement curves for various foundation supports (Ayadat and Hanna, 2005). Black et al. (2007) investigated experimentally the performance of sand columns in a weak clayey deposit. The study evaluated the effects of reinforcing sand columns by jacketing with a tubular wire mesh. A series of plate loading tests was conducted on isolated sand columns installed in a soil bed consisting of a peat layer sandwiched between two layers of sand. The tests were carried out in a large steel-framed wooden box with dimensions length=1.75 m, width=0.7 m, and height=2 m. The typical test bed arrangement consisted of three layers of equal thickness of 0.2 m, in which peat was sandwiched between the upper and lower sand layers (Figure 2-16). On formation of the soil bed, isolated sand columns 80 mm in diameter and 720 mm in length were installed using 6 mm diameter basalt aggregate as back fill material. The column was jacketed by a noncorrosive flexible metallic tubular mesh formed from 0.3 mm diameter wires of tinned copper-clad steel with apertures of approximately 1.5 mm. The tensile strength of the mesh was 0.6 kn/mm. 27

59 Figure Testing box setup (Black et al. 2007). The load displacement characteristics of footings supported by stone columns were investigated by applying load to a circular plate supported on: untreated soil; soil treated with stone columns; and soil treated with stone columns encased by wire mesh. The results showed that the settlement characteristics of the soft soil can be improved by installing sand columns and that a significant enhancement in the load-settlement response was achieved when the sand columns were encased by wire mesh (Figure 2-17). Furthermore, it was observed that using sand column caused the stiffness of the composite system increased and the stiffness improved significantly as the stone column was reinforced by wire mesh casing (stiffer casing). 28
60 Figure Load-settlement curves of treated and untreated ground (Black et al. 2007). Murugesan and Rajagopal (2007) carried out a series of laboratory tests on the geosynthetic encased stone columns to investigate the influence of the encasement stiffness, depth of casing, and column diameter on the performance of stone column. The normally consolidated clay from a lake bed was used as the soil bed materials. The clay was mixed with 1.5 times of liquid limit and soaked for one month to remove the stress history of the soil. Then it was consolidated under 10 kpa to form the clay bed in a cylindrical steel tank with 210 mm diameter and 500 mm height. Then the geosynthetic encased stone column was installed at the centre of the clay bed. The backfill material for the stone column was angular granite chips with the particle size range from 2 to 10 mm. The geosynthetic chosen for the encasement purpose were a woven geotextile, a nonwoven geotextile, and soft meshes with two different aperture opening sizes. All the load tests on the stone column were conducted in a cylindrical steel tank 210 mm in diameter and 500 mm high. A stone column of the required diameter was installed at the centre of the tank (Figure 2-18a). Stone columns with 50, 75 and 100 mm diameter were tested. The sample was loaded vertically in a constant strain rate of 1.2 mm/min through a loading plate with the size same as the column diameter. Strain gauges, with their connecting wires, were fixed to the geosynthetic at different locations along the height of the stone column and they were covered with flexible putty to prevent direct contact of the strain gauges with 29
 (b) Figure 2-18.")
 showed a clear ultimate load, whereas the encased stone columns (ESCs) did not show any signs of failure, even at large")
61 stones or clay soil (Figure 2-18b). The inner surface of the geosynthetic at the strain gauge locations was covered with Teflon tape to prevent moisture from reaching the strain gauges through the geotextile. (a) (b) Figure (a) Schematic of load test on stone column in a unit cell and (b) casing pipe with wrapped geotextil fixed with strain gauges (Murugesan and Rajagopal, 2007). As presented in Figure 2-19 the results of ordinary stone columns (OSC) showed a clear ultimate load, whereas the encased stone columns (ESCs) did not show any signs of failure, even at large settlement levels. The pressure on the ESCs corresponding to 10 mm of settlement was found to be three to five times larger than that of the OSC. The ESCs behaved like elastic, semirigid flexible piles as failure of the ESCs was not observed, even at a settlement of 50 mm (i.e. 10% of the column length). In the case of ESCs the compression of the stone column was due mainly to the elongation of the geosynthetic encasement. Influence of the column diameter on load-settlement response of ESCs showed that effect of encasement on settlement enhancement decreased with an increase in column diameter. 30
.")
62 Figure Load settlement response of stone columns encased with nonwoven geotextile (Murugesan and Rajagopal, 2007). The hoop strain measured by strain gauges reduced with an increase in the diameter of the column (Figure 2-20). In general, the hoop strains were higher near the top of the stone column, where maximum bulging occurred. The hoop strains were observed to decrease with depth in all the tests. This was because of reduced straining of the stone columns at greater depths. It was also observed that the magnitudes of the hoop strains developed in the encasement were less than 0.5%. The low hoop strains measured during the tests were due to the some straining occured in the seam rather than in the casing material. Figure Hoop strain variation in geosynthetic encasement (Murugesan and Rajagopal, 2007). 31
.")

63 Gneil and Bouazza (2009) conducted a series of small scale model tests on the geogrid encased column to investigate the effect of geogrid encasement length on the settlement reduction and the column bulging. The laboratory tests were carried out using enlarged oedometer apparatus with 143 mm internal diameter which was designed based on the unit cell idealization concept (Figure 2-21). The soft clay bed with the undrained shear strength of 5 kpa was prepared by consolidating the kaolin slurry with the moisture content about 115% from 480 mm to 310 mm in the enlarged oedometer by applying a pressure of 50 kpa. Poorly-graded sand with the particle size of 1.6 mm was used to represent the stone as the backfill materials of the stone column. The commercially available fiberglass and aluminum window mesh were used to model the small scale geogrid as the encasement materials. The geogrid encasement was manufactured by forming the fiberglass and aluminum mesh into a cylindrical sleeve of diameter 50.5 mm with 10 mm overlap. The overlap was then bonded with resin and cured for 3 days. Lengths corresponding to 25%, 50%, 75% and 100% of the sample height were constructed. Where geogrid encasement was required, the encasement was placed within the mould prior to filling with sand. Figure Sketch and photo of enlarged consolidation cell (Gneil and Bouazza, 2009). From this analysis, it was found that the encasement of the stone column using geogrid effectively increased the stiffness and reduced the settlement of the isolated stone column 32
64 (Figure 2-22). The tests also showed almost a three-fold increase in capacity using non-encased sand columns when compared to the capacity of kaolin clay. Column capacity was observed to increase consistently from the non-encased state to the 75% fiberglass encased state. For these tests, the vertical strain at failure generally ranged between 3% and 4%. Failure typically comprised bulging of the column into the clay below the level of encasement. For the nonencased and 25% encased column tests, this included visible uplift of the clay above the bulge zone. Figure Vertical stress strain behaviour of isolated column tests (Gneil and Bouazza, 2009). Regarding to the column bulging, sand column tests were observed to bulge in the upper section of the column, at a length of about 1.5 times of column diameters (Figure 2-23). This confirmed the observations of previous authors including Hughes and Withers (1974). For partially encased columns, bulging occurred directly below the encasement, confined to a length of about 2 times of column diameter. As the magnitude of bulging was measured following column failure, comparison of this aspect to other tests was difficult. However, the magnitude of isolated column bulging for partially encased columns was generally less than for group column, despite being measured after failure. 33
 evaluated the full scale performance of a geosynthetic-encased column for the stabilization of embankments on porous collapsible soil.")
65 Figure Photographs of extruded isolated column cross-sections (Gneil and Bouazza, 2009). Araujo et al. (2009) evaluated the full scale performance of a geosynthetic-encased column for the stabilization of embankments on porous collapsible soil. Field load tests were performed on conventional sand and gravel columns and on geotextile-encased sand columns and on geogrid-encased gravel columns. During testing, the collapse of the surrounding soil was induced by water injection through the granular column top to investigate the influence of the casing on the column performance. The top soil stratum in the region consists of 8.5 m thick, very soft to medium soft, porous collapsible soil, typically found in several parts of the city of Brasilia. Drained direct shear tests on undisturbed saturated samples provided typical values of cohesion ranging from 5 kpa to 8 kpa and of friction angle ranging from 24 o to 28 o along the porous soil depth. Field tests were performed by placing the granular materials in 1.5 m deep and 0.4 m diameter boreholes for the determination of the dry density of the sand and of the gravel used in the columns. A woven polyester geotextile and a geogrid were used to encase the columns. The geotextile casing was seamless, whereas the geogrid was carefully seamed using high-strength yarns to form the casing. The instrumentation used in the tests consisted of a load cell and displacement transducers to measure the compressive load and the vertical displacements at the top of the column and strain gauges to measure the strains at different points along the column length as shown in Figure 2-24a. The loading stages applied to the columns followed the recommendations of the Brazilian standard for pile testing (NBR-12131, 1987). It consisted of increasing the vertical load applied 34
. (a) (b) Figure 2-24.")

66 to the column top in stages with the following load stage being applied only after settlement stabilization. Reaction to the vertical loads applied at the column top was provided by steel beams with ends fixed to deep concrete piles that served as anchors (Figure 2-24b). (a) (b) Figure (a) Location of the instrumentation and (b) general view of the loading tests (Araujo et al. 2009). Figure 2-25 shows the results of load tests on sand columns with and without geotextile casing. Two tests were performed on encased columns and he difference between them was the diameter of the borehole. It was observed that in the early stages of the test the first encased column was more compressible than the conventional column. This was due to the lack of full contact between the column outer surface and the borehole wall. However in the further load stages significant increases on pile load capacity was obtained depending due to additional confining provided by encasement. Radial deformation of the column measured by the strain gauges showed that using encasement led the column bulging to reduce significantly in particular for the strain gauges installed at upper 2 m of the column. 35
67 Figure Load displacement curves for tests on conventional and geotextile encased sand columns (Araujo et al. 2009). Regarding geogrid-encased gravel column, results showed a load capacity between 4 and 26% greater than the conventional column, depending on the method used to predict column capacity. The encased gravel column was more compressible than the conventional one. This greater deformability of the encased column was attributed mainly to breakage of the gravel particles during the test, enhanced by the confinement provided by the casing. This particle breakage was confirmed by large laboratory unconfined compression tests performed on geogrid encased gravel specimens. The results also confirmed the effective potential for the use of geosynthetic-encased granular columns for the stabilization of embankments on collapsible soil. In the field a difference between column outer diameter and borehole diameter will certainly exist and this will reduce friction between soil and column shaft. Thus, as for the case of embankments on very soft and saturated soils, one should bear in mind the need for satisfactory bearing capacity of the soil at the column tip. Murugesan and Rajagopal (2010) conducted a series of laboratory tests on the geosynthetic encased stone columns to investigate the behavior of single and group of geosynthetic encased stone columns. The tests were performed on the single and group of stone 36


68 column with and without geosynthetic encasement in a large scale model test tank. The clay from a lake bed was used as the soil bed materials. The clay was mixed with 1.5 times of the liquid limit and soaked for one month to remove the stress history of the soil. Then it was consolidated under 10 kpa to form the clay bed in a large test tank with plan dimensions of 1.2 m x 1.2 m and 0.85 m in depth (Figure 2-26a). The stone aggregates used to form the stone columns were angular granite chips which the peak angle of frictional resistance of stone aggregate determined from direct shear tests was found to be Four different types of geosynthetics were used to encase the stone columns in, namely woven geotextile, nonwoven geotextile, and soft meshes having two different aperture opening sizes. Stone columns with 50, 75 and 100 mm diameter were tested. The stone column was loaded vertically in a constant strain rate of 1.2 mm/min through a circular loading plate with a diameter twice that of the stone column. For the column group tests, 12 columns were installed at spacing of 150 mm which is twice the column diameter in a triangular pattern (Figure 2-26b). (a) (b) Figure (a) Scheme of load test on single stone column in large test tank and (b) load tests on a group of stone columns, a c = 23% (Murugesan and Rajagopal, 2010). From the investigation, it was found that the geosynthetic encasement increased the stiffness of the stone column. However, the strain levels were smaller for the stone column with smaller diameter (Figure 2-27). The confining pressure of the stone column increased with the modulus of encasements of geosynthetic encasement. Other than that, the hoop tension force was found to 37
69 follow the bulging of the column where highest hoop strain was observed at the top part of column and decreased by depth. The geosynthetic encased stone column behaved like a semi rigid pile. Design guidelines for the geosynthetic encased stone column were also developed. However, investigation of the geosynthetic encased stone column should be carried out for other type of clay and backfill materials to establish a better design guideline. Figure Load settlement obtained for single ordinary and encased column Murugesan and Rajagopal, 2010). From this study, it was also observed that the benefit of encasement decreased with increase in the diameter of the stone columns due to reduction of hoop tension in the encasement. The performance of encased stone column (ESCs) of smaller diameters was superior to that of larger diameter stone columns for the same encasement because of mobilization of higher confining stresses in smaller diameter stone columns (Figure 2-28). The higher confining stresses in the column led to higher stiffness of smaller diameter encased columns. 38
70 Figure Influence of stone column diameter on vertical load applied (Murugesan and Rajagopal, 2010). Sadek et al. (2010) carried out a series of laboratory tests to explore the effects of encasing sand columns with geofabrics on the load response of the composite material. A total of 18 consolidated undrained triaxial tests were performed on normally consolidated kaolin specimens with a diameter of 71 mm and a length of 142 mm. Single sand columns had diameters of 20 mm and 30 mm with height penetration ratios, H c /H s (height of sand column to height of specimen) of 0.5, 0.75 and 1 were installed in pre-drilled holes in the center of the clay specimens. The area replacement ratios, a c, defined as the cross-sectional area of the sand column to that of the clay specimen was equal to 7.9% and 17.8% for clay samples that were reinforced with 20 mm and 30 mm diameter columns, respectively (Figure 2-29). The specimens were saturated using a back pressure of 310 kpa and isotropically consolidated under effective confining pressures of 100, 150, or 200 kpa. Samples were then sheared under undrained conditions, at a strain rate of 1% per hour. 39

71 Figure Sample preparation and inserted sand column (Sadek et al. 2010). It was observed that the encased sand-columns resulted in substantially higher undrained strengths for the composite mass, when compared to the effect of non-encased columns. For fully penetrating columns and for area replacement ratios of 7.9% and 17.8%, the increase in undrained shear strength over the unreinforced clay ranged from 29 to 61% and from 88 to 100%, respectively. These increases were substantial given the relatively small area ratios used (Figure 2-30). The concept of the critical column length established for non-encased sand columns at about six column diameters, beyond which strength gain becomes negligible, appeared to be invalid for encased columns with area replacement ratios of 7.9%. It was also found that the degree of improvement in the undrained shear strength for clays reinforced with encased sand columns appeared to decrease at higher effective confining pressures. Figure Variation of improvement of undrained shear strength with pressure (Sadek et al. 2010). 40
72 Ali et al. (2012) performed series of tests on short, floating and fully penetrating single columns with and without reinforcement to evaluate the relative improvement in the failure stress of the composite ground due to different types of reinforcement. In all tests, the thickness of soft clay bed was 550 mm. The soft soil bed was made up of fully saturated remolded kaolin clay. The undrained shear strength of the soft soil bed was obtained by conducting vane shear tests. The columns were made up of stone chips of size varying from 1 mm to 4.75 mm, compacted at a relative density (Dr) of 50%, and having an angle of internal friction ( ) of 45 o, as determined by the direct shear test. A 20 mm thick mat was provided below the footing area in all model tests. The mat consisted of sub-angular Badarpur sand of predominantly quartz particles of sizes passing 1 mm sieve and retained on a 0.6 mm sieve having an angle of internal friction of 38 degree. The stone column was installed at the centre of a clay bed prepared in a large test tank, and the footing load was applied on the stone column and its surrounding soil via a sand mat (Figure 2-31). Figure Schematic view of stone column foundation (Ali et al. 2012). 41
; for")
73 Results showed that reinforcing end-bearing columns was more effective than reinforcing floating columns, irrespective of the type of reinforcement. For floating columns, the maximum increase in the failure stress of ground improved with reinforced columns was just 30 35% above that of ground improved with unreinforced columns (Figure 2-32); for end-bearing columns, the corresponding increase was as high as 186% (Figure 2-33). Figure Effect of the encasement length on settlement vertical stress curve of floating column (Ali et al. 2012). Figure Effect of the encasement length on settlement vertical stress curve of end bearing column (Ali et al. 2012). 42

 presented the results of an investigation on improvement in loadcarrying capacity and settlement reduction of a GEC using field-scale load tests.")
74 It was also found that the geogrid was the best material to use as both horizontal strip reinforcement and encasement for end-bearing columns, but for floating columns a geogrid was the best material to use as the horizontal strip and a geotextile was the best material to use as the encasement. Furthermore, as the column diameter decreased, the failure stress of the ground improved with either unreinforced columns or reinforced columns increased. Yoo and Lee (2012) presented the results of an investigation on improvement in loadcarrying capacity and settlement reduction of a GEC using field-scale load tests. Also, the effect of the geogrid encasement length and column strain was studied. The full-scale field load test was constructed at a railway construction site (Gimhae site) located in South Korea. The ground profile mainly consisted of soft clay (N SPT <5) with thickness ranging from 8 to 10 m and the water level located close to the ground surface. A geogrid-encased stone column was constructed using crushed stones classified as GP which the minimum and maximum grain size were 1 to 25 mm (Figure 2-34). The peak angle of the internal friction of the crushed stone determined from large-scale direct shear test data was 48 o. The encasement for the stone column was provided in the upper 2D (D= diameter of stone column), 3D and 4D using geogrid reinforcement with an axial stiffness of J= 2500kN/m. Instrumentation included the load cell, telltale reference plate, displacement transducer, inclinometer casing and strain gauge. Strain gauges were placed at different locations along the column length. Full-scale compressive load tests were then performed using steel reaction beams with pairs of anchors. (a) (b) Figure (a) geogrid encasement installation and (b) GEC installation is completed (Yoo and Lee, 2012). 43
75 Results of the instrumentation showed that confining effect provided by the geogrid encasement controlled bulging failure in unreinforced stone column, thus improving its loadcarrying effect by reducing settlement and preventing rapid column failure (Figure 2-35). In the case of GEC, maximum deflection within the geogrid-encased region was around 5 mm, indicating a reduction of approximately 3 times of the lateral deflection compared with the unencased column. To optimize the reinforcement effect of the geogrid, it was recommended that the column be encased to at least 4D from the top thus covering the region where bulging failure may occur. It was also observed that geogrid hoop strain reached its maximum value within a depth of 1D from the top of the encased column, and decreased at greater depth. By measuring hoop strain in these tests, it was seen that the critical encasement length of geogrid was 2 3D. Figure Lateral deflection of un-reinforced and geogrid reinforced stone column (Yoo and Lee, 2012). Dash and Bora (2013) investigated the influence of geosynthetic encasement on the performance of stone columns floating in soft clay. The experimental program consisted of a series of model plate load tests with stone columns in a soft clay bed. Tests were also carried out on unreinforced clay beds (without stone columns). The clay used for forming the test beds was a locally available soil with grains 70% finer than 75 m. It had a liquid limit of 40%, plastic limit of 21%, and was classified as clay with low plasticity, CL. 44
76 The aggregates used to form the columns were angular crushed stones with particle sizes in the range of 2 10 mm. The peak friction angle at a placement density of 15.3 kn/m 3, obtained through direct shear tests, was 48. The geogrid encasement was modeled through a commercially available window-mesh, referred to as geomesh in this paper and its ultimate tensile strength as obtained through width tension tests was 2.9 kn/m. The circular footing used was made of steel and measured 150 mm in diameter (D) (Figure 2-36a). In all tests it was placed over the central stone column coinciding with the centre of the tank. The larger footing (D= 1.5d c ) ensures that the column is fully loaded, even after bulging. Four different lengths, 100, 300, 500, and 700 mm lengths, representing the L/d c ratios of 1, 3, 5, and 7 were considered. Depending on the test configuration, columns were placed at a spacing (S) of 1.5d c, 2.5d c, and 3.5d c (Figure 2-36b). (a) (b) Figure (a) Clay bed-stone column foundation system and (b) column layout (Dash and Bora, 2013). Results showed that with un-encased columns the bearing capacity improvement was about 3.5, but with geogrid encasement the improvement increased to 5, where 60% of the column length was encased. With full-length encasement (L esc = 100%), the improvement was only about 3. It was therefore evident that partially encased floating columns were superior to the fully encased ones. In contrast, with end-bearing stone columns, full-length encasement was reported to have exhibited better performance improvement than the partially encased ones. In the case of floating columns, it was the bulge formation at a deeper depth that enhanced the bearing capacity, while in the case of end-bearing columns; it was the stiffening effect of the encasement that enables the column to transmit the surcharge pressure (Figure 2-37). 45
 performed model tests on composite ground improved with single and groups of geosynthetic reinforced stone columns of 30 mm diameter.")
77 Figure Post-test deformed shape of stone columns with varied length of encasement (Dash and Bora, 2013). Ali et al. (2014) performed model tests on composite ground improved with single and groups of geosynthetic reinforced stone columns of 30 mm diameter. The model tests were conducted on both reinforcement configurations, namely, encasement and horizontal circular discs, and an optimum configuration was determined in each case. Both geotextile and geogrid were used as reinforcing material in these configurations. Model tests on the ground improved with single columns were performed by installing the stone column at the centre of a clay bed prepared in a cylindrical tank (Figure 2-38a) and model tests on the ground improved with a group of columns were conducted in a cylindrical steel tank (Figures 2-38b).The soft soil bed was made up of fully saturated remolded kaolin clay with saturated unit weight equal to kn/m 3.The columns were made up of stone chips compacted at a relative density D r = 50%. The size of the stone chips were chosen such that the ratio of column diameter D to mean particle diameter d (D/d= 6 to 30) in the model tests closely resembled that in the field (D/d= 12 to 40). A 20 mm thick mat was provided below the footing area in all model tests. A woven geotextile of elastic modulus= 325 MPa and thickness= 0.3 mm was used to reinforce the model stone columns using encasement; and a rough nonwoven heat-bonded geotextile with elastic modulus= 89 MPa and thickness= 1.35 mm was used for the horizontal circular disc reinforcement. 46
78 Figure (a) Schematic view of the single stone column foundation and (b) schematic view of foundation with group of stone columns. All dimensions are in millimeters (Ali et al. 2014). Results of tests showed that using geosynthetic in both modes, encasement and circular disks, caused the load bearing capacity of the composite ground improved significantly and this improvement increased by increase in reinforcing length (Figures 2-39a and 2-39b). It was observed that whereas geosynthetic encasement provided lateral confinement to the columns against bulging by mobilization of hoop stresses, horizontal circular discs provided the same improvement by friction mobilization. As the former was a more effective way to provide lateral confinement to the columns compared to the latter, maximum improvement in the bearing capacity was obtained for encased columns for both floating and end-bearing columns. Furthermore, it was found that placing the geosynthetic discs at shorter interval caused an improvement in the load bearing capacity of the composite ground. 47
79 (a) (b) Figure (a) Effect of encasement on ground improved with group of endbearing columns and (b) Effect of horizontal circular discs on ground improved with groups of end-bearing columns (Ali et al. 2014). In all tests, improvement in the failure stress of composite ground was greater for endbearing columns compared with floating columns for both encased and horizontal circular discsreinforced stone columns. Hoop stresses developed in the geosynthetic encasement or friction was mobilized in horizontal circular discs, which resisted the bulging and thus transferred the load to the bottom of the column giving rise to an increase in the bearing capacity. Reinforced floating columns did not perform as well because as soon as some hoop stresses began to develop in the geosynthetic encasement or friction began to mobilize in the horizontal discs, 48
80 penetration of the column into the soft soil occurred and further improvement in the bearing capacity was restricted. It was also found that the geogrid encasement was a better option than a geotextile encasement for the case of end-bearing columns because the higher stiffness of the geogrid facilitated maximum transfer of load to the bottom of the column which was resting on hard strata. Thus, the higher stiffness of the geogrid was fully utilized by mobilization of hoop stresses and the composite ground was better able to support larger applied load. On the other hand, owing to lower stiffness of geotextile, columns did undergo relatively higher bulging and consequently settled more Numerical tools applied to GEC The numerical analysis has been extensively used as a suitable tool to determine the response of the GEC improved soft foundation. They can reasonably simulate the interaction mechanisms between soil and geosynthetic by adopting the stress-strain coupled formulation. The numerical analysis, especially finite element methods, allows a more fundamental understanding of GEC behaviour by supporting parametric studies to investigate the influence of the input parameters which were mostly verified with experimental investigations. Several two and three dimensional finite element analyses were performed to study the influence of the critical parameters such as area replacement ratio, encasement stiffness modulus, soft clay thickness, embankment loading, and reinforcing modes which are briefly described below. Murugesan and Rajagopal (2006) investigated the qualitative and quantitative improvement in load capacity of the stone column by encasement through a comprehensive parametric study using the finite element (FE) analysis. All the analyses were performed using the finite element program GEOFEM which was originally developed at the Royal Military College of Canada (Rajagopal and Bathurst, 1993). In that study, the influence of the parameters such as the stiffness of geosynthetic encasement, the depth of encasement from ground level, the diameter of stone columns and shear strength of the surrounding soil were analyzed. In finite element models, the cylindrical unit cell was idealized using axisymmetric model with radial symmetry around the vertical axis passing through the centre of the stone column. The finite element mesh was developed using 8-node quadrilateral elements for all the components in the system as shown in Figure The stone columns and the soft soil are modeled using 49
.")
81 hyperbolic non-linear elastic. The geosynthetic encasement around the stone column was modeled as linear elastic material and assigned as continuum elements around the stone column (considering axisymmetric idealization). The hyperbolic material properties for different materials were selected from the database of hyperbolic parameters published by Duncan et al. (1980) (Table 2-3). Table 2-3. Material properties used in FE analysis (Murugesan and Rajagopal, 2006). Figure Typical finite element mesh used in the analyses (Murugesan and Rajagopal, 2006). The improvement in the performance of the stone column due to encasement was studied by applying pressure only over the stone column area. By encasing, it was found that the stone 50
82 columns were confined and the severe lateral bulging has significantly reduced. The lateral bulging observed in the stone columns of two sizes (0.6 and 1 m diameters) with and without encasement was compared (Figure 2-41a). It was observed that in OSCs (ordinary stone columns), there was severe bulging near the ground surface up to a depth equal to twice the diameter of the stone column. On the other hand, the encased stone columns were undergone much lesser lateral expansion near the ground surface. The encased columns were undergone slightly higher lateral expansions at deeper depths as compared to the OSCs. This could have happened because the applied surface load was transmitted deeper into the column due to encasement effects. Regarding to lateral confining stresses mobilized along the column, it was observed that the lateral stresses were higher in the encased column as compared to the corresponding lateral stresses in OSCs (Figure 2-41b). The increase in confining pressure was seen over the full height of the stone column, which led to mobilization of higher vertical load capacity in the encased columns. The lateral stresses mobilized in the OSCs without geosynthetic encasement were found to be the same for both diameters of the stone columns (0.6 and 1 m). On the other hand, the lateral stresses mobilized in encased stone columns were higher for smaller diameter columns. (a) (b) Figure (a) Lateral bulging observed in stone columns and (b) confining pressure along the column length (Murugesan and Rajagopal, 2006). 51
83 Influence of geosynthetic stiffness on settlement reduction and maximum bulging showed the elastic modulus of the geosynthetic encasement played an important role in enhancing the capacity and stiffness of the encased columns (Figure 2-42). The confining pressures generated in the stone columns were higher for stiffer encasements thus leading the settlement and column bulging significantly reduced compared OSCs. It was also observed that the performance of encased stone columns of smaller diameters was superior to that of larger diameter stone columns because of mobilization of higher confining stresses in larger stone column. The higher confining stresses in the column led to higher stiffness of smaller diameter encased columns. It was also concluded that the load capacity of encased columns was not as sensitive to the shear strength of the surrounding soils as compared to OSCs. This was especially true for higher stiffness values of the encasement (a) (b) Figure Influence of geosynthetic encasement on (a) reduction in settlement and (b) maximum lateral bulging (Murugesan and Rajagopal, 2006). Malarvizhi and Ilamparuthi (2007) carried a series of numerical analyses on scaled down model of geosynthetic encased stone columns approximately 1/20 size of prototype. The encased column stabilized models were analyzed using PLAXIS finite element code and then the results of numerical analyses were compared with the experimental investigation. Also, a comprehensive parametric study was performed to understand the influence of the L/D ratio of the column, the stiffness of geogrid encasement and the angle of internal friction of the granular material on settlement reduction of the stabilized soft clay. For finite element analyses the 52
84 elastic-plastic behavior of the stone column was modeled by Mohr-Coulomb yield criterion employing a non-associated flow rule. The non-linear behavior of the clay was represented by the modified soft soil model (Cam Clay model). The geogrid encasement was simulated as linear elastic continuum element whose axial stiffness was taken as the initial tangent modulus obtained from the tension test. The material parameters used in finite element analysis is shown in Table 2-4. Table 2-4. Material properties used in FE analysis (Malarvizhi and Ilamparuthi (2007). Axi-symmetric finite element analysis was carried out since studies were on single column stabilized bed under symmetric loading. A typical finite element idealization of the laboratory model is shown in Figure The nodes at the vertical boundaries were restrained to displace horizontally but allowed to undergo vertical displacement whereas for the bottom surface, both horizontal and vertical displacement were restricted. 53

85 Figure Typical FE model of soft clay and encased stone column (Malarvizhi and Ilamparuthi, 2007). The results of FE analyses showed that encasing the granular column with suitable geogrids improved the load capacity of the stabilized soft ground and the stiffer geogrid had much more significant influence on settlement improvement. The parametric study also showed that the increase in stiffness of encasement reduced the settlement but when the stiffness was increased beyond 2000 kn/m the contribution to settlement reduction became insignificant for the condition analyzed (Figure 2-44a). The angle of shearing resistance of column material also affected the settlement reduction ratio. On the other hand, efficiency of the encased stone column was higher if the column material was compacted well to achieve high angle of shearing resistance. Moreover, it was observed that encasing the column increased the stress concentration on the column, thereby reducing the load on clay, consequently reducing the settlement. The results indicated that using stiffer encasement caused the stress concentration on stone column increased as much as 6 time compared un-encased stone columns (Figure 2-44b). Furthermore, it was found that as the L/D ratio of the column increased, settlement reduced and if the L/D ratio was more than about 10, is did not contribute much to settlement reduction 54
86 (a) (b) Figure (a) Stiffness of encasement of settlement reduction ratio and (b) stress concentration on stone column (Malarvizhi and Ilamparuthi, 2007). Yoo and Kim (2009) presented the results of a comparative study on different finite element modeling approaches for modeling geosynthetic-encased stone column-reinforced ground for use in rapid embankment construction. The specific models considered include: (1) an axisymmetric unit cell; (2) a three-dimensional (3D) column; and (3) a full 3D model (Figure 2-45). The validity of the unit cell model was tested by comparison with the results from the 3D models. The applicability of continuum elements for modeling the geosynthetic encasement and the fundamental working mechanisms of the geosynthetic-encased stone column were also investigated. A hypothetical embankment construction on GESC-reinforced ground was considered. The GESCs were arranged in a square grid pattern with 2.4 m center-to-center spacing, giving an area replacement ratio (a c ) of 9%. It was assumed that the stone columns were fully encased with geosynthetics having an average axial stiffness of J= 2500 kn/m. The groundwater table was set at the top surface of the clay layer. Construction of the embankment was assumed to be done in 2 m increments, each lift of which was completed in 15 days with another 10 days of waiting period for consolidation. Commercial finite element code, Abaqus, was selected for the analysis in order to take advantage of its robustness in numerical solution strategy for soil nonlinearity and stress pore pressure coupled problems. The soft clay was modeled using the Modified Cam Clay material model. A linear-elastic, perfectly plastic model with the Mohr Coulomb failure criterion was used to model the crushed stone, the sand, and the embankment fill. The 55
 stone column layout; (b) 3D column; (c) axi-symmetric unit cell (Yoo and Kim, 2009) Table 2-5.")
87 geosynthetic was modeled as a linear elastic material. Material parameters used in FE analysis is shown in Table 2-5. Figure Three-dimensional column and unit cell representations: (a) stone column layout; (b) 3D column; (c) axi-symmetric unit cell (Yoo and Kim, 2009) Table 2-5. Constitutive model and parameters of stone column, clay, sand, and embankment fill materials (Yoo and Kim, 2009). In general, the results of the 3D column model showed good agreement with those from the full 3D model in all aspects, i.e., excess pore pressure, settlement, vertical stress, lateral deflection, and geosynthetic strains (Figure 2-46). The axi-symmetric unit cell model, however, tended to give 10% to 20% larger results than the 3D models, particularly for the vertical effective stress and lateral deformation of the stone column, and the geosynthetic strains, partly 56
88 because of the error caused by the geometrical conversion from rectangularity in the 3D column model to the unit cell, although the area replacement ratios were the same. (a) (b) Figure (a) Stress concentration ratio against time and (b) development of excess pore pressure with time (Yoo and Kim, 2009). It was observed that for the geosynthetic-encased stone columns installed in soft ground for embankment construction, the use of geosynthetic encasement decreased the embankment loadinduced excess pore water pressures as well as vertical stresses in the ground, thereby decreasing the associated settlement. Such a trend was attributed to the increased stiffness of the stone column due to the added level of confinement provided by the encasement. Results showed that the stress concentration ratio was not constant but increased with the level of embankment load. When selecting a stress concentration for a given design condition, the embankment load level in addition to the replacement and the modulus ratios should be considered. Furthermore, for the GESC-reinforced ground in rapid embankment construction, the maximum lateral bulging of the stone column tended to occur at the bottom end of the stone column, suggesting full encasement is needed to achieve the maximum encasement effect. Khabbazian et al. (2010) carried out three-dimensional finite element analyses to simulate the behavior of a single granular column with and without encasement in very soft clay using the computer program ABAQUS. Comprehensive numerical analyses were performed to study the influence of the geosynthetic stiffness, friction and dilation angle of the column material, length of geosynthetic encasement, diameter of the column, length of the column, and the coefficient of in situ lateral earth pressure. In all of the numerical analyses, the thickness of the soft soil and the 57
 was selected such that the numerical model results were not affected by the imposed conditions along")
89 length of the column were assumed to be 5 m. It was also assumed that the soil and column were underlain by a rigid layer. The lateral extent of the soft soil around the column (the radius of the modeled zone of interest) was selected such that the numerical model results were not affected by the imposed conditions along the circumferential boundary of the soft soil (Figure 2-47). The radius of the granular column was 0.4 m and the overall radius of the unit cell cylinder was selected to be 2.0 m. regarding boundary conditions, at the bottom boundary of the finite element mesh, the displacements were set to zero in the z direction. The displacements in the x and y directions were set to zero on the circumferential boundary of the soft soil zone. On the planes of symmetry, normal displacement was set to zero. Figure Typical finite element mesh used in the analyses (Khabbazian et al. 2010). The finite element mesh used in the numerical simulations was developed using six-node linear triangular prism elements for both the granular column and soft soil. The granular column was modeled using a linear elastic perfectly plastic model with Mohr Coulomb failure criterion and the soft soil was modeled as a modified Cam Clay material (Table 2-6). The modified Cam Clay parameters used corresponded to those obtained for experimental data on soft Bangkok clay (Balasubramanian and Chaudhry, 1978). The geosynthetic was modeled using four-node quadrilateral, reduced integration membrane elements. The geosynthetic was assumed to be an orthotropic li near e lastic mate rial, wit h a n a ssumed P oisson s r atio of
90 Table 2-6. Material parameters and constitutive models used in FE analyses (Khabbazian et al. 2010). Results showed that the stress settlement response of granular columns significantly improved by encasing them. The stiffness of the encasement was found to have a major effect on the stress settlement response of encased columns and their associated load-carrying capacity (Figure 2-48a). The maximum value of lateral displacement of a GEC was much less than that of a conventional granular column for the same vertical settlement (Figure 2-48b). This was due to the fact that the increased stiffness of a GEC allowed larger loads to be transmitted to greater depths, which in turn caused the lateral displacements to be more evenly distributed over the length of the column than what was observed in a granular column. (a) (b) Figure (a) Effect of encasement stiffness on the stress settlement behavior of a GEC and (b) influence of encasement stiffness on column bulging (Khabbazian et al. 2010). Results indicated that improving the strength characteristics of granular column materials (friction and dilation angle) increased the load-carrying capacity of a given column. However, in many cases, it was more efficient to select encasement with a higher stiffness. Decreasing the diameter of an encased granular column improved its stress settlement response. It was also observed that lateral displacements increased with the diameter of column (Figure 2-49). 59
91 Figure Lateral displacement vs. depth for a GEC with varying column diameter (Khabbazian et al. 2010). Keykhosropur et al. (2012) carried out a series of 3D numerical analyses (using the finite element code ABAQUS) to study the effect of critical parameters on overall behavior of a group of GECs in soft clay. Firstly, the analyses were calibrated by modeling of the GECs used in a ground improvement project in Hamburg, Germany (Kempfert and Raithel, 2002). Based on the actual project information, the 80 cm diameter stone columns were modeled with 2 m spacing in the middle of the dike section (total of 13 columns in each row) and 3 m spacing on each side (28 columns in each row), (Figure 2-50). The length of the columns was 11.2 m, which was the same as the thickness of the soft soil layer. The geotextile encasement was modeled as a linear elastic material using 3-node triangular membrane elements with a J= 2000 kn/m stiffness. After model calibration, parametric studies were performed to investigate the effects of factors such as stiffness of the geosynthetic encasement, column diameter and modulus of elasticity, and friction angle of the column material on the overall behavior of the GECs group. Concerning to constitutive models, Cam-Clay model was used for the soft soil, but embankment fill and stone column material was modeled using Mohr-Coulomb model (Table 2-7). 60
.")
92 Figure Geometry and boundary conditions used for model calibration (Keykhosropur et al. 2012). Table 2-7. Material properties used in the numerical analyses (Keykhosropur et al. 2012). Results of the parametric study showed that increase in the stiffness of the geosynthetic encasement led to increases in the column stiffness, the hoop tension force mobilized in the encasement, and the lateral confinement provided to the column, leading to substantial enhancement in the performance of the GECs group (Figure 2-51). Results of the 3D numerical analyses also showed that increasing the internal friction angle of the stone column material resulted in increases in the resistance of the columns against failure and, consequently, the lateral deformations and settlements of the columns decreased. However, compared to the other 61
93 variables studied, performance of GECs was found to be less sensitive to the internal friction angle of the stone column material as shown in Figure Figure Influence of geosynthetic stiffness on settlement below the center of embankment (Keykhosropur et al. 2012) Figure influence of friction angle of stone material on column bulging (Keykhosropur et al. 2012) It was also concluded that increasing stone column diameter decreased the effectiveness of the encasement due to the increase in the lateral deformations; however, an increase in the diameter while keeping the center to center spacing between the stone columns constant was equivalent to an increase in the overall area replacement ratio of the stone column group. This had a more pronounced influence on the performance of the GECs group, and resulted in an improvement in the bearing capacity of the system. 62
94 Tandel et al. (2012) performed three dimensional numerical analyses considering the effect of various parameters like modulus of the soft soil, modulus and spacing of granular columns, geosynthetic encasement length and stiffness, and average construction rate on maximum settlement on the embankment crest. The FE analysis was performed using PLAXIS 3D program in which the embankment fill and stone material were simulated using Hardening Soil model; however Soft Soil model was used for modeling of the behavior of soft foundation. Variation of the modulus of soft soil indicated that an increase of the soft soil modulus reduced the maximum settlement on the embankment crest but the degree of the reduction in the settlement gradually decreased as the modulus of the soft soil increased (Figure 2-53a). The effect of the elastic modulus of the columns on the maximum settlement showed that within the variation range of the column modulus, the column modulus had a limited influence on the maximum postconstruction settlement. It was observed that an increase of the column modulus from to kpa only caused to less than 4 mm reduction in the maximum settlement (Figure 2-53b). The main reason for this phenomenon was found to be the columns were much stiffer than the soft soil and thus the stable soil arching was developed. The high modulus ratio made the columns behave as rigid supports with respect to the soft soil. In addition, the influence of the average construction rate on the maximum post-construction settlement showed that the higher construction rate induced the larger maximum post-construction settlement. However, the lower average construction rate allowed more time for the dissipation of excess pore water pressure. (a) (b) Figure (a) Influence of the soft clay stiffness of maximum settlement and (b) influence of the column stiffness on maximum settlement (Tandel et al. 2012). 63
 package PLAXIS 9 was used to model unreinforced and reinforced Bremerhaven clay foundations supporting an embankment.")
95 Elsawy (2013) investigated the long term behavior of GECs stabilized soft ground through consolidation analysis. The finite-element model (FEM) package PLAXIS 9 was used to model unreinforced and reinforced Bremerhaven clay foundations supporting an embankment. The consolidation behavior of this system was investigated to study the improvement in the reinforced soil during and after consolidation. The development of stress concentrations in conventional and encased columns during the consolidation process, and its role in reducing total settlement, were also studied. Furthermore, the influence of stress concentrations in conventional and encased stone columns on the consolidation process was investigated. The conventional and encased stone columns had a diameter (d) of 1.0 m and a spacing/diameter ratio (S/d) of 3.0. The stone columns were installed in a square pattern, which produced an equivalent unit cell with a diameter 3.39 m (Figure 2-54). Figure Model geometry and mesh generation of GEC unit cell (Elsawy, 2013). The finite element mesh was generated using 15-node triangular elements. The Bremerhaven clay was modeled using the Soft Soil Creep model under undrained conditions, and 64
96 the stone material and the sand fill were modeled using the Mohr Coulomb model under drained conditions. The embankment was constructed to a height of 5.0 m in two 2.5 m layers over a period of 21 days. The embankment height, the embankment construction and the construction rate were assumed to simulate field construction. Consolidation analyses were performed during and after each construction stage. A closed consolidation boundary was applied to both sides of the model to prevent lateral drainage. Results of FE analysis showed that the soft soil reinforced with encased stone columns had a smaller settlement and a shorter consolidation time than the soft soil reinforced with conventional stone columns. The reduction in settlement was more remarkable with increasing consolidation time, and with increasing embankment load (Figure 2-55). Figure Settlement of unreinforced and reinforced soft soil with conventional and encased columns at point A (Elsawy, 2013). 65
97 Results also showed that using encased stone columns (ESC) caused the stress concentration ratio increased significantly compared with conventional stone columns (CSC). The reason was found to be due to additional confining provided by the geosynthetic encasement which led the stone columns to become stiffer. It was also observed that the stress concentration ratio increased gradually during consolidation period when excess pore pressure was being dissipated (Figure 2-56). Figure Stress concentration ratio versus time (Elsawy, 2013). Zhang and Zhao (2014) presented an analytical solution based on the unit-cell concept, to predict deformation behaviors of geotextile-encased stone columns at any depth below the top plane of the columns (Figure 2-57). Under vertical loads at the tops of the stone columns, an axial compression deformation occurred that was accompanied by a lateral expansion near the top. This deformation characteristic of stone columns was incorporated directly into the proposed analytical method. The shear stress between the encased stone column and the surrounding soil in the vertical direction also was taken into account. In this method, the confining pressure provided by the soil was analyzed based on an analogy with passive earth pressure. The method was verified via comparison with two other analytical solutions. Parametric studies were 66
98 conducted to investigate the effectsof geotextile encasement, vertical applied stress, and column spacing and diameter on the deformation behaviors of columns. Figure Calculation model of geotextile-encased column (Zhang and Zhao, 2014). A hypothetical case of an embankment supported by geotextile encased stone columns was set up for the validation. A clayey sand layer 5.0 m deep was used as a soft soil. The encased columns with their ends located on a rigid layer were arranged in a square pattern. Column diameter d c = 0.8 m, column length l c = 5.0 m, and column spacing S= 3dc. A 0.25-m-high crushed-stone cushion was placed on top of the columns. The geotextile encasement was assumed to have stiffness equal to J= 2500 kn/m. The other material parameters were chosen based on Lee et al. (2007). The proposed solution was used to determine the column settlement under different embankment heights and the comparisons with other methods are presented in Table
 To investigate the influence of geotextile encasement, column spacing, and column diameter on deformation behaviors of geotextile encased stone columns, a series of")
99 Table 2-8. Comparison of settlement at tops of columns via different methods (Zhang and Zhao, 2014). (n*= stress concentration ratio) To investigate the influence of geotextile encasement, column spacing, and column diameter on deformation behaviors of geotextile encased stone columns, a series of parametric analyses was performed. As compared with non-encased stone columns, geotextile encasement had a reduction effect on the settlement of stone columns, and this reduction was more effective for encasements with higher stiffness values than for encasements with lower stiffness valued (Figure 2-58a). Column bulging was decreased significantly because of the additional lateral confinement from the geotextile encasement of the column, which implied that geotextileencased stone columns were better supported laterally than non-encased stone columns and therefore can provide more bearing capacity (Figure 2-58b). Column spacing and column diameter were also found to have a dominating effect on settlement reduction. Increasing column diameter and decreasing the spacing between them, and thereby increasing the area replacement ratio, caused to a significant reduction in settlement. Hence the selection of encasement stiffness for the encased stone column should be made based on column diameter and column spacing. 68
100 (a) (b) Figure (a) Settlement at top of stone column and (b) bulging depths of stone column (Zhang and Zhao, 2014) Analytical methods used in design The first analytical formulation was proposed in 1981 (Ghionna and Jamiolkowski, 1981) to calculate the settlement and the vertical stresses of the granular column reinforced soft soil. Since the beginning of 2000, analytical solutions have been developed for a better understanding of the time-dependent behavior of the GECs. They also have been used as suitable tools for designing of the GECs composite ground. Most of these studies were generated based on the unit cell approach which studied influence of the encasement on consolidation rate around the 69
101 encased columns and the vertical stress shared between the column and surrounding soil. A series of design charts were also introduced to calculate simply the settlement of the composite system with emphasis on the importance of the encasement stiffness modulus which is frequently used in practical applications. For design and calculation purposes different analytical methods have been developed over the years. At present, both analytical design procedures and numerical solutions are available. Regarding analytical and semi-analytical solutions, two methods were introduced until the present time as named Belgian Method, proposed by Van Impe (1986) and the German Method proposed by Raithel and Kempfert (2000). In the first approach, the system is simulated by substituting columns by an equivalent wall while the later considers the unit cell approach. In the last years the development of the GEC system are widely carried using numerical analysis allowing to calculate properly the settlement and stresses separately acting on columns and surrounding soil which were mentioned earlier. Ghionna and Jamiolkowski (1981) proposed method which considers the reinforced soil subdivided in unit cells, and the behaviour of each of this unit cells is assessed by considering it is far enough from the loading border so that is possible to assume the symmetry of vertical stresses acting around the column. In addition the method assumes only fully penetrating columns. It is also supposed: The column-soil unit cell rests on an uniform loaded base which undergoes equal surface settlement; Regarding the radial deformations resulting in the column due to the soft soil expansion, the column backfill is in condition of plastic equilibrium corresponding to the active horizontal stress; The shearing occurs without changing in volume (the volume during loading and collapse are the same); The soft clay surrounding granular column deforms keeping a linear elastic behaviour, thus the deformation modulus E s that can be considered constant along the depth; The vertical stresses from surface loading remain constant with depth both inner column and surrounding soft soil. The proposed method calculates the surface settlement using equation below: 70
102 s q z z Where: N 2 N 1 2vs 2 K0s. hci s * 2 i * i i 1 M si Esi (1 vs ) i 1 Esi (2-10) q = average vertical stress acting on the soft soil; s * E = change in oedometer modulus of the soft soil estimated in i-th layer; si M = oedometer modulus of deformation of the soft soil estimated in i-th layer; si K 0s = at rest earth pressure of the soft soil after column installation; M = oedometer modulus of deformation of the soft soil; s hci = incremental horizontal stress in i-th layer; and v = P oisson s of the sof t cl ay. s Belgian method (Van Impe, 1986) consists of estimating the tensile force required of geotextile encasement to balance the horizontal stress acting in the column with the confining stresses provided by the surrounding soil. The Belgian method does not provide the ability to take strain deformations into consideration not to calculate the settlement of the embankment. The design method analyzes the problem only from the point of view of tensile strength while ignoring the corresponding ring strain. The design principle considered that the bearing capacity of geotextile encased granular columns could be evaluated by calculating the equilibrium of an equivalent wall with thickness e and the warping geotextile has to absorb part of the required horizontal confining stress. By the development of the equations, the required tensile force T in the geotextile encasement is: n,0( H d)( B / 2) 1 T r 2 1. z.tan r 4 2 r= radius of granular column; = unit weight of embankment fill; n,0 H= height of embankment; d= thickness of platform below the embankment; B= columns center to center spacing; = submerged unit weight of granular column; and 1 (2-11) 71
103 = friction angle of granular column. 1 German method (Raithel and Kempfert, 2000) is the widely used calculation procedure and represented a great step on GEC design development. This method was conceived on the basis of Ghionna and Jamiolkowski (1981) procedure for plane granular columns design, in which Raithel and Kempfert (1999) has introduced the complementary contribution provided by the geotextile encasement. Generally, an analytical, axial symmetric model is used for calculating and designing a geotextile encased column foundation. Raithel and Kempfert (2000) presented a closed form analytical solution to obtain stresses and deformations on column (system material of column and geosynthetic) and soil (normally soft or very soft soil). The solution of the equations includes an interactive procedure to solve the equations, which settlement of the soil and column are equal. The method considers both procedures regarding installation of the columns: replacement method and displacement (more common in practice) method. The following assumptions are considered by the method, as stated by Raithel and Kempfert (2000): The settlements on the top of the column and the soft soil are equal; The settlement of the bearing layer below the columns can be neglected; In the column the coefficient of active earth pressure Kac applies; Using the replacement method the earth pressure at rest with K K0, 1 sin valid and s s if the displacement method is used an enlarged coefficient of earth pressure K s K * 0, s is given before loading; The geotextile coating has a linear-elastic material behavior; For design of the foundation the drained (end) condition is decisive, because then the maximum settlements and ring tension forces are reached. The proposed model was developed on the basis of the conventional calculation models used for granular column, which are completed by the effect of the geotextile casing. As shown in Figure 2-59, there is an additional horizontal stress in the column hc (index h = horizontal), due to the additional vertical stress vc (index v= vertical and c= column) over the column, 72
104 head. In view of the equilibrium between the additional surface loading corresponding vertical stresses on the column vc and the soft soil,, v v, c c v, s c vs and the, it can be stated:. A. A.( A A ) (2-12) The vertical stresses due to the loading and the different soil weights produce horizontal stresses v,0, c and,0, v s are the initial vertical stresses in the column and the soil and if the replacement method is used K * 0,s must be substituted by K 0,s :. K. K h, c v, c a, c v,0, c a, c. K. K * h, s v, s a, s v,0, s 0, s (2-13) (2-14) The geotextile casing (radius= r geo ) has linear-elastic behavior (stiffness= J), whereby the ring tensile force F R can be transformed into a horizontal stress, h geo, which is assigned to the geotextile: r F J. r R geo geo (2-15) F R h, geo (2-16) rgeo By the use of the separate horizontal stresses a differential horizontal stress can be defined, which represents the partial mobilization of the passive earth pressure in the soft soil: ( ) (2-17) h, diff h, c h, s h, geo The stress difference results in an expansion of the column. The horizontal deformation and the settlement of the soft soil ss rc are calculated according to Ghionna and Jamiolkowski (1981). Assuming equal settlements of column s and soft soil c s the following calculation s equation can be derived: vs, 2 v ( ). s 1 1 a r * geo rc J c rc. J. * Ka, c.. v. v, s v,0, c K0, s. v, s K0, s. v,0, s. h 2 2 Eoed, s E 1 vs ac ac rgeo rgeo 2 r c 1. h 2 ( rc rc) (2-18) 73
.(1 2 vs) E... E 1 vs 1 vs ac (1 vs ) E J 1 r 1.")
.")
105 Where the horizontal deformation of the column can be determined through: r c 1 1 a ( r r ). J K... K. K. c * geo c a, c v v, s v,0, c 0, s v, s 0, s v,0, s 2 ac ac rgeo * (1 vs).(1 2 vs) E... E 1 vs 1 vs ac (1 vs ) E J 1 r 1. rc ac oed, s 2 geo (2-19) (2-20) This equation can be solved by iterative procedure using spreadsheet. The oedometric modulus of the soil E should be introduced stress dependent. More details are shown in oed, s Raithel and Kempfert (2000). Figure Axi-symmetric unit cell approach (Raithel and Kempfert, 2000). 74
106 Alexiew et al. (2005) performed a parametric study for a typical example of embankment on soft soil, shown in Figure 2-60 (Alexiew et al. 2005). This study was carried out to illustrate the application of the analytical solution introduced by Raithel and Kempfert (2000). In this study, the following parameters varied aiming to obtain the design charts: Stiffness modulus of the geotextile casing, between 1000 kn/m and 4000 kn/m; Height of embankment, between 6 m and 14 m; Columns spacing in terms of a c replacement ratio, between 10% to 20%. The results of this study for the oedometer modulus values of the soil equal to 500 kpa and 1000 kpa are given in Figure 2-61 and Figure 2-62, respectively. Figure Outline of the embankment analysis (Alexiew et al. 2005). 75


107 Figure Settlements vs. encasing modulus for E oed = 500 kpa (Alexiew et al. 2005). Figure Settlements vs. encasing modulus for E oed = 1000 kpa (Alexiew et al. 2005). 76
108 Raithel and Henne (2000) introduced an analytical relation to determine the substitute friction angle of the column material used in plane strain analysis of GECs. Since the columns are replaced by shear walls of equal size when the plane model is generated, the geotextile coating cannot be directly recorded. Consequently a substitute friction angle is determined for the column material, which is used as being representative for the coating in the plane model (Figure 2-63). If the coating is not included in the plane strain calculation, considerable deformation will arise when increasing the load, since a buckling of the columns will occur due to the lack of a horizontal supporting effect, whereby the threshold condition will be reached in the column material. To achieve a greater settlement reduction without coating, it is essential to take into account the influence of the geotextile coating in plane strain analysis. Figure Mohr circle for un-encased and encased granular column (Raithel and Henne, 2000). In this method, substitute friction angle ( sub ) of the column material is determined to simulate the contribution of the geosynthetic encasement in columns stiffness. The substitute angel of friction was derived theoretically from the relationship below: sin sub 1 sin 1 sin 1 sin 1 sin h, geo hc, h, geo hc, 1 1 (2-21) 77
109 Where: h,c = horizontal stress acting on granular column; h,geo = hoop stress in geosynthetic encasement; and sub = friction angle of column material. The corresponding horizontal stress acting on granular column ( h,c ) and the hoop stress in geosynthetic encasement ( h,geo ) should be obtained by numerical analysis or analytical calculation performed on an axi-symmetric unit cell. The substitute friction angle obtained from Equation 2-21 then can be used in plane strain numerical or analytical analysis of embankment on GECs. Castro and Sagaseta (2011) presented an analytical solution to calculate the settlement and tensile force in geosynthetic encasement. The analytical method was proposed considering both drained and undrained thus time variations of the settlement and tensile force are obtained. The proposed solution is simple and useful tool for design as only a unit cell, i.e. an end-bearing column and its surrounding soil, is modeled in axial symmetry under a rigid and uniform load (Figure 2-64). The soft soil is modeled as an elastic material and the column as an elastic plastic material using the Mohr-Coulomb yield criterion and a non-associated flow rule, with a constant dilatancy angle. Elasto-plastic behavior is also considered for the encasement by means of a limit tensile strength. The solution is presented in a closed form and was directly usable in a spreadsheet. The influence of the encasement stiffness during consolidation is considered using modified coefficient of vertical consolidation ( c zrp ) through: vr c zrp vr c vr a c s J (1 ac ) ( s 2 Gs ) K c K ac. a c a c 1 1 ac (1 ac ) K c Kac Where: c vr = coefficient of vertical consolidation; a c = area replacement ratio; E 2G s m s E m = oedometer modulus; (2-22) 78
.")
110 G s = shear modulus; J= geosynthetic stiffness modulus; K ac = coefficient of active earth pressure of column material; K (1 sin ) / (1 sin ) ; and c c c = dilatancy angle of column material. c Note that the higher geosynthetic stiffness modulus causes the higher equivalent vertical consolidation coefficient ( c zrp ). Thus the encasement can improve the necessary time for vr consolidation process. The lateral confinement provided by the encasement is then obtained according to the ratio between the relative stiffness of the encasement and the soft soil. As a result, the increment of the tensile stress of the encasement is obtained through: J T. z 2 K c (2-23) Where: = vertical strain. z Figure Unit cell model of GEC adopted in analytical solution (Castro and Sagaseta, 2011). Results showed that using encasement reduced significantly settlement and increased the stress concentration on top of the column. Using stiffer encasement enhanced the settlement reduction. Also, the encasement had negligible effect for an elastic column and starts to be useful only after column yielding (Figure 2-65). The effectiveness of the encasement was directly 79

111 related to its stiffness through the factor J g /(r c.e s ). Therefore, encasing stone columns was recommended in soft soils using stiff encasements and under moderate loads because for high applied loads, the encasement reaches its tensile strength and did not provide any further improvement. Parametric studies of the settlement reduction, stress concentration and consolidation time showed the efficiency of column encasement, which mainly ruled by the encasement stiffness compared to that of the soil. The time of consolidation significantly reduced as stone column was reinforced. The reason was due to higher stress concentration on column which led lower stress to be transmitted on soft clay. Results of comparative study indicated that the column encasement was equally useful for common area replacement ratios (10% <a c < 20%) but columns of smaller diameters were better confined. Figure Vertical stresses on column and soft soil (Castro and Sagaseta, 2011) Case histories and practical experiences At the middle of 1990 s, the first experiences regarding use of GECs systems were reported. But the required techniques for installing a complete, self regulating respectively interactive bearing system and the appropriate calculation models were developed since The first bearing test on encased columns was performed in Germany in 1994 and in 1996 the first 80
112 foundation system geotextile encased columns for widening an about 5 m high railroad embankment on peat and clay soils in Hamburg was carried out (Kempfert et al. 1997). Meanwhile the appropriate calculation model to calculate the ring tension forces and the settlements as realistic as possible by considering the different interactions between soft soil, casing and column was developed. Up to now there are several project experiences in Germany, Sweden, Netherlands, and Brazil. Table 2-9 shows some practical applications regarding to soft soil improvement with geotextile encased granular column. Table 2-9. Accomplished project with geotextile encased gravel/sand columns. Embankment Soft soil Column a c Year Project Construction height (m) thickness (m) diameter (cm) (%) 1996 Waltershof railroad Baden-Baden railroad Bruchsal road Grafing railroad Saarmund highway Niederlehme highway Herrnburg railroad Tessenitz-Tal highway Krempe bridge ramp Grafing railroad Sinzheim railroad Hoeksche Waard test field s Gravendeel test field Brandenburg bridge ramp Betuweroute bridge ramp Botniabahn bridge ramp Westrik railroad Oldenburg railroad Nowadays, several projects regarding to the road and railroad embankment with the system GECs are being constructed. By means of measurements the effectiveness of GECs stabilized foundations could be proved. As an example the ground improvement at the railroad Karlsruhe- 81
113 Basel is shown in Figure The 1 m to 2 m high embankment was founded on a approximately 7 m thick alternating sequence of peat, sludge and clay layers with stiffness between E s = 0.7 MN/m 2 and 2.3 MN/m². To avoid vibrations at the existing rail track the columns (d=80 cm) were installed using the excavation method. The situation on site and typical measurements are shown in Figure Figure Foundation and typical measurements at the project ABS/NBS Karlsruhe-Basel. Besides using the foundation system in road construction, there are meanwhile experiences in major hydraulic construction projects. For example, the area extension of the airplane dockyard (EADS) in Hamburg was stabilized by approximately 140 GECs for the production of the new Airbus A 380. The area-extension was located in the Mühlenberger Loch adjacent to the west of the existing factory site. The area extension is carried out by enclosing the polder with a 2.4 km long dike to fill up in the area under buoyancy (Figure 2-67). 82


114 Figure Concept to reclaim land by the construction of a polder. The dike foundation was stabilized by about geotextile encased columns with a diameter of 80 cm, which were installed to the bearing layers with depth between 4 m and 14 m below the base of the dike footing. This dike was the new main water protection dike of the airplane dockyard. Furthermore another GECs were installed to relocate the existing Finkenwerder Vordeich towards the river Elbe and to avoid sludge replacement, to increase the stability and to decrease the settlements of the dike. Soil profile is shown in Figure Figure Typical soil boundary conditions at the area-extension of the airplane dockyard at Hamburg- Finkenwerder 83
115 Due to the using of GECs foundation system, the dike was constructed to save the 7 m height water within approximately 9 months construction time. To complete the dike up to 10 m, inclusive a cover of organic clay, a construction time of 15 month was necessary. Due to the different soil conditions along the dike length, 7 cross sections were measured. In a typical measurement cross section, 4 instruments were placed, each containing one earth pressure gauge and one water pressure gauge above the soft soil layer, and two piezometers within the soft soil. In each cross section, one horizontal and two vertical inclinometers were used to measure the deformation. The measured settlements in dike section VI is shown in Figure Figure Measured settlements, for example in section VI. The dike Finkenwerder Vordeich Süd was only partly founded on encased columns. In the part outside the main load area, vertical drainage was used to accelerate the settlements. Figure 2-70 shows typical measurement results pointing out the different settlement reduction in the part with encased columns (thickness of soft soil about 7 m) and the part with vertical drainage (thickness of soft soil about 4.5 m). The foundation system proved its value by flexibility during installation and by short time of consolidation. Therefore it was possible to build up the dike almost continuously in separate layers (Raithel et al. 2002). 84


116 Figure Measured settlements at Finkenwerder Vordeich. In South America encased sand columns were used on a highway (Mello et al., 2008) near the city of São José dos Campos, São Paulo. The subsoil at that location was composed of two soft clay layers separated by a silty sand layer. The columns were installed using pile driving equipment with a closed end (displacement method). After installation of the encasing, the sand was placed inside the geosynthetic and the tube was removed using a vibrating hammer. Figure 2-71 shows installation process and the column in the final stages of execution, and Table 2-10 summarizes the characteristics of the columns and some monitoring results. Figure Execution details of encased columns (Mello et al. 2008). 85

117 Table Summary of the column characteristics and results of monitoring (Mello et al. 2008). Characteristics Values Diameter of columns 0.70 m Geotextile used for encasing ultimate stress of 130 kn/ m and stiffness of 2000 kn/ m Length of columns 10 m Columns spacing 1.85 m and 2.2 m Measured settlements 100 mm Stabilization period after initial readings 6 months Alexiew and Moormann (2009) reported using of GECs system in ThyssenKrupp Steel (TKCSA) Company located in the lowlands at the Brazilian seashore. The stockyard was a large steel plant used for storage of raw mineral material (Figure 2-72). The entire area consisted of soft soils of very low bearing capacity; the ground water level is just below the surface. The thickness of soft soil clay layers varies between 10 m to 20 m. The main idea of GECs was to create a vertical pile-similar element consisting (usually) of compacted sand and a confining high-strength high-modular geotextile encasement providing bearing capacity and reducing compressibility. The columns were 78 cm in diameter which were encased with geotextile encasements Ringtrac R100/250 and 100/275. Compared unimproved site, using GECs system caused the settlement reduced significantly ( equal to around 2.5) and also accelerated the consolidation process. Figure Typical solution in the coal/coke stockpile area (Alexiew and Moormann, 2009) 86
118 To assess the effectiveness ( = settlement without/with columns) of the encased columns in relation to conventional column foundations, the results of tests according to Raithel et al. (2005) and executed projects are compared with published results of foundations with granular piles as shown in Figure As frequently reported, by combining the geotextile encased columns with horizontal geotextile reinforcement (load transfer mat) it is meanwhile possible to construct foundations in even very soft soil layers successfully. The effectiveness respectively the settlement reduction can be forecasted with sufficient and high reliability if adequate and aligned laboratory and field test are performed. Figure Soil improvement factors versus area replacement ratio (Raithel et al. 2005). 87
119 3. Site Investigation 3.1. Introduction This chapter presents the geotechnical properties of the soft clay deposit at the embankment test area. The soft clay parameters were determined by the proper combination of the in situ and laboratory tests performed in the test area, located in the city of Santa Cruz, Rio de Janeiro state. Previous studies (Marques et al. 2008; Almeida et al. 2014) have provided significant information regarding the general soft clay properties of the site. However, owing to its large area of around 0.5 km 2, a more specific site investigation was considered necessary in order to provide a set of geotechnical parameters which allow interpreting adequately the field measurements and also for later use in the numerical analysis of the test embankment General objectives The main purpose of site investigation is to determine the geotechnical properties of the soils based on the suitable combination of the in situ and laboratory tests. The advantage and disadvantages of laboratory and in situ testing is shown in Table 3-1. As seen these tests are complementary and thus three research clusters were defined for site investigation. Each cluster was composed by boreholes in contiguous verticals allowing to perform in situ tests. Results of the laboratory and in situ tests are presented in this chapter. Table 3-1. Advantages and disadvantages of in-situ and laboratory tests applied to soft soils (Almeida and Marques, 2013) Type of test Advantages Disadvantages Well define boundary conditions Disturbance in soils during sampling and modeling Laboratory In situ Controlled drainage conditions Known stress paths during test Identifiable nature of the soil Soil tested in its natural environment Continuous measurements with depth (CPT, piezocone) Greater volume of tested soil Usually faster than laboratory tests Low representation of tested soil Under similar conditions it is generally more expensive than field tests Poorly defined boundary condition, except for self-boring pressuremeter Unknown drainage conditions Unknown degree of disturbance Non-identified nature of soil (except percussion boreholes) 88
120 Regarding the present research, the commonly used in situ tests performed in site investigation program included: Standard Penetration Test (SPT); Vane Shear Test (VST); and Piezocone Test (CPTu). According to Brazilian practice, the SPT is the dominant in situ test for preliminary soil investigation, but very often it is complemented by other in situ and laboratory tests. The VST is usually employed to determine the in situ undrained strength and clay sensitivity. The CPTu (piezocone test with pore pressure measurements) is particularly effective for soft clays, as it allows the estimation of both strength and consolidation characteristics, which are key properties of such soft soils (Lunne et al. 1997; Schnaid, 2005; Robertson and Cabal, 2015). In addition, by CPTu the soil stratigraphy can be obtained, as well as the stress history. The most common in situ tests used in Brazil are CPTu and VST employed in coastal areas, where there are variable geotechnical formations, encompassing compressible costal deposits, and vast tropical soft soil profiles (Danziger, 1990). Experiences gained in soft clay deposits approved the significant importance of application of both CPTu and VST in construction on very soft organic peat, due to providing significant information such as compressibility properties, undrained strength profile, consolidation characteristics, and stress history. A common procedure employed for the determination of these properties also include undisturbed sampling and relevant laboratory testing in a carefully controlled environment, with techniques such as index tests, triaxial compression tests, and oedometer consolidation tests (Almedia, 1998). These tests are carried out in order to determine the strength properties, compressibility index, and coefficients of permeability of the soft soil. Table 3-2 summarizes the tests usually performed and the parameters estimated from each test. The parameters shown in Table 3-2 had been already defined in the symbol list. Table 3-2. Main geotechnical parameters estimated based on in situ and laboratory tests (Almeida and Marques, 2013). Main parameters Test Type Aim of the test Other parameters estimated General characterization of soil; w n,w L, w P, G s, grain Compressibility Laboratory Index test interpretation of other tests size distribution estimates 89
121 In situ Oedometer consolidation test Triaxial UU test Triaxial CU test Vane shear test (VST) Piezocone (CPTu) test Tbar test Pressuremeter (PMT) test Calculation of settlements and settlements vs. time Stability calculations (S u is affected by disturbance) Stability conditions; parameters for deformability calculations 2D (FEM) C c, C s, ' vm, e 0 S u S u, c', ' E oed, C Stability calculations S u, S t OCR Stratigraphy; settlement vs. time (dissipation test) Undrained strength Estimation of S u, c h (c v ) profile Estimation of S u profile Complementary test; general S u, G 0, E c h E u OCR profile, K 0, E oed 3.3. Overview of the test area In 2008 the ThyssenKrupp Steel Company (TKCSA) started the construction of a steel plant in the Brazilian coastal lowlands near the city of Santa Cruz, including a stockyard for coal and coke material. The total stockyard area was 800 m 600 m, with that part set aside for coal/coke covering 800 m 350 m (Figure 3-1a). The entire area consists of soft soils with a low bearing capacity (S u <30 kpa), and the ground water level close to the clay surface. A 1.5 m thick working platform including dredged sand material was placed on top of the soft layer to provide proper equipments operation in the stockyard area. The thickness of the soft clay layers in the stockyard varied from 8 to 10 m and is underlain by medium sands and rock. Different types of soft soil improvement techniques were adopted to overcome the design difficulties in the clayey area (Alexiew and Moormann, 2009). In part of the area, the optimum solution found comprised a composite foundation with geosynthetic encased granular columns (GECs). Aiming to a better understanding of the behavior of GECs improved stockyard foundations; the ThyssenKrupp Company dedicated the test area to perform a field study. To achieve this, a full-scale test embankment was constructed in the instrumented test area located inside the stockyard area (Figure 3-1b). The field test aimed to reach the realistic total vertical stress applied in the actual stockyard. Prior to test embankment construction, an extensive site investigation was found to be necessary to determine the soil stratigraphy, to localize the instrumentation, and to obtain the main geotechnical properties of the soft clay. The site investigation had the objective to an adequate interpretation of the field measurements and also 90
 Coal/ore stockyard in TKCSA company Test area (b) Figure 3-1. (a) Coal/ore stockyard in TKCSA company and (b) location of the test area.")

122 for later use in the numerical analysis of the test embankment, as described in the following sections. (a) Coal/ore stockyard in TKCSA company Test area (b) Figure 3-1. (a) Coal/ore stockyard in TKCSA company and (b) location of the test area Location of the research clusters The in situ tests were performed to achieve the sequence of the subsurface strata, groundwater level, to collect undisturbed samples, and to determine the geotechnical properties of soil profile. It is mentioned that the encased columns were installed in 2008 and subsequently 91

123 the total equilibrium had already been reached between the installed columns and the surrounding soft clay. Three research clusters were then defined for performing the in situ tests. The criterion for research clusters selection was to minimize disturbance due to construction operations and thus they were arranged in a diagonal line in the test area in order to obtain a precise understanding of sub-surface conditions. The location of the research clusters in the test area is illustrated in Figures 3-2 consisting following tests performed in each cluster: SPT with continues disturbed sampling; Piezocone (CPTu) with dissipation tests; VST with sensitivity measurement; and Undisturbed sampling at different depths. SPT02 CPTu02 VST02 Cluster m Cluster m SPT01 CPTu01 VST01 Cluster 03 SPT03 CPTu03 VST03 Figure 3-2. Test area and location of the research clusters Standard penetration test (SPT) The main and immediate purpose of SPTs was to define the soil stratigraphy for an adequate localization of the VST and CPTu tests as well as depth of the sample collection. Therefore, the correction regarding the energy delivered by SPT s equipments was out of the scope of the present study. According to SPTs performed (ASTM-D1586) the geotechnical profile in the test area is presented in Figure 3-3 including the SPT blow counts, as well as the positions of the 92
124 CPTu and VSTs performed in each research clusters. It can be seen that the upper 2 m of soil comprises sandy dredged material (working platform) and thus the N SPT increases to 8 in this zone. Due to high water table level, the working platform was placed before column installation, thus crossing the columns, to provide less soft surface and thus allowing the equipments could operate properly. It is evident that subsoil conditions are mainly characterized by an upper soft clay layer (soft clay I) extending to an approximate depth of 6.6 m (N SPT =0). The subsurface profile is underlain by a thin zone of medium silty sand at a depth of 6.6 m to 8 m. Below this zone is the soft clay II layer, which is less soft than soft clay I (i.e. lower compressibility and higher shear strength) as indicated by SPT blow counts and is classified as a soft to medium clay. Soft clay II is underlain by a medium dense sand layer with a thickness of 0.9 m to 2 m, which is in turn followed by the1.7 m to 3.6 m thick clay III layer. The remaining soil profile comprises a dense sand layer down to a depth of 30 m. The groundwater level was found to lie somewhere between 1 m to 1.5 m below the ground surface. Therefore, the overall geotechnical profile is composed of three soft clay layers inter-bedded with two layers of medium sand. Figure 3-3. Subsurface profile in the test area after SPTs and position of the CPTu and VSTs. 93
125 As illustrated in Figure 3-3, site investigation carried out by three vertical piezocone borings comprising 10 dissipation tests (CPTu), 14 vertical vane shear test (VST), and five undisturbed samples (SM) extracted using stationary Shelby piston tubes. The VSTs were performed in soft clay I and soft clay II at depths varying from 3 to 9 m. Piezocone tests were performed down to 28 m below the ground surface, including three dissipation tests at the central cluster and seven dissipation tests performed at corners which will be described in the following sections Piezocone test (CPTu) In the piezocone tests a cone on the end of a series of rods is pushed into the ground at a constant rate and continuous measurement are made of the resistance to penetration of the cone and of a surface sleeve (ASTM-D5778). The total force acting on the cone Q c divided by the tip area of the cone A c produced the cone resistance q c. The total force acting on the friction sleeve F s divided by the surface area of the friction sleeve A s produces the sleeve friction f s (Schnaid, 2009; Robertson and Cabal, 2015). In a pizocone test, pore pressure is also measured in cone tip u 1 and cone shoulder u 2 as illustrated in Figure 3-4a. Figure 3-4b shows the size of cones from a mini-cone at 2 cm 2 to the large cone at 40 cm 2. The mini cones are used for shallow investigation; whereas the large cones can be used in gravely soils. The standard rate of penetration is 2 cm per second and during a pause in penetration, any excess pore pressure generated around the cone will start to dissipate. The rate of dissipation depends upon the coefficient of consolidation, the compressibility and permeability of the soil, and the diameter of the probe. A dissipation test can be performed at any required depth by stopping the penetration and measuring the decay of pore pressure with time. If equilibrium pore pressures are required, the dissipation test should continue until no further dissipation is observed. This can occur rapidly in sands but may take several days in plastic clays. Dissipation is faster for smaller cones or piezometer probs. 94
 location of pore pressure measurements, and (b) range of piezocone probes (from left: 2cm 2, 10cm 2, 15cm 2, and 40cm 2 ) (Robertson and Cabal, 2015). 3.6.")
126 (a) (b) Figure 3-4. Typical probe used in the piezocone test (a) location of pore pressure measurements, and (b) range of piezocone probes (from left: 2cm 2, 10cm 2, 15cm 2, and 40cm 2 ) (Robertson and Cabal, 2015) Piezocone equipment used COPPE/UFRJ s piezocone equipment was used to perform CPTu tests. A number of researches with emphasis on piezocone test have been developed using COPPE s piezocone equipments (Danziger, 1990; Bezerra, 1996; Danziger et al. 1997; Aguiar, 2008; Jannuzzi, 2009; Baroni, 2010). It is mentioned that COPPE/UFRJ s piezocone equipments measure u 1, a unique feature, even for international standards. The COPPE/UFRJ s piezocone equipment basically consists of: Main power machine, with hydraulic system powered by a 10 HP phase electric motor and crimping capacity of 200 kn (7 kn weight) capable of providing a constant speed in the range of 0.1 cm/s to 5 cm/s during the process of spiking (Figure 3-5a); Set of rods with 1 m length and 36 mm diameter (Figure 3-5b); Piezocone COPPE-IV, 10 cm 2 tip area and 150 cm 2 sleeve friction area, able to measure tip resistance (q c ), sleeve friction (f s ), with the slope vertical (i) and pore water pressures in two sections (on the cone base, u 1 and on the shoulder, u 2 ). The capacity of the load cells is 60 kn (peak) and 10 kn (friction) and transducer spore pressure is 15 bar; 95
; 16-bit data acquisition system signal conditioning; Notebook HP, INTEL CPU 3.")


127 Piezometric probe with diameter of the porous element equal to 12 mm which can measure the pore pressure in the cone base, u 2. The ability of the pore pressure transducer is 15 bar (Figure 3-5c); 16-bit data acquisition system signal conditioning; Notebook HP, INTEL CPU 3.06GHz, 504M RAM, Windows operating system XP (Figure 3-5d); and Depth measurement gauge. (a) (b) (c) (d) Figure 3-5. COPPE/UFRJ s piezocone equipment. After installation of the driving machine in the desired boring, the piezocone tests were carried out by pushing the probe at the constant speed equal to 2 cm/s. The maximum depth reached in each test was established by the reaction capacity criterion which the equipments could tolerate, consisting of hand-auger devices coupled to the weight the crimping machine of 7 kn. In total three vertical piezocone tests were performed including 10 dissipation tests conducted at the different depth shown in Figure 3-3. Due to the existence of mud on ground, 96
128 moving the driving machine was provided by placing the wooden planks over the soft surface, allowing the driving machine could pass easily, and thus preventing the wheels sinking. Representative depths and durations of dissipation tests are presented in Tables 3-3. Each CPTu dissipation test was identified by corresponding depth where the dissipation test was performed. The goal was to reach approximately 70% dissipation of pore pressure, but sometimes this degree of dissipation did not occur even for tests with times over 2.5 to 3 hours and test was stopped as 50% dissipation was reached. Some dissipation tests were performed in sand drainage layers below the soft deposit to verify the hydrostatic pressure. Also, the ground water level was measured as it was found to be located somewhere between 1 to 1.5 m below the ground surface. Table 3-3. Depth of the dissipation tests performed. Dissipation tests Depth (m) Duration (sec) CPTu01-DP CPTu01-DP CPTu01-DP CPTu02-DP CPTu02-DP CPTu02-DP CPTu02-DP CPTu03-DP CPTu03-DP CPTu03-DP Corrected cone tip and friction resistance Cone point resistance measured at the tip of the cone (q c ) was corrected according to the equation proposed by Campanella et al. (1982): q q (1 a) u T c 2 (3-1) Where: q T = the corrected cone tip resistance; q c = the resistance measured at the tip of the cone; 97
129 u 2 = the pore pressure measured at the cone shoulder; and a= the ratio of the area obtained via calibration and equal to Similar to correction of q c, the lateral friction f s should also be corrected, but as the equipment used does not measure the pore pressure at the top of the sleeve (u 3 ), thus this correction was not performed. Figure 3-6 shows the results of the three vertical piezocone tests performed in the test area. From Figure 3-6a, it can be seen that corrected cone resistance q T varies close to 400 kpa at depths of 1.8 to 6.5 m, i.e. in the soft clay I layer. Values of q T then increase monotonically up to 10 m depth, exceeding 4000 kpa due to the existence of the sand zone underlying the soft clay II layer. Beyond 10 m, q T values drop to lower than 1500 kpa in soft clay II, less soft than clay I. A similar behavior was found for variations of sleeve friction f s with depth as shown in Figure 3-6b. Pore pressure variations (u 1 and u 2 ) measured by CPTu03 are compared with hydrostatic water pressure (u 0 ) in Figure 3-6c. As expected, u 1 and u 2 grow significantly in the soft clay I, but decrease in the underlying sand layer to equal that of the hydrostatic water pressure u 0. Values of u 1 and u 2 then increase again in soft clay II, with greater variation compared with soft clay I indicating soft clay II is less permeable. The results of CPTu tests performed in the present research were used for the following purposes: To define the soil stratigraphy; To obtain a continuous profile of undrained strength (S u ) in correlation with the VSTs; To determine the coefficients of horizontal and vertical consolidation (c h, c v ); and To obtain a continuous estimated profile of over consolidation ratio (OCR). The interpretation of these results with combination with VSTs is presented in next sections. 98
130 1 Corrected cone resistance, q T (kpa) Friction resistance, f s (kpa) u 0, u 1 and u 2 (kpa) Deprh (m) CPTu01 CPTu02 CPTu03 Depth (m) CPTu01 CPTu02 CPTu03 Depth (m) u0 u1 u (a) (b) 10 (c) Figure 3-6. Data obtained from piezocone tests (a) corrected cone tip resistance, (b) friction resistance, and (c) pore pressures. 99


131 Soil behaviour based on CPTu data The most commonly used CPTu soil behaviour type (SBT) chart was suggested by Robertson et al. (1986). This chart uses the basic CPTu parameters of corrected cone resistance q T and friction ratio, F r. The chart is global in nature and can provide reasonable predictions of soil behaviour type for CPTu soundings up to about 20 m in depth. Overlap in some zones should be expected and the zones should be adjusted somewhat based on local experience and results of SPT tests performed. The normalized charts suggested by Robertson (1990) also included an additional chart based on normalized pore pressure parameter, B q, as shown on Figure 3-7, where: qt Qt B F q r u q q T T v0 v0 u 2 0 fs v0 v0 100% (3-2) (3-3) (3-4) According the Figure 3-7 it can be seen that the soil profile of test area mostly located in zone 2 and 3 with OCR values between 1 and 2 which is classified as organic soft clay. Figure 3-7. Soil behavior type after CPTu tests performed. 100
132 Coefficient of horizontal consolidation As the probe is penetrated in the soft clay layer, the excess pore pressure is generated due to rapid loading induced in low permeable soft clay. The excess pore pressure around the probe then begins to dissipate. The rate of dissipation (T*) mainly depends on the probe radius (R), the coefficient of soil horizontal consolidation (c h ), and the soil stiffness index (I r ). Figure 3-8 and Figure 3-9 show a typical dissipation curve of the clay obtained respectively from dissipation tests CPTu01-DP3 and CPTu02-DP2. The type of behavior of the curve shows an initial increase, followed by a process of gradual dissipation. Any procedure for the determination of c h (Robertson et al. 1986; Schnaid et al. 1997; Danziger and Schnaid, 2000) requires an accurate estimation of the pore pressure value at the beginning of dissipation u i and the value of the hydrostatic pore pressure u o. In case there is not any clear u 0 value, it is recommended to determine the initial pore pressure u i by extrapolating the dissipation line (Soares, 1997). Figures 3-8 and 3-9 also show the determination of u 50% and t 50% which respectively indicate to the pore pressure and the time corresponding to 50% of the dissipation of excess pore pressure. The coefficient of soil horizontal consolidation may then be calculated by Equation 3-5 which takes into account the soil stiffness index I r and the time factor, T* (Houlsby and Teh, 1988): T * c. h t50 2 R Ir (3-5) Where: R= radius of piezocone; t 50 = time of 50% dissipation; and I r = rigidity index (G/S u ). Values of the shear modulus G (=E u /3) and undrained strength S u were directly obtained from CU triaxial tests as shown in Table 3-4. Furthermore, values of the time factor T * according to the percentage of dissipation are listed in Table 3-5 (Houlsby and Teh, 1988). Figures 3-10 also presents the values of the coefficient of soil horizontal consolidation estimated from all dissipation tests performed. Smaller c h values obtained in soft clay I indicate this layer is softer than clay II as expected. 101
133 u i = 223 kpa u1 u2 Pore pressure (kpa) u 50 = kpa u 0 = 97.4 kpa t 50 = 1020 sec Time (sec) Figure 3-8. Typical pore pressure dissipation curve obtained from piezocone test (CPTu01-DP3) u1 u2 Pore pressure (kpa) u i = kpa u 0 = 78.5 kpa t 50 = 2860 sec Time (sec) Figure 3-9. Typical pore pressure dissipation curve obtained from piezocone test (CPTu02-DP2). 102
134 Table 3-4. Values the rigidity index after CU triaxial test performed. Depth of sampling E u (kpa) S u (kpa) G(kPa) I r (-) m m m Table 3-5. Time factor for analysis of dissipation test (Houlsby and Teh, 1988). Dissipation degree Time factor, T* (-) U h (%) Based on u 1 values Based on u 2 values Depth (m) 1.00E E-06 c h (m 2 /s) 1.00E E c h = m 2 /s u1_pz1_kpa u2_pz1_kpa u1_pz2_kpa Soft clay I u2_pz2_kpa u1_pz3_kpa u2_pz3_kpa 9 Sand lens c h = m 2 /s Soft clay II Figure Coefficient of horizontal consolidation obtained from CPTu tests. 103
135 3.7. Vane shear test (VST) The vane shear test is used preliminary to determine the undrained shear strength S u of saturated clay deposits with strength generally up to 200 kpa (Schnaid, 2009). The vane shear test consists of inserting a simple four-bladed vane into either clay or silt and rotating the device about a vertical axis and measuring the torque, which is then related to the mobilized undrained shear strength (ASTM-D2573; Chandler, 1988). Both peak and remolded strengths can be measured. A selection of vanes is available in terms of size, shape, and configuration, depending on the consistency and strength of the soils. The standard vane has a rectangular geometry with a blade height to diameter ratio of 2. The test is often carried out by pushing the vane into the soil at the bottom of drilled borehole and the vane should be pushed at least four borehole diameters to avoid disturbance from drilling. The test can also be carried out using direct-push equipment pushing from the ground surface when there are no firm layers. Within 5 minutes after insertion, rotation should be carried out at a constant rate of 6 degrees per minute (0.1 o /s) with frequent measurements of the mobilized torque. A variation of 0.6 /min on the rotation angular velocity is tolerated. The conventional interpretation to obtain the undrained shear strength (S u ) from the maximum torque (T max ) assumes a uniform distribution of shear stresses on both top and bottom and also along the blades for a vane with a height-to-width ratio H/D = 2 (Chandler, 1988) where D is the diameter of blades in plant: S u 6T 7 D max 3 (3-6) After the peak S u(peak) is obtained, the vane is rotated through 10 complete revolutions in less than five minutes and the test is repeated to measure the remolded values of undrained strength (S u(remolded) ). The clay sensitivity, S t, is then calculated by: S t S S u( peak ) u( remolded ) (3-7) According to Table 3-6 the sensitivity parameters S t obtained from VSTs is used to classify the sensitivity degree of the soft clays (Skempton and Northey, 1952). 104
136 Table 3-6. Classification of soft clays for sensitivity (Skempton and Northey, 1952). Description Sensitivity degree (S t ) Insensitive clay 1 Low sensitive clay 1-2 Medium sensitive clay 2-4 Sensitive clay 4-8 Very sensitive clay >8 Extremely sensitive clay (quick clay) > VST equipment utilized The COPPE/UFRJ s adopted vane equipments have been used in several research works which were also utilized in the present study (Baroni, 2010; Souza, 2014). The equipment of the COPPE/UFRJ used consists primarily of: Blade height, diameter, and thickness were equal to 130 mm, 65 mm, and 2 mm respectively. Thus the ratio of the height/diameter= 2; Blade protection shoe (hull); Internal and external rods of 1 m length; Torque table (application torque device to rods); Cell torque in order to minimize the frictions on rods; Step motor, capable of imparting a constant, standard rotational speed, of 6 o per minute. Figure 3-11 illustrates the components of the COPPE/UFRJ s VST equipment used in present study. One important characteristic of COPPE/UFRJ equipment is that the torque measurement is done closer to the blades, at bottom of body equipment, preventing thus, additional and measured torque due friction. 105
. 3.7.2.")
137 Figure Components of the VST equipment used in field (Baroni, 2010) Results of VSTs In total 14 VSTs vertical were performed in three borings (VST01, VST02, and VST03) located in the center and at corners of the test area (see Figure 3-3) and thus the undrained shear strength S u and clay sensitivity S t were obtained. The depths of each test performed are presented in Table 3-7. Figure 3-12 presents the values of S u obtained from VSTs performed at different depths of each boring and using Equation 3-6. As expected, the S u values increase gradually as a function of depth with an average values equal to 20, 23, and 30 kpa respectively for VST01, VST02, and VST03. Variations of the sensitivity degree S t along the soil profile obtained from data of VSTs is also presented in Figure It is observed that the average values of sensitivity are equal to 4, 5.5, and 5 respectively for VST01, VST02, and VST03 indicating that the soft clay deposit is sensitive (see Table 3-6). Table 3-7. Depth of VSTs performed at different borings. Depth of VST performed (m) VST01 VST02 VST03 undisturbed remolded undisturbed remolded undisturbed remolded
138 S u (kpa) S u (kpa) S u (kpa) Undisturbed soil Disturbed soil 1 2 Undisturbed soil Disturbed soil 1 2 Undisturbed soil Disturbed soil Depth (m) Depth (m) Prof. (m) (a) 10 (b) 10 (c) Figure Variations of undrained strength from VSTs performed in the test area. (a) VST01; (b) VST02; and (c) VST
139 Sensitivity, S t (-) Sensitivity, S t (-) Sensitivity, S t (-) Sensitivity 1 Sensitivity 1 Sensitivity Depth (m) Depth (m) Depth (m) Average S t = 4 Average S t = Average S t = 5 10 (a) 10 (b) 10 (c) Figure Variations of clay sensitivity in the test area. (a) VST01; (b) VST02; and (c) VST
140 Empirical cone factors The undrained strength may be obtained by the piezocone test using a number of semiempiric equations (Lunne et al. 1997; Schnaid, 2009). The most used equations relate to the corrected cone resistance (q T ) with the cone factor (N kt ), and the pore pressure with the cone factor (N u, N ke ). Thus determining the cone factor locally at the site is quite important for precise estimation of the undrained strength by piezocone tests. Value of the empirical cone factor (N kt ) is computed by correlating data of piezocone and vane shear tests using the expression: N kt Where: qt S v0 u( VST ) N kt = empirical cone factor; v0 = in situ total vertical stress; and S = undrained shear strength obtained from VST. u( VST ) (3-8) Figure 3-14 shows the variation of the cone factor (N kt ) along soil depth calculated using Equation 3-8 and based on data of the CPTu and VSTs performed in the test area. It can be seen that the cone factor has a constant value of N kt =13 up to 7 m (soft clay I) and then it increases to around N kt = 40 in soft clay II. Previous studies indicated that N kt values depend on the CPTu equipment used (Ladd and De Groot, 2003).The average value of N kt for Brazilian clays is close to 12 (Almeida et al. 2010; Schnaid and Odebrecht, 2012) which is similar to the value obtained for soft clay I. Other empirical cone factors such as N u and N ke have been also proposed based on the pore pressure measurements, (Lunne et al. 1997; Schnaid, 2009, Robertson and Cabal, 2015).The cone factor N u takes into account the variation of the pore pressure (u 2 ) in relation to the hydrostatic pore pressure (u 0 ) by: N u u S u 2 0 u( VST ) (3-9) Also the cone factor N ke is determined based on the corrected cone resistance (q T ) and pore pressure (u 2 ) as: N ke qt u S 2 u( VST ) (3-10) 109
141 Cone factor, N kt (-) N kt = 13 CPTu 01 CPTu 02 CPTu 03 Depth (m) Soft clay I 7 8 Soft clay II N kt = Figure Empirical cone factor N kt based on VST and CPTu tests correlation. Figure 3-15a and 3-15b shows the variation of the empirical cone factors N u and N ke calculated by Equations 3-9 and 3-10, respectively. It can be seen that values of N u and N ke range respectively from 2.0 to 7.1 and from 9.4 to 45 with average values of N u = 4.8 and N ke = Robertson and Cabal (2015) showed that values of N u vary from 4 to 10 and that for a more conservative estimate, values near the upper limit should be chosen. Experimental studies also indicate that values of N ke are scattered around mean values of 9 (Schnaid, 2009) and appear to meet the N ke values obtained for the soft deposit in the present study. However, N ke is lees used among all three empirical cone factors. 110
142 Undrained strength, S u (kpa) Undrained strength, S u (kpa) CPTu 01 CPTu 02 CPTu N ke = 9.4 N ke = N u = u 2 - u 0 (kpa) N u = 4.8 q T - u 2 (kpa) CPTu N u = CPTu 02 CPTu 03 N ke = (a) 2000 (b) Figure Empirical cone factors determination, (a) N u and (b) N ke Profile of undrained shear strength Among the all three empirical cone factors, N kt is widely used for estimation of S u as it is influenced by soil plasticity, over consolidation ratio, sample disturbance, strain rate, and scale effects as well as the reference test from which S u has been established (Schnaid, 2009). The empirical cone factor N kt determined by correlation of VSTs and CPTu tests is then used to obtain the profile of the undrained shear strength using: S u q N T v0 kt (3-11) 111
143 Figure 3-16a shows the S u profile obtained from data of all CPTu tests performed in the test area and using Equation It is observed that S u values in soft clay I range less that 20 kpa which is expected the behavior of very soft clay. However, the values of S u in soft clay II increase up to 50 kpa indicating this layer is less soft than soft clay I. Beside VST and CPTu tests, undrained strength can also be determined from number of experimental and theoretical equations for use in the stability calculations (Mesri, 1975; Jamiolkowski et al. 1995). A recent developed mathematical derivation here is used to estimate the profile of undrained shear strength (Mantaras et al. 2014) in which the principles factors affecting on S u are the variations of pore pressure and rigidity index of clay. The values of S u obtained from the proposed approach can be compared with S u determined by vane and piezocone tests. The expression proposed by Mantaras et al. (2014) is presented as follow: S u umax 4.2 log I Where: r umax u2,max u (Obtained from dissipation tests, CPTu); and 0 I E /3S (Obtained from CU triaxial tests shown in Table 3-4) r u u (3-12) In Figure 3-16a, the undrained strength estimated by Mantaras et al. (2014) are compared with data from vane and piezocone tests. It can be seen that values of S u computed by Mantaras et al. (2014) are very similar to those obtained by piezocone and vane tests. Clay sensitivity obtained from data of all VSTs is also presented Figure 3-16b. An average value of the clay sensitivity S t = 5 is found along the soil profile and then according to the Skempton and Northey (1952) the soft clay deposit is classified as a sensitive clay. Most Brazilian clays have sensitivity in the 1 to 8 range, with average values between 3 and 5 (Schnaid, 2009). However, sensitivity values of up to 10 have been observed in clays of Rio de Janeiro, such as the clays of Juturnaiba and of Barra da Tijuca (Coutinho, 2007; Baroni and Almeida, 2012). 112
144 Undrained strength, S u (kpa) Clay sensitivity, S t (-) Working platform (sand) Depth (m) CPTu01 CPTu02 CPTu03 CPTu01 (Mantaras et al.) CPTu02 (Mantaras et al.) CPTu03 (Mantaras et al.) VST01 VST02 VST03 Depth (m) Average S t = VST VST02 VST03 10 (a) 10 (b) Figure (a) Undrained strength along soil profile and (b) clay sensitivity Soil sampling Laboratory tests were performed on undisturbed samples collected using the Shelby sampler at different depths as listed in Table 3-8. An essential condition for good laboratory test results is the suitability of the collected undisturbed samples. The soil sample retrieval using a Shelby sampler with a stationary piston (NBR-9820, 1997) requires special precautions such as the use of bentonite slurry in the borehole. The soil sampling was performed according to the procedure proposed by Ladd and De Groot (2003) and using stainless brass tube (Shelby) with diameter and length respectively equal to 0.15 m and 0.6 m as follows: 113
145 The Shelby tubes were driven statically at the desired soft clay depth. The static penetration was provided using the air piston pressure in a controlled rate to avoid destruction of the soil structure. It is mentioned that after installation of the Shelby tube into to the soil, it was necessary to wait some hours to collect the sample from the ground to minimize disturbance and sliding of sample in the soil-tube interface; After removal of the Shelby tube, the collected sample was extracted using piston port communicating with the atmosphere. This procedure eliminates the possibility of suction in the upper emergence sampler, thus avoiding disturbance the structural integrity of the sample. The Shelby tube was cleaned and its end was sealed to keep the soil natural moisture as well as the structure of the sample. The sealing was made using PVC film layers, aluminum foil, and paraffin as recommended in NBR-9820 (1997). The sampler then was left up on its un-beveled end (base) and kept in a woody box surrounded by the sawdust and was transported to the wet chamber of the geotechnical laboratory of COPPE/UFRJ. Table 3-8. Depth of sampling collected at each research cluster. Depth of sampling (m) Cluster 01 Cluster 02 Cluster Index tests The index tests were performed on undisturbed samples aiming to determine the following geotechnical characteristics: Analysis of particle size; Determination of moisture content; Liquid limit, plastic limit; and Specific density of the grains. 114
146 All index tests were performed based on ABNT s standard (Brazilian Association of Technical Standard): NBR-7181 (1984): Soil-sieve analysis - test method, ABNT; NBR-6457 (1986): Soil samples preparation for consolidation and characterization tests, ABNT; NBR-6459 (1984): Determination of liquidity limit, ABNT; NBR-7180 (1984): Determination of plasticity limit, ABNT; NBR-6508 (1984): Determination of specific density of the grains, ABNT. It should be mentioned that the natural specific unit weight (γ n ) and the initial voids ratio (e 0 ) of each specimen were calculated from the total volume, total weight, natural moisture (w n ), and the specific density of the grains (G s ) Results of the index tests Figure 3-17 shows results of the index tests along the soil profile. According to the Figure 3-17a, it can be seen that the natural water content (w n ), ranging from 89% to 186% close to the liquidity limit (w L ) in the upper part of soil deposit. Based on the values of plasticity index w P and liquidity index w L, the soft clay studied is classified as very high to extremely high plasticity clay which is typical for coastal soft soils of southeast Brazil. The specific density of the grains G s (Figure 3-17b) is smaller in the surface layers apparently due to the concentration of organic matter and increases with depth. As seen in Figure 3-17c, the soil submerged unit weight ( ') varies between 3.5 kn/m 3 to 4.2 kn/m 3 for soft clay I, which is a typical value for very soft clay in west of Rio de Janeiro district (Futai et al. 2008). Increasing submerged unit weight in soft clay II indicates higher undrained strength as is confirmed by vane test and SPT blow counts (see Figure 3-12 and Figure 3-3, respectively). Figure 3-17d also shows the variation of the voids ratio along soil profile. It is seen that the initial voids ratio is bigger along soft clay I reaching the highest value of e 0 = 3.12 at depth z= 5 m where the highest natural water content (w n =186%) is observed. 115
147 0 w (%) G s (gr/cm 3 ) ' (kn/m 3 ) e 0 (-) Depth (m) 6 Depth (m) 6 Depth (m) 6 Depth (m) wn wl wp (a) (b) (c) (d) Figure Index properties along the soil profile obtained by characterization tests. 116


148 3.10. Sample quality assessment The procedure proposed by Ladd and De Groot (2003) was used for the extraction of the samples from the Shelby sampler. The procedure consisted of cutting the sample tube to the required length for the specimen to be tested. A needle with suitable length is inserted between the specimen and the sampler wall and then metal wire is passed through this interface in order to release the sample from the sampler. Figure 3-18 shows the sequences of the specimen preparation for the oedoemeter test. The similar procedure was used for the triaxial specimens. Figure Specimen preparation for oedometer consolidation test. The quality of the samples was assessed using the criteria of Lunne et al. (1997) and Coutinho (2007) those are proposed for Brazilian soft soils. The overall assessment is performed based on the variation of the voids ratio during consolidation tests using expressions below: v0 ( e0 / (1 e 0)) ( e / e0 ) (3-13) 117
149 e e e (3-14) ( v0 ) 0 Where: e 0 = values of voids ratio at beginning of the consolidation test; and e( v 0 ) = values of voids ratio at in situ vertical effective stress state. Both e 0 and e( v 0 ) were obtained by consolidation curves presented in Figure Data presented in Table 3-9 shows that four samples had good to acceptable quality and one had poor quality in accordance with the criteria of Lunne et al. (1997). However, using Coutinho s (2007) criteria, four out of five samples had acceptable quality and one sample had poor quality. Table 3-9. Summary of sample quality assessment. Sample location Depth (m) e 0 e( v 0 ) v0 Lunne et al. (1997) Coutinho (2007) Cluster Good to fair Acceptable Cluster Good to fair Acceptable Cluster Poor Poor Cluster Good to fair Acceptable Cluster Good to fair Acceptable Oedometer consolidation test Oedometer consolidation tests were performed on each of the five undisturbed samples and thus the compression and swelling indexes (C c and C s ), the oedometer modulus (E oed ), the coefficient of vertical consolidation (c v ), and the coefficient of vertical permeability (k v ) were obtained. In the conventional oedometer test with incremental load, each load increment was applied for 24 hours. The maximum vertical stress to be applied was chosen depending on the stress history of the deposit and the embankment height. For very soft clays, it is recommended that one must start with low vertical stresses of 1.5 kpa or 3 kpa, and loading stages are carried out until the required vertical stress is reached (Almeida and Ferreira, 1992). Figure 3-19 presents the compressibility curves obtained from the consolidation tests performed on each specimen. It is observed that the initial voids ratio (e 0 ) varies from 0.82 to 2.82 depending on the depth at which the specimen was collected. In addition, the average values of compression index (C c ) for the samples taken from soft clay I vary from 1.03 to 1.27, indicating soft clay I is too compressible. 118
150 e (-) Cluster Island 01, 2.85m-3.35m 1.4 Cluster Island 01, 5.75m- 6.25m Log ' v (kpa) e (-) Log ' v (kpa) e (-) Cluster Island 01, 8.15m-8.65m Cluster Island 02, 1.60m-2.10m e (-) Log ' v (kpa) Log ' v (kpa) Cluster Island 03, 4.75m-5.25m e (-) Log ' v (kpa) Figure Compressibility curves obtained from oedometer consolidation tests. 119
151 The compressibility parameters obtained from oedometer tests are shown in Figure 3-20 where the variation of the C s /C c and the compression ratio CR = C c /(1+e 0 ) are plotted along the depth. Based on Figure 3-20a, the ratio of C s /C c has an average value of 0.1 at soft clay I as it is typical values for soft clays. Similarly, the variation of the compression ratio CR is shown along the depth in Figure 3-20b. The data indicates that the average CR is close to 0.3 indicating that soft clay I is too compressible while this parameter improves significantly in soft clay II as it drops to Thus, it can be stated that soft clay II is much less compressible than soft clay I as previously observed by the SPT blows. Lacerda and Almeida (1995) reported that CR values vary from 0.2 to 0.4 for Brazilian soft clay which is in agreement with the values obtained for soft clay studied. The relationship between compression index (C c ) and natural water content (w n ) was established as shown in Figure 3-20c. Futai et al. (2008) determined C c =0.013w n for Rio de Janeiro soft clays, which is very similar to C c =0.0135w n obtained for soft clay in thus research. Table 3-10 also summarizes the results obtained from oedometer consolidation including averages values of coefficient of soil vertical permeability (k v ), oedometer modulus (E oed ), and coefficient of vertical consolidation (c v ) as those are strongly depended on the vertical stress level applied in each loading stage. 0 2 C s /C c Average C s /C c = CR= C c / (1+e 0 ) Average CR= w n (%) C c = w n 0.4 Depth (m) 4 6 Soft clay I Depth (m) 4 6 Soft clay I C c (-) Soft clay II 8 Soft clay II (a) 10 Figure Results of oedometer tests, (a) relation of Cs/Cc, (b) compressibility ratio CR, and (c) relation of Cc and w n. (b) 1.4 (c) 120
152 Table Summary of the clay parameters obtained from oedometer consolidation tests. Sampling depth Cluster 01 (2.85m- 3.35m) Cluster 01 (5.75m- 6.25m) Cluster 01 (8.15m- 8.65m) Cluster 02 (1.60m- 2.10m) Cluster 03 (4.75m- 5.25m) w n (%) C c (-) C s (-) (kpa) vm e 0 (-) k v (m/s) c v (m 2 /s) E oed (kpa) Variations of E oed and k v in consolidation tests The results of oedometer consolidation tests were used to determine the variations of the oedometer modulus of the soft clay (E oed ) with the vertical stress applied ( ) as shown in v0 Figure It can be seen that the oedoemeter modulus varies close to 500 kpa for the vertical stress level lower than 100 kpa. However, for the vertical effective stress beyond 100 kpa, the oedometer modulus increases linearly as a function of vertical applied stress. The relationship is found as the best fit corresponding to the average values of E oed at each vertical stress level E oed = 4.87 ' v0 E oed (kpa) Cluster01 Island (2.85m-3.35m) Cluster01 Island (5.75m-6.25m) Cluster01 Island (8.15m-8.65m) ' vo (kpa) Figure Variations of oedometer modulus versus vertical stress applied obtained from consolidation tests. 121
153 Figure 3-22 shows the variation of the coefficient of vertical permeability against voids ratio obtained by oedometer consolidation tests. This relationship is quite important for the estimation of the settlement rate particularly applicable in numerical modeling of the embankment on soft clay as the vertical permeability of the soil changes with consolidation. The increase of the soil permeability with voids ratio is a well-known behaviour of the soft soils as can be seen in Figure A linear relationship was found by variation of the vertical permeability with different voids ratio. The slope of the e versus log k v is the parameter C k, which is equal to 1.03 for soft clay studied and was used in finite element analysis. This values, however, smaller than that given by the correlation C k = 0.5e 0 (Tavenas et al. 1983). The data are presented for samples taken at soft clay I and it can be seen that the permeability of those specimens with higher compressibility index is significantly affected by the variation in the voids ratio C k = e/ log (k v )= 1.03 e (-) E-11 1E-10 1E-09 k v (m/s) Figure Variations of the vertical permeability against voids ratio Stress history Stress history is expressed by the over consolidation ratio OCR, defined as the ratio of the ' maximum past effective vertical stress ( ) and the in situ vertical effective stress ( ) (Terzaghi, 1943). A careful determination of the pre-consolidation stress ( ' vm 122 ' vm v0 ) is particularly important to evaluate the stress history of the soft clay. The pre-consolidation stress was determined from compressibility curves presented in Figure 3-19 and according to the method proposed by Pinto (2000). As shown in Table 3-10, the pre-consolidation stresses obtained from
154 oedoemeter tests varied between 32 and 53 kpa close to values of initial effective stress ( ). Figure 3-23a shows values of the OCR varying with depth obtained by oedometer consolidation tests. It is observed that the soft clay is lightly over consolidated up to 4 m with the OCR values in a range from 1.1 to 1.5. Therefore, soft clay studied can be classified as lightly to normally over consolidated clay. Chen and Mayne (1996) also proposed empirical methods to estimate the OCR along soil profile. This method was found based on more than 1200 piezocone test and is widely used based on piezocone data as: ' v0 qt v0 OCR C1 ' v0 OCR q u T 1 C2 ' v0 (3-15) (3-16) OCR q u T 2 C3 ' v0 (3-17) Values of constants C1= 0.305, C2 = 0.75, and C3= 0.53 were used in the original proposal of Chen and Mayne (1996). Figure 3-23a shows OCR profile calculated by Chen and Mayne (1996) s equations compared with values obtained by oedometer tests. It is mentioned that data of CPTu01 was used for estimation of the OCR profile. A reasonable agreement with OCR from oedometer tests was obtained by multiplying the above constants by 0.55, thus the following values were used: C1= 0.167, C2= and C3 = According to the tests performed on soft deposit located in Rio de Janeiro city, Baroni and Almeida (2012) were also found that the use of half of the original constants resulted in a proper agreement in OCR estimation. A number of relations were proposed to correlate the S u values according to the OCR profile obtained from data of CPTu tests (Schmertmann, 1978; Lunne et al. 1977; Jamiolkowski et al. 1985). These methods consist simply of estimating S u from piezocone test and in situ effective vertical stress ' v0 ' v0 from the soil profile. Based on Figure 3-23b it can be seen that the ratio of S / starts with values equal to 2.2 in up to 2 m where the OCR values are around 3 (see u Figure 3-23a). The S / values in soft clay I then decrease gradually as a function of OCR u ' v0 with an average value of ' S / equal to 0.5. Bjerrum (1973) showed that the ratio of S / u ' v0 u v0 123
155 changes from 0.25 to 0.3 for normally consolidated clay deposit. However, values greater than 0.3 would be an indication of over-consolidated clay (Jamiolkowski et al. 1985). OCR (-) S u / ' vo (-) C1= 0.15 C2= CPTu01 CPTu02 Depth (m) 4 5 C3= 0.26 Oedometer test Depth (m) 4 5 CPTu (a) 8 (b) Figure (a) OCR along the soil profile, and (b) variations of the S u / ' vo with depth Corrected coefficients of consolidation The coefficient of vertical consolidation (c v ) is typically obtained directly from oedometer tests using relation proposed for one-dimensional consolidation (Terzaghi, 1943): c v Tv. H t 2 d 124 (3-18) Where: T v = time factor related to the degree of vertical consolidation (U v ); t= time required for vertical consolidation; and H d = longest drainage path. The coefficient of vertical consolidation (c v ) can also be estimated using the theoretical method developed by Taylor (1942) through:
156 c v k k v h. c h (3-19) Where: k v and k h = coefficients of vertical and horizontal permeability, respectively; and c h = coefficient of horizontal consolidation obtained from piezocone test. The values of c h obtained from piezocone test are representative of problems involving horizontal flow in the OC (over consolidation) range (Schnaid, 2009). Assessment of the coefficient of horizontal consolidation (c h ) in the NC (normally consolidation) range can be determined from the semi-empirical approach proposed by Jamiolkowski et al. (1985): Cs ch( NC). ch ( piezocone) (3-20) C c The coefficient of horizontal consolidation in NC range (c h(nc) ) was then calculated using Equation 3-20 and C s /C c ratio equal to 0.1 adopted from Figure 3-20a. After conversion of c h to c h(nc), the coefficient of vertical consolidation in vertical flow (c v ) was determined using the horizontal to vertical permeability ratio (Taylor, 1942): c v kv. ch( NC) (3-21) k h The permeability ratio characteristics of the in situ anisotropy of soft clays depends to the over consolidation ratio (Jamiolkowski et al. 1985). According to the OCR profile shown in Figure 3-23a the soft clay is normally to lightly over-consolidated clay and thus a ratio k / k equal to 1.5 is a reasonable value (Almeida and Marques, 2013) for the soft clay studied here. Figure 3-24 shows corrected values of coefficient of horizontal consolidation obtained from piezocone tests. It can be seen that due to C s /C c = 0.1 these values are 10 times less than values presented in Figure Comparisons between the coefficients of vertical consolidation determined from the oedometer tests and piezocone dissipation data also shown in Figure It can be seen that the values of c v obtained from the oedometer tests vary from m 2 /s to m 2 /s and are in good agreement with those values determined from piezocone dissipation tests. h v 125
157 Depth (m) c h(nc) (m 2 /s) 1.00E E E E E c h(nc) = m 2 /s c h(nc) = m 2 /s CPTu01-u1 CPTu01-u2 CPTu02-u1 CPTu02-u2 CPTu03-u1 CPTu03-u2 Figure Corrected coefficient of horizontal consolidation obtained from CPTu tests. Depth (m) 1.00E E E c v (m 2 /s) c v = m 2 /s CPTu01- u1 CPTu01- u2 CPTu02- u1 CPTu02- u2 CPTu03- u1 CPTu03- u2 Oedometer Figure Coefficient of vertical consolidation obtained from oedometer and CPTu tests. 126
158 3.12. Consolidated undrained (CU) triaxial tests CU triaxial test covers the determination of strength and stress-strain relationships of a cylindrical specimen of either an intact, reconstituted or remolded saturated clayey soil. Specimens are consolidated and sheared in compression without drainage at a constant rate of axial deformation (ASTM-D4767). The strength properties ( and c') and undrained strength (S u ) of the clay were determined using both isotropic (CIU) and an-isotropic (CAU) consolidated undrained triaxial tests, respectively. The horizontal effective stress ( ' h0 ) in CAU tests was obtained in proportion to the in situ vertical effective stress ( ' v0 ) through: K. (3-22) h0 0 v0 Where the coefficient of at-rest earth pressure ( K ) was determined by: 0 sin OCR (3-23) K0 (1 sin ). Where both OCR and drained friction angle ( ) of the soil were previously obtained by oedometer consolidation and triaxial CIU tests, respectively. The CAU tests require more time, unusual equipment and procedures, and are often performed by non-commercial laboratories, but they provide additional data to obtain the S u profile. In the present study, six CIU and five CAU tests were performed in which the CIU tests were conducted by two different confining pressures of h =100 kpa and h =200 kpa with average value equal to 150 kpa which reasonably simulated the embankment applied total stress. The confining pressures applied in CAU tests were determined after oedometric consolidation and triaxial CIU tests with range from h =18 kpa to h =40 kpa. The first step of all triaxial CU tests consisted of the consolidation process in which the volumetric strain ( v ) was measured continuously. The consolidation was then carried out until no volumetric strain was observed ( v =0). The second phase was applying the shear stress through undrained conditions until the specimen failed or large axial deformation ( a > 10%) occurred. Using corresponding failure envelope obtained from variations of mean effective stress p'= ( ' v + ' h )/2 against deviator stress q= ( ' v - ' h )/2 resulted in drained fiction of angle ( ) and cohesion (c') of the soft clay (see Annex B). Table 3-11 summarizes the results of triaxial CU tests performed. According to the failure envelopes, the drained friction angle of soft clay varied from = 22.8 o to = 28.6 o and effective cohesion ranged between c'= 0 to c'=5.0 kpa. 127
159 Table Summary of the clay properties obtained from CIU triaxial tests. Specimen depth w n (%) (gr/cm 3 ) n ( o ) c (kpa) Cluster 01 (2.85m- 3.35m) Cluster 01 (5.75m- 6.25m) Cluster 01 (8.15m- 8.65m) Cluster 02 (1.60m- 2.10m) Cluster 03 (4.75m- 5.25m) The undrained strength obtained from the triaxial CAU tests are compared with values obtained from the piezocone and vane shear tests shown in Figure It can be seen that the values obtained from CAU tests are coincident reasonably well with S u profile obtained from piezocone tests as the typical value of S u at the top clay layer is close to 20 kpa, which is expected behavior for soft clay. 1 Undrained strength, S u (kpa) Depth (m) CPT01 CPTu01 CPTu02 CPT02 CPTu03 CPT03 VST01 VST02 VST03 CAU triaxial tests Figure Undrained strength obtained from CAU triaxial tests compared with CPTu and VST tests. 128
160 3.13. Final remarks The Geotechnical site investigation performed in research clusters allowed the proper analysis of all in situ and laboratory tests results, thus a better overall understanding of the geotechnical behavior of soft soil deposit, besides the assessment of the consistency of different test results. More specific results of this chapter included: The lower values of over consolidation stresses comparing with the in situ stresses indicated sample disturbance; SPTs and piezocone tests clearly complement each other. The same can be said about the S u profile, in this case, combining data from vane, piezocone, and CAU tests. The OCR profile obtained from data of piezocone tests was also in good agreement with values obtained from oedometer consolidation tests. The coefficient of consolidation values obtained from oedometer and piezocone tests also complement each other, but oedometer tests are fundamental because they provide compressibility parameter. Table 3-12 summarizes the geotechnical properties of the soft clay deposit obtained by site investigation carried out in the test area. The results of this chapter are used for adequate interpretation of the field measurements as well as numerical modeling of test embankment. Table Geotechnical properties of clay deposit after site investigation performed in each research cluster. Sampling depth Cluster 01 (2.85m- 3.35m) Cluster 01 (5.75m- 6.25m) Cluster 01 (8.15m- 8.65m) Cluster 02 (1.60m- 2.10m) Cluster 03 (4.75m- 5.25m) ' (kn/m 3 ) C c (-) C s (-) e 0 (-) k v (m/s) k h (m/s) c v (m 2 /s) c h (m 2 /s) ( o ) c (kpa)
161 4. Ground Instrumentation and Field Loading Test 4.1. Introduction This chapter summarizes the ground instrumentation carried out in the test area consisting of: specifications of instruments, their operation, installation process, as well as the quantity and position of the instrumentation utilized in the present work. It is then followed by the description of the embankment construction in the test area including specifications of material used, fill placement, and loading stages as explained in the following sections Significance of instrumentation Geotechnical instrumentation provides significant data allowing to evaluate adequately the behaviour of the soil structure in every stage of a project. The main reasons for instrumentation of geotechnical projects are (Slope indicator manual, 2004): Site investigation: Instruments are used to characterize initial site conditions. Common parameters of interest in a site investigation usually include vertical and horizontal deformations, pore-water pressure (e.g., not fully consolidated soft clay deposits), and slope instability. Design verification: Instruments are used to verify design assumptions and to check the performance as predicted. Instrumentation data from the initial phase of a project may reveal the need (or the opportunity) to modify the design in later phases. Construction control: Instruments may be used to monitor the effects of construction. The measured data can help to determine how fast construction can proceed without the risk of failure. Performance: Instruments are used to monitor the in-service performance of a structure. For example, monitoring critical parameters such as excess pore pressure, settlement, and horizontal deformation can provide significant information regarding the in-service performance of an embankment on soft soil deposit. 130
162 Quality control: Instrumentation can be used both to enforce the quality of workmanship on a project and to document that work was done to specifications. Safety: Instruments can provide early warning of impending failures, allowing time for safe evacuation of the area and time to implement remedial action. Safety monitoring requires quick retrieval, processing, and presentation of data so that decisions can be made promptly Application of instruments Each project presents a unique set of critical parameters such as settlement, horizontal deformation, excess pore pressure, and stability which are supposed to be tracked during inservice life of the soil structure. When these parameters are defined, the specification of the instruments should be indicated including the required range, resolution, and precision of measurements. Also, affecting parameters on instruments performance should be considered such as ground conditions, instruments life, instruments quality and environmental effects. The purpose of the ground instrumentation carried out in the present work was to monitor in-service performance of the stabilized ground in terms of settlements, soil horizontal deformations, total vertical stresses, excess pore pressures, and circumferential strain of geotextile encasement. Accordingly, the range, capacity, and model of the needed instruments were selected based on the results of the preliminary finite element analysis. These analyses were performed using typical parameters measured previously (Lima, 2012). The following sections provide general information, operation, and installation process of each instrument used in the present work Monitoring of excess pore pressure The excess pore water pressure needs to be measured in order to: determine the safe rates of embankment construction, predict slopes stability, design and build for lateral earth pressures, design and build for uplift pressures, and monitor the effectiveness of drainage schemes. The instrument used for measurement of pore pressure was Vibrating Wire (VW) piezometer in 131
 piezometer The VW piezometer, model 4500S, used in the present research (manufactured by Geokon) consists of a pressure transducer and signal cable.")

163 which the operation, installation process, advantages, and limitations of VW piezometer used in the present work are described briefly as follows Vibrating wire (VW) piezometer The VW piezometer, model 4500S, used in the present research (manufactured by Geokon) consists of a pressure transducer and signal cable. Readings are obtained with a portable readout or data logger. The transducer is available in 100, 350, 700 kpa, and 1 MPa, 2 MPa ranges. There are two body types, as shown in Figure 4-1. The piezometer shown in Figure 4-1a is the standard body and is suitable for all applications and the piezometer shown in Figure 4-1b is a special push-in design used only in soft clays. Filters for both types have a 50 micron pore-size and are suitable for all applications. The signal cable contains four wires and having a jacket made of polyurethane or polyethylene. (a) (b) Figure 4-1. Typical VW piezometer, (a) standard piezometer; (b) push-in piezometer (Slope indicator manual, 2004). 132
164 The vibrating wire principle states that tension in a wire is proportional to the square of its natural frequency. The piezometer is designed so that pressure on its diaphragm controls the tension of the vibrating wire element inside. When the readout is connected to the signal cable, it sends an electric pulse to a coil that plucks the wire, causing it to vibrate at its natural frequency. A second coil picks up the vibration and returns a frequency reading to the readout. Calibration factors are applied to the reading to obtain units of pressure. This is usually done by the readout or data logger connected to the computer. Compared with another type of the instruments used for pore pressure measurement the advantages and limitations of using VW piezometer are (Slop indicator manual, 2004): Advantages of VW piezometer: Simple grout-in installation procedure makes the possibility of same-hole installation of multiple piezometers or installation of piezometers with inclinometer casing. The VW piezometer provides rapid response in all types of soils. Suitable for unattended monitoring with a data logger. Limitations of VW piezometer: Calibrated component is buried (same as other electrical sensors). Must be protected from electrical transients in locations where lightning is common (same as other electrical sensors). VW sensors require data loggers and readouts with VW interfaces Installation of VW piezometer The VW piezometer was installed in the specified depth of the borehole after which the borehole was filled with a bentonite cement grout. The installation sequences of a VW piezoemeter followed by COPPE experiments which are not so different from AASHTO (1984) recommendation and consisted of: The borehole was drilled below the required depth of the piezometer location and was flushed with water or biodegradable drilling mud (Figure 4-2a). 133
165 The bottom of the drilled borehole was filled with wet sand material (Figure 4-2b). The piezometer was held in a bucket of water, filter side up, and it was shaken to dislodge air between the filter and the diaphragm (Figure 4-2c). The piezometer and tubing were lowered to its specified depth. A weight was inserted on to the piezometer to lower it into a water-filled borehole (Figure 4-2d). The wet sand was placed surrounding the piezometer until at least 150 mm of sand has been placed above the piezometer (Figure 4-2e). The bentonite seal was placed above the intake sand zone, using bentonite chips in order to make a 30 cm thick sealing layer. The casing then was pulled up above the level of bentonite. The bentonite chips were slowly lowered to ensure proper placement of the seal. The drill casing was then pulled upwards to prevent the seal from setting inside the casing (Figure 4-2f). The bentonite seal typically required 2 to 3 hours to set up. The borehole was kept filled with water to fully hydrate the bentonite and to prevent it from drawing water from the surrounding soil. The installation process was terminated by the tubing above the ground level and with connectors clean and dry. The tubing was protected from construction damaging and its location was marked with a stake (Figure 4-2h). 134
 (d)")
 (h)")


166 (a) (b) (c) (d) (e) (f) (g) (h) Figure 4-2. Sequences of VW piezometer installation performed in the test area. 135
167 4.5. Monitoring of soil horizontal deformation Measurements of the soil horizontal deformation provide data to evaluate the stability of slopes and embankment, timing for corrective measurements, and to verify the performance and safety of structures such as retaining walls and embankments. The primary instrument for monitoring lateral movement and subsurface deformations is the inclinometer. There are two types of inclinometer systems: the dedicated, in-place sensor system, and the portable, traveling probe system, which the later is much more used Inclinometer components Similar to other COPPE s research works, over 40 M.Sc. and Ph.D. theses, the portable inclinometer was used in the present work to measure the profile of the soil horizontal deformations under embankment loading (e.g. Moreira, 1974; Ortigao, 1980; Coutinho, 1986; Oliveira, 1999; Magnani, 2006). The inclinometer casing used in the present work was an aluminum grooved tube, 76 mm in diameter, installed in a borehole passing through the soft clay layers. The casing provided access to the inclinometer probe traveling, allowing it to obtain subsurface measurements. Grooves inside the casing controlled the orientation of the probe and provide a surface from which repeatable measurements can be obtained (Figure 4-3a). COPPE s traveling probe system shown in Figure 4-3b consisted of a portable wheeled probe, graduated control cable, and a portable readout. With this system, it was possible to make a survey of the borehole, taking tilt readings at 0.5 m intervals, from the bottom to the top of the casing to the top. The probe was then rotated 180 degrees and a second survey was obtained. The resulting data provided a detailed profile of the casing. 136


168 (a) (b) Figure 4-3. (a) Grooved inclinometer casing and (b) traveling probe and readout unit Installation of inclinometer casing Depending on the scope of monitoring, the inclinometer casing can be installed vertically or horizontally. The following instructions explain the sequences for vertical installation of inclinometer casing according to the COPPE experiments which are similar to AASHTO (1978): 137
169 The borehole was drilled to the depth specified. It is mentioned that a larger diameter borehole is required if it is planned to tremie the grout and a smaller borehole is possible if it is planned to use a grout valve (Figure 4-4a). The casing tubes were coupled together to obtain the desired length of the inclinometer casing. The coupling was performed by riveting the end of casings and using jointers. A secure sealing was also performed by silicon glue to cover properly the riveted points along the jointers (Figure 4-4b). The depth of the borehole was verified and then the casing was installed to the specified depth. It was important to maintain the alignment of one set of grooves with the expected direction of movement throughout the installation process (Figure 4-4c). When the assembled casing reached the proper depth, the probe traveling was verified with a dummy probe (Figure 4-4d). The grouting was prepared and then filled up to the level specified. Drill casing or hollow stem augers were withdrawn without rotation as the grout was placed. The grouting was continued until the surface of the grout was ground level (Figure 4-4e and Figure 4-4f). Finally, the drill casing or hollow stem auger sections were removed. The proper probe tracking was checked again using the dummy probe. As in the previous check, if the probe does not go all the way down, the casing must be replaced (Figure 4-4g and Figure 4-4h). The installation was terminated as specified and the casing was protected against construction damaging. 138
 (d)")
 (h)")


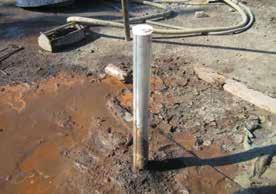
170 (a) (b) (c) (d) (e) (f) (g) (h) Figure 4-4. Sequences of inclinometer installation performed in test area. 139


171 4.6. Monitoring of vertical deformation Measurements of vertical deformation help to verify that soil consolidation is processing as predicted, to estimate and adjust the final elevation of an embankment, to verify the performance of foundation, and to determine the timing of corrective measures. Monitoring of the vertical deformation in embankment construction on soft soil is essential to determine the progress of consolidation rate due to stage construction and to verify the stability of the soft foundation. In the present work the monitoring of the vertical deformation also aimed to verify the differential settlements between points just above the columns and points between the columns, with sensors above the surrounding soil. Single point instruments provide information needed to calculate the movement of a single point. These devices include settlement sensor, settlement points or singlepoint extensometers, and settlement extensometer. The specification and installation processes of the settlement sensor used in the present work are described in the following sections Vibrating wire (VW) settlement sensor The VW settlement sensors, model 4600, (manufactured by Geokon) were used to monitor a single point, subsurface settlement. Components include a reservoir (Figure 4-5a), tubing that is filled with water, and the settlement sensor, which is a specially packaged VW or pneumatic pressure transducer (Figure 4-5b). (a) (b) Figure 4-5. (a) Typical reservoir box and (b) a settlement sensor used in this research. 140
 before an embankment or fill is constructed (Figure 4-6).")
172 The reservoir is positioned on the stable ground, at a higher elevation than the sensor. The sensor is typically installed at the original ground surface (above the soil and/or column) before an embankment or fill is constructed (Figure 4-6). The water-filled tubing runs from the reservoir down to the sensor. The sensor measures the pressure created by the column of liquid in the tubing. As the transducer settles with the surrounding ground, the height of the column increases, and the transducer measures higher pressure. The linear measure of settlement or heave is calculated by converting the change in pressure to millimeters or inches head of water. The advantages and limitations of settlement sensors are listed below (Slope indicator manual, 2004): The reservoir can be located outside the active construction area. Once installed, the sensor and tubing are unlikely to be damaged by construction activities. Does not necessarily require borehole when placed inside in a fill. Changes in temperature affect the density of the liquid in the tubing and the pressure reported by the sensor. Temperature effects can be reduced by minimizing the length of tubing above the surface and by shading the reservoir. Figure 4-6. Typical operation of settlement sensor and reservoir (Slope indicator manual, 2004) Installation of settlement sensors The reservoir was placed on the stable ground at a higher elevation than the settlement sensor and was also protected from extremes of temperature. The tubing and its connections to 141


173 the reservoir were buried below the ground surface to prevent against environmental damaging. Tubing was placed in a trench and then buried in the sand. Some extra tubing was also required for vertical runs to accommodate settlement. The installation of the settlement sensors was performed as follows: A trench was excavated from the intended location of the transducer to reading station (on the stable ground). The bottom of the trench was filled with 100 mm layer of fine sand and then the pneumatic settlement sensor was placed in a vertical orientation. The trench was filled with wet sand and then the settlement sensor was connected to the reservoir to check the connection. The tubing was covered with 100 mm layer of fine sand and the remainder of the trench was filled with selected fill material. Figure 4-7 shows the installation process of the settlement sensor adopted in the present work. (a) (b) Figure 4-7. (a) Connection of settlement sensor to reservoir and (b) filling the trench after tubing buried Monitoring of column diameter deformation Monitoring of diameter deformation in encased granular column allows determining the magnitude of the bulging occurred in columns and corresponding circumferential (or hoop) tensile force in geosynthetic encasement. The magnitude and location of the column bulging are critical parameter to verify any possible column failure due to excessive bulgging that may occur 142


174 during serviceability period. Measurement of the column diameter deformation was performed using assembled VW crackmeter, model 4420, (manufactured by Geokon). The crackmeter shown in Figure 4-8 is often used to measure the movement across surface cracks in structural parts as piles, slabs, and beams. The instrument consists of a vibrating wire sensing element in series with a heat treated stress relieved spring which is connected to the wire at one end a connecting rod at the other. As the connecting rod is pulled out from the gage body, the spring is elongated causing an increase in tension which is sensed by the vibrating wire element. The tension in the wire is directly proportional to the extension; hence, the diameter deformation can be determined very accurately by measuring the strain change with the vibrating wire data logger. Figure 4-8. Extensometer used to measure column diameter deformation. 143
175 Assembling of column diameter extensometer As mentioned previously, the company manufactured crackmeter is used to measure the movement across the cracks and joints in concrete or steel elements. Hence, accurate adaptation was needed to make it possible to be used as diameter extensometer attached to the geosynthetic encasement. The assembling process of crackmeter included cutting its ends, inserting prolonger rods, and also providing suitable protection against environmental damages as described below: The manufactured crackmeter was 39 cm in length; however the diameter of the encased columns was 78 cm. Thus, the crackmeter was not long enough to fit the column diameter. Therefore, both ends of crackmeter were cut and additional prolonger rods were inserted in both ends (Figure 4-9a). The material and dimensions (bar diameter, thickness, etc) of the prolongers were chosen as same as the original crackmeter. The jointer and connective pieces were manufactured using turnery machinery to achieve high accuracy (Figure 4-9b). In order to provide a proper connection between the extensometer and the geosynthetic encasement, two circular polypropylene plates were attached at the ends. The diameter and thickness of the plates were 8 cm and 1 cm, respectively (Figure 4-9c). These plates let the extensometer be connected adequately to the internal surface of the geosynthetic encasement and thus the radial expansion was measured by changing in the length of the extensometer. A strong PVC casing was used to protect extensometer components against damages caused during the installation process, by column gravel aggregate, and water level which might damage the spring sensors. The PVC casing was 25 mm in diameter and its length was the same as the extensometer rod to provide full coverage (Figure 4-9d). 144


.")
176 (a) (b) (c) (d) Figure 4-9. Assembling process of diameter extensometers Installation of column diameter extensometer The diameter extensometers were attached to the geosynthetic encasement at a depth of 1 m below column top. According to previous researches (Hughes and Withers, 1974; Murugesan and Rajagopal, 2007) the maximum bulging expected to occur at the depth equal the column diameter. Also, because the columns were compacted it was very difficult to install the extensometer at greater depths. The installation process consisted of following steps: The column material was excavated to reach the desired installation depth. The stone aggregate was removed with care to avoid bringing damage on the geosyntetic encasement (Figure 4-10a). The extensometer was attached to the geosynthetic encasement. The process was performed by screwing the end plates to the internal sleeve of the geosynthetic (Figures 4-10b and 4-10c). The extensometer was connected to the data logger unit and the measurements were verified. 145

. (a) (b) (c) (d) Figure 4-10.")


177 The column was filled up again with the crushed stone aggregate and compacted manually to reach approximately the same density induced by the vibrating equipments. The process was done carefully to avoid damaging on cable and connection between extensometer and geosynthetic (Figure 4-10d). (a) (b) (c) (d) Figure Installation process of radial extensometer to geosynthetic encasement Monitoring of total vertical stress Measuring of the total vertical stress is quite important as it provides the magnitude of the total stresses applied on the earthworks such as bridge abutments, diaphragm walls, fills, and embankments. It may also help to measure earth bearing stress on foundations slabs, footing and the tip of the piles. The common instrument used for measuring the total vertical stress is the stress cell. Several successful COPPE s research works used the total stress cell to measure the 146

178 total vertical stress applied by the earth embankment (e.g. Ribas, 1980; Soares, 1981; and recently Roza, 2012). The components and specification of the total stress cell used in the present research are described below Vibrating wire (VW) total stress cell The VW total stress cell, model 4800 (manufactured by Geokon) is constructed from two stainless steel plates welded together around the periphery so as to leave a narrow space between them. The space is completely filled with hydraulic oil that is connected hydraulically to a pressure transducer converted to an electrical signal which is transmitted through a signal cable to the readout unit. Since the purpose of using total stress cell in this work was to measure the total vertical stresses shared between the soft clay and encased column, the stress cells were placed vertically and directly above the specified locations (Figure 4-11). The main point that should be considered is that the cable and tubing should be covered by 10 cm fine sand layer to avoid damaging during field work. Figure Stress cell placed on top of an encased column Instruments utilized In the present work the soft soil and the encased columns were instrumented separately for vertical displacement (using surface settlement sensors above the column and surrounding soil), horizontal deformation (using inclinometer), pore water pressure (using vibrating wire 147
179 piezometer), vertical stresses (using total stress cell) and geotextile expansion (using diameter extensometer). According to the COPPE experiments, the instruments calibration was not necessary, but the constants provided by the company were verified before field installation. The instrumentation was concentrated at the centerline of the embankment where the maximum vertical stress is applied. The location and installation depth of the instruments used are described below as well as in Figure 4-12: Three surface settlement sensors; two placed on top of the surrounding soil (S1, S2) and one on top of an encased column (S3) to measure the total and differential settlement; Three piezometers installed in the soft soil at the following depths: 3 m (PZ1), 6 m (PZ2) and 8m (PZ3), all installed at midway between two columns near the centerline of the embankment; Four total stress cells to assess soil arching and measure the transmitted embankment stresses to the surrounding soil (CP1; CP3) and to the encased columns (CP2; CP4). Three diameter extensometers (EX) attached to the geotextile encasement at a depth of about 1 m below the column top to measure the hoop strain. This depth was selected because, according to the tests performed by Hughes and Withers (1974), maximum column bulging should be expected to occur at a depth of about 1.5 times the diameter for un-encased stone columns. Two inclinometers (IN) installed at the embankment toes to measure distribution and magnitude of horizontal deformation of the soil beneath the embankment. The installation process included inserting a 76 mm diameter of aluminum casing into a drilled hole following instructions described earlier. 16 channel data logger used for data storage and collection. Table 4-1 also summarizes the quantity and location of instrumentation used in this research. The actual pattern of the encased granular columns installed in the test area is shown in Figure It can be seen that the columns are installed in an irregular square pattern with center-tocenter space ranging between 1.75 to 2.25 m. However, the central area of the test embankment is less irregular with an average spacing of 2.0 m between the columns. 148
180 20 m 8.0 m 4.0 m 8.0 m +5.3 m +4.3 m IN Geogrid (J= 2000 kn/m) IN m +1.5 m +0.0 m GWT -1.2 m EX -1 m PZ1-3m GEC Sand working platform Soft clay I PZ2-6m Settlement sensor (S) Piezometer (PZ) Sand lens Soft clay II PZ3-8m Stress sensor (CP) Extensometer (EX) Dense sand 36 (6x6) GECs CP4 CP m S2 CP1 S3 S1 CP m Figure Embankment side view, columns arrangement, and instrumentation layout (no scaling). 149
181 Table 4-1. Summary of the instrumentation used in the present work. Type of instruments Quantity Location of instruments Purpose Total stress cell (CP) 4 CP1 and CP3 placed on surrounding soft soil; CP2 and CP4 placed on encased column. Measure the vertical stresses on top of the encased column and surrounding soft soil. Piezometer (PZ) 3 Installed in 3 m (PZ1), 6 m (PZ2), and 8 m (PZ3) below ground surface in soft clay layer. Measure pore pressure dissipation and consolidation process. Settlement sensor (S) 3 Measure the total and S1 and S2 placed on top of surrounding soil, differential settlement below and S3 placed on top of the encased column. the embankment. Diameter EX1, EX2 and EX3, installed to geosynthetic Measure column bulging and 3 extensometer (EX) encasement at 1 m below column top. hoop force. Measure the horizontal Inclinometer (IN) 2 IN1 and IN2, installed at embankment toes. deformation beneath the embankment toes. Data logger 1 16 channel, model Data storage and collection. LAB-III multi-stage Protection against electrical 13 Model LE-B surge protection discharge for each instrument Field loading test Embankment construction was performed in the test area located inside of the stockyard of ThyssenKrupp Company, in Rio de Janeiro, Brazil. As mentioned earlier in chapter 3, geotextileencased granular columns were found to be the optimum solution to control stability and to reduce settlement and horizontal displacements in some area of the stockyard soft foundation (Alexiew and Moormann 2009). In order to assess the performance of the composite ground in the stockyard foundation and also to provide significant information for the later use of GECs, TKCSA Company decided to perform a field loading study in the test area where thirty-six encased columns (6 6 square mesh) had been installed in Considering that this site investigation was carried out in 2012, and column installation occurred in 2008, thus the soil parameters obtained post-column installation are quite representative as they were not affected by the column installation. As shown in Figure 4-12 the pattern of columns mesh exhibits some 150
182 irregularities regarding spacing between the column s axis. However, in the central area of the test embankment this is more regular, thus not bringing impairment for axi-symmetric numerical analysis and field interpretation, either Granular columns and geosynthetic materials The material used for the granular column was crushed stone aggregate with the size ranging from 10 to 35 mm. The granular columns were installed using displacement method and densified by the vibratory hammer. The columns installation was performed in 2008, but the loading test was done in 2012; thus the overall stress equilibrium between the columns and surrounding soil had been already reached. The elastic modulus and friction angle of the column material were not measured in the present study, but based on the numerical and experimental investigations carried out on geosynthetic encased granular columns, the typical elastic modulus and friction angle used for the encased column material are estimated to be around 80 MPa and 40 degrees, respectively as shown in Table 4-2. Also, according to FHWA (1983) the friction angle and elastic modulus used for the granular column range between 38 to 50 degrees and 60 to 80 MPa, respectively. Table 4-2. Elastic modulus and friction angle of the encased column material derived from previous researches. E (MPa) Application Reference Experimental Ayadat and Hanna (2005) Numerical and experimental Murugesan and Rajagopal (2006) Numerical Khabbazian et al. (2010) Numerical Lo et al. (2010) Numerical Keykhosropur et al. (2012) Experimental Yoo and Lee (2012) Numerical Hosseinpour et al. (2013) Numerical Ghazavi and Afshar (2013) The encased granular columns were 78 cm in diameter, 11 m in length, encased by seamless woven geotextile (Ringtrac 100/250). The columns in the central area of the test embankment were implemented in an average 2 m center-to-center spacing resulting in an area replacement 151
183 ratio of a c = The mechanical properties of the geotextile casing are presented in Table 4-3. The axial tensile force-strain curve of the geotextile encasement is also shown in Figure Table 4-3. Mechanical properties of the geotextile encasement (provided by Huesker). * Allowable ring tensile force after application of safety factors. Property Ring tensile force (at 5% st rain) Opening size Value 95 * kn/m < 0.20 mm Mass per unit area 465 gr/m 2 Cross-plane flow rate Ring tensile modulus (at 5% strain) 5 L/m 2 s 1750 kn/m Axial force (kn/m) Strain (%) Figure Axial force-strain curve of the geotextile encasement (Provided by Huesker) Basal reinforcement A biaxial horizontal geogrid (Fortrac, J= 2200 kn/m) was placed below the embankment just to follow EBGEO (2010) s overall recommendations to use basal reinforcement under circumstances of high embankment loads. Indeed, Alexiew et al. (2012) recommend that for the stiffness ratio over 75 (the ratio of stiffness between the granular material of encased column and 152

184 soft soil) design of the horizontal geosynthteic reinforcement is necessary while the stiffness ratio of the present study was around 85. Based on the Table 3-10, the average oedometer modulus of the soft clay I is equal to 940 kpa. Therefore, assuming stiffness of the column material equal to 80 MPa yields a stiffness ratio of around 85. As the basal geogrid was not instrumented thus its contribution on settlement and horizontal displacement was not discussed either. However, in these circumstances of the relatively thick working platform, the basal geogrid has negligible influence. This has been clearly illustrated by two well instrumented reinforced embankments (Magnani et al. 2010), in which for failure conditions, the reinforcement was responsible for no more than 3% of the mobilized factor of safety (F s ); whereas the working platform was responsible for at least 56% of the mobilized F s Fill material and embankment construction The fill material was fine grain sinter feed obtained from ore and coke enrichment process (Figure 4-14). The sinter feed material, classified as SW based on USCS (unified soil classification system), had drained angle of shear strength equal to 38 o, determined by direct shear tests (see Annex B), and in situ apparent density around 28 kn/m 3. Figure Sinter feed material used as embankment fill. 153

185 The construction of 5.35 m high embankment applied almost 150 kpa total vertical stress, thus simulating realistic total vertical stress applied at the stockyard (Lima, 2012). Figure 4-15 and Figure 4-16 show the overview of the stabilized test area and the top of an installed encased column, respectively. The embankment construction was performed in four stages, during 65 days, with consolidation intervals between the loading stages aiming to monitor the timedependent performance of the instrumented ground. The fill material was placed randomly and in non-compacted layers to follow exactly the actual construction process in the stockyard foundation. The density of the embankment fill was determined by in situ density tests performed after the layer was placed following procedures described in NBR-7185 (1986). According to the test performed, the average apparent unit weight of the fill material and the natural water content were 27.8 kn/m 3 and 6.6%, respectively as shown in Table 4-4 as well as the construction and consolidation duration of each loading stage. The following sections describe the sequences of the test embankment construction with details. Figure Overview of the test area with GECs installed. 154
 Consolidation period (days) In situ unit weight, n (kn/m 3 ) Natural humidity, w n (%) 1 3 10 27.7 6.9 2 2 32 28.3 6.5 3 2 14 27.9 6.3 4 2 180 27.1 6.")
186 Figure Top view of an encased granular column (after ground scrape). Table 4-4. Loading duration, in situ density, and natural humidity of fill material at each loading stage. Loading stage Loading duration (days) Consolidation period (days) In situ unit weight, n (kn/m 3 ) Natural humidity, w n (%)
. Figure 4-17.")
187 Loading stage 1: the fill material was placed up to 1.5 m from the ground surface within 3 days. The inclinometer reading was performed just after the loading was completed. This layer was left in place for 10 days and the inclinometers reading were carried out three times a week (Figure 4-17). Figure First loading stage of test embankment construction performed in test area. 156


188 Loading stage 2: the embankment was built up to 3 m in within 2 days by placing 1.5 m high of fill material in this loading stage. Inclinometer reading was performed before and just after loading. The embankment was left in place for 32 days and inclinometer reading was carried out two times a week (Figure 4-18). Figure Second loading stage of test embankment construction performed in test area. 157
189 Loading stage 3: the loading was carried out by placing 1.3 m high of fill material within 2 days. The inclinometer reading was carried out before and upon loading was completed. The embankment was left in place for 14 days and readings were carried out (Figure 4-19). Figure Third loading stage of test embankment construction performed in test area. 158

. The inclinometer readings were carried out once a week. Figure 4-20.")
190 Loading stage 4: the embankment reached the final height by placing 1.0 m high of fill material in 2 days. Similar to other loading stages, inclinometer loading was carried out before and upon the loading was performed. The embankment was left in place for 180 days in which time around 80% of excess pore pressure had already been dissipated (Figure 4-20). The inclinometer readings were carried out once a week. Figure Fourth loading stage of test embankment construction performed in test area. 159
191 5. Results and Discussion of Field Measurements 5.1. Introduction The performance of the test embankment is discussed in the present chapter by analyzing the instrumentation results. The test embankment applied a total vertical stress around 150 kpa on the soft deposit improved by geotextile encased granular columns (GECs) built if four stages during 65 days. The test embankment was left in place for six months and the measurements were carried out during post-construction thus allowing monitoring time-dependent behaviour of the composite ground. The variables, which are discussed in this chapter include: total and differential surface settlements; soil horizontal deformation; maximum soil distortion; excess pore pressures; total vertical stresses below the embankment; column diameter deformation (geotextile expansion); and ring tensile force mobilized in the geotextile encasement. Furthermore, in order to evaluate the effectiveness of the geosynthetic encased granular columns as a soft ground treatment technique; the results obtained from the present work are compared with the data provided from a reinforced test embankment TE1, (Magnani, 2006, Magnani et al. 2009, 2010) built on a soft deposit treated with the prefabricated vertical drains. The main features of the two test embankments are presented in Table 5-1. Table 5-1. Main features of the TE1 compared with the present work. (*): to be shown in chapter 6. Features Present work TE1 (Magnani, 2006) Clay thickness with ground treatment (m) Thickness of the working platform (m) Ground treatment technique encased granular column reinforcement+ vertical drains Modulus of the basal reinforcement (kn/m) Maximum embankment height (m) Maximum applied stress (kpa) Construction period (days) Final factor of safety 1.85 (*)
192 The test embankment TE1 was constructed in 2002 on 8.0 m thick soft clay deposit underlying a top sand layer located in Florianopolis, southern Brazil. The geotechnical properties of the soft clay were approximately similar to the present work particularly in terms undrained strength, coefficient of consolidation, saturated unit weight, and plasticity index. The soft clay under the test embankment TE1 was normally consolidated clay owing to 2.0 m thick hydraulic fill working platform constructed six years before the construction of the test embankment. The test embankment TE1 was almost 5.0 m in height, applying 65 kpa total vertical stress, which was built in 12 loading stages within 60 days and then was taken to the failure. The TE1 was well instrumented with the vertical and horizontal deformations as well as excess pore pressure, thus made it possible to be compared with the present research. Table 5-2 compares the main geotechnical characteristics of the soft clay beneath the TE1 with the present work. The relevant measurements for comparison were settlement, soil horizontal deformation, and soil distortion, which are discussed in the following sections. Table 5-2. Geotechnical properties for the soft clay of TE1 compared with the present work. Properties Present work TE1 (Magnani, 2006) Natural water content, w n (%) Plasticity index, w P (%) Submerged unit weight, ' (kn/m 3 ) Voids ratio, e (-) Compression ratio, CR (-) Coefficient of the vertical consolidation, c v (m 2 /s) Clay sensitivity, S t (-) Undrained strength, S u (kpa) Over consolidation ratio, OCR (-)
193 5.2. Measurements by settlement sensors In the present work, the total surface settlements were measured by the settlement sensors S1 and S2 placed on the top of the surrounding soft soil and settlement sensor S3 on the top of the encased granular column as shown in Figure The results for the both total and differential settlements below the embankment are discussed below. The measured data obtained from the present study is also compared with those from the test embankment TE1 (Magnani, 2006) Total surface settlement Figure 5-1 shows the measured surface settlements ( v ) at the top of the encased column (measured by settlement sensor S3) and the surrounding soft soil (measured by settlement sensors S1 and S2). It can be seen that the settlements increased in the construction stages when embankment height increased and also within post-construction period, when excess pore pressure was dissipated. As expected, the maximum settlement occurred on surrounding soil, i.e. at the midpoint between the encased columns. For example, at the end of construction (i.e. 65 days), the maximum settlements were 258 mm and 318 mm at the top of the encased column (measured by S3) and on the soft soil surface (measured by S1; S2), respectively. Compared with the settlement observed at the end of monitoring time, around 65% of the settlement occurred during the embankment construction for both the column and the surrounding soft soil. Both settlement sensors placed on top of the surrounding soil (i.e. S1 and S2) showed quite similar behaviour during construction stages; but the settlement measured by S2 was about 2% greater than the settlement measured by S1 at the end of monitoring time. The reason may be due to location of the settlement sensors shown in Figure Based on Figure 4-12 it is seen that the settlement sensor S2 was placed in diagonal half span between the columns where a greater settlement is expected to occur comparing with the settlement sensor S1 located in the half of center-to-center spacing between the columns. 162
194 Applied vertical stress (kpa) Settlement, v (mm) End of construction (t= 65 days) Time (day) Encased column, S3 Soft soil, S1 Soft soil, S2 Figure 5-1. Variation of the total surface settlements versus time. The variation of the total surface settlement (top of the working platform) plotted against corresponding applied vertical stress is shown in Figure 5-2 together with the test embankment TE1. For the present study, an average value measured by the settlement sensors S1 and S2 was used to plot the settlement for the surrounding soft soil. As expected, the settlement increased sharply just after each layer was placed. For example, just before starting second loading stage (i.e. v = 42 kpa) the maximum settlement measured below the embankment was 70 mm, however these value increased to 110 mm just after loading stage 2 was performed (i.e. v = 84 kpa). A polynomial function was used to correlate the settlement measured below the embankment with the corresponding total applied stress as shown in Figure 5-2. A direct comparison between the present work and TE1 study indicates that the geosynthetic encased granular columns caused the settlement below the embankment to reduce substantially. For instance, at the total applied stress level equal to 60 kpa the settlement for TE1 was around 400 mm, however GECs caused the settlement to reduce to 100 mm resulting in a settlement improvement factor around 4, assuming that the soft clay deposits are very similar. It can be also seen that GECs increased significantly the load carrying capacity of the composite 163
195 (improved) ground. For instance, at settlement of 300 mm the TE1 could carry about 55 kpa total vertical stress, but at the same settlement level the GECs carried 120 kpa around 2.2 times of the soft deposit treated just with prefabricated drains. This fact provides an example of ground improvement benefits regarding the bearing performance of the soft foundation Total applied stress, v (kpa) TE1 (Magnani, 2006) Present work Poly. Adjust (Present (present work) Settlement, v (mm) Figure 5-2. Influence of GECs on the settlement below the embankment centerline Differential settlement The differential settlement between the top of the column and the soft soil, obtained from the present study, is normalized with the span definition proposed for the piled embankment (McGuire et al. 2012): vs vc DS (5-1) s Where:, = settlement measured on top of the surrounding soil and encased column, vc vs respectively; and s = the diagonal half span between the columns. The variation of the differential settlement at the embankment base plotted against time is shown in Figure 5-3. Similar to the total surface settlement, the normalized differential settlement increased with 164
196 increase of the embankment height. For instance, the normalized differential settlement was about 1.8% after the first loading stage (i.e. two days) but it increased to 4.6% after the embankment was completed (i.e. 65 days). Numerical studies performed by Almeida et al. (2013) also showed that the differential settlement increases with the embankment height. Differential settlement also increased after embankment construction as consolidation progressed. Figure 5-3 shows that for the present study, about 87% of the final differential settlement occurred during construction and 12% of the differential settlement occurred during post-construction. Applied vertical stress (kpa) Time (day) End of construction (t= 65 days) DS (%) Figure 5-3. Variation of the normalized differential settlement versus time Measurements by inclinometers The variations of the soil horizontal deformations were investigated by the inclinometers installed at the embankment toes in two different positions. Profile of the soil horizontal deformation, maximum horizontal deformation, maximum distortion, and the correlation between measurements are discussed in this section. 165
197 Profile of the soil horizontal deformation Profile of the soil horizontal displacements ( h ) below the embankment toes were directly obtained from the inclinometers IN1 and IN2 during both construction and consolidating stages. Figure 5-4 shows distribution of the soil horizontal displacements just after each loading stage was performed. As expected the maximum horizontal displacement increased when embankment height increased. For instance, results measured by inclinometer IN2 indicated that the horizontal displacement increased from 14 mm, measured after loading stage 1, to 108 mm just after embankment was completed. It is also seen that the maximum soil horizontal displacement accrued at the middle of soft clay I confirmed by both Inclinometers. The low oedometer modulus of the sample collected in the middle of the soft clay I (i.e. z= m) can be the reason of maximum lateral displacement occurring in this depth, associated with the increase in vertical stress due to embankment loading at this depth. The smaller horizontal displacements occurred in the upper 2 m, indicating the higher stiffness of the working platform (sand) rather soft clay. Figure 5-5 shows the profile of the soil horizontal displacement measured during postconstruction when the embankment was completed. In is mentioned that the last two readings of horizontal deformation (i.e. days 208 and 238) measured by IN2 were determined to be not reliable and, therefore, are not presented here. Based on Figure 5-5 it can be seen that the horizontal displacements increased during consolidation as excess pore pressure was dissipated and effective horizontal stress increasing. The maximum values ( h,max ) at the end of monitoring time were 136 mm and 158 mm measured by inclinometers IN1 and IN2, respectively. Compared with Figure 5-4, there was a horizontal displacement occurred in working platform layer which increased during consolidation and reached to 50 mm (measured by IN1) at the end of monitoring time. 166
198 Soil horizontal displacement, h (mm) Working platform Soil horizontal displacement h (mm) Working platform 2 IN 1 2 IN Depth (mm) 6 Soft clay I Depth (m) 6 Soft clay I 8 8 Loading stage 1 Loading stage 1 10 Loading stage 2 10 Loading stage 2 Loading stage 3 Loading stage 3 Loading stage 4 Loading stage 4 12 Figure 5-4. Profile of soil horizontal displacement measured just after loading stages
199 Soil horizontal displacement, h (mm) Working platform Soil horizontal displacement, h (mm) Working platform 2 IN 1 IN Soft clay I 4 Soft clay I Depth (m) 6 Depth (m) th day 71th day 85th day 8 66th day 71th day th day 155th day 10 85th day 114th day 208th day 155th day th day 12 Figure 5-5. Profile of soil horizontal displacement measured during post construction (after embankment completion). 168
200 Maximum soil horizontal displacement Figure 5-6 shows the variation of the maximum soil horizontal deformation ( h,max ) plotted against time. It is observed that the maximum soil horizontal displacement increased at a higher rate during construction (i.e. about 1.5 mm in day), but at a slower rate during construction intervals as well as post-construction (i.e. about 0.15 mm in day), a feature also observed by comparing construction (Figure 5-4) and post-construction (Figure 5-5) measurements. It can be seen in Figure 5-6 that over 70% of the maximum horizontal displacement (i.e. measured at the end of monitoring time) occurred during embankment construction. However, less than 30% of the maximum horizontal displacement was completed during post-construction. It is also observed that the rate of the increase in maximum horizontal displacement was higher at initials days just after the loading was performed. This is because the quasi undrained conditions was yet dominant in initial post-construction days and thus the larger lateral deformations are expected compared with drained conditions. But the maximum horizontal displacement increased at a slower rate when the excess pore pressure was being dissipated resulting from the gain in clay strength. Maximum horizontal displacement, h,max (mm) End of construction (t= 65 days) Measured by IN1 Measured by IN Time (day) Figure 5-6. Variation of the maximum soil horizontal deformation versus time 169
201 Maximum soil horizontal displacement ( h,max ) occurring at the middle of soft clay I is compared with the total applied stress shown in Figure 5-7. It is clearly seen that the maximum horizontal displacement increased rapidly upon placement of each layer as measured by both inclinometers. For instance, the average value of maximum horizontal deformation just before second loading stage was 40 mm. However this value increased to around 70 mm just after the second layer was placed. A polynomial function was also used to represent the maximum soil horizontal deformation with the corresponding total applied stress as shown in the legend of Figure y = x x Total applied stress, v (kpa) Measured by IN1 Measured by IN2 Adjust Poly. (Measured (measured by IN1) Adjust Poly. (Measured (measured by IN2) Maximum horizontal displacement, h,max (mm) Figure 5-7. Variation of the maximum soil horizontal displacement versus total applied stress. In order to investigate the effectiveness of the geosynthetic encased granular columns in controlling the maximum horizontal displacement of foundation, values measured in the present study and in test embankment TE1 are plotted against corresponding applied vertical stress. These results are compared in Figure 5-8 and it is clearly seen that the geosynthetic encased granular columns (present study) reduced significantly the maximum horizontal displacement of the soft clay foundation. For example, at the vertical stress level of 60 kpa the maximum soil 170
202 horizontal displacement for the TE1 was 400 mm, over 10 times of the maximum horizontal displacement measured in the present study. It may also be seen that the soft clay beneath the TE1 tend to fail at the vertical stress level of 60 kpa, as also reported by Magnani (2006). But stabilized soft clay (i.e. present study) did not demonstrate any continuous increasing of maximum horizontal displacement at the end of monitoring time, while the total applied stress was around 2.5 times greater than the TE1. Thus, it can be concluded that the use of geosynthetic encased granular columns notably enhance the embankment stability against the failure occurring due to large horizontal displacement of the soft foundation Total applied stress, v (kpa) Present study TE1 Magnani (Magnani, (2006) 2006) Adjust Poly. (Present (present study) work) Maximum horizontal displacement, h,max (mm) Figure 5-8. Influence of GECs on the maximum soil horizontal displacement Prediction of the maximum horizontal displacement Maximum horizontal displacement of the foundation soil ( h,max ) are correlated with the maximum settlements ( v,max ) measured at the centerline of the test embankment. Figure 5-9 shows variation of the maximum soil horizontal displacement (measured by both inclinometers) versus maximum settlement at the embankment centerline (measured between the columns 171
203 diagonally) during the construction and consolidation stages. It is common (e.g. Tavenas et al. 1979) to analyze the ratio between these two measurements through: DR v h,max,max (5-2) From Figure 5-9 it can be seen that the horizontal displacement increases about linearly with settlement resulting in a slope (DR) varying from 0.16 to From the analyses of fifteen embankments built on soft deposits without ground improvement, Tavenas et al. (1979) reported average DR ratios equal to 0.91 at yield conditions during construction and equal to 0.16 during consolidation. Therefore, it can be concluded that GECs resulted in roughly uniform DR values during the construction and consolidation stages, unlike conventional embankments on nonimproved foundations. The results are also compared with the reinforced test embankment TE1. A direct comparison shows that the use of GECs caused the maximum horizontal deformation increased with slower DR ratio compared with the TE1 resulting the DR ratio of about 4 times less than the TE1 during post-construction. Maximum horizontal displacement, h,max (mm) h,max v,max DR= 0.83 Measured by IN1 Measured by IN2 DR= 0.20 TE1 (Magnani, 2006) DR= Maximum settlement, v,max (mm) Figure 5-9. Measured relation between maximum settlement under the center of embankment and maximum horizontal displacement beneath embankment toes. 172
204 Soil distortion The vertical distortion, defined by the increment in the horizontal displacement h divided by the distance between the measured points z (here equal to 0.5 m) has shown to provide further insight into overall field test performance, as described in the following sections. Figure 5-10 shows the variations of the distortion along the soil profile obtained during postconstruction. It is seen that both curves of horizontal displacement ( h ) and distortion ( v ) maintained their shape as the consolidation progressed, which is in accordance with the experimental observation for conventional embankments (Tavenas et al. 1979). Based on Figure 5-10, it can be seen that the maximum vertical distortion ( v,max ) occurred in soft clay I and increased with consolidation. The depth of the maximum distortion is the depth of the potential failure surface, and it was found to constant in the present work, as well as for Magnani et al. (2009). Vertical distortion, v (%) th day 71th day 2 85th day 114th day 3 155th day 208th day 4 238th day Vertical distortion, v (%) th day 2 71th day 85th day 3 114th day 155th day 4 208th day 238th day Depth (m) 5 6 Depth (m) (a) 9 Limit of soft clay I (b) 9 Limit of soft clay I Figure Profile of the soil vertical distortion measured by (a) IN1 and (b) IN2. 173
205 Figure 5-11 illustrates the variation of the maximum distortion v,max plotted against time and embankment height. The maximum vertical distortion correspond to the maximum values occurred in the middle soft clay I as shown in Figure Similar to the maximum horizontal displacement, it can be observed that the maximum distortion increased at a higher rate upon placement of each layer and then continued increasing at a slow rate reaching an average value equal to 7% at the end of monitoring time. The observed differences between the two curves, which increase with loading and time, may be due to differences in soil layering or soil characteristics around inclinometers IN1 and IN2. Embankment height (m) Maximum distorion, v,max (%) End of construction Time (day) Measured by IN1 Measured by IN2 Figure Variation of the maximum distortion versus time. In order to investigate the influence of the geosynthetic encased granular column on soil distortion, the maximum distortion measured in soft clay is plotted against the embankment total applied stress in Figure It is seen that, increasing in the embankment height (i.e. the increase in applied vertical stress) caused the soil maximum distortion to increase, as expected. The maximum distortion measured in the present study is also compared with the data provided from the test embankment TE1 (Magnani, 2006). Comparison between the two test embankments indicates that the GECs significantly reduced the soil maximum distortion at any stage of loading. At the end of monitoring time, the maximum distortion measured in the present 174
206 study was around 7%, almost half of the maximum soil distortion measured for soft clay beneath the TE1 with the vertical stress level less than half of the present study Total applied stress, v (kpa) Present study TE1 Magnani (Magnani, (2006) 2006) Adjust Poly. (Present (present study) work) Maximum distortion, max (%) Figure Influence of GECs on the soil maximum distortion. A measured relationship was found to correlate the soil maximum distortion ( max in percent) with the maximum horizontal displacement ( h,max in mm) in Figure It is observed that for the present study (i.e. GECs stabilized soft ground) the soil horizontal displacement varies linearly, during both construction and post-construction, resulting an average slope equal to 37, measured by inclinometer IN2. The results obtained from inclinometer IN1 was less satisfactory and thus was not presented. A similar linear relation was also observed for the test embankment on TE1 soft clay (Magnani, 2006), but with higher slope compared with the present work. The normalized soil horizontal displacement is compared with the maximum distortion as illustrated in Figure The soil horizontal displacement is normalized by the embankment height at any stage of the loading. This correlation helps to determine the maximum distortion according to the maximum horizontal displacement measured by both inclinometers. Results obtained from the present study are compared with the test embankment TE1 (Magnani, 2006). It is seen that irrespective of the type of soft clay treatment implemented, the normalized soil 175
207 horizontal displacement varies linearly with the measured soil distortion, resulting in the uniform slope during both construction and post-construction. 600 Maximum horizontal displacement h,max (mm) Present study (IN2) TE1 Magnani (Magnani, (2006) 2006) Maximum distortion, max (%) Figure Measured relation between maximum soil horizontal displacement and maximum distortion h,max (mm) /H em (m) Present study TE1 Magnani (Magnani, (2006) 2006) Maximum distortion, max (%) Figure Variation of the normalized horizontal displacement versus maximum distortion. 176
208 The variation of the maximum distortion is compared with normalized vertical stress in Figure The vertical stress applied in any stage of the loading is normalized with the maximum applied vertical stress (for the present study v,max = 150 kpa). Based on Figure 5-15 it can be seen that the maximum distortion increased with normalized total vertical stress i.e. when embankment height increased. In order to investigate the influence of the GECs, the results of the present study are compared with the test embankment TE1 (Magnani, 2006). Similar to the normalized horizontal displacement (shown in Figure 5-14) is can be observed that both the geosynthetic encased granular column stabilized soft ground and TE1 exposed relatively similar curves when total vertical stress applied in any stage is normalized with the maximum total applied vertical stress. However, the slopes of the two curves are different, beside the fact that TE1 reaches twice the distortion reached in the present study. 1.2 Normalized vertical stress v / v,max (-) Present study TE1 Magnani (Magnani, (2006) 2006) Adjust Poly. (Present (present study) work) Maximum distortion, max (%) Figure Influence of GECs on maximum distortion versus normalized vertical stress. 177
209 5.4. Measurements by total stress cells The variations of the total vertical stresses acting on the top of the granular columns (CP2 and CP4) and surrounding soft soil (CP1 and CP3) versus time as well as the stress concentration are discussed here Total vertical stress below the embankment Figure 5-16 shows data of the total vertical stresses measured by the stress cell placed on the top surface of the encased column (CP2; CP4) and the surrounding soil (CP1; CP3) versus time. It can be seen that the total vertical stresses on both the encased column and the surrounding soil increased within construction stages as embankment height increased. It is also observed that the total vertical stresses acting on the soft soil increased at each loading stage, but did not show significant changes during consolidation. In contrast, the total vertical stresses above the encased columns continued to increase at a slow rate within consolidation. The plausibility of the vertical stress measurements can be roughly assessed by checking the total vertical stress equilibrium between applied embankment stress ( ) versus total vertical stresses carried by the encased column ( vc ) and the surrounding soft soil (,, al. 1979) as follows: v vs ) (Aboshi et v A v, c Ac v, s ( A Ac ) (5-3) Where: A c and A represent respectively the surface area of the column and the unit cell (i.e. column with surrounding soil cylinder) determined by the columns pattern. Based on Figure 5-16, the final total vertical stresses supported by column and surrounding soft soil are 280 kpa and 135 kpa, respectively. Using Equation 5-3 results in a total vertical load equal to kn transmitted to the top of the unit cell, which is sufficiently close (error 2%) to the total vertical load applied by the embankment, v 00 kn. 178
210 Total vertical stress (kpa) 200 End of construction (t= 65 days) Applied embankment stress Soft soil, CP1 Soft soil, CP3 50 Encased column, CP2 Encased column, CP Time (day) Figure Total vertical stress measured on top of the encased column and the surrounding soft soil Stress concentration ratio Since the stiffness of the column is greater than that of the soft soil, the embankment fill mass directly above the soil has a tendency to move downward. This movement is partially restrained by shear stress from the embankment fill mass directly above the column. The shear stress increases the pressure acting on the column but reduces the pressure on the soft soil. This load transfer mechanism was named the soil arching effect (Terzaghi, 1943). The stress concentration ratio (n) is an important parameter (Mitchell and Huber, 1985) to assess the degree of soil arching defined by: n vc, vs, 179 (5-4) Figure 5-17 shows the variations of the stress concentration ratio against time. It is observed that n varies between 2 and 2.3 after the embankment is completed. The final vertical stress sustained by the encased columns is about 2.3 times of that transmitted to the soft soil. Previous studies performed on un-encased and encased granular columns (Juran and Guermazi, 1988;
211 Gniel and Bouazza, 2009; Murugesan and Rajagopal, 2010) showed that the stress concentration ranges between 2 and 3 for un-encased columns, but in some cases increases up to 10 for encased columns. The low measured values of stress concentration might be attributed to the existence of a thick (as much as 2.0 m) top dredged sand layer, which may modify the stress concentration ratio. Variation of the stress concentration versus embankment height shown in Figure 5-17 indicates the lowest stress concentration immediately just after each layer was placed that is attributed to increase in excess pore water pressure accompanying each loading stage. However, the stress concentration increased during consolidation following each stage as excess pore pressure was dissipated. On the other hand, the vertical stress transmitted to the encased column increased as excess pore pressure was being dissipated, while the vertical stress mobilized on the soft soil did not vary significantly (see Figure 5-16), indicating that arching development occurred while excess pore pressure was dissipated. This behavior can be explained by the continuous settlement development on top of the encased column shown in Figure 5-1 which may imply to further stretching of geotextile encasement leading to greater confinement was applied to the column. Consequently, the encased column supported greater vertical stress while consolidation progressed and thus the stress concentration continued at a slow rate. Applied stress (kpa) Stress concentration ratio, n (-) End of construction (t= 65 days) Time (day) n, measured by CP2 and CP1 n, measured by CP4 and CP3 Figure Stress concentration ratio (n) versus time. 180
212 5.5. Measurements by piezometers Excess pore water pressures measured by piezometers located at depths of z = 3 m, 6 m, and 8 m are shown in Figure As expected, the excess pore pressure increased sharply just after each layer was placed, as a result of quick loading conditions induced to the soft clay. The greater increase in excess pore pressure was reached in loading stages 1 and 2 as thicker fill material was placed in these loading stages (1.5 m). It is observed that the excess pore pressure was then dissipated gradually within construction intervals and during the post-construction consolidation (i.e. after the 65 th day). Regarding to the depth of the piezometers, the maximum excess pore pressure was measured by PZ2, located in the middle of soft clay I, which had the longest drainage path. In contrast, PZ3 showed the lowest excess pore pressure and quicker dissipation as it was located close to the sand zone between the two clay layers. 60 PZ3 (z= 8 m) 50 PZ1 (z= 3 m) PZ2 (z= 6 m) Embankment fill Excess pore water pressure (kpa) Working platform Soft clay I Sand zone Soft clay II PZ1 PZ2 PZ3 z Time (day) Figure Variation of the excess pore water pressure measured at soft soil versus time. 181
213 Figure 5-19 shows the incremental excess pore pressure ( u), normalized by the increases in vertical stress on surrounding soil ( v,s ) measured during the construction stages. Average value of the total vertical stresses measured by total stress cells CP1 and CP3 placed on top of the surrounding soil was used to normalize the excess pore pressure measured by PZ2 located at middle of soft clay. Figure 5-19 indicates that the ratio of u / ranges from 0.65 to 0.9, vs, thus not equal to unity, as expected for strictly undrained loading conditions. It is frequently reported in case histories that this ratio starts relatively low for the initial loading stage, and increases to a maximum value close to unity with subsequent loading. Thus, the initial ratio of 0.78 for stage 1 loading and increased to 0.91 for stage 2 loading does not appear unreasonable. However, the decrease in applied stress to pore pressure ratio with stages 3 and 4 may be due to soil arching leading to less of the vertically applied embankment load being transmitted to the soft clay and more being transmitted to the encased columns, as shown in Figure Normilized excess pore pressure, u / vs Embankment construction stages Figure Normalized maximal excess pore pressure (measured by PZ2) generated during embankment loading stages. 182
214 5.6. Measurements by extensometers The measurements provided by the extensometers helps to determine the variations of the column diameter, thus allowing computing the geotextile hoop strain during construction and post-construction. The data obtained from the extensometers was also used to predict the mobilized ring tensile force in geotextile encasement and to verify the maximum mobilized ring tensile force with the respect to the maximum available ring tensile force. The maximum available ring tensile force is the nominal tensile force at rupture devided by the reduction factors. The following sections present the results obtained by the extensometers Column diameter deformation (geotextile expansion) Figure 5-20 illustrate the hoop strains ( r ) developed in the geotextile encasement measured by the different extensometers installed at the depth 1 m below the column top. The geotextile hoop (ring) strain is determined by: d c r (5-5) dc Where: d c = variation of the column diameter measured directly by extensometers; and d = original column diameter (i.e. 78 cm in the present study). c Based on Figure 5-20 it can be seen that the hoop (ring) strains increased during loading stages as embankment height increased as well as during consolidation when the excess pore pressure was dissipated. A sharper increase is seen particularly in the first two loading stages, due to the greater total vertical stress applied in these loading stages. The delayed expansions of the geotextile encasements following loading stage 4 is in accordance with the overall stressstrain behavior of the columns observed by the continuous columns settlement and vertical stresses shown in Figure 5-1 and Figure 5-16, respectively. Therefore, it can be concluded that further geotextile expansion during consolidation caused the column to sustain greater total vertical stress and thus stress concentration developed at a slow rate. From Figure 5-20 it may also observed that 60% to 70% of the maximum geotextile hoop strain occurred at the end of 183
215 embankment construction (i.e. 65 days) which is in accordance with the percentage of the settlement, horizontal deformation, and distortion occurred at the end of construction. Applied stress (kpa) End of construction (t= 65 days) Time (day) Measured by EX1 Geotextile hoop strains, r (%) Measured by EX2 Measured by EX3 Figure Development of the geotextile hoop strains versus time. The variations of the column diameter (or geotextile expansion) measured by the extensometers ( dc ) are correlated with the maximum settlement occurred in the embankment centerline (at mid points between the columns) shown in Figure 5-1. v,max Figure 5-21 shows the variation of the column diameter measured by extensometers versus the maximum settlement at midpoints between the columns measured just after each layer was placed as well as at the end of monitoring time. It can be seen that the geotextile expansion (or column diameter deformation) increased at a higher rate during construction compared with postconstruction. A relation can be found to analyze the ratio between these two measurements as follows: d HR c v,max (5-6) 184
216 It can be seen in Figure 5-21 that the values of HR are equal to 4% and 3% during construction and post-construction, respectively. A lower post-construction value of HR in comparison with construction period is an expected trend. Therefore, it can be concluded the stages constructed test embankment on GECs resulted in a uniform variations of the encasement expansion versus the maximum settlement occurring below the embankment centerline. Variation of column diameter, d c (mm) End of monitoring time End of construction HR= 3% HR= 4% Measured by EX1 Measured by EX2 Measured by EX Settlement at mid point between the columns, v,max (mm) Figure Measured relation between variation of column diameter (geotextile expansion) and settlement at midpoint between the columns Mobilized ring tensile force The variation of the column diameter (geotextile expansion) d can also be used to c compute the ring tensile force T mob mobilized in the geotextile encasement using: T mob d d c c. J (5-7) Where: d = column original diameter; and c J = geotextile ring stiffness modulus (J= 1750 kn/m for the present study). 185
217 The variation of the mobilized ring tensile force in geotextile encasement against time is plotted in Figure An average value of geotextile expansions measured by three extensometers was used to calculate the mobilized ring force T mob. Based on Figure 5-22, the mobilized ring tensile force increased upon placing of each layer, and then followed by continuous increasing during post-construction. It is also seen that the mobilized ring tensile force at the end of monitoring time is equal to 33.6 kn/m which is around 35% of the maximum ring tensile force (available after application of reduction factors) of the geotextile encasement presented in Table 4-3 (i.e. 95 kn/m). 35 T mob = 33.6 kn/m Mobilized ring tensile force, T mob (kn/m) Construction Post-construction Time (day) Figure Variation of the average mobilized ring tensile force in geotextile encasement versus time. The mobilized ring tensile force of the geotextile encasement (i.e. an average value of the three extensometers) is plotted against the total vertical stress in Figure The measured points are correlated by a polynomial curve to estimate the trend of the measurements. It is observed that the greater total vertical stress caused a higher ring tensile force in geotextile encasement. The increase in mobilized ring tensile force for the constant total vertical stress 186
218 indicates to the further expansion of the encasement during consolidation coincident with development of stress concentration during post-construction presented in Figure Total applied stress, v (kpa) y = x x Measured by extensometer Adjust Poly. (Measured (measured by extensometer) Mobilized ring tensile force, T mob (kn/m) Figure Variation of the mobilized ring tensile force in geotextile encasement versus total applied stress Prediction of the mobilized ring tensile force Figure 5-24 illustrates the variations of the normalized ring tensile force, NR (measured by extensometers) against the maximum soil distortion, v,max (measured by inclinometers). The mobilized ring tensile force, T mob, is normalized by the maximum allowable ring tensile force, T max, as follows: NR T T mob max (%) (5-8) Where T max is equal to 95 kn/m for the present case. As shown in Figure 5-24 a relationship close to linear correlates the normalized ring tensile force versus the maximum soil distortion. As can be seen the ratio of the normalized ring tensile 187
219 force to the maximum distortion is equal to 7 and 5 for inclinometers IN1 and IN2, respectively. Therefore, it can be concluded that for the present stage-constructed embankment the normalized ring tensile force increases monotonically with the soil maximum distortion resulting to an average slope equal to Normilized ring tensile force, NR (%) Measured by IN1 Measured by IN Maximum distortion, max (%) Figure Variation of the normalized ring tensile force in geotextile encasement versus maximum distortion. The normalized ring tensile force ( T / T ) may be plotted against the normalized total mob max vertical stress above the encased column, as shown in Figure The vertical stresses above the encased column (measured by stress cells CP2 and CP4) are normalized with the total applied vertical stress equal to 150 kpa for the present study ( / ). According to the Figure 5-25, the normalized ring tensile force varies almost linearly with the normalized column vertical stress resulting a slope equal to 0.16 during both construction and post-construction. vc v 188
220 0.4 Normilized ring tensile force (-) Measured by CP2 Measured by CP Column normalized vertical stress (-) Figure Variation of the normalized ring tensile force in geotextile encasement versus column normalized vertical stress Final remarks This chapter presented and discussed the performance of the geotextile encased granular columns supporting a test embankment. The results of the present study were also compared with the data of the test embankment TE1 with similar foundation features, which allowed evaluating the effectiveness of the GEC used in the present case. The main findings of the present chapter were as follows: The settlements measured below the embankment increased notably just after each layer was placed and then continued increasing at a slow rate during post-construction. Due to different stiffnesses, the maximum settlement occurred at the mid-point between the columns leading a differential settlement which had a similar trend as the total settlement. Geosynthetic encased granular columns caused the total vertical stress acting on the top of the encased columns to be 2.3 times larger than the total vertical stress acting on the top of the surrounding soil. The results also showed that the total vertical stress sustained by the 189
221 encased column increased during consolidation; however, for the surrounding soil, it remained almost constant, with a slight decreasing trend. Similar to the settlement, the maximum soil horizontal deformation increased notably once each layer was placed and then increased at a relatively low rate during post-construction. A measured linear relationship was found to correlate the variation of the maximum horizontal displacement versus the maximum settlement. Geotextile hoop strains were measured using the extensometers attached to the geotextile encasement. A measured correlation was found to estimate the geotextile expansion based on the maximum settlement occurring below the embankment. Measuring of the geotextile expansion resulted to compute the mobilized ring tensile force in geotextile encasement. It was found that around 35% of the maximum ring tensile force was mobilized at the end of monitoring time. The ring tensile force was also correlated with the maximum soil distortion as well as the column vertical stress. Comparison between the present work and TE1 showed that, the GECs reduced substantially the maximum settlement below the embankment and the horizontal deformation of the soil foundation. It was also observed that the GECs improved the load carrying capacity of the stabilized foundation as much as 2.5 times in comparison with the TE1 soft ground. 190
222 6. Numerical and Analytical Studies 6.1. Introduction Numerical modeling with finite element (FE) programs is used ever more often in geotechnical engineering applications. Well known programs such as Flac, Ansys, Abaqus, and Plaxis have been commonly used for design and analysis of geotechnical structures and the latter was used in the present work. Several constitutive models are built in these programs allowing simulating the stress-strain behavior of the various soils and materials existing in actual geotechnical problems. This chapter covers the results of the finite element analysis, using Plaxis 2D v.10 (Brinkgreve and Vermeer, 2012), and analytical calculation (Raithel and Kempfert, 2000) performed on geosynthetic encased granular column in soft clay. Initially, a direct comparison is made between analytical method (AM) and FE analysis. After model verification, sensitivity analyses are performed by varying some important parameters such as clay thickness, geosynthetic modulus, and embankment height, thus their influence on vertical stresses and deformation is discussed. Moreover, numerical analysis of the test embankment is conducted and the results are verified with the field measurements. Analytical calculation (Raithel and Kempfert, 2000) is also performed and compared with the measured data Validation of numerical modeling In this section, results of the FE analysis are compared with the analytical method proposed by Raithel and Kempfert (2000). The FE analyses are performed for long-term conditions (drained analysis) to assess the influence of embankment loading on the settlement, vertical stress acting on the column and soil, and also the tensile force in the geosynthetic encasement. A numerical model of the soft foundation supported by GECs is selected based on typical geometry and material parameters. First, the adopted numerical model is verified with Raithel and Kempfert s (2000) analytical method and then a comparison between numerical modeling and analytical solution is performed by varying some of the critical parameters to investigate their sensitivity on performance of the composite ground. 191
223 Analytical solution - Raithel and Kempfert (2000) Raithel and Kempfert (2000) presented a closed form analytical solution for calculating and designing a geotextile encased column foundation, thus allowing stresses and deformations in both the encased column and soft soil to be obtained, coincident with the method adopted in EBGEO (2010). The solution of the proposed equations is iterative as the method assumes equal settlements for the soft soil and columns. Therefore, an excel spreadsheet was developed to solve the equations of this method. Raithel and Kempfert s (2000) computations are for the long-term drained condition at which maximum settlements and ring tension forces are attained. It is also assumed that the column reaches an active lateral pressure condition, thus the coefficient of active earth pressure ( K ac ) applies, and also the geosynthetic encasement is linearly elastic. Raithel and Kempfert s (2000) analytical model was proposed to be the basis for the conventional calculation of granular columns with geotextile casing. As shown in Figure 2.59, there is an incremental horizontal stress in the column hc (index h = horizontal; index c =, column) due to the additional vertical stress vc (index v = vertical) over the column top. By, knowing the radius r and the change in displacement of the geotextile casing geo r and its geo tensile stiffness J the horizontal stress h, geo acting on the geotextile can be determined by: F h, geo r R geo (6-1) Where the ring tensile force F R is given by: r F J. r R geo geo (6-2) More details about Raithel and Kempfert s (2000) analytical method can be found in chapter 2. The hypothetical problem modeled is shown schematically in Figure 6-1a. The column is 0.70 m in diameter (d c ) and installed in 1.9 m center to center spacing (S) in a triangular pattern resulting a unit cell with diameter (d e ) equal to 2.0 m. The unit cell is then loaded on top by a 6.0 m high embankment (H em ) producing 120 kpa applied total vertical stress. The parameters used in the analytical model are presented in Table 6-1 (index s for soft soil and index c for column). Most of these parameters have been already defined where is the submerged weight, E is oed, s 192
224 the oedometer (constrained) modulus of the soft soil, p ref is reference mean stress, and m is the power of the stress dependency of stiffness. Table 6-1. Geometric and material parameters used in the analytical method. a c r c J E oed, s c K s 0,s pref / m (-) (m) (kn/m) (kpa) (kpa) ( o ) ( o ) (kn/m 3 ) (kn/m 3 ) (-) (-) /1.0 s c s c Numerical analysis In order to simulate the unit cell, an axi-symmetric model was undertaken using the Plaxis 2D program (Brinkgreve and Vermeer, 2012), thus allowing the calculation of the hoop strains and tensile forces acting on the geosynthetic at any depth, as well as settlements in the column and surrounding soil separately. Since the analytical method uses a stiffness dependent to the stress level, the soft clay was simulated using the Hardening Soil (HS) model so that the oedometer modulus E is stress dependent. The elasto-plastic Mohr Coulomb model was oed, s adopted for both the granular column and the embankment material. The geosynthetic was simulated as a linear elastic material with tensile stiffness J. Table 6-2 shows the parameters used in the FE analysis. The material properties selected for the granular column and the embankment are typical parameters based on the literature (Briaud, 2013). Table 6-2. Constitutive models and material properties used in FE analysis. Granular column Soft clay Embankment Property Mohr Coulomb Hardening Soil Mohr Coulomb Saturated unit weight, (kn/m 3 ) sat Drained Young s modulus, E (kpa) Effective Poisson s ratio, v (-) Effective cohesion, c (kpa) Effective friction angle, (degree) Angle of dilatancy, (degree) Lateral earth pressure coefficient, K 0 (-) Power of stress dependency of stiffness, m (-) Reference mean stress, p (kpa) Oedometer modulus, ref E oed (kpa)
225 Figure 6-1b shows the boundary conditions, mesh generation, and the materials involved the numerical modeling. As can be seen, the horizontal displacements were restrained in the axis of the column and also laterally (external part of the unit cell). It is also assumed that the column base rests on a rigid stratum, thus horizontal and vertical fixities were employed at the bottom of the column. The simulation of the installation of the encased column, which is usually by lateral displacement, was not considered. However, encased columns are also but less commonly, installed by non-displacement methods, that is, using open-end tubes with the removal of the soft clay inside the tube. In addition, the purpose of this paper is a direct comparison between the FE analysis and analytical method and the latter does not consider column installation effects. The loading was simulated by actual embankment material placed (instantaneously) on the top of the soil-column surface allowing to calculate differential settlements in general at the embankment base as well as the embankment surface. Axis of symmetry r e = 1 m H em = 6 m v = 120 kpa) r e = 1 m Embankment H em = 6 m v = 120 kpa) r c = 0.35 m S= 1.9 m Geosynthetic encasement Soft clay GEC H s = 10 m Granular column H s = 10 m (a) Figure 6-1. (a) Scheme of GEC adopted in numerical analysis and (b) boundary condition and finite element mesh. (b) 194
226 Model validation Finite element modeling (FEM) and the analytical method (AM) are compared here so that an overall validation can be performed. In the analytical method, the embankment material is simply simulated by surface loading, but preliminary finite element analyses showed that the settlement-loading curve varies slightly with the embankment parameters frictional angle, cohesion, and elastic modulus. Therefore, the embankment material parameters presented in Table 6-2 were suitably chosen to allow the comparison of FEM versus AM. In any case this parameters are typical of fill materials commonly used (Briaud, 2013). The validation analyses here are performed for the case where the thickness of the soft soil and the geosynthetic tensile stiffness are H s =10 m and J= 1000 kn/m, respectively. Then, the verification is carried out in terms of settlement on encased column, vertical stresses acting on the top of the soft soil and the encased column, and the geosynthetic hoop tensile force plotted against the embankment height. In Figure 6-2a, the column settlement versus embankment height obtained from FEM is compared with AM. It can be seen that FEM appears to meet the general trend of the analytical results well. Variations of the total vertical stresses and geosynthetic hoop tensile force obtained from the current model, illustrated in Figure 6-2b and Figure 6-2c, respectively, compared even better than the settlements. It is mentioned that the average values of the total vertical stress are presented; however the geosynthetic tensile force is the maximum value along the column length. These curves suggest that the adopted FE model appears to be appropriate for a parametric study of the GEC. 195
227 Settlement (m) Embankment height, H em (m) FEM 0.60 AM (a) Vertical stress (kpa) Embankment height, H em (m) FEM 400 AM (b) Soft soil Encased column 0 Embankment height, H em (m) Ring force in geosynthetic (kn/m) FEM AM 60 (c) Figure 6-2. Validation of numerical analysis (FEM) with analytical method (AM), (a) settlement vs. embankment height, (b) vertical stress vs. embankment height, and (c) geosynthetic ring force vs. embankment height. 196
228 Sensitivity analyses FEM and AM are compared here by means of parametric studies to assess the influence of various parameters on the overall behavior of GEC. In all parametric analyses, the 2 m diameter GEC unit cell (a c = 0.122), in a soft clay layer with varying thickness, was loaded by a 6 m high embankment, which appear to be representative values for the practical applications. The parameters chosen for comparison are: settlement reduction ratio (SRR), vertical stresses acting on the top of the soft soil and the column, stress concentration factor (SCF), differential settlement (DS), and hoop tensile force in the geosynthetic. Note that all the above parameters will be defined later, separately. The analyses were performed by varying the thickness of the soft soil H s in the typical range of 5 to 20 m, and stiffness of the geosynthetic J in the range of 0 to 4000 kn/m. Typical values of geosynthetic stiffness used as encasement are in the range of 1000 to 4000 kn/m; and J = 0 may be associated with the traditional (un-encased) granular columns. Table 6-3 shows the parameters considered in the sensitivity analyses. Table 6-3. Case considered in parametric analyses. Soft soil thickness, H s (m) 5, 10, 15, 20 Geosynthetic stiffness, J (kn/m) 0, 500, 1000, 2000, Influence of soft soil thickness Figure 6-3 compares the variation of the settlement on the top of the column plotted against the embankment height (H em ) for various thicknesses of soft soil (H s ) obtained by both FEM and AM. As expected, the settlement increased with embankment height and also soft soil thickness. There is a good agreement between settlements calculated by FEM and AM at the elastic range (small value of H em ), however the difference increased with both H em and H s. The reason is because AM does not take into account the elasto-plastic soil behaviour; whereas the FE results showed plastic yielded points developed along the column and soft soil, thus the difference between settlements calculated by FEM and AM increased with both H em and H s. Figure 6-4 shows the final settlement occurred on top of the encased column versus the geosynthetic stiffness for various thicknesses of soft soil. For both FEM and AM, it can be seen that the final settlement reduced gradually with increasing of the geosynthetic stiffness. For the 197
229 cases simulated here, the influence of the stiffness on the settlement decreased for stiffness values higher than J = 2000 kn/m, particularly for thinner soft clay layers Embankment height, H em (m) Settlement on the top of the column(m) FEM AM H s = 5 m H s = 10 m H s = 20 m Figure 6-3. Settlement vs. embankment height curves for encased column, J= 1000 kn/m. 3 Final settlement on the top of the column (m) FEM AM H s = 5 m H s = 10 m H s = 20 m Geosynthetic stiffness, J (kn/m) Figure 6-4. Final settlement o n column s top vs. geosynthetic stiffness. 198
230 Settlement reduction ratio (SRR) The parameter SRR is defined here by the difference in the settlement between encased and un-encased columns ( s en s un ) divided by the settlement of the un-encased column ( s un ) at the identical state of geometry and embankment loading. Figure 6-5 shows variations of the SRR versus the geosynthetic stiffness for two values of soft soil thickness ( H = 5 and 20 m). It is quite clear that for an equal H the SRR increases as geosynthetic stiffness increases and also s that for any geosynthetic stiffness the settlement reduction ratio increases when the thickness of the soft soil decreases. It can be concluded that the efficiency of geosynthetic in settlement improvement increases as the thickness of soft soil decreases. The reason can be due to the additional confining pressure provided by geosynthetic encasement, a topic explored in Figure 6-6, which presents the maximum tensile force in geosynthetic plotted against geosynthetic stiffness. For both FEM and AM, it is observed that tensile force increases gradually with geosynthetic stiffness, but for identical stiffness, the hoop tensile force is greater as the thickness of soft soil reduces. It is also observed that the AM shows higher tensile force than the FEM and these differences increase with the increase in geosynthetic stiffness. s 0.9 Settlement reduction ratio, SRR (-) FEM AM H s = 5 m H s = 20 m Geosynthetic stiffness, J (kn/m) Figure 6-5. Settlement reduction ratio vs. geosynthetic stiffness. 199
231 80 Tensile force in geosynthetic (kn/m) FEM AM H s = 5 m H s = 20 m Geosynthetic stiffness, J (kn/m) Figure 6-6. Tensile force in geosynthetic vs. geosynthetic stiffness Critical height of embankment A typical deformed shape of a GEC stabilized soft clay obtained by FEM is shown in Figure 6-7a for an encased column with geosynthetic stiffness of J = 4000 kn/m and soft soil thickness of H = 10 m. It is clearly observed that the encased column does not settle equally with the s surrounding soil while AM assumes the same settlement value for the top of the encased column and the soft soil. Figure 6-7a also shows points A and B, respectively at the top (center) of the column and at the soft soil (i.e. midpoints between the columns). Figure 6-7b shows the variation in settlement plotted against the embankment height for these two points. It is observed that the difference in settlement (DS) between points A and B increases for the embankment heights ( H em ) greater than 2.0 m. This difference then increases smoothly and reaches 0.1 m settlement for H em = 6.0 m and is quite an important difference between the analytical and numerical methods. 200
 Encased column (point A) 0.60 0.70 Figure 6-7. (a) Deformed mesh for GEC modeled by FEM and (b) Settlement vs.")
232 A B Embankment Embankment height, H em (m) A Encased column Geotextile Soft soil B Settlement (m) Soft Soil (point B) Encased column (point A) Figure 6-7. (a) Deformed mesh for GEC modeled by FEM and (b) Settlement vs. embankment height for top of the soft soil (point B) and encased column (point A) by FEM, H s = 10 m, J= 4000 kn/m. In practical applications, DS at the top of the embankment is more important than the settlement below the embankment. Therefore, here a normalized DS is defined through: sa s DS H em B Where s A and (6-3) sb correspond the settlement at points A and B, respectively. Figure 6-8 shows the variation of normalized DS on top of the embankment against embankment height. It is observed that, for the present case, the normalized DS takes place only when the embankment height is smaller than H em < 1.55 m. This has been already named the critical height of embankment H in relation to piled embankments. Based on physical and numerical crit modeling, as well as the field tests of piled embankments, McGuire et al. (2012) proposed the equation: H 1.15s 1.14d crit Where: c s ' = the diagonal half span between the columns; and d c = the column diameter, equal to 0.70 m in the present study. (6-4) 201
233 For the given hypothetical geometry and columns arrangement (triangular pattern) shown in Figure 6-1, the diagonal half span between the columns can be calculated as follow: 3S s dc /2 (6-5) 3 Using Equation 6-5 yields a diagonal half span equal to s ' = 0.75 m which if is then substituted in Equation 6-4 results a critical height equal to H crit = 1.68 m, greater than 1.55 m illustrated in Figure 6-8. This difference is expected as pile elements in piled embankments deform less than encased columns, thus, with the same area ratio the critical height of the piled embankments is expected to be higher than the embankments on encased columns. 10 Normalised differential settlement (%) y = x FEM Numerical trend Embankment height, H em (m) Figure 6-8. Normalized differential settlement vs. embankment height by FEM, H s = 10 m, J= 4000 kn/m Vertical stress ratio and stress concentration factor The parameter vertical stress ratio is defined here as the magnitude of vertical stress acting on the encased column ( vc ), or soft soil ( vs ) divided by the vertical stress applied by the embankment, = 120 kpa in the present case. Figure 6-9 shows the variation in vertical stress ratio versus geosynthetic stiffness for both the granular column (un-encased and encased) and the 202
234 soft soil ( H = 15 m). It is seen that the encasement increases the value of the vertical stress ratio s in the column and inversely decreases in the surrounding soil. It is also observed that higher geosynthetic stiffness intensifies the value of stress transferred in the encased column as much as almost seven times of the embankment vertical stress for geosynthetic with J = 4000 kn/m. The results also illustrate that the influence of geosynthetic on vertical stress gradually reduces for stiffness higher than J= 2000 kn/m for the case analyzed Vertical stress ratio (-) FEM AM Encased column Soft soil Geosynthetic stiffness, J (kn/m) Figure 6-9. Vertical stress ratio vs. geosynthetic stiffness (H s = 15 m). The parameter stress concentration factor (SCF) is defined here by the ratio of vertical stress sustained by the column to the vertical stress sustained by the soil for the same applied embankment loading. Figure 6-10 shows the variation in SCF against geosynthetic stiffness for different values of H s. It is seen that, for a traditional (un-encased) granular column (J= 0) the value of the SCF does not change with the variation of soft soil thickness as it is almost equal to 4 for all values of H s and this value is quite typical for conventional granular columns (Mitchell and Huber, 1985). However, for an encased column, as the geosynthetic stiffness increases the SCF increases dependent on the geosynthetic stiffness and also on the thickness of the soft soil. For example, 203
235 for an encased column modeled in soft soil with H s = 20 m, the stress concentration of the unencased granular column increases from 4 to 26 when it is encased by geosynthetic with J = 4000 kn/m. The results shown in Figure 6-10 also indicate that the SCF increases as the thickness of the soft soil decreases. For instance, when soft soil thickness decreases from 20 m to 5 m the SCF reaches quite high and somewhat unexpected values (SCF= 46 for J = 4000 kn/m), which should be confirmed experimentally. Stress concentration factor, SCF (-) H s = 5 m H s = 10 m H s = 15 m H s = 20 m Geosynthetic stiffness, J (kn/m) Figure Stress concentration factor (SCF) vs. geosynthetic stiffness by FEM Distribution of the geosynthetic hoop force Figure 6-11 shows the distribution of hoop force in geosynthetic encasement with depth. These graphs are presented for granular columns encased by different geosynthetic stiffness values and obtained by both FEM and AM. Variations of the hoop force by the FEM follow the same pattern of the lateral deformation undergone by the stone column and the magnitude of tensile force varies between 36 kn/m to 72 kn/m for different stiffness values of geosynthetic. Gniel and Bouazza (2009) also reported that hoop tensile force in geosynthetic follows a variable pattern with depth. The AM, however, assumes a constant hoop force along the depth, as shown 204
236 in Figure It may be observed that the tensile forces become less variable as the geosynthetic modulus increases. J= 500 kn/m Hoop force (kn/m) J= 1000 kn/m Hoop force (kn/m) J= 2000 kn/m Hoop force (kn/m) J= 4000 kn/m Hoop force (kn/m) Depth (m) Depth (m) Depth (m) Depth (m) Figure Distribution of geosynthetic hoop tensile force vs. depth for different geosynthetic stiffness. Solid line: FEM, dashed line: AM. This variable pattern of the geotextile hoop forces along the depth is explored in Figure Figure 6-12a presents the hoop forces and horizontal displacement distribution for a short granular column (H s /d c = 2.0) encased by geosynthetic with stiffness of J= 1000 kn/m and loaded by a 6 m high embankment. The distribution of the horizontal displacement shown in Figure 6-12a can be associated with the shearing behaviour of the triaxial test specimen with height twice of the diameter. In fact, the pattern of horizontal displacement distribution is in accordance with the well-known behavior named dead and active or dilating zones (Figure 6-12c) a phenomenon discussed in detail by Rowe and Barden (1964). According to Figure 6-12a, the inclination of the active zone in relation to the horizontal line is equal to = 63.4, that is almost equal to the slip surface predicted by 45 ( / 2) 64 o c for c = From Figure 6-12a, it is also observed that the maximum geosynthetic hoop force occurs at the same height where the maximum shear stress mobilized and the minimum geosynthetic hoop 205
 and dilating zones (with larger hoop stresses) are observed.")
 Slip surface in triaxial specimen, H s /d c = 2.0 (Rowe and Barden 1964). Figure 6-12. Distribution of hoop force and shear zones in encased column. 6.3.")


237 force is associated with the dead zone. Figure 6-12b also presents results for a longer column with H s /d c = 7.14 in which the similar patterns including dead zones (with smaller hoop stresses) and dilating zones (with larger hoop stresses) are observed. d c d c Dead zone Dilating zone Dead zone H s Dilating zone Dead zone H s Dilating zone (a) H s /d c = 2.0. (b) H s /d c = (c) Slip surface in triaxial specimen, H s /d c = 2.0 (Rowe and Barden 1964). Figure Distribution of hoop force and shear zones in encased column Finite element analysis of the test embankment Finite element (FE) analysis of the test embankment was performed using both two dimensional axi-symmetric and plane strain simulations, thus the three dimensional numerical analysis was out of scope of the present work. The axi-symmetric analysis was carried out by modeling half of an encased granular column accompanying with the surrounding soft soil. The diameter of the unit cell was determined assuming an average centre-to-centre spacing in the central area of the test embankment. The plane strain analysis was conducted by simulating the full-scale embankment on encased granular columns in which the column diameter was transformed into an equivalent wall. The simulation procedure, material properties, and results of the numerical analyses are described in the following sections Axi-symmetric simulation The axi-symmetric analysis was performed using the unit cell approach, thus the settlements and the vertical stresses acting on the encased column and the surrounding soft soil were 206
238 determined separately as well as the pore pressures, and geotextile hoop strains. Numerical analysis was performed using coupled consolidation analysis, and the results were compared with measured data. As far as constitutive models are concerned, the elastic perfectly plastic model with MC (Mohr-Coulomb) failure criterion was adopted for both the encased column and the embankment material. Soft clay behaviour was simulated using SS (Soft Soil) elasto-plastic model and the parameters were obtained from the site investigation described in chapter 3. The OCR values obtained from oedometer tests were assigned to corresponding depths of the soft clay I. Table 6-4 shows the constitutive models and the material parameters used in the numerical analysis of the test embankment. The parameters adopted for the soft clay layers are the average values for corresponding layer shown in Table The soil properties used for the embankment fill, granular column, and sand layes are based on the well established literature data (Briaud, 2013). Material and constitutive model Embankment fill (MC) Granular column (MC) Soft clay I (SS) Soft clay II (SS) Working platform (MC) Dense sand (MC) Sand lens (MC) Table 6-4. Material parameters used in FE analysis of the test embankment. sat k h k v ' c' E' C c C s C k (kn/m 3 ) (m/day) (m/day) ( o ) (kpa) (kpa) (-) (-) (-) MC and SS are Mohr-Coulomb and Soft Soil models, respectively. Figures 6-13a and 6-13b show the geometric data of encased columns and the axi-symmetric unit cell used in finite element analysis. The geomechanical model and finite element mesh are also shown in Figures 6-13c. As seen in Figure 6-13c the vertical and horizontal displacements were restrained at the bottom boundaries, but the vertical displacements were allowed at the lateral borders. The soil layering was selected based on the typical ground profile at the center of the test area shown in Figure
239 According to the field conditions, the columns localized in the central area of the test embankment were arranged with an average center-to-center distance (S) of 2.0 m in a square grid resulting in a unit cell with a diameter of 2.26 m (d e = 1.13S) and an area ratio equal to a c =12.5%. The embankment construction was simulated by placing fill material following the actual construction and considering the construction time for each layer presented in chapter 4. In finite element analysis, the mesh for the embankment is pre-defined and the embankment load is applied by turning on the gravity force of the embankment elements of each layer. The geotextile casing was simulated as an elasto-plastic isotropic material with ring tensile stiffness and maximum tensile force equal to 1750 kn/m and 95 kn/m, respectively (see Table 4-3). The basal geogrid was also modeled using the geogrid element with a tensile modulus of 2000 kn/m. During mesh generation, material clusters are divided into 6 or 15-node triangular elements. The 15-node elements provide an accurate calculation of stresses and deformation; therefore, these were employed for the modeling of soil materials. When 15-node soil elements are used, each geogrid element is modeled by 5-node line elements. A geogrid element is a slender structure with only an axial tensile modulus in which the tensile forces are evaluated at stress points that coincide with the nodes. Axis of symmetry r e 5.3 m v= 150 kpa d e Embankment fill 11 m Soft clay d c Sand platform GEC GEC Soft clay I Soft clay L c L c Sand zone d c r e= (1.13 x S)/ 2 r e S GEC Soft clay II a c= d c 2 /d e 2 = Dense sand (a) (b) (c) Figure Axi-symmetric FE analysis of the test embankment (a) geometric data of the test embankment and encased columns; (b) axi-symmetric unit cell approach; (c) model adopted and FE mesh in numerical analysis. 208
240 Comparison of numerical results and measured data The results obtained from the axi-symmetric analysis are compared here with the measured data. Settlements and vertical stresses acting on the top of the encased columns and the surrounding soil, excess pore pressures, and geotextile radial deformations were the main variables considered for the comparison Measured and predicted surface settlements Measured and predicted settlements (FEA) on the top of the encased column and the surrounding soft soil are shown in Figure It can be seen that the numerical analysis predicted the measured settlements reasonably well, in particular during construction and also to some extent for the stage consolidation intervals. Both measured and computed results showed that the settlement increased notably just after each layer was placed and also during consolidation when excess pore pressure was being dissipated. It is observed that the settlement occurred on surrounding soft soil at the end of construction (i.e. 300 mm) was about 60% of the settlement occurred at the end of monitoring time (i.e. 500 mm). Unlike the analytical calculations (Raithel and Kempfert, 2000; Castro and Sagaseta, 2011) there was a difference between settlements measured at the top of the encased column and at the surrounding soil, which were obtained by finite element analysis. Similar to the total settlement, this difference increased with time as a differential settlement of around 80 mm occurred at the end of monitoring time for both measured and computed values. The differential settlement between the encased columns and the surrounding soil results from the different stiffness values of the granular material and the soft clay (Almeida et al. 2013). It may also be stated that almost half of the final differential settlement occurred after the last layer was placed (i.e. at the end of construction). 209
241 Total applied stress (kpa) Settlemenet (mm) mm End of construction Time (day) FEA (encased column) FEA (surrounding soil) Measured (S1) (S3) Measured (S2) Total applied stress 80 mm 600 Figure Predicted (FEA) and measured settlements on encased column and surrounding soil Measured and predicted total vertical stresses Total vertical stresses measured on the top of the encased columns and the surrounding soil (i.e. midpoint between the columns) are compared with the values obtained from finite element analysis (FEA) in Figure It is observed that the total vertical stresses acting on both the encased column and the surrounding soil increased notably as embankment height increased. The increase is higher in the encased granular column, due to its higher stiffness compared to the surrounding soil. The results also show that the total vertical stresses acting on the encased columns tend to increase continuously during post-construction. Inversely, the total vertical stress acting on surrounding soil (midpoints between the columns) decreased at a slow rate. This behaviour can be attributed to the decrease in the apparent stiffness of surrounding soil from quasi-undrained stiffness to drained stiffness during consolidation. Comparison of field data and the results of finite element analysis show that the numerical analysis gave a satisfactory estimation of the total vertical stresses, particularly at midpoints between the columns. 210
242 FEA Total applied stress Encased column ( v,c ) Total vertical stress, v (kpa) Surrounding soil ( v,s ) Measured by CP1 CP2 Measured by CP2 CP1 Measured by CP3 CP4 Measured by CP4 CP Time (day) Figure Vertical stresses acting on encased column and surrounding soil: measured and predicted (FEA) results. Measured and predicted stress concentration ratios ( n v, c / v, s ) are shown in Figure In general, finite element analysis seems to estimate measured data well during both construction and post-construction. It is also seen that both the measured and the computed stress concentration increased during construction after each layer was placed, as well as during the post-consolidation period due to change in apparent undrained stiffness of the soft clay. The increase in stress concentration during post-construction can also be attributed to the development of soil arching resulting from further stretching of the geotextile casing which caused the column to support more total vertical stress. Since greater total vertical stress was transmitted to the encased column, and thus stress concentration increased almost continuously. 211
243 2.5 Stress concentration ratio, n (-) Construction Post- construction Measured (CP1/CP2) (CP2/CP1) Measured (CP3/CP4) (CP4/CP3) FEA Time (day) Figure Measured and predicted (FEA) stress concentration ratio. Experimental studies performed on un-encased granular columns (Juran and Guermazi, 1988; Gniel and Bouazza, 2009) demonstrated that the stress concentration varied mainly between 2 to 3 but may increase up to 20 in some cases of geosynthetic-encased granular columns. For the present case, the low measured values of stress concentration ratio can be explained by the contribution of the sand working platform (measured by CP1 and CP3) rather than the soft soil in supporting the embankment load directly. The higher stiffness of the sand working platform caused a greater embankment loading to be transmitted to the surrounding soil, and consequently the stress concentration ratio was lower than expected. For clarification, the predicted total vertical stresses transmitted directly to the top of soft clay I (point B in Figure 6-17b) and to the top of the encased column at the same level of the soft clay I (point A in Figure 6-17b) are presented in Figure 6-17a. It can be seen that at the end of the monitoring time, the contribution of the soft clay I in supporting the embankment load is around 60% (i.e. 90 kpa), but the encased column contributed by carrying a load equal to as much as six times the total applied stress (i.e. 900 kpa) which produced a stress concentration ratio equal to 10, which is in reasonable agreement with some reported stress concentration ratio (Khabbazian et al. 2010; Yoo, 2010; Almeida et al. 2013). 212
244 v (kpa) Embankment CP2 CP4 CP1 CP Vertical stress (kpa) v,c = 910 kpa FEA (point A) FEA (point B) Total applied stress vs = 100 kpa GEC A GEC Sand platform B Soft clay I (a) Time (day) (b) Figure (a) Vertical stresses on encased column (point A) and soft clay (point B) and (b) distribution of the vertical stress in the encased column and soft clay Measured and predicted excess pore pressures The variations of the excess pore pressure with elapsed time for the piezometers located at 3 m (PZ1), 6 m (PZ2), and 8 m (PZ3) below the ground surface and on the embankment centerline are shown in Figure A sharper increase is seen just after the placing of each layer, and subsequently the excess pore pressure dissipates partially during consolidation intervals. It can be seen that the finite element analysis (FEA) simulated both excess pore pressure buildup and dissipation for the stage constructed embankment reasonably well, but there is almost 20% difference in the maximum excess pore pressure in loading stage four, which could be related to the actual thickness of the layer placed in this loading stage. The faster dissipation of excess pore pressure obtained from FE analysis can be explained by the actual columns layout in the test area. As mentioned in chapter4, the columns were installed in an irregular square pattern with center-to-center spacing ranged between 1.75 to 2.25 m. The FEA however was performed using a unit cell which was generated considering 2.0 m center to center spacing between the columns, which is the average value obtained in the central area of the test embankment, relevant for the 213
245 axi-symmetric analysis. Thus the localized larger spacing between the columns, where piezometers are installed, could be the reason for slower dissipation of pore pressure obtained by measurement compared with the FEA. The maximum pore pressure was measured by PZ2, located in the middle of soft clay I, which had the longest drainage path. In contrast, PZ3 showed the lowest excess pore pressure as it was located close to the sand zone between the two clay layers (see Figure 4-12). PZ1, which was located 3 m below the ground surface, showed similar behavior but with a lower peak pore pressure than PZ2, as it was close to the sand working platform. The increase in the total vertical stress acting on the column was due to the decrease in soil apparent stiffness from quasi-undrained to drained stiffness when excess pore pressure was being dissipated. 50 Excess pore pressure (kpa) Measured (PZ1) Measured (PZ2) Measured (PZ3) FEA (PZ1) FEA (PZ2) FEA (PZ3) Time (day) Figure Measured and computed (FEA) excess pore pressure Measured and predicted geotextile expansion Variations of the measured and predicted (FEA) geotextile expansion ( 214 dc ) are shown in Figure 6-19a. It can be seen that the geotextile expansion increased notably just after each layer was placed and then increased continuously during post-construction. Continuous encasement
246 expansion coincides with the variation of the settlement and the total vertical stress measured on the encased columns as presented in Figure 6-14 and Figure 6-15, respectively. As seen in Figure 6-15, the total applied stress was constant (i.e. 150 kpa) during post-construction. However, the vertical stress measured on the top of the encased column continued to increase, which caused further geotextile expansion. This is in accordance with the stress concentration evolution with time presented in Figure 6-16, i.e. after construction and at consolidation intervals. The results of the finite element analysis were used to compare the geotextile expansion at 0.8 m below the soft clay (i.e. point E in Figure 6-19b), which is equal to the column diameter, with the field data measured at point D. Based on Figure 6-19a, the horizontal deformation computed at point E was about twice the value measured by the extensometers (i.e. point D in Figure 6-19b). The smaller horizontal deformation measured at point C (i.e. 0.8 m blow the ground surface) can also be attributed to the contribution of the sand working platform providing higher confining support acting on the column, which caused the column not yielding along its length installed in the working platform. Geotextile expansion, d c (mm) Measured (point D) FEA (point D) FEA (point C) FEA (point E) (a) Time (day) GEC Sand 1.0m GEC platform C Soft clay Figure Variations of the horizontal deformation (a) measured and computed (FEA) geotextile expansion and (b) distribution of the horizontal deformation. D E 0.8m 0.8m (b) h (mm)
247 Influence of the spacing between the columns As it has been already mentioned, the numerical analysis of the test embankment was performed using a unit cell generated by assuming 2.0 m center-to-center spacing between the columns (S) which is the average value for the columns localized in the central area of the test embankment. To study the influence of the spacing between the columns, further numerical analyses were carried out using S= 1.75 and 2.25 m which are respectively the minimum and the maximum spacing between the column installed in the test area. Figure 6-20 compares the settlement measured on the top of the surrounding soil with those obtained from the finite element analysis using three different spacings between the columns (i.e. S= 1.75, 2.0, 2.25 m). As expected, the large spacing between the columns caused the greater settlement to occur at the midpoint between the columns. For instance, the settlement computed assuming S= 2.25 m was around 23% greater than the settlement computed assuming S= 1.75 m. It is also observed that the settlement computed assuming S= 2.0 m predicted well the measured data, particularly at the end of monitoring time, which confirms that the columns spacing of S= 2.0 m used for the unit cell localized in the central area of the test embankment is a representative value. Total applied stress (kpa) Settlement (mm) Time (day) Measured (S2) Total applied stress FEA (S=1.75 m) FEA (S= 2.0 m) FEA (S= 2.25 m) 600 Figure Influence of the spacing between the columns on settlements on the top of the surrounding soil. 216
248 In Figure 6-21 variations of the measured total vertical stress acting on the top of the encased granular columns are compared with the results of finite element analysis performed using different spacings between the columns. It can be seen that for a constant column diameter, the larger spacing between the columns (with a lower the area replacement ratio, a c ) caused the column to support higher total vertical stress. For instance, at the end of monitoring time the total vertical stress acting on the top of the encased granular column with S= 2.25 m was approximately 20% greater than the result obtained with S=1.75 m (i.e. the minimum spacing in the present study). It can be seen that the best prediction of the measured total vertical stress was provided by assuming S= 2.0 m. 350 Total vertical stress on encased column (kpa) Field measurement (CP2) Field measurement (CP4) FEA (S= 1.75 m) FEA (S= 2.0 m) FEA (S= 2.25 m) Time (day) Figure Influence of the spacing between the columns on variation of the total vertical stress acting on encased column. In Figure 6-22 variations of the measured total vertical stress acting on the top of the surrounding soft soil are compared with the numerical results. Unlike vertical stress acting on the encased granular column, the total vertical stress acting on the top of the surrounding soil reduced as spacing between the columns increased (i.e. the area replacement ratio, a c, was lower). As clearly seen, the best prediction of the measurements was achieved when finite 217
249 element analysis was performed assuming S= 2.0 m which is the average value at the central area of the test embankment. Comparison of Figure 6-21 and Figure 6-22 indicates that the encased granular columns spaced larger (lower a c ) improved the stress concentration ratio as also reported in experimental investigations (Murugesan and Rajagopal, 2007) and some numerical studies (Khabbazian et al. 2010; Hosseinpour et al. 2014). For example, the stress concentration ratio (n) at the end of monitoring time is equal to 3.1 by assuming S= 2.25 m; however the stress concentration ratio reduces to 1.86 if S= 1.75 m is used. 160 Vertical stress on surrounding soil (kpa) Field measurement (CP1) Field measurement (CP3) FEA (S= 1.75 m) FEA (S= 2.0 m) FEA (S= 2.25 m) Time (day) Figure Influence of the spacing between the columns on variations of the total vertical stress acting on the top of the surrounding soil. Influence of the spacing between the encased granular columns on variations of the excess pore pressure in the middle of soft clay I is presented in Figure As expected, the larger columns spacing (i.e. S= 2.25 m) caused the greater value of excess pore pressure, as well as the larger time to pore pressure dissipation. It is also seen that the analysis performed assuming S= 2.0 m predicted well the pore pressure buildup at any loading stage, but the measured dissipation points varied somewhere between the numerical results performed using S= 2.0 and 2.25 m. 218
250 70 Excess pore pressure (kpa) Field measurement (PZ2) FEA (S= 1.75 m) FEA (S= 2.0 m) FEA (S= 2.25 m) Time (day) Figure Influence of the spacing between the columns on variations excess pore pressure at the middle of soft clay I Plane strain simulation Most of the numerical methods have been developed based on the unit cell approach in which the horizontal deformation of the soft ground is restrained by the boundary conditions used in unit cell modeling. As far as, soil horizontal deformation is concerned, particularly affecting the structures built nearby, plane strain numerical analysis is essential to calculate the horizontal deformation at the embankment borders. A simplified methodology for plane strain analysis of the conventional granular columns was proposed by Tan et al. (2008) in which the unit cell of granular column was converted in a wall to obtain the equivalent plan strain column width. However, this approach was not calibrated for the influence of the additional confinement provided by the encasement, thus the increase of column stiffness and bearing capacity caused by the geosynthteic encasement is not taken into account. In the present study the influence of the geosynthetic encasement was considered by suitable changing of the friction angle of the column material (Raithel and Henne, 2000). The full-scale analysis of the test embankment was performed by the geomechanical transformation of the axi-symmetric to plane strain according to the equivalence of column 219
251 drainage capacity (Indraratna and Redana, 1997). This method hence preserves the crosssectional area of the column and the surrounding soft soil for the same total area in both conditions. The plane strain column width (2b c ) was determined by the following relationship based on the equivalent of area replacement ratio (Tan et al. 2008): 2 rc bc B (6-6) R 2 Where: r c = column radius; R = unit cell diameter; and B = equivalent plane strain width as shown in Figures The relation between R and B is given by the following equation based on the equivalent total area and columns pattern (Barron, 1948): R 1.13B (6-7) This conversion method results in a smaller plane strain column width and larger flow path comparing to the axi-symmetric unit cell. Given columns geometric data and using Equations 6-6 and 6-7, the width of converted columns was calculated equal to 0.25 m. The influence of the geosynthetic encasement was considered in equivalent plane strain walls by a suitable change in the column friction angle, suggested by Raithel and Henne (2000) as described in chapter 2. Therefore, the substitute friction angle ( sub ) of the column material was determined using the following relationship: sin sub 1 sin 1 sin 1 sin 1 sin h, geo hc, h, geo hc, 1 1 (6-8) The average values of hc and,, h geo, obtained from the axi-symmetric analysis, were replaced in Equation 6-8 resulting the substitute friction angle of the column material ( sub ) equal to 66 o. The material properties and constitutive models were as same as presented in Table 6-4. The actual embankment construction was followed by placing the fill material layer by layer with due consideration of construction and consolidation durations for each layer. The plane strain model adopted in finite element analysis can be seen in Figure

252 2B 2R S= 2.0 m (a) GEC d c = 0.8 m 2b c (b) 2r c r c = 0.4 m R= 1.13 m B= 1.0 m b c = m Basal geogrid Sand working platform Embankment GEC Soft clay I Soft clay II Stiff clay Sand Sand Figure Plane strain analysis of the test embankment (a) granular columns arrangement; (b) method of plane strain conversion; (c) FE model adopted for plane strain analysis of the test embankment (no scaling). (c) Measured and predicted surface settlements Figure 6-25 compares the settlements on the top of the surrounding soft soil (measured by S1) and the encased column (measured by S3) with those computed from the plane strain finite element analysis (FEA). It can be seen that the settlements computed using geosyntheticequivalent friction angle (GEC) predicted the measured values fairly well, particularly on the surrounding soil. But the settlement obtained using original friction angle (OSC) was as much as 2 times of the measured values. The well-known influence of encasement in the stiffness of the granular columns is clearly seen in Figure This would increase the confining stress in the column material at smaller radial displacements, leading to less settlement under the applied load. Therefore, the approach of the geosynthetic-equivalent friction angle in the plane strain 221
253 analysis appears to be a suitable one to obtain a reasonable settlement computation in the cases of encased columns. Time (day) Settlement (mm) Measured by S1 (soil) Measured by S2 3 (column) FEA (GEC, soil) FEA (GEC, column) FEA (OSC, soil) Figure Measured and computed (FEA) settlements versus time. The differential settlement was also observed in the numerical analysis performed using geosynthetic-equivalent friction angle (GEC). For clarification, variations of the vertical stresses acting on encased column (measured by CP2) and surrounding soil (measured by CP1) are compared with values computed from finite element analysis in Figure It can be seen that the encasement caused the column to support more total vertical stress thus around 2.5 times of the total applied stress was sustained by the encased column at the end of monitoring time. Results of the numerical analysis performed using geosynthetic-equivalent friction angle (GEC) also showed that due to soil arching the vertical stress acting on column was almost 3 times greater than the vertical stress acting on surrounding soil caused the differential settlement shown as seen in Figure
 vertical stresses acting on column and surrounding soil. Figure 6-27. Distribution of settlement at the end of monitoring time obtained by plane strain FE analysis.")
254 Vertical stress (kpa) Measured by CP2 (column) Measured by CP1 (soil) FEA (GEC, column) FEA (GEC, soil) Time (day) Figure Measured and computed (FEA) vertical stresses acting on column and surrounding soil. Figure Distribution of settlement at the end of monitoring time obtained by plane strain FE analysis. v (mm) Measured and predicted excess pore pressures Variations of the excess pore pressure measured by piezometers PZ1 and PZ2 are compared with values computed from the plane strain analyses in Figure It can be seen that the approach of the geosynthetic-equivalent friction angle in plane strain analysis seems to be 223
255 appropriate to predict reasonably well the pore pressure build up and at some extent of its dissipation. Results of finite element analysis also showed that the use of geosynthetic-equivalent friction angle (GEC) caused pore pressure dissipation to speed up notably compared with OSC. This behaviour can be related to the increase in column stiffness (due to encasing) leading the column to support greater total vertical stress and thus, due to equilibrium of the total applied load, the total vertical stress acting on surrounding soil reduced. Therefore, the lower total vertical stress on surrounding soil caused the maximum excess pore pressure computed for the GEC to be lower than OSC. For clarification, distribution of the total vertical stress acting on granular columns and soft soil obtained after the monitoring time is presented in Figure It is clearly seen that the use of geosynthetic-equivalent friction angel reduced the total vertical stress in soft clay and inversely increased the total vertical stress in granular columns. This behaviour confirms that using encasement caused the granular columns to sustain more load and then due to soil arching less vertical stress generated in soft clay at the same depth where piezometers located. Excess pore pressure (kpa) Measured by PZ1 FEA (GEC) FEA (OSC) Time (day) Figure Variations of the measured (PZ1 and PZ2) and computed (FEA) excess pore pressure versus time. Excess pore pressure (kpa) Measured by PZ2 FEA (GEC) FEA (OSC) Time (day) 224

.")
256 (a) vs= kpa Partial arching vc= kpa v (kpa) v (kpa) (b) vs=130 kpa Soil arching zone vc= kpa Figure Distribution of the total vertical stress after monitoring time: (a) using original friction angle of column material (OSC) and; (b) using geosynthetic-equivalent friction angle (GEC) Measured and predicted soil horizontal deformation In Figure 6-30 the measured soil horizontal deformations are compared with the values obtained from the finite element analysis (FEA). Figure 6-30a and Figure 6-30b show distribution of the soil horizontal deformations at the end of construction (i.e. 65 th day) and at the end of monitoring time (i.e. 240 th day), respectively. The comparison indicates that the horizontal deformations increased when consolidation progressed which is also observed by Almeida et al. 225
257 (1985). In the present case the maximum soil horizontal deformation increased from 80 mm measured once after construction to 150 mm measured at the end of monitoring time. The horizontal deformations computed using geosynthetic-equivalent friction angle (GEC) showed reasonable agreement with measurements particularly in the magnitude of the maximum horizontal deformation. However, horizontal deformations computed using original friction angle (OSC) showed maximum values as much as 3 to 5 times greater than the measured values. As seen, the use of geosynthetic-equivalent friction angle (i.e. contribution of geosynthetic stiffness) is critical to compute properly the soil horizontal displacement in plane strain analysis. It is also seen that the soil horizontal deformation in upper 2 m (sand platform) was greater than measured data. This can be due to the actual stiffness of the sand working platform which may be higher than the elastic modulus used in numerical analysis. Horizontal displacement (mm) Horizontal displacement (mm) Sand working platform 1 Sand working platform Soft clay I 5 6 Soft clay I Depth (m) Soft clay II Depth (m) Soft clay II Sand Sand (a) Measured by IN1 Measured by IN2 FEA (GEC) FEA (OSC) Measured by IN1 FEA (GEC) FEA (OSC) (b) Figure Measured and computed (FEA) soil horizontal deformation at embankment toes: (a) just after construction and (b) end of monitoring time. 226
258 Influence of the basal geogrid stiffness Influence of the stiffness modulus of the horizontal geogrid placed below the embankment on settlement and horizontal deformation was investigated numerically in Figure 31, as geogrid stiffness changed between 500, 1500 and 3000 kn/m. It can be seen that an increase in geogrid stiffness modulus caused both settlement and horizontal deformation reduced. However, a greater settlement improvement was expected as stiffer geogrid was used, but there was only 18% of settlement improvement as the geogrid stiffness modulus changed from 500 to 3000 kn/m. The reason can be explained by the existence of a 2.0 m thick of sand working platform placed above the soft clay layer which modified stress transmission below the embankment. The presence of this sand layer resulted in very low mobilized tensile force in the basal geogrid. 0 Time (day) Horizontal deformation (mm) Settlement (mm) (a) J= 3000 kn/m J= 1500 kn/m J= 500 kn/m Depth (m) J= 3000 kn/m J= 1500 kn/m J= 500 kn/m (b) Figure Influence of stiffness modulus of the basal geogrid on: (a) settlement on soil; (b) horizontal deformation below the embankment. This phenomenon has been illustrated for two instrumented reinforced embankments on 2.0 m thick sand working platform in which the mobilized tensile force in the basal reinforcement for the service condition (FS=1.5) was less than 5 kn/m (Magnani et al. 2009). In addition for the failure condition the basal reinforcement was responsible for no more than 3% of the mobilized factor of safety (Fs); whereas the working platform was responsible for at least 56% of the mobilized Fs (Magnani et al. 2010). Therefore, it can be concluded that the use of sand 227

259 working platform above soft clay layer in embankment construction may lead to less effectiveness of the basal geogrid placed below the embankment Assessment of yielding state In order to investigate the elasto-plastic state of granular columns and soft soil, the distribution of the yielding points during loading stages is presented in Figure 6-32 which shows evolution of the plastic points at the end of loading stage 1 as well as at the end of monitoring time. Based on Figure 6-32a, the columns did not yield at the end of loading stage 1, though plastic points can be observed in columns tip. As expected larger applied vertical stress caused the columns to yield since they carried most of the applied stress. Numerical analysis on unencased stone column also showed that the loading increment led the stone column to yield from its top where soil arching occurs (Almeida et al. 2014). Based on the Figure 6-32b (end of monitoring time) it can be seen that whole of the column length installed in soft clay I is in the plastic state. The evolution of the wedge points in plastic state, near the columns tip, is remarkable and progressed into the sand layer following the shear behaviour of the shallow foundations. (a) 228
, results of the test embankment obtained in the")
260 (b) Figure Distribution of the plastic points (a) end of loading stage 1, (b) end of monitoring time (red square: MC plastic point, blue square: SS plastic point) 6.4. Comparison of analytical solution and field measurements In order to verify the applicability of the analytical method (Raithel and Kempfert, 2000), results of the test embankment obtained in the present study were compared with the analytical solution. Raithel and Kempfert s (2000) analytical method was developed assuming drained condition, thus direct comparison (i.e. variations with time) is not possible to be made with the field measurements. Therefore, long-term (i.e. drained) values of the settlement, total vertical stresses, and geosynthetic hoop force are compared with measured data. The analytical calculation was performed assuming a unit cell cylinder consisting of encased granular column and surrounding soft soil. The granular column was 0.8 m in diameter, installed in an average 2.0 m center to center spacing (average spacing at the central area of the test embankment) in a square pattern (a c = 0.125). A 7.0 m thick homogenous soft clay was modeled representing the equivalent thickness of soft clay I and soft clay II at the central area of the test 229
261 embankment. It was also assumed that the whole system rests on the firm strata. Since the analytical method is not able to simulate the soil profiling, the sand working platform was not modeled. The material properties adopted for the hypothetical soft clay were as same as the soft clay I. The unit cell was then loaded on top surface up to 150 kpa, embankment equivalent total applied stress, and the results were compared with field measurements. Table 6-5 shows the parameters of encased granular column and soft clay used in the analytical analysis of the test embankment. a c (-) Table 6-5. Material properties used in analytical analysis of the test embankment (r c =r geo ). r c (m) J (kn/m) E oed, s (kpa) c s (kpa) s ( o ) c ( o ) s (kn/m 3 ) c (kn/m 3 ) /1.0 K 0,s (-) pref (-) / m Computed surface settlement The variations of the surface settlement with applied vertical stress computed analytically are shown in Figure As expected the settlement increased as total vertical stress, embankment height, increased. It is seen that the maximum settlement at the total vertical stress level of 150 kpa, equivalent to the embankment applied stress, is around 595 mm which is relatively close to the 525 mm settlement measured at the end of monitoring time. Unlike the field measurements, the analytical method computed a homogenous constant settlement on the top of the soft soil and encased column. Thus, the differential settlement occurring on the top surface of the unit cell, below the embankment, is not possible to be computed analytically. 230
262 Applied vertical stress (kpa) Settlement (mm) Figure Variation of settlement versus applied stress computed analytically Computed total vertical stresses Analytical results for the total vertical stresses acting above the encased granular column and surrounding soil is shown in Figure It can be seen that both the total vertical stresses above the surrounding soil and encased column increased by applied vertical stress (increase in embankment height). A direct comparison between the field measurements and the analytical method indicated that the magnitude of the computed total vertical stress acting on the top of the encased granular is greater than the total vertical stress measured at the end of monitoring time. In contrast, at the same applied vertical stress level, the computed total vertical stress acting on the top of the surrounding soil was much less than the measured total vertical stress. The reason is because of the field data correspond to the vertical stress measured on the top of the sand working platform, however the computed values represent the vertical stress on the top of the soft clay. Unlike the analytical solution, the numerical analysis can be used to model any circumstance of the soil profiling as described earlier. The same occurs for the geosynthetic tensile force since the extensometers were attached to the geotextile encasement surrounded by the sand working platform leading the less tensile force to mobilize in comparing with the analytical method. 231
263 0 Applied vertical stress (kpa) Total vertical stress (kpa) σv,s σv,c 1200 Figure Variation of total vertical stress versus applied stress computed analytically Stability analysis of the test embankment Stage construction is a common method employed for high embankments. The consolidation of the foundation following each stage of construction increases progressively the shear strength of the foundation (Almeida, 1984). Assessment of the stability for each loading stage is an important aspect in the design of such structure. In order to verify the stable performance of the test embankment, a stability analysis (c -phi reduction) was performed to evaluate the factor of safety of the test embankment at each stage of the loading. The plane strain numerical model of the test embankment shown in Figure 6-24 was used and the factors of safety have been computed at two instants: just after loading stages and at the end of consolidation interval (i.e. just before next loading). Stability analysis for the test embankment is summarized in Figure 6-35 in plots of the factor of safety against the height of embankment. It is seen that the minimum factor of safety is reached just after each loading stage was placed when the maximum excess pore pressure is reached in soft clay layer (below the embankment centerline) as shown in Figure Upward arrows for the constant height of embankment denote increase of factors of safety during consolidation interval following the loading stage, as expected. This is due to increase in shear 232

264 strength of the soft clay due to dissipation of excess pore pressure below the embankment centerline (see Figure 6-37). Irrespective of loading stage 4, the larger improvement in the factor of safety is seen in loading stage 3 when had the longest consolidation interval compared to loading stages 1 and 2. The pattern shown in Figure 6-35 is similar to that observed by Almeida et al. (1985) for an embankment built in four stages but taken to failure in the fifth stage Just after loading After consolidation 2.2 FS (-) Embankment height (m) Figure Computed safety factor of the test embankment during construction and consolidation stages. u (kpa) Figure Distribution of the excess pore pressure just after loading stage

265 u (kpa) Figure Distribution of the excess pore pressure at the end of monitoring time Computed settlement improvement factor for the test embankment In order to assess the effectiveness of the geosynthetic encased granular columns in settlement reduction, the settlement improvement factor ( ) is computed by the ratio of the settlement of the un-improved soft ground ( h ) to the settlement of the GEC improved soft ground ( himp ) as follows: h h imp (6-9) Settlement improvement factor was computed numerically by finite element analysis of the test embankment on GEC improved and un-improved soft ground. Drained (long-term) analysis was performed to assess the maximum value of the settlement in each case analyzed. Table 6-6 summarizes the maximum settlement obtained from the axi-symmetric analysis of the test embankment. Results of the plane strain analysis are not presented as failure occurred. Figure 6-38 compares value of the settlement improvement factor computed for the test embankment (red mark) with the values obtained from previous studies with same area replacement ratio (a c = 0.125). It can be seen that the computed settlement improvement factor predicted well the values obtained from practical applications of GEC using similar geosynthetic stiffness (J= kn/m) and the area replacement ratio of a c = 12.5 %. 234
266 Table 6-6. Computed settlement of the test embankment on GEC improved and un-improved soft ground. Case considered Axi-symmetric analysis Settlement of improved ground, h imp (m) Settlement of un-improved ground, h (m) Settlement improvement factor, (-) Figure Comparison of the settlement improvement factor for the test embankment with previous researches (a c = 12.5% and J= 1750 kn/m) Final remarks The finite element analysis of the test embankment was presented in this chapter and the results were compared with the field measurements. In general, finite element analysis was found to predict well the measured data particularly in terms of the settlement and total vertical stresses. The analytical method was also compared with measurements and the sensitivity analysis was then carried out by varying in some important parameters. The main specific results of the present chapter are mentioned below: 235
267 According to the numerical results, the geomechanical model and clay parameters obtained from the site investigation were reliable for settlement and stress computations of the geotextile encased column supporting test embankment. Overall the most appropriate prediction of the measured data was achieved for the columns spacing equal to S= 2.0 m, the average columns spacing in the central area of the test embankment. Numerical results showed that the largest columns spacing (S= 2.25 m) caused the stress concentration increased comparing with the smallest columns spacing (S= 1.75 m). Numerical results illustrated that the sand working platform placed above the soft clay layer caused the stress concentration measured below the embankment to be lower than expected. However, a stress concentration around 9 was found numerically at the level of the soft clay surface. Unlike the numerical analysis, the analytical solution computed a homogenous settlement below the embankment. The analytical solution also calculated a unique ring tensile force constant along the column length. The numerical results, however, illustrated that the ring tensile force varied in accordance with the shear band occurring in the granular column. Parametric analysis showed that the geosynthetic encasement reduced significantly the settlement below the embankment and increased the stress concentration. But the influence of geosynthetic on settlement improvement gradually reduced for stiffness modulus higher than J = 2000 kn/m for the cases analyzed. The computed settlement improvement factor of the test embankment was in good agreement with the available data basis. 236
268 7. Conclusions and Recommendation for Future Studies 7.1. Introduction The present work investigated the behaviour of geotextile encased granular columns in soft deposit under embankment loading. The test area was part of a large ore/coal stockyard which was partially stabilized with geotextile encased granular columns. This research aimed to assess the overall performance of the stockyard foundation and also to provide significant data for the later use of the GECs soft ground treatment method. Apart from the field loading test, a comprehensive literature review was presented including the most important experimental investigations, numerical analyses, and analytical methods. An extensive site investigation was also carried out aiming to define the geotechnical characteristics of the soft deposit. Additionally, numerical and analytical analyses were performed in order to assess the capabilities and limitations of both tools for practical applications. The following sections provide the most significant findings achieved in the present research Site investigation Geotechnical parameters of the soft clay in the test area were obtained from the suitable combination of the in situ and laboratory tests as described in details in chapter 3. Considering that the site investigation was carried out in 2012, and column installation occurred in 2008, the soil parameters obtained post-column installation is quite representative, as they were not affected by the column installation. The main significant results obtained from the site investigation were: Results of the oedometer consolidation tests showed that the soft clay studied had a high compressibility index, with an average compression ratio CR equal to 0.3. Thus, significant settlement and horizontal displacement were expected to occur as a result of construction on the test area. A bi-linear relationship was found to correlate variation of the oedometer modulus E oed with the effective vertical stress. Additionally, the coefficient of vertical permeability was estimated to change with voids ratio during oedometer tests resulting in a logarithmic slope C k equal to
269 SPT and CPTu tests complemented each other appropriately and the same can be said of the undrained strength obtained from VSTs, CPTu, and CAU triaxial tests. Undrained strength obtained from CPTu dissipation data (Mantaras et al. 2014) also showed good agreement with those measured from other test methods. Low values of S u (less than 20 kpa) implied a very soft behaviour, particularly in the top 7 m where soft clay I exists. Empirical cone factors were determined by correlating vane and piezocone tests data. An average value of N kt =13 was obtained for the depth z< 6.5 m, while a linear relationship of N kt = 6.5z was found for depths greater than 6.5 m. The average values of the cone factors N ke and N u were 11 and 4.8, respectively. The over-consolidation profile was obtained by the oedometer consolidation tests as well as the equations proposed by Chen and Mayne (1996). The results showed a good agreement in terms of the OCR profiles when the equation constants were divided by two, as suggested by Baroni and Almeida (2012) for the Barra da Tijuca soft clay. The coefficients of consolidation obtained by oedometer and CPTu tests also complemented each other well resulting to provide the average profiles of coefficients of vertical and horizontal consolidation Field measurements This section summarizes the instrumentation results for the test embankment on soft deposit improved by geotextile encased granular columns in which the overall applied embankment stress was 150 kpa. The main findings obtained from the instrumentation are presented as follows: Unlike the analytical solution (Raithel and Kempfert, 2000), a differential settlement was observed between the top of the encased column and the surrounding soil due to soil arching induced by the embankment fill, with settlements measured on the top of the encased column and surrounding soil equal to 431 mm and 524, respectively. Similarly to the total settlement, the differential settlement increased as the embankment height increased and also when consolidation progressed. 238
270 Horizontal deformations of the foundation soil, as measured by inclinometers, showed that the maximum soil horizontal displacement occurred in the middle of soft clay I. It was also observed that the horizontal displacement increased continuously as excess pore pressure dissipated. The ratios between the maximum horizontal displacement and the maximum settlement were of 0.16 and 0.20 for each inclinometer, which were relatively constant through loading and consolidation stages. The total vertical stresses measured on the top of the encased column and the surrounding soil increased notably just after each layer was placed. It was observed that the total vertical stress acting on the top of the encased columns increased as consolidation progressed. Inversely, the total vertical stress acting on surrounding soil (midpoint between the columns) remained about constant with a slight decreasing trend. This behaviour can be attributed to the decrease in apparent stiffness of surrounding soil from quasi undrained stiffness to drained stiffness during consolidation. The stress concentration resulting from the soil arching caused the total vertical stress transmitted to the encased columns to be 2.3 times higher than the total vertical stress acting on the surrounding soil. The variation of the maximum soil distortion was correlated with the maximum horizontal displacement normalized with the embankment height. It was concluded that irrespective of soil treatment implementation, the maximum distortion varied about linearly with the normalized maximum soil horizontal displacement. Maximum excess pore pressure was observed at the middle of the soft clay due to the longest drainage path. Incremental excess pore pressure generated in loading stages ( u) was compared with the total vertical stress supported by surrounding soft soil ( vs ). The ratio of u/ vs during loading reached a maximum value equal to 0.91 at loading stage 2 and then decreased in loading stages 3 and 4. This continuous decrease in the last two stages was in accordance with the continuous measured increase of the arching effect, the columns thereby attracting more load than the soft soil. Variations of the column diameter (or geotextile expansion) were measured using diameter extensometers attached to the geotextile casing at a depth 1.0 m below the column top. It was observed that the geotextile expansion increased notably upon placing of each layer and 239
271 then continued increasing during post-construction. The increase became slower as consolidation progressed, tending to final asymptote about three months after the end of construction. Further geotextile expansion might have caused greater confining stress on the encased column thus increasing post-construction soil arching. It was observed that the geotextile expansion increased linearly with the maximum settlement resulting in ratios equal to 4% and 3% during construction and post-construction, respectively. An average value of geotextile expansion measured by extensometers was also used to determine the ring tensile force mobilized in the geotextile encasement. It was found that the mobilized ring tensile force at the end of monitoring time was equal to 33.6 kn/m, around 35% of the maximum ring tensile force of the geotextile encasement (available after application of safety factors). The normalized ring tensile force (T mob /T max ) was correlated with the maximum soil distortion. It was observed that for the present stage-constructed embankment the normalized ring tensile force varied about linearly with the soil maximum distortion resulting in a uniform slope equal to 6. In general GECs stabilized soft ground under the test embankment, with a total applied vertical stress equal to around 150 kpa, showed satisfactory overall performance with maximum vertical and horizontal displacements respectively equal to around 500 and 160 mm, and pore pressure and settlement almost complete stabilized six months after the final loading stage was applied. Vertical and horizontal displacements measured in the present study were compared with those obtained from the reinforced test embankment TE1 (Magnani, 2006). The TE1 was built on similar soft clay, treated with prefabricated vertical drains. The comparison indicated that the geosynthetic encased granular columns reduced substantially both the settlement and soil horizontal deformation, and increased notably the load carrying capacity of the soft foundation. It was observed that, at the same settlement of 500 mm, the GECs caused the load carrying capacity to increase as much as 2.5 times that of the TE1. It was also concluded that the use of GECs resulted in a virtual settlement improvement factor around 4, assuming that the soft clay deposits are very similar. 240
272 7.4. Numerical and analytical studies Results of the axi-symmetric and plane strain analyses were compared with the field measurements. The axi-symmetric analysis was performed using the unit cell approach and the plane strain analysis was carried out using transformed granular columns with geosyntheticequivalent friction angle. Sensitivity analyses were also conducted and direct comparison was made between the results of numerical and analytical methods. The main results obtained from numerical and analytical studies are summarized below: The results of the finite element analysis showed satisfactory agreement with the field measurements, particularly in terms of settlement and total vertical stresses. It can be concluded that the geomechanical model and soil parameters used in the numerical analysis were adequate for settlement and stress computations of the geotextile encased column supporting a test embankment. Numerical results showed that the sand working platform placed above the soft clay layer caused the stress concentration factor measured below the embankment to be lower than expected. Results of the numerical analysis also showed a stress concentration factor around 9 at the level of the soft clay surface. Both measured and computed pore pressures predicted well the expected behavior of the stage-constructed embankment. However, FEA showed faster dissipation compared with the measured data. This difference could be due to the actual columns layout in the test area. The localized larger spacing between the columns in the central area of the test embankment, where piezometers are installed, could be the reason for slower dissipation of pore pressure obtained from the measurement compared with the FEA. Influence of the casing stiffness in plane strain simulation was simulated by the use of the geosynthetic-equivalent friction angle of the column material. This resulted in reasonably good agreement with measured deformations and total vertical stresses, indicating that geosynthetic stiffness is a critical parameter for enhancing the accurate performance of the treated ground. 241
273 Variation of the basal geogrid stiffness in plane strain analysis showed that, stiffer geogrid enhanced the soil arching development leading the total vertical stress on the column to increase and inversely reduced the vertical stress in soft clay. It was also found that the use of sand working platform above the soft clay modifies stress distribution since settlement and horizontal deformation below the embankment were not very sensitive to varying geogrid stiffness. Results of the analytical method (AM) showed a good agreement in general with the finite element analysis (FEA). However, unlike the AM, the FEA results indicated that the settlement was not the same for the soft soil and the encased column. Parametric analyses showed that the influence of the geosynthetic encasement in settlement reduction was enhanced with decreasing soft soil thickness. Furthermore, it was observed that the influence of geosynthetic on settlement gradually reduces for geosynthetic stiffness higher than J = 2000 kn/m for the cases analyzed. Magnitude of maximum tensile force obtained by the FEA compared well with the AM. However, while AM determined a constant value along the depth, tensile forces in the FEA varied with depth, showing dilating zones in the GEC associated with maximum tensile forces. The results showed that for un-encased column (J = 0) the stress concentration factor did not change with soft-soil thickness while, for an encased column the stress concentration factor increased with the increase in geosynthetic stiffness and also with the decrease in the thickness of soft soil. The results of the FEA showed that the differential settlement (DS) at the top of the embankment decreased as the embankment height increased and became zero at a given embankment height corresponding to full arching. This was the critical embankment height as a function of the span between the columns and the column diameters and was smaller than the critical height for the piled embankment. This difference was expected as the pile elements are more rigid than the encased columns, thus, with the same area ratio the critical height of the piled embankments was expected to be higher than the embankments on encased columns. 242
274 7.5. Recommendation for future studies Some suggestions for future researches with emphasis on geosynthetic encased granular columns are presented below: Centrifuge modeling to study the effects of the area replacement ratio and geosynthetic stiffness modulus on the settlement improvement factor; Centrifuge modeling to investigate the influence of the sand working platform and basal geogrid on the performance of the composite ground; Numerical analysis of the test embankment in order to study the combined influence of the working platform and basal reinforcement in response of the GECs composite soft ground; Three dimensional numerical analysis of the test embankment and comparison with two dimensional axi-symmetric and plane strain numerical analyses; Numerical analysis to study the influence of the column installation method on performance of the GECs composite ground. 243
275 LIST OF REFERENCES AASHTO., 1984, "Standard method for measurement of pore pressures in soils", American Association of State Highways and Transportation Officials. T252-84, pp AASHTO., 1978, "Standard method for installing, monitoring, and processing data of the travelling type slope inclinometer", American Association of State Highways and Transportation Officials. T254-78, pp ABOSHI, H., ICHIMOTO, E., ENOKI, M., HARADA, K., 1979, "The composer-a method to improve characteristics of soft clays by inclusion of larger diameter sand columns", In Proceeding of International Conference on Soil Reinforcement: Reinforced Earth and Other Techniques, Paris, France, v. 1, pp AGUIAR, V.N., 2008, "Consolidation characteristics of soft clay in Port of Santos in Barnabé Island Region", Master Thesis, COPPE/UFRJ, Rio de Janeiro, Brazil (In Portuguese). ALEXIEW, D., 2002, "Piled embankment design: methods and case studies", In Proceeding of XV Italian Conference on Geosynthetics, Bologna, Italy, Special Issue, pp ALEXIEW D., BROKEMPER D., LOTHSPEICH S., 2005, "Geotextile encased columns (GEC): Load capacity, geotextile selection and design graphs", In Proceeding of Geo- Frontiers Conference, Austin, Texas, pp ALEXIEW, D., MOORMANN, C, 2009, "Foundation of a coal/coke stockyard on soft soil with geotextile encased columns and horizontal reinforcement", 17 th International Conference on Soil Mechanics and Geotechnical Engineering, Alexandria, Egypt, CD-ROM. ALEXIEW, D., RAITHEL, M., KUSTER, V., DETERT, O, 2012, "15 years of experience with geotextile encased granular columns as foundation system" ISSMGE - TC 211 International Symposium on Ground Improvement (IS-GI), Brussels, CD-ROM. ALEXIEW, D., SOBOLEWSKI, J., POHLMANN, H., 2000, "Projects and optimized engineering with geogrids from non-usual polymers", In Proceeding of 2 nd European Geosynthetics Conference, Bologna, pp ALMEIDA, M.S.S., 1984, "Stage constructed embankments on soft clays", Doctoral Thesis, Cambridge University, England. 244
276 ALMEIDA, M.S.S., 1998, "Site characterization of a lacustrine very soft Rio de Janeiro organic clay", In Proceeding of International Soil Mechanics Conference, Atlanta, USA, v. 2, pp ALMEIDA, M.S.S., DAVIES, M.C.R., PARRY, R.H.G., 1985, "Centrifuge tests of embankments on strengthened and unstrengthened clay foundations", Geotechnique, v. 35, n. 4, pp ALMEIDA, M.S.S., FERREIRA, C.A.M., 1992, "Field, in situ, and laboratory consolidation parameters of a very soft clay", Predictive soil mechanics. In: Wroth Memorial Symposium, Oxford, pp ALMEIDA, M.S.S., HOSSEINPOUR, I., RICCIO, M., 2013, "Performance of a geosyntheticencased column (GEC) in soft ground: numerical and analytical studies", Geosynthetics International, v. 20, n. 4, pp ALMEIDA, M.S.S., HOSSEINPOUR, I., RICCIO, M., ALEXIEW, D., 2015, "Behaviour of geotextile-encased granular columns supporting test embankment on soft deposit", Geotechnical and Geoenvironmental Engineering, v. 141, n. 3, /(ASCE)GT ALMEIDA, M.S.S., LIMA, B., RICCIO, M., JUD, H., CASCAO, M., ROZA, F., 2014, "Stone columns field test: monitoring data and numerical analyses", Geotechnical Engineering Journal of the SEAGS & AGSSEA, v. 45, n. 1, pp ALMEIDA, M.S.S., MARQUES, M., 2013, "Design and performance of embankments on very soft soils", Taylor and Francis, London, UK. ALMEIDA, M.S.S., MARQUES, M.E.S., BARONI, M., 2010, "Geotechnical parameters of very soft clays obtained with CPTU compared with other site investigation tools", International Symposium on Cone Penetration Testing, CPT'10, Huntington Beach, California, USA, CD- ROM. ALI, K., SHAHU, J.T., SHARMA, K.G., 2012, "Model tests on geosynthetic-reinforced stone columns: a comparative study", Geosynthetics International, v. 19, n. 4, pp ALI, K., SHAHU, J.T., SHARMA, K.G., 2014, "Model tests on single and groups of stone columns with different geosynthetic reinforcement arrangement", Geosynthetics International, v. 21, n. 2, pp
277 ARAUJO, G.L.S., PALMEIRA, E.M., CUNHA, R.P., 2009, "Behaviour of geosynthetic-encased granular columns in porous collapsible soil", Geosynthetics International, v. 16, n. 6, pp ASTM-D1586., 2011, "Standard test method for standard penetration test (SPT) and split-barrel sampling of soils", American Standard of Testing Material, US. ASTM-D2573, 2008, "Standard test method for vane shear test in cohesive soil", American Standard of Testing Material, US. ASTM-D4767., 2011, "Standard test method for consolidated undrained triaxial compression test for cohesive soils", American Standard of Testing Material, US. ASTM-D5778., 2012, "Standard test method for electronic friction cone and piezocone penetration testing of soils", American Standard of Testing Material, US. AYADAT. T., HANNA, A.M., 2005, "Encapsulated stone columns as a soil improvement technique for collapsible soil", Ground Improvement, v. 9, n. 4, pp BALAAM, N.P., BOOKER, J.R., 1981, "Analysis of rigid rafts supported by granular piles.", Int. Journal for Numerical and Analytical Methods in Geomechanics, V. 5, pp BALASUBRAMANIAN, A.S., CHAUDHRY, A.R., 1978, "Deformation and strength characteristics of soft Bangkok clay", Geotechnical Engineering, v. 104, n. 9, pp BARKSDALE, R.D., BACHUS, R.C., 1983, "FHWA: design and construction of stone columns", Report FHWA/RD-83/027. Federal Highway Administration. BARKSDALE, R.D., TAKEFUMI, T., 1991, "Design, construction and testing of sand compaction piles", In Esrig, M.I. & Bachus, R.C. (Editors), Deep Foundation Improvements: Design, Construction and Testing, ASTM Special Technical Publication 1089, Baltimore, American Society for Testing and Materials, pp BARONI, M., 2010, "Geotechnical investigation of soft soils of Barra da Tijuca, with emphasis of in situ tests", Master Thesis, COPPE/UFRJ, Rio de Janeiro, Brazil (In Portuguese). BARONI, M., ALMEIDA, M.S.S., 2012, "In situ and laboratory parameters of extremely soft organic clay deposits", International Conference on Geotechnical and Geophysical Site Characterization ( ISC 4), Porto de Galinhas, Brazil, CD-ROM. BARRON, R.A., 1948, "Consolidation of fine-grained soils by drain wells", Transactions, ASCE, v. 113, pp
278 BEZERRA, R.L., 1996, "Development of third generation of piezocone at COPPE/UFRJ", Doctoral Thesis, COPPE/UFRJ, Rio de Janeiro, Brazil (In Portuguese). BJERRUM, L., 1973, "Problems of soil mechanics and construction on soft clays", In: ISSMGE, 8th International Conference on Soil Mechanics and Foundation Engineering, Moscow, Russia, vol. 3, pp BLACK, A., SIVAKUMAR, V., MADHAV, M.R., HAMILL, G.A., 2007, "Reinforced stone columns in weak deposits: laboratory model study", Geotechnical and Geoenvironmental Engineering, v. 133, n. 9, pp BRIAUD, J.L., 2013, "Geotechnical engineering, unsaturated and saturated soils", John Willy and Sons, New Jersey, US. BRINKGREVE, R.B.J., Vermeer, P.A., 2012, "PLAXIS: Finite Element Code for Soil and Rock Analyses". CAMPANELLA, R.G., GILLESPIE, D., ROBERTSON, P.K., 1982, "Pore pressure during cone penetration testing", In Proceedings Second European Symposium on Penetration Testing, vol. 2, pp CASTRO, J., SAGASETA, C., 2011, "Deformation and consolidation around encased stone columns", Geotextiles and Geomembranes, v. 29, pp CHANDLER, R.J., 1988, "The in situ measurement of the undrained shear strength of clays using the field vane", A.F. Richards (ed.) ASTM STP 1014, Philadelphia, pp CHEN, B.S., MAYNE, P.W., 1996, "Statistical relationships between piezocone measurements and stress history of clays", Canadian Geotechnical Journal, v. 33, pp COUTINHO, R.Q., 1986, "Failure analysis of an experimental embankment on instrumented soft ground", Doctoral Thesis, COPPE/UFRJ, Rio de Janeiro, Brazil (In Portuguese). COUTINHO, R.Q., 2007, "Characterization and engineering properties of Recife soft clays", In Characterization and Engineering Properties of Natural Soils. Taylor & Francis, London, v. 3, pp DANZIGER, F.A.B., 1990, "Development of an equipment for piezocone tests: application to soft clays", Doctoral Thesis, COPPE/UFRJ, Rio de Janeiro, Brazil (In Portuguese). DANZIGER, F.A.B., ALMEIDA, M.S.S., SILLS, G.C., 1997, "The significance of the strain path analysis in the interpretation of piezocone dissipation data", Geotechnique, v. 47, n. 5, pp
279 DANZIGER, F.A.B., SCHNAID, F., 2000, "Piezocone test: procedure, recommendations and interpretations", SEFE IV, BIC, v. 3, pp DASH, S.K., BORA, M.C., 2013, "Influence of geosynthetic encasement on the performance of stone columns floating in soft clay", Canadian Geotechnical Journal, v. 50, pp DUNCAN, J.M., BYRNE, P., WONG, K.S., MABRY, P., 1980, "Strength, stress strain and Bulk modulus parameters for finite element analyses of stresses and movements in soil masses", Geotechnical Engineering Report No. UCB/GT/80-01, submitted to the University of California, Berkeley. EBGEO., 2010, "Recommendations for design and analysis of earth structures using geosynthetic reinforcements", German Geotechnical Society (DGGT), Berlin, Germany. ELSAWY, M.B.D., 2013, "Behaviour of soft ground improved by conventional and geogridencased stone columns, based on FEM study", Geosynthetics International, v. 20, n. 4, pp FILZ, G.M., SMITH, M.E., 2006, "Design of bridging layers in geosynthetic-reinforced, column-supported embankments", Report VTRC 06-CR12, Virginia Transportation Research Council, Charlottesville. FLEMING, W.G.K., WELTMAN, A.J., RANDOLPH, M.F., ELSON, W.K., 1992, "Piling Engineering", (2nd ed.). Blackie, Glasgow, imprint of John Wiley & Sons, New York (Pub). FUTAI, M.M., ALMEIDA, M.S.S., LACERDA, W., MARQUES, M.E.S., 2008, "Laboratory behaviour of Rio de Janeiro soft clays. Index and compression properties", Soils and Rocks, v. 31, n. 2, pp GHIONNA, V., JAMIOLKOWSKI, M., 1981, "Colone di ghiaia" (in Italian), X Ciclo di conferenze dedicate ai problemi di meccanica die terreni e ingegneria delle fondazioni metodi di miglioramento deo terreni, Politecnico di Torino Ingegneria, atti dell istituto di scienza delle costruzioni, n GNIEL, J., BOUAZZA, A, 2009, "Improvement of soft soils using geogrid encased stone columns", Geotextiles and Geomembranes, v. 27, pp GNEIL, J., BUAZZA, A., 2010, "Construction of geogrid encased stone columns: A new proposal based on laboratory testing", Geotextiles and Geomembranes, v. 28, n. 1, pp
280 GREENWOOD, D.A., 1970, "Mechanical improvement of soils below ground surface", In Proceeding of Ground Engineering Conference, Institution of Civil Engineers, London, pp GREENWOOD, D.A., 1991, "Load tests on stone columns", In Esrig, M.I. & Bachus, R.C. (Editors), Deep Foundation Improvements: Design, Construction and Testing, ASTM Special Technical Publication 1089, Baltimore, American Society for Testing and Materials (Pub), pp HAN, J., 2010, "Consolidation settlement of stone column-reinforced foundations in soft soils" In: Almeida, M.S.S. (ed.), New techniques on soft soils, Guaruja, Brazil. Sao Paulo, Oficina de Textos, pp HAN, J., YE, S.L., 2001, "Simplified method for consolidation rate of stone column reinforced foundations", Geotechnical and Environmental Engineering, v. 127, n. 7, pp HOSSEINPOUR, I., RICCIO, M., ALMEIDA, M.S.S., 2014, "Numerical evaluation of a granular column reinforced by geosynthetics using encasement and laminated disks", Geotextiles and Geomembranes, v. 42, n. 4, pp HOULSBY, G.T., TEH, C.I., 1988, "Analysis of the piezocone in clay", Proc., ISOPT-1, Orlando, v. 2, pp HUGHES, J.M.O., WITHERS, N.J., 1974, "Reinforcing of soft soils with stone columns", In: Ground Engineering, v. 1, n. 3, pp HUGHES, J.M.O., WITHERS, N.J., Greenwood, D.A., 1975, "A field trial of the reinforcing effect a stone column in soil", Geotechnique, v. 25, n. 1, pp ICHIMOTO, E., SUEMATSU, N., 1981, "Sand compaction pile method (Technical Report)", Fudo Construction Co., Japan. INDRARATNA, B., BAMUNAWITA, C., KHABBAZ, H., 2004, "Numerical modeling of vacuum preloading and field applications", Canadian Geotechnical Journal, v. 41, n. 6, pp INDRARATNA, B., REDANA, I.W., 1997, "Plane-strain modeling of smear effects associated with vertical drains", Geotechnical and Geoenvironmental Engineering, v. 123, n. 5, pp
281 JAMIOLKOWSKI, M., LADD, C.C., GERMAINE, J.T., LANCELLOTTA, R., 1985, "New developments in field and laboratory testing of soils", 11th international Conference of Soil Mechanics and Foundation Engineering, San Francisco, v. 1, pp JAMIOLKOWSKI, M., Lo PRESTI, D.C.F, PALLARA., 1995, "Role of in situ testing in geotechnical earthquake engineering", 3rd conference on recent Advances in Geotechnical Earthquake Engineering and Soil Dynamics, State of the Art, Report 7, v. 3, pp JANNUZZI, G.M.F., 2009, "Characterization of the soft soil deposit of Sarapuí II using Field tests", Master Thesis, COPPE/UFRJ, Rio de Janeiro, Brazil (In Portuguese). JURAN, I., GUERMAZI, A., 1988, "Settlement response of soft soils reinforced by compacted sand columns", Geotechnical Engineering, pp KEMPFERT, H.G., 1996, "Embankment foundation on geotextile-coated sand columns in soft ground", In Geosunthetics: Application, Design and Construction- Proceeding of the 1 st European Geosynthetics Conference. Netherlands, Balkema, pp KEMPFERT, H.G., JAUP, A., RAITHEL, M., 1997, "Interactive behavior of a flexible reinforced sand column foundation in soft soils", In: ISSMGE, 14 th International Conference on Soil Mechanics and Geotechnical Engineering, Hamburg, Germany, pp KEMPFERT, H.G., MÖBIUS, W., WALLIS, P., RAITHEL, M., GEDUHN, M., MCCLINTON, R.G., 2002, "Reclaiming land with geotextile encased columns", Geotechnical Fabrics Report, v. 20, n. 6. KEMPFERT, H.G., RAITHEL, M., 2002, "Experiences on dike foundations and landfills on very soft soils", International Symposium on Soft Soils Foundation Engineering, Mexico, CD-ROM. KEYKHOSROPUR, L., SOROUSH, A., IMAM, R., 2012, "3D numerical analyses of geosynthetic encased stone columns", Geotextiles and Geomembranes, v. 35, pp KHABBAZIAN, M., KALIAKIN, V.N., MEEHAN, C.L., 2010, "Numerical study of the effect of geosynthetic encasement on the behaviour of granular columns", Geosynthetics International, v. 17, n. 3, pp KIRSCH, K., KIRSCH, F., 2010, "Ground Improvement by deep vibratory methods", Spon Press, Adingdon Oxon (Pub). KITAZUME, M., 2005, "The sand compaction pile method", Taylor & Francis. 250
282 LACERDA, W.A., ALMEIDA, M.S.S., 1995, "Engineering properties of regional soils: residual soils and soft clays", In: Proceedings of the X PCSMFE, State-of-the art lecture, Mexico. LADD, C.C., DE GROOT, D.J, 2003, "Recommended practice for soft ground site characterization", In: Proceedings of the 12th PanAmerican Conference on Soil Mechanics and Geotechnical Engineering, Boston. LEE, D., YOO, C., PARK, S., 2007, "Model tests for analysis of load carrying capacity of geogrid encased stone column", In Proceeding of 17th International Offshore and Polar Engineering Conf., International Society of Offshore and Polar Engineers (ISOPE), Cupertino, CA, pp LIMA, B.T., 2012, "Use of stone columns is soft clay deposits", Doctoral Thesis, COPPE/UFRJ, Rio de Janeiro, Brazil (In Portuguese). LUNNE, T., ROBERTSON, P.K., POWELL, J.J.M., 1997, "Cone penetration testing in geotechnical practice", Blackie Academic & Professional. MAGNANI, H.O., 2006, "Behaviour of test embankment on soft clay taken to the failure", Doctoral Thesis, COPPE/UFRJ, Rio de Janeiro, Brazil (In Portuguese). MAGNANI, H.O., EHRLICH, M., ALMEIDA, M.S.S., 2009, "Behaviour of two reinforced test embankments on soft clay", Geosynthetics International, v. 16, n. 3, pp MAGNANI, H.O., EHRLICH, M., ALMEIDA, M.S.S., 2010, "Embankments over soft clay deposits: contribution of basal reinforcement and surface sand layer to stability", Geotechnical and Geoenvironmental Engineering, v. 136, n. 1, pp MALARVIZHI, S.N., ILAMPARUTHI, K., 2007, "Comparative study on the behavior of encased stone column and conventional stone column", Soils and Foundations, v. 47, n. 5, pp MANTARAS, F.M., ODEBRECHT, E., SCHNAID, F., 2014, "Using piezocone dissipation test to estimate the undrained shear strength in cohesive soil', CPT 14, 3rd International Symposium on Cone Penetration Testing, Las Vegas, US, CD-ROM. MARQUES, M.E.S., OLIVEIRA, J.R.M.S., SOUZA, A.I., 2008, "Characterization of a sedimentary soft deposit at Porto Velho", In: ABMS, 14th Brazilian Conference on Soil Mechanics and Foundation Engineering, Rio de Janeiro, Brazil, CD-ROM (In Portuguese). 251
283 MATSUI, T., ODA, K., NABESHIMA, Y., 2001, "Non-linear mechanism and performance of clay-sand column system.", In Proceeding of the Fifteenth International Conference on Soil Mechanics and Geotechnical Engineering, Istanbul, Turkey, v. 3, pp MCGUIRE, M.P., FILZ, G.M., 2008, "Quantitative comparison of theories for geosynthetic reinforcement of column-supported embankments", 1st Pan American Geosynthetics Conference & Exhibition, Cancun, Mexico, CD-ROM. MCGUIRE, M.P., SLOAN, J., COLLIN, J., FILZ, G.M., 2012, "Critical height of columnsupported embankments from bench-scale and field-scale tests", In: ISSMGE TC 211, International Symposium on Ground Improvement IS-GI, Brussels, Belgium, CD-ROM. MCKENNA, J.M., EYRE, W.A., WOLSTENHOLME, D.R., 1975, "Performance of an embankment supported by stone columns in soft ground", Geotechnique, v. 25, n. 1, pp MELLO, L.G., MANDOLFO, M., MONTEZ, F., TSUKAHARA, C.N., BILFINGER, W., 2008, "First use of geosynthetic encased sand columns in South America", 1st Pan American Geosynthetics Conference & Exhibition, Cancun, Mexico. CD-ROM. MESRI, G., 1975, "Discussion on new design procedure for stability of soft clays", Journal of Geotechnical Engineering, v. 101, n. 4, pp MITCHELL, J.K., HUBER, T.R., 1985, "Performance of stone column foundation", Journal of Geotechnical Engineering, v. 111, n. 2, pp MOREIRA, J.E., 1974, "Slope stability of the residual soil", Master Thesis, COPPE/UFRJ, Rio de Janeiro, Brazil (In Portuguese). MURUGESAN, S., RAJAGOPAL, K., 2006, "Geosynthetic encased stone column: numerical evaluation", Geotextiles and Geomembranes, v. 24, n. 6, pp MURUGESAN, S., RAJAGOPAL, K., 2007, "Model tests on geosynthetic encased stone columns", Geosynthetics International, v. 14, n. 6, pp MURUGESAN, S., RAJAGOPAL, K., 2010, "Studies on the behavior of single and group of geosynthetic encased stone column", Geotechnical and Geoenvironmental Engineering, v. 136, n. 1, pp NBR-12131, 1987, "Piles-static load test method", ABNT, Brazilian Association of Technical Standards (In Portuguese). 252
284 NBR-6457, 1986, "Soil samples preparation for consolidation and characterization tests", ABNT, Brazilian Association of Technical Standards (In Portuguese). NBR-6459, 1984, "Determination of liquidity limit", ABNT, Brazilian Association of Technical Standards (In Portuguese). NBR-6508, 1984, "Determination of specific density of the grains", ABNT, Brazilian Association of Technical Standards (In Portuguese). NBR-7181, 1984, "Soil-sieve analysis - test method", ABNT, Brazilian Association of Technical Standards (In Portuguese). NBR-7180, 1984, "Determination of plasticity limit", ABNT, Brazilian Association of Technical Standards (In Portuguese). NBR-7185, 1986, "Determination of the apparent in situ density of sand: test procedure and calculations", ABNT, Brazilian Association of Technical Standards (In Portuguese). NBR-9820, 1997, "Undisturbed soil sampling in low consistency soils", ABNT, Brazilian Association of Technical Standards. OLIVEIRA, J.R.M.S., 1999, "Stability control of test embankment on soft soil", Master Thesis, COPPE/UFRJ, Rio de Janeiro, Brazil (In Portuguese). ORTIGAO, J.A.R., 1980, "Failure analysis of a test embankment on Rio de Janeiro soft clay", Doctoral Thesis, COPPE/UFRJ, Rio de Janeiro, Brazil (In Portuguese). PINTO, C.S., 2000, "Curso basico de mecanica dos solos", Oficina de Textos, Sao Paulo, Brazil (In Portuguese). POOROOSHASB, H.B, MEYERHOF,G.G., 1997, "Analysis of behavior of stone columns and lime columns", Computers and Geotechnics, v. 20, n. 1, pp RAITHEL, M., HENNE, J, 2000, "Design and numerical calculation of a dam foundation with geotextile coated sand columns", Proceeding of the 4th International Conference on Ground Improvement Geosystems, pp.1-8. RAITHEL, M., KEMPFERT, H.G., 2000, "Calculation models for dam foundations with geotextile coated sand columns", Proceeding of GeoEngineering, Melbourne, pp RAITHEL, M., KEMPFERT, H.G., KIRCHNER, A., 2002, "Geotextile encased columns (GEC) for foundation of a dike on very soft soils", Proceeding of 7 th International Conference on Geosynthetics, Nice, France, Balkma, pp
285 RAITHEL, M., KIRCHNER, A., SCHADE, C., LEUSINK, E., 2005, "Foundation of constructions very soft soils with geotextile encased columns-state of the art", Geotechnical Special Publication, Geo-Frontiers, pp RAJAGOPAL, K., BATHURST, R.J., 1993, "User s Manual for Geotechnical Finite Element Modelling (GEOFEM)", Department of Civil Engineering, Royal Military College, Kingston, Ont., Canada. RAJAGOPAL, K., KRISHNASWAMY, N.R., MADHAVI, G.L., 1999, "Behaviour of sand confined with single and multiple geocells", Geotextiles and Geomembranes, v. 17, pp RAJASEKARAN, G., RAO, S.N., 2002, "Compressibility behavior of lime-treated marine clay", Ocean Engineering, v. 29, n. 5, pp RAMPELLO, S., CALLISTO, L., 2003, "Predicted and observed performance of an oil tank founded on soil-cement columns in clayey soils.", Soils and Foundations, v. 43, n. 4, pp RIBAS, J.B.M., 1980, "Evolution of load cell pressure used in COPPE experiences", Master Thesis, COPPE/UFRJ, Rio de Janeiro, Brazil (In Portuguese). RICCIO, M., ALMEIDA, M.S.S., HOSSEINPOUR, I., 2012, "Comparison of two analytical methods for the design of embankments on geosynthetic encased columns", 2nd Pan American Geosynthetics Conference and Exhibition, Lima, Peru, CD-ROM. ROBERTSON, P.K., 1990, "Soil classification using the cone penetration test", Canadian Geotechnical Journal, v. 27, n. 1, pp ROBERTSON, P.K., CABAL, K.L., 2015, "Guide to cone penetration testing for geotechnical engineering", 6 th Edition, Gregg Drilling & Testing Inc. ROBERTSON, P.K., CAMPANELLA, R.G., GILLESPIE, D., GREIG, J., 1986, "Use of piezometer cone data", Proc., In-Situ 86, Specialty Conf., ASCE, Blacksburg, pp ROWE, P.W., BARDEN, L., 1964, "Importance of free ends in triaxial testing", Journal of the Soil Mechanics and Foundation Division, ASCE, v. 90, n. SM1, pp ROZA, F.C., 2012, "Behaviour of stone columns reinforced soft clay", Master Thesis, COPPE/UFRJ, Rio de Janeiro, Brazil (In Portuguese). 254
286 SADEK, M.S., NAJJAR, S.S., MAAKAROUN, T., 2010, "Undrained load response of soft clays reinforced with geosynthetic-encased sand columns", Advances in Analysis, Modeling & Design, GeoFlorida, pp SCHMERTMANN, J.H., 1978, "Guidelines for cone penetration test, performance and design", FHWA, Washington DC, Report FHW-TS, pp SCHNAID, F., 2005, "Geocharacterisation and properties of natural soils by in situ tests", Proceeding of 16th international conference on Soil Mechanics and Geotechnical Engineering, Osaka, v. 1, pp SCHNAID, F., 2009, "In situ testing in geomechanics", Oxon: Taylor and Francis, UK. SCHNAID, F., ODEBRECHT, E., 2012, "In situ testing and their application in foundation engineering", 2nd edition, Sao Paulo, Brazil. SCHNAID, F., SILLS, G.C., SOARES, J.M., NYIRENDA, Z., 1997, "Predictions of the coefficient of consolidation from piezocone tests", Canadian Geotechnical Journal, v. 34, n. 2, pp SHARMA, S.R., PHANIKUMAR, B.R., NAGENDRA, G., 2004, "Compressive load response of granular piles reinforced with geogrids", Canadian Geotechnical Journal, v. 41, pp SHEN, S.L., CHAI, J.C., HONG, Z.S., CAI, F.X., 2005, "Analysis of field performance of embankments on soft clay deposit with and without PVD-improvement", Geotextiles and Geomembranes, v. 23, n. 6, pp SIX, V., MROUEH, H., SHAHROUR, I., BOUASSIDA, M., 2012, "Numerical analysis of elasto-plastic behavior of stone column foundation" Geotechnical and Geological Engineering, v. 30, n. 4, pp SKEMPTON, A.W., NORTHEY, R.D., 1952, "The sensitivity of clays", Geotechnique, v. 3, n. 1, pp SLOPE INDICATOR MANUAL., 2004, "Guide to geotechnical instrumentation", Durham Geo Slope Indicator, Washington, USA. SOARES, M.M., 1981, "Calculation of multi-anchored diaphragm walls in clay soils", Doctoral Thesis, COPPE/UFRJ, Rio de Janeiro, Brazil (In Portuguese). SOARES, J.M.D., 1997, "Geotechnical study of the behavior of soft clay deposit of Porto Alegre", Doctoral Thesis, UFRGS, Porto Alegre, Brazil (In Portuguese). 255
287 SOUZA, H.G., 2014, "New advances on electrical equipment of in situ vane shear test", Master Thesis, COPPE/UFRJ, Rio de Janeiro, Brazil (In Portuguese). TAN, S.A., TJAHYONO, S., OO, K.K., 2008, "Simplified plain-strain modeling of stone column reinforced ground", Geotechnical and Geoenvironmental Engineering, v. 134, n. 2, pp TANDEL Y.K., SOLANKI C.H., DESAI A.K., 2012, "Reinforced stone column: remedial of ordinary stone column", International Journal of Advances in Engineering & Technology, v. 3, n. 2, pp TAVENAS, F., JEAN, P., LEBLOND, P., LEROUEIL, S., 1983, "The permeability of natural soft clays, part II, permeability characteristics", Canadian Geotechnical Journal, v. 20, pp TAYLOR, D.W., 1942, "Research on consolidation of clays", Department of Civil Sanitary Engineering. Massachusetts Institute of Technology, pp TERZAGHI, K., 1943, "Theoretical soil mechanics", John Wiley and Sons, New York, US. VAN IMPE, W., SILENCE, P., 1986, "Improving of bearing capacity of weak hydraulic fills by means of geotextiles", Proceedings of the 3 rd International Conference on Geotextiles, Vienna, Austria, pp WEBER, T.M., SPRINGMAN, S.M., GAB, M., RACANSKY, V., SCHWEIGER, H.F., 2009, "Numerical modeling of stone columns in soft clay under an embankment", 2nd International Workshop on Soft Soils, Glasgow, Scotland, pp YOO, C., KIM, S.B., 2009, "Numerical modeling of geosynthetic-encased stone column reinforced ground", Geosynthetics International, v. 16, n. 3, pp YOO, C., LEE, D., 2012, "Performance of geogrid-encased stone columns in soft ground: fullscale load tests", Geosynthetics International, v. 19, n. 6, pp ZHANG, L., ZHAO, M., 2014, "Deformation analysis of geotextile-encased stone columns", International Journal of Geomechanics, doi: 256
288 ANNEX A Photo documentary of instrumentation, site investigation, and executive drawings 257

289 Assembling of the column diameter extensometer. 258


290 Manufacturing and adaptation of the column diameter extensometer. 259
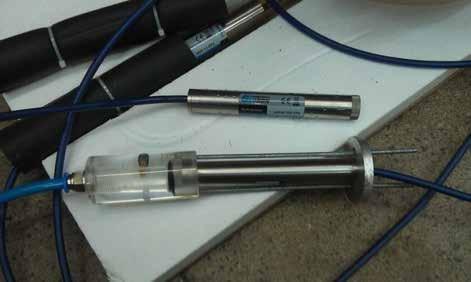
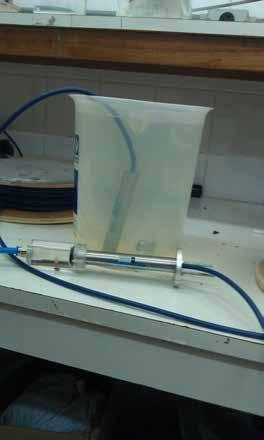
291 Calibration of the piezometer. 260

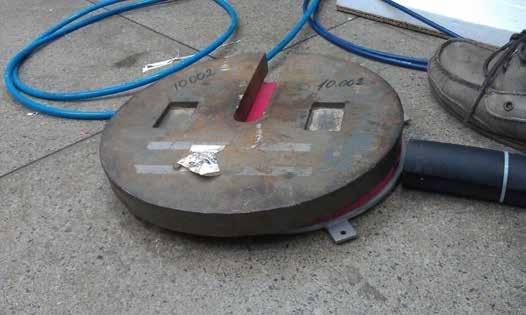
292 Calibration of the total stress cell. 261
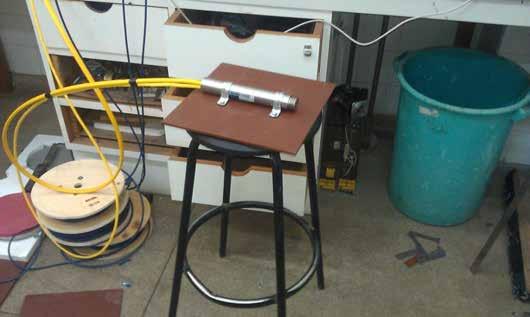

293 Calibration of the settlement sensor. 262


294 Instruments preliminary reading. 263


295 Leveling and flatting of the test area. 264


296 Top of the encased granular column after ground scrape. 265


297 SPT test operation in the test area. 266


298 Vane shear test operation in the test area. 267


299 Piezocone test equipments. 268


300 Piezometer installation process. 269
301 Piezometer installation process. 270


302 Assembling and sealing of the inclinometer casing. 271


303 Drilling borehole and inclinometer installation. 272


304 Installation of the column diameter extensometer. 273


305 Installation of the data logger and zero reading. 274


306 Preparation of the specimen for triaxial tests. 275


307 CU triaxial test operation. 276


308 Operation of specific density of the grain. 277


309 Grain size distribution test (Hydrometric and sieve tests). 278


310 Atterberg limit tests. 279


311 Specimen preparation for the oedometer consolidation test. 280


312 Operation of the loading stage


313 Operation of the loading stage


314 Operation of the loading stage


315 Operation of the loading stage


316 Executive details of the prolongers used in extensometer assembling. 285


317 Executive details of the end plates used in extensometer assembling 286
318 Columns pattern and instrumentation layout. 287
319 Executive details of loading stage 1. Executive details of loading stage
320 Executive details of loading stage 3. Executive details of loading stage
321 ANNEX B Raw data of the in situ and laboratory tests 290
322 Soil profiling and SPT 01 blow counts 291
323 292
324 Soil profiling and SPT 02 blow counts 293
325 294
326 Soil profiling and SPT 03 blow counts 295
327 296
328 297
329 298
330 299
331 300
332 301
333 302
334 303
335 304
336 Curves of grain size distribution and limit test Percent finer [%] SPT 01 (2.85 A 3.35m) Grain diameter [mm] Percent finer [%] SPT 01 (5.75 A 6.25m) Grain diameter [mm] 305
337 Percent finer [%] SPT 01 (8.15 A 8.65m) Grain diameter [mm] Percent finer [%] SPT 02 (1.60 A 2.10m) Grain diameter [mm] 306
338 Percent finer [%] SPT 03 (4.75 A 5.25m) Grain diameter [mm] 100 Number of blows Cluster 01 (2.85 A 3.35m) Water content [%] 307
339 100 Number of blows Cluster 01 (5.75 A 6.25m) Water content [%] 100 Number of blows Cluster 01 (8.15 A 8.65m) Water content [%] 308
340 100 Number of blows Cluster 02 (1.60 A 2.10m) Water content [%] 100 Number of blows Cluster 03 (4.75 A 5.25m) Water content [%] 309
341 Oedometer consolidation tests Cluster 01 (2.85 A 3.35m) Vertical stress ' v (kpa) deformation after 24 hrs (cm) deformation summation (cm) v (%) C v ( cm 2 /sec) E oed (kpa) m v (m 2 /kn) k v (m/s) E E E E E E E E E E E E E E Vertical stress ' v (kpa) H/H 0 (= v /100) e e (specific volume) (%) wet (gr/cm 3 )
342 Vertical stress ' v (kpa) Cluster 01 (5.75 A 6.25m) deformation after 24 hrs (cm) deformation summation (cm) v (%) C v ( cm 2 /sec) E oed (kpa) m v (m 2 /kn) k v (m/s) E E E E E E E E E E E E E E Vertical stress ' v (kpa) H/H 0 (= v /100) e e (specific volume) (%) wet (gr/cm 3 )
343 Vertical stress ' v (kpa) Cluster 01 (8.15 A 8.65m) deformation after 24 hrs (cm) deformation summation (cm) v (%) C v ( cm 2 /sec) E oed (kpa) m v (m 2 /kn) k v (m/s) E E E E E E E E E E E E E E Vertical stress ' v (kpa) H/H 0 (= v /100) e e (specific volume) (%) wet (gr/cm 3 )
344 Vertical stress ' v (kpa) Cluster 02 (1.60 A 2.10m) deformation after 24 hrs (cm) deformation summation (cm) v (%) C v ( cm 2 /sec) E oed (kpa) m v (m 2 /kn) k v (m/s) E E E E E E E E E E E E E E Vertical stress ' v (kpa) H/H 0 (= v /100) e e (specific volume) (%) wet (gr/cm 3 )
345 Vertical stress ' v (kpa) Cluster 03 (4.75 A 5.25 m) deformation after 24 hrs (cm) deformation summation (cm) v (%) C v ( cm 2 /sec) E oed (kpa) m v (m 2 /kn) k v (m/s) E E E E E E E E E E E E E E Vertical stress ' v (kpa) H/H 0 (= v /100) e e (specific volume) (%) wet (gr/cm 3 )
346 CU triaxial tests Cluster 01 (2.85 A 3.35m) Cluster 01_ 2.85 A 3.35m ( 1= 3= 100 kpa) Water content (%) Unit weight (gr/cm 3 ) Cup ID J I d (cm) l (cm) w (gr) Cup (gr) CP1 CIU Cup+wet sample (gr) Cup+dry sample (gr) Water content (%) Average water content (%) Cluster 01_ 2.85 A 3.35m ( 1= 3= 200 kpa) Water content (%) Unit weight (gr/cm 3 ) Cup ID k11 k.6 d (cm) l (cm) w (gr) Cup (gr) CP2 CIU Cup +wet sample (gr) Cup +dry sample (gr) Water content (%) Average water content (%) Cluster 01_ 2.85 A 3.35m ( '1= 30kPa and '3= 18.5 kpa) Water content (%) Unit weight (gr/cm3) Cup ID lc-24 lc-6 d (cm) l (cm) w (gr) CP3 CAU Cup (gr) Cup +wet sample (gr) Cup +dry sample (gr) Water content (%) Average water content (%)
347 Devitoric stress (kpa) Axial strain ( % ) Pore pressure (kpa) Axial strain (%) c'= 5.0 kpa '= 27.6 o q ( kpa ) p' ( kpa ) 316
348 Cluster 01 (5.75 A 6.25m) Cluster 01_ 5.75 A 6.25m ( 1= 3= 100 kpa) Water content (%) Unit weight (gr/cm3) Cup ID M2 G d (cm) l (cm) w (gr) Cup (gr) CP1 CIU Cup +wet sample (gr) Cup +dry sample (gr) Water content (%) average water content (%) Cluster 01_ 5.75 A 6.25m ( 1= 3= 200 kpa) Water content (%) Unit weight (gr/cm3) Cup ID k.1 k.9 d (cm) l (cm) w (gr) Cup (gr) CP2 CIU Cup +wet sample (gr) Cup +dry sample (gr) Water content (%) Average water content (%) Cluster 01_ 5.75 A 6.25 m ( '1= 52 kpa and '3= 25.5 kpa) Water content (%) Unit weight (gr/cm3) Cup ID k-3 p-1 d (cm) l (cm) w (gr) CP3 CAU Cup (gr) Cup +wet sample (gr) Cup +dry sample (gr) Water content (%) Average water content (%)
349 Devitoric stress (kpa) Axial strain (%) Pore pressure (kpa) Axial strain (kpa) c'= 0 kpa '= 25.4 o q ( kpa ) p' ( kpa ) 318
350 Cluster 01 (8.15 A 8.65m) Cluster 01_ 8.15 A 8.65m ( 1= 3= 100 kpa) Water content (%) Unit weight (gr/cm3) Cup ID L28 H1 d (cm) l (cm) w (gr) Cup (gr) CP1 CIU Cup +wet sample (gr) Cup +dry sample (gr) Water content (%) Average water content (%) Cluster 01_ 8.15 A 8.65m ( 1= 3= 200 kpa) Water content (%) Unit weight (gr/cm3) Cup ID Z03 L16 d (cm) l (cm) w (gr) Cup (gr) CP2 CIU Cup +wet sample (gr) Cup +dry sample (gr) Water content (%) Average water content (%)
351 Devitoric stress (kpa) Axial strain (%) Pore pressure (kpa) Axial strain (%) c'= 3 kpa '= 28.6 o 80 q ( kpa ) p' ( kpa ) 320
352 Cluster 02 (1.60 A 2.10m) Cluster 02_ 1.60 A 2.10 m ( '1= 26 kpa and '3= 16.3 kpa) Water content (%) Unit weight (gr/cm3) Cup ID d (cm) l (cm) w (gr) CP1 CAU Cup (gr) Cup +wet sample (gr) Cup +dry sample (gr) Water content (%) Average water content (%) Cluster 02_ 1.60 A 2.10 m ( '1= 37.5 kpa and '3= 19.6 kpa) Water content (%) Unit weight (gr/cm3) Cup ID M-51 M5 d (cm) l (cm) w (gr) CP2 CAU Cup (gr) Cup +wet sample (gr) Cup +dry sample (gr) Water content (%) Average water content (%)
353 50 40 Devitoric stress (kpa) Axial strain (%) 15 Pore pressure (kpa) Axial strain (%) c'= 0 kpa '= 27.3 o q ( kpa ) p' ( kpa ) 322
354 Cluster 03 (4.75 A 5.25m) Cluster 03_ 4.75 A 5.25 m ( '1= 39 kpa and '3= 22.7 kpa) Water content (%) Unit weight (gr/cm3) Cup ID k d (cm) l (cm) w (gr) CP1 CAU Cup (gr) Cup +wet sample (gr) Cup +dry sample (gr) Water content (%) 4.96 Average water content (%) Cluster 03_ 4.75 A 5.25 m ( '1= 53 kpa and '3= 26.5 kpa) Water content (%) Unit weight (gr/cm3) Cup ID k m9 d (cm) l (cm) w (gr) CP2 CAU Cup (gr) Cup +wet sample (gr) Cup +dry sample (gr) Water content (%) 5.05 Average water content (%)
355 Direct shear tests performed on fill material Shear stress ( kpa) Horizontal displacement ( cm ) Vertical displacement (cm) Horizontal displacement ( cm ) 150 Shear stress ( kpa ) Normal stress ( kpa ) 324
356 ANNEX D Published and accepted journal papers 325

357 326

358 327

359 328

360 329

361 330

362 331

363 332

364 333

365 334
366 335

367 336

368 337

369 338

370 339

371 340
372 341

373 342

374 343

375 344
376 345

377 346

378 347
379 348
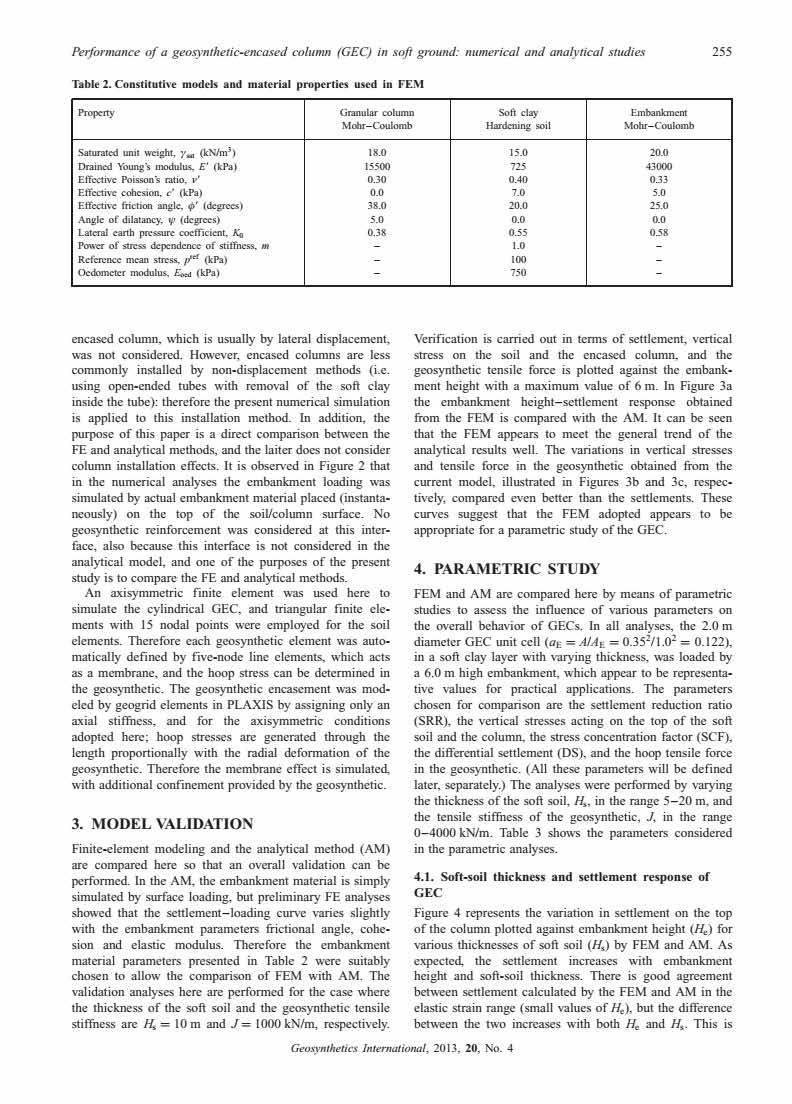
380 349
381 350

382 351

383 352

384 353

385 354

386 355
Triaxial Shear Test. o The most reliable method now available for determination of shear strength parameters.
 TOPICS Introduction Components of Shear Strength of Soils Normal and Shear Stresses on a Plane Mohr-Coulomb Failure Criterion Laboratory Shear Strength Testing Direct Shear Test Triaxial Compression Test
Chapter (12) Instructor : Dr. Jehad Hamad
 Instructor : Dr. Jehad Hamad") Chapter (12) Instructor : Dr. Jehad Hamad 2017-2016 Chapter Outlines Shear strength in soils Direct shear test Unconfined Compression Test Tri-axial Test Shear Strength The strength of a material is the
Chapter (12) Instructor : Dr. Jehad Hamad 2017-2016 Chapter Outlines Shear strength in soils Direct shear test Unconfined Compression Test Tri-axial Test Shear Strength The strength of a material is the
(Refer Slide Time: 02:18)
") Geology and Soil Mechanics Prof. P. Ghosh Department of Civil Engineering Indian Institute of Technology Kanpur Lecture 40 Shear Strength of Soil - C Keywords: Shear strength of soil, direct shear test,
Geology and Soil Mechanics Prof. P. Ghosh Department of Civil Engineering Indian Institute of Technology Kanpur Lecture 40 Shear Strength of Soil - C Keywords: Shear strength of soil, direct shear test,
SHEAR STRENGTH OF SOIL
 Soil Failure Criteria SHEAR STRENGTH OF SOIL Knowledge about the shear strength of soil important for the analysis of: Bearing capacity of foundations, Slope stability, Lateral pressure on retaining structures,
Laboratory Testing Total & Effective Stress Analysis
 SKAA 1713 SOIL MECHANICS Laboratory Testing Total & Effective Stress Analysis Prepared by: Dr. Hetty Mohr Coulomb failure criterion with Mohr circle of stress 2 ' 2 ' ' ' 3 ' 1 ' 3 ' 1 Cot Sin c ' ' 2
Iman Hossein Pour Babaei
 Iman Hossein Pour Babaei Geotechnical Engineering Program Department of Civil Engineering Faculty of Engineering, University of Guilan Rasht, PB 41996-13776, Guilan Province, Iran Email: i.hosseinpour@gmail.com
TABLE OF CONTENTS CHAPTER TITLE PAGE TITLE PAGE DECLARATION DEDIDATION ACKNOWLEDGEMENTS ABSTRACT ABSTRAK
 TABLE OF CONTENTS CHAPTER TITLE PAGE TITLE PAGE DECLARATION DEDIDATION ACKNOWLEDGEMENTS ABSTRACT ABSTRAK TABLE OF CONTENTS LIST OF TABLE LIST OF FIGURES LIST OF SYMBOLS LIST OF APENDICES i ii iii iv v
Interpretation of Flow Parameters from In-Situ Tests (P.W. Mayne, November 2001)
") Interpretation of Flow Parameters from In-Situ Tests (P.W. Mayne, November 2001) FLOW PROPERTIES Soils exhibit flow properties that control hydraulic conductivity (k), rates of consolidation, construction
Interpretation of Flow Parameters from In-Situ Tests (P.W. Mayne, November 2001) FLOW PROPERTIES Soils exhibit flow properties that control hydraulic conductivity (k), rates of consolidation, construction
Research Article 3D FE Analysis of an Embankment Construction on GRSC and Proposal of a Design Method
 ISRN Civil Engineering Volume 1, Article ID 97, 11 pages http://dx.doi.org/1.1155/1/97 Research Article D FE Analysis of an Embankment Construction on GRSC and Proposal of a Design Method Yogendra K. Tandel,
1.8 Unconfined Compression Test
 1-49 1.8 Unconfined Compression Test - It gives a quick and simple measurement of the undrained strength of cohesive, undisturbed soil specimens. 1) Testing method i) Trimming a sample. Length-diameter
APPENDIX F CORRELATION EQUATIONS. F 1 In-Situ Tests
 APPENDIX F 1 APPENDIX F CORRELATION EQUATIONS F 1 In-Situ Tests 1. SPT (1) Sand (Hatanaka and Uchida, 1996), = effective vertical stress = effective friction angle = atmosphere pressure (Shmertmann, 1975)
Table of Contents Chapter 1 Introduction to Geotechnical Engineering 1.1 Geotechnical Engineering 1.2 The Unique Nature of Soil and Rock Materials
 Table of Contents Chapter 1 Introduction to Geotechnical Engineering 1.1 Geotechnical Engineering 1.2 The Unique Nature of Soil and Rock Materials 1.3 Scope of This Book 1.4 Historical Development of Geotechnical
Theory of Shear Strength
 MAJ 1013 ADVANCED SOIL MECHANICS Theory of Shear Strength Prepared by, Dr. Hetty 1 Strength of different materials Steel Concrete Soil Tensile strength Compressive strength Shear strength Complex behavior
Cavity Expansion Methods in Geomechanics
 Cavity Expansion Methods in Geomechanics by Hai-Sui Yu School of Civil Engineering, University of Nottingham, U. K. KLUWER ACADEMIC PUBLISHERS DORDRECHT / BOSTON / LONDON TABLE OF CONTENTS Foreword Preface
SHEAR STRENGTH OF SOIL
 SHEAR STRENGTH OF SOIL Necessity of studying Shear Strength of soils : Soil failure usually occurs in the form of shearing along internal surface within the soil. Shear Strength: Thus, structural strength
Calculation of 1-D Consolidation Settlement
 Calculation of 1-D Consolidation Settlement A general theory for consolidation, incorporating threedimensional flow is complicated and only applicable to a very limited range of problems in geotechnical
SOIL SHEAR STRENGTH. Prepared by: Dr. Hetty Muhammad Azril Fauziah Kassim Norafida
 SOIL SHEAR STRENGTH Prepared by: Dr. Hetty Muhammad Azril Fauziah Kassim Norafida What is shear strength Shear strength of a soil is the maximum internal resistance to applied shearing forces Why it is
Finite Element Investigation of the Interaction between a Pile and a Soft Soil focussing on Negative Skin Friction
 NGM 2016 Reykjavik Proceedings of the 17 th Nordic Geotechnical Meeting Challenges in Nordic Geotechnic 25 th 28 th of May Finite Element Investigation of the Interaction between a Pile and a Soft Soil
Soil strength. the strength depends on the applied stress. water pressures are required
 Soil Strength Soil strength u Soils are essentially frictional materials the strength depends on the applied stress u Strength is controlled by effective stresses water pressures are required u Soil strength
D1. A normally consolidated clay has the following void ratio e versus effective stress σ relationship obtained in an oedometer test.
 (d) COMPRESSIBILITY AND CONSOLIDATION D1. A normally consolidated clay has the following void ratio e versus effective stress σ relationship obtained in an oedometer test. (a) Plot the e - σ curve. (b)
INVESTIGATION OF SATURATED, SOFT CLAYS UNDER EMBANKMENTS. Zsolt Rémai Budapest University of Technology and Economics Department of Geotechnics
 INVESTIGATION OF SATURATED, SOFT CLAYS UNDER EMBANKMENTS PhD thesis Zsolt Rémai Budapest University of Technology and Economics Department of Geotechnics Budapest December, 2012 1. IMPORTANCE OF THE RESEARCH
Shear Strength of Soils
 Shear Strength of Soils STRESSES IN A SOIL ELEMENT t s v Analyze Effective Stresses (s ) Load carried by Soil t Where: s H t t s H s = t f = s v = s H = t = s v Stresses in a Soil Element after Figure
Landslide FE Stability Analysis
 Landslide FE Stability Analysis L. Kellezi Dept. of Geotechnical Engineering, GEO-Danish Geotechnical Institute, Denmark S. Allkja Altea & Geostudio 2000, Albania P. B. Hansen Dept. of Geotechnical Engineering,
Theory of Shear Strength
 SKAA 1713 SOIL MECHANICS Theory of Shear Strength Prepared by, Dr. Hetty 1 SOIL STRENGTH DEFINITION Shear strength of a soil is the maximum internal resistance to applied shearing forces The maximum or
Effect of embedment depth and stress anisotropy on expansion and contraction of cylindrical cavities
 Effect of embedment depth and stress anisotropy on expansion and contraction of cylindrical cavities Hany El Naggar, Ph.D., P. Eng. and M. Hesham El Naggar, Ph.D., P. Eng. Department of Civil Engineering
FUNDAMENTALS SOIL MECHANICS. Isao Ishibashi Hemanta Hazarika. >C\ CRC Press J Taylor & Francis Group. Taylor & Francis Group, an Informa business
 SOIL MECHANICS FUNDAMENTALS Isao Ishibashi Hemanta Hazarika >C\ CRC Press J Taylor & Francis Group Boca Raton London New York CRC Press is an imprint of the Taylor & Francis Group, an Informa business
Column Supported Embankments with Geosynthetic Encased Columns: Parametric Study
 Column Supported Embankments with Geosynthetic Encased Columns: Parametric Study Majid Khabbazian ; Christopher L. Meehan 2 ; Victor N. Kaliakin 3 Abstract: Three-dimensional finite element analyses were
Chapter (11) Pile Foundations
 Pile Foundations") Chapter (11) Introduction Piles are structural members that are made of steel, concrete, or timber. They are used to build pile foundations (classified as deep foundations) which cost more than shallow
Chapter (11) Introduction Piles are structural members that are made of steel, concrete, or timber. They are used to build pile foundations (classified as deep foundations) which cost more than shallow
Boreholes. Implementation. Boring. Boreholes may be excavated by one of these methods: 1. Auger Boring 2. Wash Boring 3.
 Implementation Boreholes 1. Auger Boring 2. Wash Boring 3. Rotary Drilling Boring Boreholes may be excavated by one of these methods: 4. Percussion Drilling The right choice of method depends on: Ground
1 Introduction. Abstract
 Abstract This paper presents a three-dimensional numerical model for analysing via finite element method (FEM) the mechanized tunneling in urban areas. The numerical model is meant to represent the typical
Following are the results of four drained direct shear tests on an overconsolidated clay: Diameter of specimen 50 mm Height of specimen 25 mm
 444 Chapter : Shear Strength of Soil Example. Following are the results of four drained direct shear tests on an overconsolidated clay: Diameter of specimen 50 mm Height of specimen 5 mm Normal Shear force
Calculation types: drained, undrained and fully coupled material behavior. Dr Francesca Ceccato
 Calculation types: drained, undrained and fully coupled material behavior Dr Francesca Ceccato Summary Introduction Applications: Piezocone penetration (CPTU) Submerged slope Conclusions Introduction Porous
PRINCIPLES OF GEOTECHNICAL ENGINEERING
 PRINCIPLES OF GEOTECHNICAL ENGINEERING Fourth Edition BRAJA M. DAS California State University, Sacramento I(T)P Boston Albany Bonn Cincinnati London Madrid Melbourne Mexico City New York Paris San Francisco
Introduction to Soil Mechanics
 Introduction to Soil Mechanics Sela Sode and Colin Jones WILEY Blackwell Contents Preface Dedication and Acknowledgments List of Symbols Soil Structure 1.1 Volume relationships 1.1.1 Voids ratio (e) 1.1.2
Deep Foundations 2. Load Capacity of a Single Pile
 Deep Foundations 2 Load Capacity of a Single Pile All calculations of pile capacity are approximate because it is almost impossible to account for the variability of soil types and the differences in the
LABORATORY MEASUREMENTS OF STIFFNESS OF SOFT CLAY USING BENDER ELEMENTS
 LABORATORY MEASUREMENTS OF STIFFNESS OF SOFT CLAY USING BENDER ELEMENTS ABSTRACT: S. H. Oh 1, D. S. Park 2, B. J. Kim 3, E. J. Kim 1 and Y. J. Mok 4 1 Research Assistant, Dept. of Civil Eng., Kyunghee
Geotechnical Properties of Soil
 Geotechnical Properties of Soil 1 Soil Texture Particle size, shape and size distribution Coarse-textured (Gravel, Sand) Fine-textured (Silt, Clay) Visibility by the naked eye (0.05 mm is the approximate
Prof. B V S Viswanadham, Department of Civil Engineering, IIT Bombay
 56 Module 4: Lecture 7 on Stress-strain relationship and Shear strength of soils Contents Stress state, Mohr s circle analysis and Pole, Principal stressspace, Stress pathsin p-q space; Mohr-Coulomb failure
INTRODUCTION TO STATIC ANALYSIS PDPI 2013
 INTRODUCTION TO STATIC ANALYSIS PDPI 2013 What is Pile Capacity? When we load a pile until IT Fails what is IT Strength Considerations Two Failure Modes 1. Pile structural failure controlled by allowable
Cone Penetration Testing in Geotechnical Practice
 Cone Penetration Testing in Geotechnical Practice Table Of Contents: LIST OF CONTENTS v (4) PREFACE ix (2) ACKNOWLEDGEMENTS xi (1) SYMBOL LIST xii (4) CONVERSION FACTORS xvi (6) GLOSSARY xxii 1. INTRODUCTION
Manual on Subsurface Investigations National Highway Institute Publication No. FHWA NHI Federal Highway Administration Washington, DC
 Manual on Subsurface Investigations National Highway Institute Publication No. FHWA NHI-01-031 Federal Highway Administration Washington, DC Geotechnical Site Characterization July 2001 by Paul W. Mayne,
Analysis of CMC-Supported Embankments Considering Soil Arching
 Analysis of CMC-Supported Embankments Considering Soil Arching Balaka Ghosh 1, Behzad Fatahi 2, Hadi Khabbaz 3, and A. H. M. Kamruzzaman 4 1 PhD Candidate, School of Civil and Environmental Engineering,
SOIL MODELS: SAFETY FACTORS AND SETTLEMENTS
 PERIODICA POLYTECHNICA SER. CIV. ENG. VOL. 48, NO. 1 2, PP. 53 63 (2004) SOIL MODELS: SAFETY FACTORS AND SETTLEMENTS Gabriella VARGA and Zoltán CZAP Geotechnical Department Budapest University of Technology
Shear Strength of Soils
 Shear Strength of Soils Soil strength Most of problems in soil engineering (foundations, slopes, etc.) soil withstands shear stresses. Shear strength of a soil is defined as the capacity to resist shear
Oh, Erwin, Bolton, Mark, Balasubramaniam, Bala, Buessucesco, B.
 Undrained Behavior of Lime Treated Soft Clays Author Oh, Erwin, Bolton, Mark, Balasubramaniam, Bala, Buessucesco, B. Published 8 Conference Title Proceedings of the Eighteenth (8) International Offshore
8.1. What is meant by the shear strength of soils? Solution 8.1 Shear strength of a soil is its internal resistance to shearing stresses.
 8.1. What is meant by the shear strength of soils? Solution 8.1 Shear strength of a soil is its internal resistance to shearing stresses. 8.2. Some soils show a peak shear strength. Why and what type(s)
Chapter 5 Shear Strength of Soil
 Page 5 Chapter 5 Shear Strength of Soil. The internal resistance per unit area that the soil mass can offer to resist failure and sliding along any plane inside it is called (a) strength (b) shear strength
Deformation And Stability Analysis Of A Cut Slope
 Deformation And Stability Analysis Of A Cut Slope Masyitah Binti Md Nujid 1 1 Faculty of Civil Engineering, University of Technology MARA (Perlis), 02600 Arau PERLIS e-mail:masyitahmn@perlis.uitm.edu.my
Numerical model comparison on deformation behavior of a TSF embankment subjected to earthquake loading
 Numerical model comparison on deformation behavior of a TSF embankment subjected to earthquake loading Jorge Castillo, Yong-Beom Lee Ausenco, USA Aurelian C. Trandafir Fugro GeoConsulting Inc., USA ABSTRACT
Towards Efficient Finite Element Model Review Dr. Richard Witasse, Plaxis bv (based on the original presentation of Dr.
 Towards Efficient Finite Element Model Review Dr. Richard Witasse, Plaxis bv (based on the original presentation of Dr. Brinkgreve) Journée Technique du CFMS, 16 Mars 2011, Paris 1/32 Topics FEA in geotechnical
Shear Strength of Soil
 8 Shear Strength of Soil 8 1 INTRODUCTION As a structural member, a piece of steel is capable of resisting compression, tension, and shear. Soil, however, like concrete and rock, is not capable of resisting
Column Supported Embankments with Geosynthetic Encased Columns: Validity of the Unit Cell Concept
 Column Supported Embankments with Geosynthetic Encased Columns: Validity of the Unit Cell Concept Majid Khabbazian 1 ; Victor N. Kaliakin 2 ; Christopher L. Meehan 3 Abstract: Column supported embankments
Class Principles of Foundation Engineering CEE430/530
 Class Principles of Foundation Engineering CEE430/530 1-1 General Information Lecturer: Scott A. Barnhill, P.E. Lecture Time: Thursday, 7:10 pm to 9:50 pm Classroom: Kaufmann, Room 224 Office Hour: I have
1.5 STRESS-PATH METHOD OF SETTLEMENT CALCULATION 1.5 STRESS-PATH METHOD OF SETTLEMENT CALCULATION
 Module 6 Lecture 40 Evaluation of Soil Settlement - 6 Topics 1.5 STRESS-PATH METHOD OF SETTLEMENT CALCULATION 1.5.1 Definition of Stress Path 1.5. Stress and Strain Path for Consolidated Undrained Undrained
Drawing up of a geotechnical dossier for the stabilization of historical quay walls along the river Scheldt in Antwerp
 Drawing up of a geotechnical dossier for the stabilization of historical quay walls along the river Scheldt in Antwerp Leen Vincke, Koen Haelterman Geotechnics Division Flemish Government, Belgium Leen.vincke@mow.vlaanderen.be
IN SITU TESTING IN GEOMECHANICS. Fernando Schnaid Universidade Federal do Rio Grande do Sul
 IN SITU TESTING IN GEOMECHANICS Fernando Schnaid Universidade Federal do Rio Grande do Sul Patologia das Fundações Geotechnical investigation British Practice (Weltman & Head,1981): Sufficient finance
TIME-DEPENDENT BEHAVIOR OF PILE UNDER LATERAL LOAD USING THE BOUNDING SURFACE MODEL
 TIME-DEPENDENT BEHAVIOR OF PILE UNDER LATERAL LOAD USING THE BOUNDING SURFACE MODEL Qassun S. Mohammed Shafiqu and Maarib M. Ahmed Al-Sammaraey Department of Civil Engineering, Nahrain University, Iraq
CHARACTERISTICS OF VACUUM CONSOLIDATION COMPARING WITH SURCHARGE LOAD INDUCED CONSOLIDATION
 International Symposium on Geotechnical Engineering, Ground Improvement and Geosynthetics for Human Security and Environmental preservation, Bangkok, Thailand CHARACTERISTICS OF VACUUM CONSOLIDATION COMPARING
 QUESTION BANK DEPARTMENT: CIVIL SUBJECT CODE / Name: CE 2251 / SOIL MECHANICS SEMESTER: IV UNIT 1- INTRODUCTION PART - A (2 marks) 1. Distinguish between Residual and Transported soil. (AUC May/June 2012)
Evaluation of dynamic behavior of culverts and embankments through centrifuge model tests and a numerical analysis
 Computer Methods and Recent Advances in Geomechanics Oka, Murakami, Uzuoka & Kimoto (Eds.) 2015 Taylor & Francis Group, London, ISBN 978-1-138-00148-0 Evaluation of dynamic behavior of culverts and embankments
Chapter 7: Settlement of Shallow Foundations
 Chapter 7: Settlement of Shallow Foundations Introduction The settlement of a shallow foundation can be divided into two major categories: (a) elastic, or immediate settlement and (b) consolidation settlement.
Reinforced Soil Structures Reinforced Soil Walls. Prof K. Rajagopal Department of Civil Engineering IIT Madras, Chennai
 Geosynthetics and Reinforced Soil Structures Reinforced Soil Walls continued Prof K. Rajagopal Department of Civil Engineering IIT Madras, Chennai e-mail: gopalkr@iitm.ac.inac in Outline of the Lecture
Advanced model for soft soils. Modified Cam-Clay (MCC)
") Advanced model for soft soils. Modified Cam-Clay (MCC) c ZACE Services Ltd August 2011 1 / 62 2 / 62 MCC: Yield surface F (σ,p c ) = q 2 + M 2 c r 2 (θ) p (p p c ) = 0 Compression meridian Θ = +π/6 -σ
Advanced model for soft soils. Modified Cam-Clay (MCC) c ZACE Services Ltd August 2011 1 / 62 2 / 62 MCC: Yield surface F (σ,p c ) = q 2 + M 2 c r 2 (θ) p (p p c ) = 0 Compression meridian Θ = +π/6 -σ
Stress and Strains in Soil and Rock. Hsin-yu Shan Dept. of Civil Engineering National Chiao Tung University
 Stress and Strains in Soil and Rock Hsin-yu Shan Dept. of Civil Engineering National Chiao Tung University Stress and Strain ε 1 1 2 ε 2 ε Dimension 1 2 0 ε ε ε 0 1 2 ε 1 1 2 ε 2 ε Plane Strain = 0 1 2
Dynamic Response of EPS Blocks /soil Sandwiched Wall/embankment
 Proc. of Second China-Japan Joint Symposium on Recent Development of Theory and Practice in Geotechnology, Hong Kong, China Dynamic Response of EPS Blocks /soil Sandwiched Wall/embankment J. C. Chai 1
Soil and Rock Strength. Chapter 8 Shear Strength. Steel Strength. Concrete Strength. Dr. Talat Bader May Steel. Concrete.
 Chapter 8 Shear Strength Dr. Talat Bader May 2006 Soil and Rock Strength Unconfined compressive strength (MPa) Steel Concrete 20 100 250 750 0.001 0.01 Soil 0.1 1.0 10 Rock 100 250 F y = 250 to 750 MPa
A Constitutive Framework for the Numerical Analysis of Organic Soils and Directionally Dependent Materials
 Dublin, October 2010 A Constitutive Framework for the Numerical Analysis of Organic Soils and Directionally Dependent Materials FracMan Technology Group Dr Mark Cottrell Presentation Outline Some Physical
Compression and swelling. Mechanisms of compression. Mechanisms Common cases Isotropic One-dimensional Wet and dry states
 Compression and swelling Mechanisms Common cases Isotropic One-dimensional Wet and dry states The relationship between volume change and effective stress is called compression and swelling. (Consolidation
Ch 4a Stress, Strain and Shearing
 Ch. 4a - Stress, Strain, Shearing Page 1 Ch 4a Stress, Strain and Shearing Reading Assignment Ch. 4a Lecture Notes Sections 4.1-4.3 (Salgado) Other Materials Handout 4 Homework Assignment 3 Problems 4-13,
(C) Global Journal of Engineering Science and Research Management
 Global Journal of Engineering Science and Research Management") GEOTECHNCIAL ASSESSMENT OF PART OF PORT HARCOURT, NIGER DELTA FOR STRUCTURAL ANALYSIS Warmate Tamunonengiyeofori Geostrat International Services Limited, www.geostratinternational.com. *Correspondence
GEOTECHNCIAL ASSESSMENT OF PART OF PORT HARCOURT, NIGER DELTA FOR STRUCTURAL ANALYSIS Warmate Tamunonengiyeofori Geostrat International Services Limited, www.geostratinternational.com. *Correspondence
GEOTEXTILE-REINFORCED EMBANKMENTS ON SOFT CLAYS - EFFECTS OF A FOUNDATION SOIL CRUST STRENGTHENED BY LIME DIFFUSION
 Technical Paper by A. Edinçliler and E. Güler GEOTEXTILE-REINFORCED EMBANKMENTS ON SOFT CLAYS - EFFECTS OF A FOUNDATION SOIL CRUST STRENGTHENED BY LIME DIFFUSION ABSTRACT: This paper presents the results
Analysis of Load-Settlement Relationship for Unpaved Road Reinforced with Geogrid
 ISGSR7 First International Symposium on Geotechnical Safety & Risk Oct. 8~9, 7 Shanghai Tongji University, China Analysis of Load-Settlement Relationship for Unpaved Road Reinforced with Geogrid Y. C.
Chapter (5) Allowable Bearing Capacity and Settlement
 Allowable Bearing Capacity and Settlement") Chapter (5) Allowable Bearing Capacity and Settlement Introduction As we discussed previously in Chapter 3, foundations should be designed for both shear failure and allowable settlement. So the allowable
Chapter (5) Allowable Bearing Capacity and Settlement Introduction As we discussed previously in Chapter 3, foundations should be designed for both shear failure and allowable settlement. So the allowable
SOIL MECHANICS: palgrave. Principles and Practice. Graham Barnes. macmiiian THIRD EDITION
 SOIL MECHANICS: Principles and Practice THIRD EDITION Graham Barnes palgrave macmiiian 'running Contents Preface xii Fine soil 19 List of symbols xiv Mass structure 21 Note on units xix Degree of weathering
EN Eurocode 7. Section 3 Geotechnical Data Section 6 Spread Foundations. Trevor L.L. Orr Trinity College Dublin Ireland.
 EN 1997 1: Sections 3 and 6 Your logo Brussels, 18-20 February 2008 Dissemination of information workshop 1 EN 1997-1 Eurocode 7 Section 3 Geotechnical Data Section 6 Spread Foundations Trevor L.L. Orr
Conventional Field Testing & Issues (SPT, CPT, DCPT, Geophysical methods)
") Conventional Field Testing & Issues (SPT, CPT, DCPT, Geophysical methods) Ajanta Sachan Assistant Professor Civil Engineering IIT Gandhinagar Conventional Field Testing 1 Field Test: In-situ shear strength
Conventional Field Testing & Issues (SPT, CPT, DCPT, Geophysical methods) Ajanta Sachan Assistant Professor Civil Engineering IIT Gandhinagar Conventional Field Testing 1 Field Test: In-situ shear strength
Finite Element analysis of Laterally Loaded Piles on Sloping Ground
 Indian Geotechnical Journal, 41(3), 2011, 155-161 Technical Note Finite Element analysis of Laterally Loaded Piles on Sloping Ground K. Muthukkumaran 1 and N. Almas Begum 2 Key words Lateral load, finite
OP-13. PROCEDURES FOR DESIGN OF EMBANKMENT
 Page 1 of 8 WORK INSTRUCTIONS FOR ENGINEERS TYC Compiled by : LSS Checked by : GSS Approved by : OP-13. PROCEDURES FOR DESIGN OF EMBANKMENT Page of 8 13.0 13.1. OVERALL PROCEDURES This section will briefly
PILE-SUPPORTED RAFT FOUNDATION SYSTEM
 PILE-SUPPORTED RAFT FOUNDATION SYSTEM Emre Biringen, Bechtel Power Corporation, Frederick, Maryland, USA Mohab Sabry, Bechtel Power Corporation, Frederick, Maryland, USA Over the past decades, there has
Monitoring of underground construction
 Monitoring of underground construction Geotechnical Aspects of Underground Construction in Soft Ground Yoo, Park, Kim & Ban (Eds) 2014 Korean Geotechnical Society, Seoul, Korea, ISBN 978-1-138-02700-8
Analysis and measurements of settlement for heavy loaded rigid footing
 Analysis and measurements of settlement for heavy loaded rigid footing I. Sokoli University of Zagreb, Faculty of Civil Engineering, Ka i eva 26, 1 Zagreb, Croatia T. Ivši University of Zagreb, Faculty
Experimental study on the effectiveness of prefabricated vertical drains under cyclic loading
 University of Wollongong Research Online Faculty of Engineering - Papers (Archive) Faculty of Engineering and Information Sciences 211 Experimental study on the effectiveness of prefabricated vertical
Effectiveness of Vertical Drains in Dissipating Excess Pore Pressures Induced by Cyclic Loads in Clays
 University of Wollongong Research Online Faculty of Engineering - Papers (Archive) Faculty of Engineering and Information Sciences 27 Effectiveness of Vertical Drains in Dissipating Excess Pore Pressures
CPT Data Interpretation Theory Manual
 CPT Data Interpretation Theory Manual 2016 Rocscience Inc. Table of Contents 1 Introduction... 3 2 Soil Parameter Interpretation... 5 3 Soil Profiling... 11 3.1 Non-Normalized SBT Charts... 11 3.2 Normalized
SHEAR STRENGTH I YULVI ZAIKA
 SHEAR STRENGTH I YULVI ZAIKA MATERI Keruntuhan mohr coulomb, stress paths, kuat geser tanah non kohesif dan kohesif, evaluasi kuat geser di lapangan, tegangan normal dan tegangan geser pada sebuah bidang
TC211 Workshop CALIBRATION OF RIGID INCLUSION PARAMETERS BASED ON. Jérôme Racinais. September 15, 2015 PRESSUMETER TEST RESULTS
 Jérôme Racinais September 15, 215 TC211 Workshop CALIBRATION OF RIGID INCLUSION PARAMETERS BASED ON PRESSUMETER TEST RESULTS Table of contents 1. Reminder about pressuremeter tests 2. General behaviour
SHEAR STRENGTH OF SOIL UNCONFINED COMPRESSION TEST
 SHEAR STRENGTH OF SOIL DEFINITION The shear strength of the soil mass is the internal resistance per unit area that the soil mass can offer to resist failure and sliding along any plane inside it. INTRODUCTION
Column-Supported Embankments: Past, Present, and Future
 Column-Supported Embankments: Past, Present, and Future Jie Han, Ph.D., PE, ASCE Fellow Professor The University of Kansas Column-Supported Embankments Also referred to as Pile-Supported Embankments Piled
Compressibility & Consolidation
 CHAPTER Compressibility & Consolidation Settlement If a structure is placed on soil surface, then the soil will undergo an elastic and plastic deformation. In engineering practice, the deformation or reduction
REINFORCED PILED EMBANK- MENT FOR A HIGH-SPEED RAILWAY OVER SOFT SOIL: A NUMERICAL AND ANALYTI- CAL INVESTIGATION
 REINFORCED PILED EMBANK- MENT FOR A HIGH-SPEED RAILWAY OVER SOFT SOIL: A NUMERICAL AND ANALYTI- CAL INVESTIGATION Yan Zhuang (corresponding author) Hohai University, Geotechnical Research Institute Key
J. Paul Guyer, P.E., R.A.
 J. Paul Guyer, P.E., R.A. Paul Guyer is a registered mechanical engineer, civil engineer, fire protection engineer and architect with over 35 years experience in the design of buildings and related infrastructure.
Table 3. Empirical Coefficients for BS 8002 equation. A (degrees) Rounded Sub-angular. 2 Angular. B (degrees) Uniform Moderate grading.
 Rounded Sub-angular. 2 Angular. B (degrees) Uniform Moderate grading.") Hatanaka and Uchida (1996); ' 20N 20 12N 20 ' 45 A lower bound for the above equation is given as; 12N 15 ' 45 Table 3. Empirical Coefficients for BS 8002 equation A Angularity 1) A (degrees) Rounded 0
Hatanaka and Uchida (1996); ' 20N 20 12N 20 ' 45 A lower bound for the above equation is given as; 12N 15 ' 45 Table 3. Empirical Coefficients for BS 8002 equation A Angularity 1) A (degrees) Rounded 0
The Hardening Soil model with small strian stiffness
 The Hardening Soil model with small strain stiffness in Zsoil v2011 Rafal OBRZUD GeoMod Ing. SA, Lausanne Content Introduction Framework of the Hardening Soil model Hardening Soil SmallStrain Hardening
Numerical modelling of tension piles
 Numerical modelling of tension piles S. van Baars Ministry of Public Works, Utrecht, Netherlands W.J. van Niekerk Ballast Nedam Engineering, Amstelveen, Netherlands Keywords: tension piles, shaft friction,
UNDRAINED SHEAR STRENGTH OF SOFT CLAY REINFORCE WITH SINGLE 16MM DIAMETER ENCAPSULATED BOTTOM ASH COLUMN NABILAH BINTI MD MASHOD FAKEH
 1 UNDRAINED SHEAR STRENGTH OF SOFT CLAY REINFORCE WITH SINGLE 16MM DIAMETER ENCAPSULATED BOTTOM ASH COLUMN NABILAH BINTI MD MASHOD FAKEH B. ENG (HONS.) CIVIL ENGINEERING UNIVERSITI MALAYSIA PAHANG 1 UNIVERSITI
Shear Strength of Soils
 ENVIRONMENTAL GEOTECHNICS Shear Strength of Soils Prof. Ing. Marco Favaretti University of Padova Department of Civil, Environmental and Architectural Engineering Via Ognissanti, 39 Padova (Italy) phone:
IN SITU TESTING TECHNOLOGY FOR FOUNDATION & EARTHQUAKE ENGINEERING. Wesley Spang, Ph.D., P.E. AGRA Earth & Environmental, Inc.
 IN SITU TESTING TECHNOLOGY FOR FOUNDATION & EARTHQUAKE ENGINEERING Wesley Spang, Ph.D., P.E. AGRA Earth & Environmental, Inc. Portland, Oregon In situ testing of soil, which essentially consists of evaluating
On equal settlement plane height in piled reinforced embankments
 Available online www.jocpr.com Journal of Chemical and Pharmaceutical Research, 2014, 6(4):23-29 Research Article ISSN : 0975-7384 CODEN(USA) : JCPRC5 On equal settlement plane height in piled reinforced
Effect of Frozen-thawed Procedures on Shear Strength and Shear Wave Velocity of Sands
 Effect of Frozen-thawed Procedures on Shear Strength and Shear Wave Velocity of Sands JongChan Kim 1), *Sang Yeob Kim 1), Shinhyun Jeong 2), Changho Lee 3) and Jong-Sub Lee 4) 1), 4) School of Civil, Environmental
Enhanced In-Situ Testing for Geotechnical Site Characterization. Graduate Course CEE 6423
 Enhanced In-Situ Testing for Geotechnical Site Characterization SPT, VST, DMT, PMT, CHT, DHT, CPT Graduate Course CEE 6423 Paul W. Mayne, PhD, P.E. Professor, Geosystems Program Civil & Environmental Engineering