Motion on Upper-Plate Faults During Subduction Zone Earthquakes: Case of the Atacama Fault System, Northern Chile
|
|
|
- Leslie Logan
- 5 years ago
- Views:
Transcription

1 Smith ScholarWorks Geosciences: Faculty Publications Geosciences Motion on Upper-Plate Faults During Subduction Zone Earthquakes: Case of the Atacama Fault System, Northern Chile John P. Loveless Cornell University, Matthew E. Pritchard Cornell University Follow this and additional works at: Part of the Geology Commons Recommended Citation Loveless, John P. and Pritchard, Matthew E., "Motion on Upper-Plate Faults During Subduction Zone Earthquakes: Case of the Atacama Fault System, Northern Chile" (2008). Geosciences: Faculty Publications This Article has been accepted for inclusion in Geosciences: Faculty Publications by an authorized administrator of Smith ScholarWorks. For more information, please contact

2 Geosystems G 3 AN ELECTRONIC JOURNAL OF THE EARTH SCIENCES Published by AGU and the Geochemical Society Article Volume 9, Number December 2008 Q12017, doi: /2008gc ISSN: Motion on upper-plate faults during subduction zone earthquakes: Case of the Atacama Fault System, northern Chile J. P. Loveless Department of Earth and Atmospheric Sciences, Cornell University, 2122 Snee Hall, Ithaca, New York 14853, USA Now at Department of Earth and Planetary Sciences, Harvard University, 20 Oxford Street, Cambridge, Massachusetts 02138, USA (loveless@eps.harvard.edu) M. E. Pritchard Department of Earth and Atmospheric Sciences, Cornell University, 2122 Snee Hall, Ithaca, New York 14853, USA (mp337@cornell.edu) [1] Motion on the Atacama Fault System (AFS) in northern Chile is driven by Andean subduction zone processes. We use two approaches, observational and theoretical, to evaluate how the AFS and other forearc faults responded to coseismic stress induced by one well-studied megathrust earthquake, the 1995 M w = 8.1 Antofagasta event. We use synthetic aperture radar interferometry (InSAR) to search for smallscale coseismic and postseismic deformation on individual faults. The InSAR data are ambiguous: some images show offset consistent with coseismic faulting on the Paposo segment of the AFS and others lack such signal. The fact that we do not observe the fault-like displacement in all coseismic interferograms suggests that atmospheric contamination, not tectonic deformation, is responsible for the signal. To explore the capacity of the earthquake to trigger motion on upper plate faults, we use seven published slip maps constrained by geodetic and/or seismic data to calculate static and dynamic Coulomb stress change (CSC) on faults in the Antofagasta region. The static CSC field varies between models and depends on the distribution of coseismic interplate slip. On the basis of the CSC distribution predicted by our preferred model constrained by all available data, we suggest it was unlikely that the Antofagasta earthquake directly triggered normal motion on the AFS, and the InSAR data are consistent with this null result. Field reports of normal faulting related to the earthquake may reflect recent (but not coseismic) motion or highly localized behavior not representative of the regional coseismic stress field. Components: 10,171 words, 12 figures, 4 tables. Keywords: neotectonics; InSAR; subduction; earthquake. Index Terms: 8107 Tectonophysics: Continental neotectonics (8002); 8164 Tectonophysics: Stresses: crust and lithosphere; 1209 Geodesy and Gravity: Tectonic deformation (6924). Received 5 July 2008; Revised 3 October 2008; Accepted 27 October 2008; Published 12 December Loveless, J. P., and M. E. Pritchard (2008), Motion on upper-plate faults during subduction zone earthquakes: Case of the Atacama Fault System, northern Chile, Geochem. Geophys. Geosyst., 9, Q12017, doi: /2008gc Copyright 2008 by the American Geophysical Union 1 of 23
3 1. Introduction [2] The 1000 km-long Atacama Fault System (AFS) is the dominant structure of the northern Chilean forearc. Despite being the focus of several studies [e.g., Arabasz, 1971; Armijo and Thiele, 1990; Niemeyer et al., 1996; Delouis et al., 1998; González et al., 2003], important questions remain regarding the neotectonic behavior of the AFS and other upper plate structures, including their connection with the Andean subduction earthquake cycle, the recurrence interval of slip events, and their seismogenic potential. For the most part, faults in the Antofagasta region (Figure 1) demonstrate finite extension in the direction of plate convergence [Arabasz, 1971; Delouis et al., 1998; González et al., 2003]. Several mechanisms have been proposed to explain the presence of these extensional structures in a convergent margin setting, including earthquake cycle processes of interseismic flexure [González et al., 2003; Loveless et al., 2005; Loveless, 2007] and coseismic elastic rebound [Delouis et al., 1998; González et al., 2003; Loveless et al., 2005; Loveless, 2007], and longer-term effects associated with subduction erosion [Niemeyer et al., 1996; Delouis et al., 1998; von Huene and Ranero, 2003; Sallàres and Ranero, 2005]. While the primary deformation signal on these structures is east-west extension, minor reverse movement is superimposed on some faults [Loveless et al., 2006; Loveless, 2007] and in at least one case represents the most recent episode of fault motion. Despite numerous examples of fresh-appearing surface faulting inferred to reflect Quaternary deformation [Delouis et al., 1998; González et al., 2003; González and Carrizo, 2003], there exists only one definitive date on young fault activity, which constrains motion on one segment of the AFS to be younger than 424 ± 151 ka [González et al., 2006]. Local seismic studies have found little upper plate seismicity distinctly correlated with mapped faults [Arabasz, 1971; Comte et al., 1994; Delouis et al., 1996], leaving the modern seismogenic capability of the AFS poorly understood. [3] We use the 30 July 1995 M w = 8.1 Antofagasta, Chile earthquake as a test case for examining the relationships between crustal faults and subduction zone processes. Studies of this event have benefited from collection of GPS [Ruegg et al., 1996; Klotz et al., 1999; Chlieh et al., 2004], InSAR [Pritchard et al., 2002; Xia et al., 2003; Chlieh et al., 2004; Pritchard et al., 2006a], and geological data [Ortlieb et al., 1996; Delouis et al., 1997, 1998; Klotz et al., 1999; González et al., 2003] before and after the event, and seismic data during the earthquake and its aftershock sequence [Ruegg et al., 1996; Delouis et al., 1997; Husen et al., 1999]; these observations have provided a comprehensive suite of information used to model the rupture process and the induced deformation. [4] Some reports of field observations made shortly after the 1995 Antofagasta earthquake described 20 cm of east-side-down normal fault motion on the Paposo segment of the AFS [Delouis et al., 1997, 1998; Klotz et al., 1999] and 30 cm of normal offset near the Uribe rail station along the Salar del Carmen segment of the AFS (locations shown in Figure 1) [Klotz et al., 1999]. However, other studies found no coseismically triggered faulting on the AFS or subsidiary faults [Campos et al., 1995; Ortlieb et al., 1996; Ruegg et al., 1996] and only minor surface rupture in the form of small surface cracks located near the Salar del Carmen segment as noted by González et al. [2003]. These features have been attributed to deep slip on that fault related to small aftershocks [Ruegg et al., 1996; González and Carrizo, 2003]. Husen et al. [1999] found several deep (10s of kilometers) crustal aftershocks potentially correlated with slip on the AFS but could not confirm a relationship to mapped fault traces. [5] The disparate observations of shallow fault slip encourage further study of the effects of the 1995 earthquake. To image the decimeter-scale normal faulting reportedly triggered by the event, we use coseismic and postseismic InSAR observations, which should be capable of detecting the smallscale vertical offsets [e.g., Bürgmann et al., 2000] proposed by Delouis et al. [1997, 1998] and Klotz et al. [1999]. However, because the putative slip occurred along a 200 m high fault scarp, InSAR observations are complicated by the presence of atmospheric water vapor, which shows a spatial correlation with the underlying topography. The radar signal is delayed by moisture as it propagates through the troposphere [e.g., Hanssen, 2001], introducing signals resembling fault offset into the interferograms. We analyze the atmospheric water vapor measured by the satellite-based MODIS sensor and consider the patterns of spatial and temporal variability in moisture content in our interpretation of the InSAR observations. [6] In addition to the remote sensing observations, we use seven published slip maps [Delouis et al., 2of23
4 these minor stress perturbations [e.g., Fialko et al., 2002]. 2. InSAR Observations Figure 1. Location map of the Antofagasta region, showing the trace of the Atacama Fault System and other scarps (thin black lines with white outline). The dashed lines indicate the surface projections of the subduction trench and 50 km contour to the Wadati- Benioff zone [Cahill and Isacks, 1992]. Diamonds indicate the approximate positions of the field reports of surface rupture triggered by the earthquake: P marks the Paposo rupture [Delouis et al., 1997, 1998; Klotz et al., 1999], U marks the Uribe rail station rupture [Klotz et al., 1999], and C marks the surface cracking along the Salar del Carmen segment [González et al., 2003; González and Carrizo, 2003]. 1997; Ihmlé and Ruegg, 1997; Klotz et al., 1999; Pritchard et al., 2002; Xia et al., 2003; Pritchard et al., 2006a] to calculate Coulomb stress change (CSC) on the AFS and other upper plate faults in order to explore the capacity of the 1995 earthquake for triggering slip on forearc structures. The neotectonic observations of normal and reverse motion indicate that upper plate faults slip in response to both compressional and tensional stress fields. Given the small magnitude of CSC induced by the subduction earthquake cycle, the level of stress on forearc fault zones must be very low in order to allow different senses of slip in response to [7] In order to investigate further any small-scale deformation caused by the Antofagasta earthquake, we examine 6 coseismic and 19 postseismic interferograms constructed from scenes collected along ERS track 96 (Table 1; Figures 2 and 3). We processed the data using the publicly available Caltech/JPL ROI_PAC [Rosen et al., 2004] software and a digital elevation model (DEM) from the Shuttle Radar Topography Mission (SRTM), interpolated from 90 m per pixel resolution to 30 m resolution [Pritchard et al., 2006b], to remove the topographic contribution to the radar-imaged displacement field. We used the algorithm of Chen and Zebker [2001] to unwrap the interferograms and analyzed the line-of-sight (LOS) displacement field at 30 m resolution. We focus on the Paposo segment of the AFS, where field evidence for coseismically triggered normal faulting was reported [Delouis et al., 1997, 1998; Klotz et al., 1999]. We take swath-averaged profiles across the fault scarp in several locations along strike to detect abrupt variations in the LOS displacement that could mark an instance of coseismic surface rupture. The steep incidence angle of the ERS satellites (24 off nadir at the Paposo fault site) means that InSAR is most sensitive to the vertical component of the displacement field, making it an appropriate technique for examining dip-slip displacement on steeply inclined faults. [8] Delouis et al. [1997, 1998] noted that the Paposo segment surface rupture they observed 3 weeks after the Antofagasta earthquake was not present in April 1995, implying that the rupture was generated as a response to the mainshock. Therefore, at least five of the six coseismic interferograms that we analyze should contain a signal of the surface rupture. One postearthquake SAR scene used in the first coseismic interferogram listed in Table 1 was acquired about 8 h after the mainshock. Given that the field observations can only constrain the time of formation of the surface break to be before mid-august when the field survey was carried out, this interferogram does not necessarily span the scarp formation. For all other coseismic interferograms, we expect abrupt gradients in the LOS displacement across the scarp to include effects of the reported 20 cm vertical surface offset. We expect negligible tectonic signal to be present in profiles taken across the scarp in all 3of23
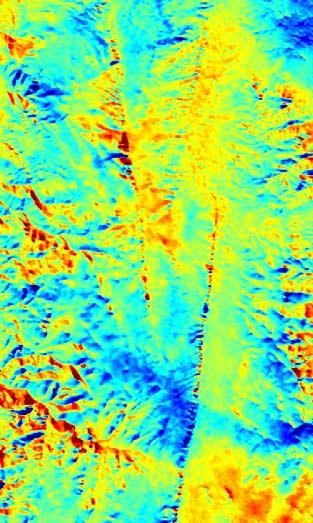
 Unwrapped interferogram. Parallel black lines show the locations of profiles.")
![The effect of the main coseismic signal has been removed by subtracting the bestfitting quadratic ramp from the interferogram [e.g., Pritchard et al., 2002].](/docs-images/85/93043087/images/5-1.jpg "(c) Profile data taken across the Paposo scarp on the unwrapped interferogram.")
5 Figure 2. (a) Wrapped coseismic interferogram using SAR acquisitions on 8 October 1995 and 16 April Arrows show position of abrupt phase offset at the Paposo fault scarp. (b) Unwrapped interferogram. Parallel black lines show the locations of profiles. The effect of the main coseismic signal has been removed by subtracting the bestfitting quadratic ramp from the interferogram [e.g., Pritchard et al., 2002]. (c) Profile data taken across the Paposo scarp on the unwrapped interferogram. Red, blue, and green lines represent the maximum, mean, and minimum LOS displacement values encountered along the profile lines, and black line shows elevations from SRTM topography. The abrupt LOS offset located at the fault scarp has an east-side-up appearance and is of magnitude 0.6 cm. (d) Wrapped coseismic interferograms using scenes collected on 13 July 1997 and 16 April Arrows show position of the Paposo scarp, yet fringes are not offset. (e) Unwrapped interferogram (with quadratic ramp removed as in Figure 2b), confirming the lack of distinct phase offset across the scarp. (f) Profiles taken across the Paposo scarp at the same location as those in Figure 2c. 4of23
")
6 Figure 2. (continued) 5of23

7 Figure 3 6of23
8 Figure 4. Annual variability in the PWV content across the Paposo fault. We extracted profiles across the scarp and calculated the maximum difference in the PWV content on either side of the scarp slope (DPWV). Note that this is not the same quantity as the LOS delay shown in Figure 5. Shown on all plots are the mean and standard deviation for time windows of MODIS acquisitions throughout the years (a) For the weekly calculations, we calculated the mean and standard deviation of all DPWV values collected on the fourth, 11th, 18th, and 25th days of all months, plus and minus 3 days (7 day window), in (b) The twice monthly time windows were defined as the seventh and 21st day of each month, with a 7 day window on either side, for a total of a 15 day window. (c) The monthly calculations were made using windows centered on the 15th day of each month, plus and minus 15 days. The weekly time windows (Figure 4a) show substantial interperiod variability, while the twice monthly windows (Figure 4b) demonstrate much of that variability. The monthly window calculations (Figure 4c) show only a smoothly varying seasonal trend in PWV. of the postseismic interferograms, with the possible exception of those that use the 30 July 1995 scene, which may contain a tectonic signal depending on the actual time of surface rupture MODIS Data Analysis [9] As the SAR signal propagates through the troposphere, precipitable water vapor (PWV) causes delay of the signal phase [e.g., Hanssen, 2001]. Though the Antofagasta region lies within the hyperarid Atacama Desert, PWV, primarily in the form of coastal fog, can introduce errors into interferograms. PWV is frequently correlated with topography, as fog is typically concentrated in valleys more so than on hilltops, thus examination of LOS displacements across variable terrain requires consideration of the radar signal delay due to tropospheric effects. In order to investigate contamination of the InSAR signal, we examine all available PWV data from the Moderate-Resolution Imaging Spectroradiometer (MODIS-Terra) for the region between 2000 and early Two characteristics of these data limit their direct applicability to our InSAR analyses. First, the MODIS and SAR data collections do not coincide temporally. With the exception of one SAR scene (6 March 2000), all of our interferometric data were collected before launch of the Terra satellite, which carries a MODIS sensor. Therefore, we use MODIS data to examine daily and seasonal fluctuations in PWV and extrapolate these patterns backwards in time to explore the potential contamination of the InSAR data by PWV. All MODIS and ERS data were collected around the same time of day (between 1400 and 1600 UTC), which is serendipitous Figure 3. (a) Unwrapped postseismic interferogram constructed using SAR data acquired on 31 May 1999 and 8 October Black lines show the positions of scarp profiles shown in Figure 3c. (b) Unwrapped postseismic interferogram calculated using SAR data collected on 2 December 1996 and 1 April Black lines show the positions of scarp profiles in Figure 3d. (c) Profile data across the Paposo scarp, showing LOS positively correlated with topography. (d) Postseismic profile data showing negative correlation with topography and an abrupt LOS offset similar to that seen in the coseismic profile of Figure 2c. A quadratic ramp has been removed from the interferograms shown in Figures 3a and 3b (as in Figures 2b and 2e). The fact that some postseismic data show LOS gradients similar to those seen in the coseismic image indicates that any coseismic deformation triggered by the subduction zone earthquake is not imageable using currently available interferograms. 7of23
9 considering the significant variability in the density of fog throughout a given day. [10] A second shortcoming of the MODIS data is that the spatial resolution of the measurements (1 km pixel spacing) is far lower than that of the derived interferograms (30 m spacing). This hinders our ability to directly correlate small-scale gradients in the LOS displacement field with abrupt changes in the PWV content. The resolution of the MODIS data is, however, sufficient to detect changes in PWV across scarps of the AFS, and so despite the temporal and spatial limitations, we use the MODIS data to place some constraints on the potential PWV errors in the SAR interferograms. [11] Because we are interested in using InSAR to detect whether or not upper plate faults experienced slip triggered by the Antofagasta earthquake, we examine profiles of PWV signal delay across the Paposo fault scarp. We extract the PWV content along the profiles for all MODIS data collected within the 15 day window centered on the day-of-year of each SAR acquisition used in the interferometry to constrain the seasonality of the PWV content. For example, MODIS data collected between 23 July and 6 August in are used to approximate the PWV distribution at the time of acquisition of the 30 July 1995 SAR image. On the basis of analysis of PWV data over various time periods, we elected to use the 15 day window to capture both the seasonal and intraperiod variability in the data. Figure 4 shows the mean and standard deviation of the maximum difference in PWV (DPWV) across the Paposo scarp for periods of 7, 15, and 30 days throughout the year. The sign convention of DPWV is such that positive values of DPWV indicate PWV content greater in the valley adjacent to the scarp than above the scarp itself. We calculated DPWV across the scarp for all MODIS acquisitions for all days within a given time period. The weekly (7 day) periods show short-wavelength fluctuations in both the means and standard deviations (Figure 4a). The 15 day periods capture much of the inter-period variability (Figure 4b) but are not subject to as much noise as the weekly time windows. The monthly (30 day) periods (Figure 4c) show only a smoothly varying seasonal trend in DPWV that does not reflect some of the shorter-wavelength changes shown by the weekly and twice monthly calculations. In all cases, the standard deviations are large compared to the magnitude of DPWV, demonstrating the significant daily variation of moisture content. [12] For each interferometric pair, we calculate a histogram showing the frequency of phase delay magnitudes (Figure 5). These histograms indicate the likelihood that an observed offset in LOS displacement across a fault scarp can be explained solely by the phase delay resulting from propagation of the radar signal through the PWV in the troposphere. To prepare these histograms, we converted the MODIS-measured PWV to magnitude of LOS radar phase delay using the equation [e.g., Hanssen, 2001; Pavez et al., 2006] Q 1 PWV*4p f v ¼ ; ð1þ l cos q i where f v is the phase delay induced by 1 mm of PWV in the troposphere, P is a constant (0.15) [Bevis et al., 1996], l is the radar wavelength (56.56 mm for ERS-1 and 2 data), and q i is the radar incidence angle in degrees from vertical (24 for ERS-1 and -2 data at the Paposo scarp). Each f v profile within the 15 day window encompassing the first SAR image in a interferometric pair is subtracted from the f v profiles taken across the data collected within the 15 day window of the second SAR image, resulting in a differenced profile of Df v values. The frequency distribution of the maximum range of Df v values in each differenced profile (converted from radians to centimeters to facilitate comparison with the LOS measurements) is represented by the histograms (Figure 5), with positive range values indicating Df v that are greater in the east than in the west of the profile. 3. InSAR and MODIS Interpretation [13] On the basis of our analyses of the coseismic and postseismic InSAR data, we conclude that the reported normal fault offset at the Paposo segment of the AFS is not imageable using available satellite geodesy. Although some coseismic interferograms show an apparent offset across the fault (Figures 2a 2c), several lines of evidence led us to conclude that the signal is more likely to result from errors in the interferogram than from tectonic deformation: [14] 1. The apparent offset signal is not present in all coseismic interferograms (e.g., Figures 2d 2f and low-magnitude signals in Figure 6). Furthermore, some postseismic interferograms, which we expect to contain no signal of upper plate faulting, show LOS displacement gradients across the scarp 8of23
10 Figure 5. Histograms showing the frequency distribution of potential delay of the InSAR phase by propagation through precipitable water vapor (PWV) in the troposphere, as measured in MODIS data. This analysis is purely a statistical estimation of how a particular interferometric pair may be influenced by PWV, since the InSAR and MODIS data collection do not coincide temporally. The first column shows potential contamination by PWV of the six coseismic interferograms, while the remaining columns indicate the effect of PWV on the postseismic data. Histograms are constructed by taking a swath profile across the Paposo fault of PWV measured by the MODIS satellite within one week of each SAR acquisition, differencing the profiles for SAR image 1 from those for SAR image 2, then finding the maximum range of PWV within each differenced profile and converting the range to the LOS delay using equation (1). The mean ( M ) and standard deviation ( SD ), expressed in centimeters, are given in the upper right corner of each histogram. See section 2.1 for details. that are either positively and negatively correlated with topography (Figures 3b and 3d and Figure 6). [15] 2. The apparent offset in LOS occurs along more than 20 km of the fault scarp (Figures 2a and 2b), whereas the reported coseismic scarp was only several hundred meters long [Delouis et al., 1997, 1998]. The extent of the surface rupture does not necessarily reflect the region affected by upper plate faulting: buried (nonsurface breaking) slip on the Paposo segment may have produced centimeter-scale deflections of the surface for several kilometers along strike on either side of the surface scarp bounds. However, if this were the case, we would expect the InSAR data to show an approximately elliptical along-strike distance-displacement profile [e.g., Dawers et al., 1993], presumably centered about the reported 20 cm vertical offset. Profiles taken across the scarp show approximately the same magnitude of phase offset regardless of position along strike. [16] 3. The magnitude of the LOS displacement offset is on the order of 1 3 cm (Figures 2c and 6), 9of23
11 Figure 6. Date versus offset plots for profiles P1 P4 taken at different locations perpendicular to the strike of the Paposo segment of the AFS. Offset is defined as the LOS displacement measured on the unwrapped interferograms on the east side of the scarp minus the LOS displacement on the west side. The vertical line on 30 July 1995 marks the date of the earthquake, and the SAR data acquired that day were collected after the mainshock. The largest magnitude of postseismic offset is similar to the 5.6 cm wavelength of the radar signal, indicating that this offset likely results from an unwrapping error. which can be explained solely by the variation in PWV content across the scarp (Figure 5). [17] 4. The symmetry of the PWV histograms indicates that positive and negative correlation between PWV-influenced LOS displacement and topography are more or less equally likely to occur, which can explain both the apparent west-side-up and east-side-up patterns of displacement across the scarp seen in the postseismic images (Figures 3 and 6). Negligible displacement gradients across the scarp (e.g., Figures 2d 2f and small magnitude offsets of Figure 6) indicate more spatially homogeneous tropospheric conditions at the times of both SAR scene acquisitions. [18] In low relief areas, interferometric correlation can be used to determine the extent to which the radar scattering properties of the surface have changed between the SAR scene acquisitions as a result of tectonic and other disturbances [e.g., Zebker and Villasenor, 1992; Fielding et al., 2005]. In the regions affected by the Hector Mine and Bam earthquakes, linear traces of decorrelated 10 of 23
12 Table 1. InSAR Data Used in This Study a Image 1 Image 2 B?,m b Coseismic 16 Apr Jul Apr Oct May Oct Nov Apr Apr Oct Nov Nov Postseismic 12 Oct Jul Mar Dec Apr Dec Mar Apr Apr Apr Dec Apr Jul Oct Oct Oct Oct Nov Jul Dec Nov Dec Jul May Oct May Oct May Jul Mar Apr Mar Oct Mar Nov Mar Dec Mar a All images are from ERS track 96. b B? is the perpendicular baseline between the two images used to create each interferogram. pixels in the interferograms coincide with mapped surface ruptures, thereby providing a spatially complete view of the extent of ground deformation caused by the events [Simons et al., 2002; Fielding et al., 2005]. In areas of high relief, the viewing geometries between the satellite and ground surface are slightly different in each SAR scene, which can contribute a baseline-dependent geometric decrease in correlation [e.g., Zebker and Villasenor, 1992; Fielding et al., 2005]. The fault scarps of the Antofagasta region are characterized by steep topographic slopes, which in most of the coseismic and postseismic interferograms are highlighted by linear traces of low correlation, even in interferograms with baselines 40 m or less (Table 1). Because the reported surface rupture associated with the Antofagasta earthquake lies along the Paposo fault scarp [Delouis et al., 1997, 1998], any decorrelation caused by the rupture itself may be masked by the larger field of decorrelation resulting from the steep topography. 4. Modeling Coulomb Stress Change [19] Although we are unable to conclusively document any triggered fault slip using the available InSAR data, we take a theoretical approach to assess the shallow stress field induced by the earthquake. We calculate the upper plate coseismic Coulomb stress change (CSC) in the Antofagasta region using seven published maps of coseismic slip on the subduction thrust [Delouis et al., 1997; Ihmlé and Ruegg, 1997; Klotz et al., 1999; Pritchard et al., 2002; Xia et al., 2003; Pritchard et al., 2006a]. The slip maps vary significantly in geometry and slip distribution (Table 2 and Figure 7). In models 1, 3, and 5, we relied on digitization of published slip maps, and for models 2, 4, 6, and 7 we used the exact published slip distributions in the calculations. Interpolating the irregularly spaced slip maps (models 1, 3, and 4) onto regularly spaced grids of smaller fault patches, as shown in Figure 7, results in variation in the CSC predictions, but similar smoothing of the already regu- Table 2. Coulomb Stress Change Modeling Parameters Model a Data Used Length (km) Width (km) Depth Range (km) Number of Patches Mean Dip b Mean Rake b Moment c (10 10 m 3 ) 1 Body wave GPS InSAR, GPS InSAR, GPS Surface wave, GPS InSAR, GPS InSAR, GPS, Body wave a Model references: 1. Delouis et al. [1998], 2. Klotz et al. [1999], 3. Xia et al. [2003], 4. Pritchard et al. [2002], 5. Ihmlé and Ruegg [1997], 6. Pritchard et al. [2006a], 7. Pritchard et al. [2006a]. b Mean values are weighted by slip magnitude. c Geometric moment (sum of fault patch areas times slips) is reported. 11 of 23
 considered in the boundary element models are shown as black lines")


![Position of trench (west) and 50 km Wadati-Benioff zone contour (east) from Cahill and Isacks [1992] are shown as dashed lines and vary to different degrees from the subduction zone geometry assumed](/docs-images/85/93043087/images/13-4.jpg "in each of the models. larly spaced slip distributions (models 2, 5, 6, and 7) does not have a substantial impact on the CSC.")

13 Figure 7. (a) Location map of region affected by the 1995 Antofagasta earthquake. Select upper plate faults (Papo: Paposo, Colo: Coloso, SdC: Salar del Carmen, Fort: Fortuna, Mj: Mejillones, Hr: Caleta Herradura) considered in the boundary element models are shown as black lines in all figures. Focal mechanism is from Harvard CMT catalog. (b h) Slip distributions, expressed in meters, used as input for the Coulomb stress modeling. Slip distributions for models 1, 3, and 5 were digitized from the publications referenced in Table 2, while exact slip distributions were used for models 2, 4, 6, and 7. All slip maps shown here have been interpolated on a 1010 km grid, but the original slip distributions were used in the Coulomb stress calculations. Lines on land show positions of faults, as identified in Figure 7a. Position of trench (west) and 50 km Wadati-Benioff zone contour (east) from Cahill and Isacks [1992] are shown as dashed lines and vary to different degrees from the subduction zone geometry assumed in each of the models. larly spaced slip distributions (models 2, 5, 6, and 7) does not have a substantial impact on the CSC. Though the interpolated slip maps produce a smoother distribution of CSC, we consider only the original, published slip maps, as they represent the models that best fit the data used as constraint. [20] The CSC resulting from a tectonic perturbation is defined as CSC ¼ Dt m 0 Ds n where Dt is the change in shear stress on a surface of prescribed orientation, m 0 is the effective coefficient of friction, and Ds n is the change in normal stress across the defined surface [King et al., 1994; Beeler et al., 2000; Toda and Stein, ð2þ 2002]. The maps of CSC presented in Figure 8 represent the changes in Coulomb stress resolved onto fault planes striking N10 E, approximately parallel to the northern Chilean coastline, dipping 80 E with a slip vector of rake 100 (positive counterclockwise from the strike direction). This orientation and slip sense are broadly consistent with fault kinematic data collected in the Antofagasta region [Delouis et al., 1998; González et al., 2003]. We calculate the coseismic stress tensor using a three-dimensional boundary element code (Poly3D) [Thomas, 1993] incorporating discontinuities within a homogenous elastic half-space (characterized by a shear modulus of 30 GPa and Poisson s ratio, u, of 0.25) in order to examine the interaction between the subduction zone earth- 12 of 23
14 Figure 8. (a) Location map of region affected by the 1995 Antofagasta earthquake as in Figure 7a. (b h) Results of the Coulomb stress change (CSC) modeling. CSC is calculated at a depth of 1 km on planes striking 010, dipping 80 E, with a slip vector of 100. Models 1, 3, 4, and 5 show outlines of the fault patches used in the calculation of Coulomb stress. For model 2, the parallel lines show the down-dip extents of the fault, with the along-strike extents lying outside of the figure bounds at 25.8 and 21.8 S; the CSC was calculated using the exact slip distribution of Klotz et al. [1999]. Contours of slip magnitude are shown for models 6 and 7 (contour interval is 1 m). quake and upper plate faults. We then convert the stress tensor into values of CSC by rotating the tensor into a coordinate system whose three axes are parallel to the slip vector and fault plane, perpendicular to the slip vector and parallel to the fault plane, and normal to the specified fault plane. All CSC calculations were carried out at a depth of 1 km, with m 0 = 0.4, following previous studies of static CSC [King et al., 1994; Toda et al., 1998; Toda and Stein, 2002; Lin and Stein, 2004]. Changes in the depth (0 z 3 km), m 0 value (0 m 0 0.6), Poisson s ratio (0.25 u <0.5), or receiver fault geometry ( 10 strike 30, 65 dip 85 E) and rake ( 110 rake 90 ) do not substantially affect the overall patterns of CSC. Additionally, calculations made in a layered elastic half-space based on the velocity model of Husen et al. [1999] do not differ notably from those in the homogenous half-space; the results using the latter are presented here. Finally, expressing the CSC as CSC 0 ¼ Dt mðds n BDs Þ; ð3þ where m is a laboratory value of dry friction (0.7) [Byerlee, 1978], B is Skempton s coefficient, taken to be 0.5 [Beeler et al., 2000, and references therein], and D is the mean stress (D = s kk /3 for k = 1, 2, 3), i.e., where the friction term is a function of spatially variable mean stress and pore pressure [Beeler et al., 2000], produces similar patterns of coseismic stress change. We show and discuss results as calculated using equation (2) throughout the paper. 13 of 23

![b See Figure 8a for rupture locations. [21] The sign convention adopted is such that positive CSC increases the likelihood of failure in the direction of the specified rake.](/docs-images/85/93043087/images/15-1.jpg "Conversely, a negative CSC decreases the chances of normal rupture on these faults and may even encourage movement in a direction opposite the specified vector if the existing stress level on the")
15 Table 3. Calculated Optimal Slip Directions on Upper Plate Faults With Reported Coseismic Rupture Fault b Strike Dip Slip Direction a Predicted by Model P E U E a Rake is measured counterclockwise from strike, i.e., 0 : leftlateral, 90 : reverse, ±180 : right-lateral, 90 : normal. b See Figure 8a for rupture locations. [21] The sign convention adopted is such that positive CSC increases the likelihood of failure in the direction of the specified rake. Conversely, a negative CSC decreases the chances of normal rupture on these faults and may even encourage movement in a direction opposite the specified vector if the existing stress level on the fault is sufficiently low. Several studies [e.g., Toda et al., 1998; Toda and Stein, 2002; Lin and Stein, 2004] have demonstrated that earthquake aftershocks generally are concentrated in regions of positive CSC, while the rate of seismicity tends to decrease in stress shadows (areas of negative CSC) generated by a large event. No aftershocks of the Antofagasta earthquake have been definitively correlated with the reported rupture on the Paposo or Salar del Carmen segments [Delouis et al., 1998; Husen et al., 1999; Sobiesiak, 2004], but we assume that any coseismic normal surface rupture should lie within a region in which positive CSC is predicted at shallow depths. [23] In addition to performing a calculation of CSC on fault planes of the specified orientation with the specified slip vector, which is meant to approximate the fault slip data collected in the field, we also calculated the rake on the specific faults identified in Figure 8a that maximizes the increase in Coulomb stress. That is, we solved for the direction of slip most likely induced by the coseismic forcing. At the northern end of the Paposo segment (diamond marked P in Figure 8a), where pure normal rupture was reported by Delouis et al. [1997, 1998], only model 2 predicts normal motion as the optimal slip direction (rake of 82, Table 3). Normal/left-lateral motion is suggested by models 1, 4, and 5, while models 3 and 5 7 predict left-lateral to reverse motion as the most likely sense of slip (Table 3), which is inconsistent with the field reports. At the Uribe rail station ( U in Figure 8a), where Klotz et al. [1999] reported 30 cm of normal fault offset, leftlateral motion, with a small component of reverse faulting, is predicted as the optimal type of failure by all models (Table 3). 6. Discussion 6.1. Effects of Slip Distribution [24] Differences in the predicted upper-plate CSC result from differences in the data used as con- 5. Modeling Results [22] Figure 8 shows the results of the CSC modeling. Models 1 4 show increases in Coulomb stress along the Paposo segment of the AFS (labeled Papo in Figure 8a) and models 5 7 show zero or negative CSC along this fault, where Delouis et al. [1997, 1998] suggest 20 cm of coseismic normal faulting. The Coloso fault (Colo), located just north of the Paposo segment, experienced positive CSC according to models 1 5 but was affected by negative CSC in models 6 and 7. Most if not all of the Mejillones Peninsula, on which several normal faults are located, experienced a Coulomb stress decrease according to all models. Likewise, all models predict negative CSC along the Fortuna (Fort) fault and Salar del Carmen segment (SdC) of the AFS, although the southern extreme of this segment lies within a region of Coulomb stress increase in models 1 3. Figure 9. Dynamic Coulomb stress change (DCSC) calculations. (a) Maximum DCSC calculated at 1 km depth using the method of Cotton and Coutant [1997]. (b) Final DCSC calculated using the mean DCSC from seconds of the synthetic stressgram. Figure 9 is comparable to the standard calculation of static CSC as shown in Figure 8h. 14 of 23
16 straint as well as the modeling strategy employed to estimate the slip distribution. Models 1 4 show broadly distributed slip of low to moderate magnitude (maximum 3 4 m), whereas models 5 7 show a concentration of greater magnitude slip (6 7 m) near the center of their model fault (Figure 7). This variation translates into different patterns of predicted CSC: broad slip models show a continuous zone of positive CSC across the forearc, whereas more concentrated slip results in a zone of zero to negative CSC in the coastal area where upper plate normal faults are concentrated (Figure 8). We discuss these differences in more detail in Appendix A Role of Dynamic Coulomb Stress Changes [25] Figure 8 and section 5 illustrate the static CSC induced by the Antofagasta earthquake. Dynamic Coulomb stress changes (DCSC) describe the change in CSC throughout the rupture period and depend on both the spatial and temporal evolution of slip [Kilb et al., 2002]. To compare the static and dynamic stress fields, we calculate DCSC using the method of Cotton and Coutant [1997], the coseismic slip map based on the joint inversion of Pritchard et al. [2006a] (model 7), and the layered elastic 1-D velocity model of Husen et al. [1999]. We calculate CSC at 0.5 second intervals for the first 100 s of rupture, using the same depth, friction, and receiver fault parameters as those presented in section 4. Figure 9a shows the peak DCSC, calculated by taking the mean of the 10 greatest magnitude values of DCSC through the time series. This approach was taken to smooth the plot of DCSC; the unsmoothed version using the true maximum DCSC shows a similar albeit rougher distribution of peak DCSC with magnitude up to 2.7 MPa (compared to the maximum of 1.4 MPa for the averaged version). In order to validate the DCSC model, we calculate from it the approximate static CSC by taking the mean DCSC value over seconds of the stress change record (Figure 9b). The distribution of static CSC calculated in this way is reasonably similar to that shown in Figure 8h. [26] DCSC does not affect the final state of stress on a particular fault; dynamically triggered deformation results from a change in the physical properties of the fault zone and/or its surroundings [Kilb et al., 2002]. Thus, normal faulting triggered by dynamic stress may happen during the earthquake rupture, or following the rupture as a result of the altered physical properties. The latter mechanism of deformation may explain the coseismic surface cracks that formed nearly parallel to the Salar del Carmen segment of the AFS [González et al., 2003]. This locality is anomalous in that vegetation is relatively dense and the water table is nearer the surface than it is throughout much of the Antofagasta region (D. Carrizo, personal communication, 2004). Therefore, dynamic stress waves through this region may have exploited the unique physical properties of the soil and/or caused fluctuations in pore fluid pressure to cause open cracking. The strike of cracks parallel to the local orientation of the AFS suggests that the fault influenced crack formation by defining a preexisting weak zone and/or guiding stress waves along a trajectory appropriate for opening surface cracks, though this effect is not considered in our dynamic stress model End-Member Interpretations of InSAR Observations [27] The lines of evidence presented in section 3 indicate that the offsets seen in the LOS profiles of the coseismic and postseismic InSAR data likely result from atmospheric contamination of the radar signal, not tectonic surface deformation. The symmetry of the PWV range histograms (Figure 5; section 3) shows that the phase delay caused by tropospheric PWV is equally likely to produce an east-side-up offset of the SAR signal across topography as a west-side-up signal. Therefore, it is possible that any LOS offset in the interferograms could result from a convolution of true surface offset and the effects of PWV. In other words, all apparent offsets seen in the coseismic InSAR data may represent the combined effects of surface faulting and PWV delay, and the lack of LOS offset in some coseismic interferograms, such as that shown in Figures 2d 2f, may result from a tectonic signal being erased by the appropriate opposite PWV delay pattern. [28] The maximum LOS offset across the Paposo fault that we observe in any coseismic interferogram is 3 cm (Figure 6), while Delouis et al. [1997, 1998] report 20 cm of vertical displacement. These disparate measurements are not necessarily contradictory: the field observations were presumably made at the location of the scarp, while InSAR measures offsets over a length scale of one or more pixels (i.e., 30 m in the case of our derived products). Assuming that the surface displacement field associated with the scarp decays 15 of 23
17 Figure 10. Simple two-dimensional dislocation model of the displacement field surrounding the Paposo segment of the Atacama Fault System. In order for the displacement field to agree with both the field reports and the end-member interpretation of the InSAR data (section 6.3), vertical offset must be 20 cm at the fault and just 3 cm at a distance of a few pixels away from the fault. Twenty centimeters of slip is applied uniformly to a surface-breaking fault dipping 70 E with a downdip extent of 25, 50, or 75 m. Light gray box defines a 3 cm offset, centered about zero displacement. from 20 cm to 3 cm over a distance of 1 3 pixels (30 90 m), we can place constraints on the depth to which the fault experienced triggered slip. To do so, we use a simple two-dimensional elastic dislocation model to calculate the vertical displacement field resulting from 20 cm of slip on a surfacebreaking fault dipping 70 E. Vertical offset is 20 cm at the fault and decays smoothly with distance from the fault (Figure 10). We hold the fault dip and applied slip constant and vary the downdip extent of faulting. We calculate the maximum vertical offset at distances of 30, 60, and 90 m from the fault, corresponding to the difference in LOS at spacing 1, 2, and 3 pixels apart. In order to agree with both the end-member interpretation of the InSAR observations and the field reports, the line-of-sight displacement must be 3 cm at a distance of a few pixels away from the fault. We find that the required downdip extent of faulting is just m, which results in offset of 7 12, 2 7, and cm at distances 30, 60, and 90 m from the fault (Figure 10). If taken at face value, this end-member interpretation of the InSAR data suggests that recent surface ruptures on forearc faults reflect deformation restricted to very shallow levels, which further justifies our calculation of CSC near the surface. However, as discussed in section 3, we instead interpret the lack of consistent sign and magnitude of offset signal across the fault in the coseismic and postseismic interferograms as indication that no surface rupture can be imaged using the currently available data Implications for Normal Fault Evolution [29] The lack of consistency between the static CSC predicted by the best constrained models (5 7), the InSAR observations, and the reported examples of coseismic fault slip indicates that the static stress changes associated with the 1995 Antofagasta earthquake cannot explain the putative surface faulting attributed to the event. Peak DCSC is everywhere positive and is thus a plausible mechanism for triggering normal slip, but there is no clear relationship between the distribution of DCSC and the localities of reported coseismic faulting. [30] The majority of young normal fault scarps in the coastal region of northern Chile lie within the negligible to negative CSC predicted by the slip distribution models that are constructed by inversion of multiple constraints from seismic and/or geodetic data (models 5 7). Furthermore, models that predict positive CSC (models 1 4 and peak DCSC) for the coastal region south of Antofagasta 16 of 23
18 show a saddle pattern of Coulomb stress increase: areas just offshore and in the eastern part of the Coastal Cordillera lie within zones of CSC of greater magnitude than the changes predicted for the coastal region where faults are mapped. Numerous north-south striking normal faults have been imaged offshore and are thought to result from gravitational instability caused by tectonic erosion at the subduction trench [von Huene and Ranero, 2003; Sallàres and Ranero, 2005]. However, models resolving the coseismic CSC onto planes dipping 30 W, consistent with the low-angle nature of these faults as seen in seismic reflection data [von Huene and Ranero, 2003; Sallàres and Ranero, 2005], also show a maximum increase in Coulomb stress in offshore regions at S latitude, suggesting that coseismic stress may be superimposed on the long term gravitational stress field to induce movement on these structures. [31] The fact that the majority of onshore normal faults around Antofagasta lie within regions of near zero to negative CSC (models 5 7) or in the low magnitude part of the saddle of Coulomb stress increases (models 1 4) argues against coseismic static stress change being the sole cause of extensional failure. Delouis et al. [1998] present a model in which Coulomb stress on normal faults is reduced by interseismic contraction and increased by subduction earthquakes, and when a Coulomb failure stress is reached following several subduction earthquake cycles, rupture will occur. Models of interseismic deformation [Loveless, 2007] indicate that Coulomb stress is increased due to flexural stresses, while the coseismic models presented here indicate that stress may then be increased or decreased during a subduction earthquake depending on the distribution of coseismic slip. Thus, normal fault slip may occur during the interseismic period of the subduction earthquake cycle or exclusively when triggered by coseismic increases in Coulomb stress [Loveless, 2007]. [32] Reverse slip may be encouraged coseismically on faults lying within a zone of negative CSC. Minor reverse slip has occurred on the Salar del Carmen and Paposo segments [Loveless et al., 2006; Loveless, 2007], and the CSC models presented here provide a mechanism for this style of deformation. For a fault to reverse its long-term sense of motion in response to the low-magnitude stress change induced by a subduction zone earthquake, the level of existing stress on the fault must be minute. This may indicate that the slipping zone is weak, characterized by a low coefficient of friction, high fluid pressure, and/or reduced rigidity of the fault zone [e.g., Fialko et al., 2002]. 7. Conclusions [33] This paper has provided some constraints on the neotectonic behavior of the AFS and other upper plate structures, but some mysteries remain. Previous field work had suggested that the AFS slipped in a normal sense as a result of static CSC caused by the 1995 M w = 8.1 Antofagasta subduction zone earthquake [Delouis et al., 1998]. Our work reveals that the impact of the static CSC from the Antofagasta earthquake on the AFS is sensitive to the coseismic slip distribution, but the static CSC calculated with our favored slip model inhibited the putative motion on the AFS. If the AFS did move in a normal sense as a result of the 1995 earthquake, it could have been triggered by the dynamic CSC. Since the existence of fault motion triggered by the 1995 earthquake is controversial, we attempted to use InSAR observations to settle the debate. After analysis of 24 interferograms and satellite observations of the variability of water vapor in the atmosphere near the AFS, we conclude that we can not resolve the question with the available data. Instead, we suggest that care must be taken when using InSAR to interpret small-scale fault slip, particularly in regions of high topographic relief [e.g., Wright et al., 2001; Fialko et al., 2002]. Simultaneous measurement of PWV with SAR acquisitions, as done by the MERIS instrument on board the ENVISAT satellite, can be used to correct SAR measurements for the effects of water vapor [e.g., Li et al., 2006]. However, the coarse resolution of MERIS data, as well as low accuracy in high-relief areas, limits their applicability to InSAR-based studies of smallscale deformation such as ours. [34] In a larger sense, our work supports the conclusion of Delouis et al. [1998] that the subduction zone earthquake cycle plays an important role in driving motion on the upper plate faults of the northern Chilean forearc. New field observations of the Paposo and Salar del Carmen segments of the AFS indicate that while the dominant accumulated sense of slip is normal, there is also evidence for minor reverse activation [Loveless, 2007]. The normal motion could be encouraged by several processes including interseismic flexure [Loveless, 2007] and dynamic CSC from subduction zone earthquakes. The reverse motion could be induced by the static CSC from earthquakes similar 17 of 23
19 Figure A1. Perspective view demonstrating the Gaussian surface fitting. All plots show the spatial distribution of coseismic slip on the subduction thrust, with the x and y axes representing the downdip and along-strike position, respectively, of a given fault element, and the z-axis showing the slip magnitude. (a) Original slip map of model 6. (b) Best-fit Gaussian slipmap for parent model 6. (c) Gaussian slipmap that produces continuous, positive CSC throughout the coastal region. (d) Synthetic model with reduced curvature as compared to Figure A1b, yet still produces a zone of negative CSC near the coast. Parameters for Figures A1b, A1c, and A1d are given in Table A1 (models S4 6). The color scale applies to all diagrams. See text for more details about the procedure. 18 of 23
20 Figure A1. (continued) 19 of 23
21 Table A1. Gaussian Surface Parameters for Synthetic Slip Maps a Synthetic Model Parent Model b a c d b x b y c x c y Curvature e Synthetic Parent Curvature Synthetic Moment f (10 10 m 3 ) Parent Moment (10 10 m 3 ) Result g S B S P S N S B S P S N a See equation (A1). b Original slip map interpolated to a km grid. c Parameter a is equivalent to maximum slip of parent model in meters. d Values of b i are presented in kilometers relative to the SW corner of the parent model fault. e Curvature is calculated by summing the absolute value of the discrete Laplacian of slip calculated at each fault element. f Geometric moment, as in Table 2. g B is the model which best fits the parent model. P is the continuous zone of positive Coulomb stress change. N is the coastal zone of negative Coulomb stress change. to the 1995 event. In any case, this oscillating fault motion suggested by the field work and stress modeling indicates a low state of absolute stress in the near-surface regions of the upper plate fault zones, allowing slip to occur in either direction in response to stress applied by the subduction earthquake cycle. Appendix A [35] To examine the link between the concentration of slip and the resulting near-surface stress field, we create synthetic slip maps that approximate the slip distribution of one model from each of the two groups (models 2 and 6). These two models were qualitatively judged to feature the smoothest varying slip distributions, which we approximate with a Gaussian surface (Figure A1). We define the Gaussian slip distribution using the equation u ¼ a exp ðx b xþ 2 2c 2 x! ðy b yþ 2 2c 2 y ða1þ where u is the synthetic slip magnitude, x and y are the down-dip and along-strike center coordinates of fault patches, a is the maximum slip magnitude of the parent model, b i (i = x, y) are the coordinate locations of the maximum slip value (relative to the southwest corner of the slipmap), and c i describe the curvature of the Gaussian surface. We first use a grid search to solve for the best-fitting parameters, then vary c i in order to examine the effects of the slip gradient on the resulting map of CSC and calculate the total curvature for each slip map. For all synthetic slip maps, we use the average rake of the corresponding parent model (Table 2) for every fault element and hold constant the location b i of the element with maximum slip. We adjust the magnitude of maximum slip a in order to minimize the difference between the moments of the synthetic and parent models (Table A1). It is important to note that despite the adjustments made to a, moment is not conserved in these perturbed Gaussian models (Table A1). The variations in curvature serve to demonstrate the difference in resulting near-surface CSC, but the slip models themselves are not meant to accurately fit the constraining data of the parent model. [36] The aforementioned effect of the differences in slip distribution in models 1 4 and 5 7 on the CSC maps (Figures 7 and 8) is confirmed by the Gaussian surface synthetic slip maps. For each parent model, three Gaussian approximations are shown in Figure A2: a model that best fits the original slip distribution (Figures A2a and A2d), a model with c i values that produce a continuous region of positive CSC from the coast towards the arc (Figures A2c and A2f), and a model whose slip distribution results in a zone of negative CSC in the coastal zone south of Antofagasta (Figures A2c and A2f). Reducing the overall curvature of the Gaussian surface fit to parent model 6, in other words, smoothing the transition from zero to a by increasing c i, eliminates the coastal region of negative CSC that appears in the parent model and the best-fitting Gaussian slip distribution (Figures 8g and A2e; Table A1). Conversely, increasing the slip gradient of the Gaussian approximation of model 2 (by decreasing c i ) intro- 20 of 23

 Gaussian distribution of slip based on parent model 2.")

 along with adjusted Gaussian distributions that")
 and a zone of negative CSC along the coast (Figures")
22 Figure A2. Gaussian surface approximations of slip distributions and resulting CSC maps. (a c) Gaussian distribution of slip based on parent model 2. (d f) Gaussian distribution of slip based on model 6. For each parent model, the Gaussian distribution that best fits the actual slip magnitude distribution is shown (Figures A2a and A2d) along with adjusted Gaussian distributions that produce all positive CSC region near the coast (Figures A2b and A2e) and a zone of negative CSC along the coast (Figures A2c and A2f). See Table A1 for slip distribution parameters and text for additional discussion. 21 of 23
to: Interseismic strain accumulation and the earthquake potential on the southern San
 Supplementary material to: Interseismic strain accumulation and the earthquake potential on the southern San Andreas fault system by Yuri Fialko Methods The San Bernardino-Coachella Valley segment of the
Normal and reverse faulting driven by the subduction zone earthquake cycle in the northern Chilean fore arc
 Click Here for Full Article Normal and reverse faulting driven by the subduction zone earthquake cycle in the northern Chilean fore arc John P. Loveless, 1,2 Richard W. Allmendinger, 1 Matthew E. Pritchard,
Geodesy (InSAR, GPS, Gravity) and Big Earthquakes
 and Big Earthquakes") Geodesy (InSAR, GPS, Gravity) and Big Earthquakes Mathew Pritchard Teh-Ru A. Song Yuri Fialko Luis Rivera Mark Simons UJNR Earthquake Research Panel, Morioka, Japan - Nov 6, 2002 Goals Accurate and high
Geodesy (InSAR, GPS, Gravity) and Big Earthquakes Mathew Pritchard Teh-Ru A. Song Yuri Fialko Luis Rivera Mark Simons UJNR Earthquake Research Panel, Morioka, Japan - Nov 6, 2002 Goals Accurate and high
Co-seismic slip from the July 30, 1995, M w 8.1 Antofagasta, Chile, earthquake as constrained by InSAR and GPS observations
 98 Chapter 3 Co-seismic slip from the July 30, 1995, M w 8.1 Antofagasta, Chile, earthquake as constrained by InSAR and GPS observations Published by Blackwell Publishing Ltd. in Geophysical Journal International
Data Repository of Paper: The role of subducted sediments in plate interface dynamics as constrained by Andean forearc (paleo)topography
topography") Data Repository of Paper: The role of subducted sediments in plate interface dynamics as constrained by Andean forearc (paleo)topography Nicolás J. Cosentino 1*, Felipe Aron 2,3, Jorge G. F. Crempien 2,3,
Data Repository of Paper: The role of subducted sediments in plate interface dynamics as constrained by Andean forearc (paleo)topography Nicolás J. Cosentino 1*, Felipe Aron 2,3, Jorge G. F. Crempien 2,3,
Distribution of slip from 11 M w > 6 earthquakes in the northern Chile subduction zone
 Click Here for Full Article JOURNAL OF GEOPHYSICAL RESEARCH, VOL. 111,, doi:10.1029/2005jb004013, 2006 Distribution of slip from 11 M w > 6 earthquakes in the northern Chile subduction zone M. E. Pritchard,
ABSTRACT. Key words: InSAR; GPS; northern Chile; subduction zone.
 ASPERITIES, BARRIERS AND TRANSITION ZONE IN THE NORTH CHILE SEISMIC GAP: STATE OF THE ART AFTER THE 007 MW 7.7 TOCOPILLA EARTHQUAKE INFERRED BY GPS AND INSAR DATA Marta Bejar Pizarro, Daniel Carrizo, Anne
27th Seismic Research Review: Ground-Based Nuclear Explosion Monitoring Technologies
 GROUND TRUTH OF AFRICAN AND EASTERN MEDITERRANEAN SHALLOW SEISMICITY USING SAR INTERFEROMETRY AND GIBBS SAMPLING INVERSION Benjamin A. Brooks 1, Francisco Gomez 2, Eric A. Sandvol 2, and Neil Frazer 1
Supplementary Material
 1 Supplementary Material 2 3 4 Interseismic, megathrust earthquakes and seismic swarms along the Chilean subduction zone (38-18 S) 5 6 7 8 9 11 12 13 14 1 GPS data set We combined in a single data set
Journal of Geophysical Research (Solid Earth) Supporting Information for
 Supporting Information for") Journal of Geophysical Research (Solid Earth) Supporting Information for Postseismic Relocking of the Subduction Megathrust Following the 2007 Pisco, Peru earthquake D.Remy (a), H.Perfettini (b), N.Cotte
Journal of Geophysical Research (Solid Earth) Supporting Information for Postseismic Relocking of the Subduction Megathrust Following the 2007 Pisco, Peru earthquake D.Remy (a), H.Perfettini (b), N.Cotte
INGV. Giuseppe Pezzo. Istituto Nazionale di Geofisica e Vulcanologia, CNT, Roma. Sessione 1.1: Terremoti e le loro faglie
 Giuseppe Pezzo Istituto Nazionale di Geofisica e Vulcanologia, CNT, Roma giuseppe.pezzo@ingv.it The study of surface deformation is one of the most important topics to improve the knowledge of the deep
High-resolution temporal imaging of. Howard Zebker
 High-resolution temporal imaging of crustal deformation using InSAR Howard Zebker Stanford University InSAR Prehistory SEASAT Topographic Fringes SEASAT Deformation ERS Earthquake Image Accurate imaging
NOTES AND CORRESPONDENCE Segmented Faulting Process of Chelungpu Thrust: Implication of SAR Interferograms
 , Vol. 14, No.2, 241-247, June 2003 NOTES AND CORRESPONDENCE Segmented Faulting Process of Chelungpu Thrust: Implication of SAR Interferograms Chien-Chih Chen 1,*, Chung-Pai Chang 2, and Kun-Shan Chen
MERIS and OSCAR: Online Services for Correcting Atmosphere in Radar
 National Aeronautics and Space Administration MERIS and OSCAR: Online Services for Correcting Atmosphere in Radar Eric Fielding and Evan Fishbein Jet Propulsion Laboratory, California Inst. of Tech. Zhenhong
Ground surface deformation of L Aquila. earthquake revealed by InSAR time series
 Ground surface deformation of L Aquila earthquake revealed by InSAR time series Reporter: Xiangang Meng Institution: First Crust Monitoring and Application Center, CEA Address: 7 Naihuo Road, Hedong District
Coulomb stress changes due to Queensland earthquakes and the implications for seismic risk assessment
 Coulomb stress changes due to Queensland earthquakes and the implications for seismic risk assessment Abstract D. Weatherley University of Queensland Coulomb stress change analysis has been applied in
14 S. 11/12/96 Mw S. 6/23/01 Mw S 20 S 22 S. Peru. 7/30/95 Mw S. Chile. Argentina. 26 S 10 cm 76 W 74 W 72 W 70 W 68 W
 175 Chapter 5 Comparision of co-seismic and post-seismic slip from the November 12, 1996, M w 7.7 and the June 23, 2001, M w 8.4 southern Peru subduction zone earthquakes 176 Abstract We use InSAR and
ERS Track 98 SAR Data and InSAR Pairs Used in the Analysis
 ERS Track 98 SAR Data and InSAR Pairs Used in the Analysis Date 1 Date 2 Date 1 Date 2 Date 1 Date 2 Date 1 Date 2 7/17/1992 6/19/2000 7/17/1992 7/2/1993 9/10/1993 10/28/1996 9/3/1995 10/18/1999 9/25/1992
Basics of the modelling of the ground deformations produced by an earthquake. EO Summer School 2014 Frascati August 13 Pierre Briole
 Basics of the modelling of the ground deformations produced by an earthquake EO Summer School 2014 Frascati August 13 Pierre Briole Content Earthquakes and faults Examples of SAR interferograms of earthquakes
The Potential of High Resolution Satellite Interferometry for Monitoring Enhanced Oil Recovery
 The Potential of High Resolution Satellite Interferometry for Monitoring Enhanced Oil Recovery Urs Wegmüller a Lutz Petrat b Karsten Zimmermann c Issa al Quseimi d 1 Introduction Over the last years land
Lecture 20: Slow Slip Events and Stress Transfer. GEOS 655 Tectonic Geodesy Jeff Freymueller
 Lecture 20: Slow Slip Events and Stress Transfer GEOS 655 Tectonic Geodesy Jeff Freymueller Slow Slip Events From Kristine Larson What is a Slow Slip Event? Slip on a fault, like in an earthquake, BUT
overlie the seismogenic zone offshore Costa Rica, making the margin particularly well suited for combined land and ocean geophysical studies (Figure
 Chapter 1 Introduction Historically, highly destructive large magnitude (M w >7.0) underthrusting earthquakes nucleate along the shallow segment of subduction zone megathrust fault, and this region of
G 3. AN ELECTRONIC JOURNAL OF THE EARTH SCIENCES Published by AGU and the Geochemical Society
 Geosystems G 3 AN ELECTRONIC JOURNAL OF THE EARTH SCIENCES Published by AGU and the Geochemical Society Some thoughts on the use of InSAR data to constrain models of surface deformation: Noise structure
COULOMB STRESS CHANGES DUE TO RECENT ACEH EARTHQUAKES
 COULOMB STRESS CHANGES DUE TO RECENT ACEH EARTHQUAKES Madlazim Physics Department, Faculty Mathematics and Sciences of Surabaya State University (UNESA) Jl. Ketintang, Surabaya 60231, Indonesia. e-mail:
3D temporal evolution of displacements recorded on Mt. Etna from the 2007 to 2010 through the SISTEM method
 3D temporal evolution of displacements recorded on Mt. Etna from the 2007 to 2010 through the SISTEM method Bonforte A., Guglielmino F.,, Puglisi G. INGV Istituto Nazionale di Gofisica e vulcanologia Osservatorio
Earthquakes and Faulting
 Earthquakes and Faulting Crustal Strength Profile Quakes happen in the strong, brittle layers Great San Francisco Earthquake April 18, 1906, 5:12 AM Quake lasted about 60 seconds San Francisco was devastated
27th Seismic Research Review: Ground-Based Nuclear Explosion Monitoring Technologies
 GROUND TRUTH LOCATIONS USING SYNERGY BETWEEN REMOTE SENSING AND SEISMIC METHODS-APPLICATION TO CHINESE AND NORTH AFRICAN EARTHQUAKES C. K. Saikia 1, H. K. Thio 2, D. V. Helmberger 2, G. Ichinose 1, and
The March 11, 2011, Tohoku-oki earthquake (Japan): surface displacement and source modelling
: surface displacement and source modelling") The March 11, 2011, Tohoku-oki earthquake (Japan): surface displacement and source modelling Salvatore Stramondo Bignami C., Borgstrom S., Chini M., Guglielmino F., Melini D., Puglisi G., Siniscalchi V.,
The March 11, 2011, Tohoku-oki earthquake (Japan): surface displacement and source modelling Salvatore Stramondo Bignami C., Borgstrom S., Chini M., Guglielmino F., Melini D., Puglisi G., Siniscalchi V.,
Regional Geodesy. Shimon Wdowinski. MARGINS-RCL Workshop Lithospheric Rupture in the Gulf of California Salton Trough Region. University of Miami
 MARGINS-RCL Workshop Lithospheric Rupture in the Gulf of California Salton Trough Region Regional Geodesy Shimon Wdowinski University of Miami Rowena Lohman, Kim Outerbridge, Tom Rockwell, and Gina Schmalze
The financial and communal impact of a catastrophe instantiated by. volcanoes endlessly impact on lives and damage expensive infrastructure every
 Chapter 1 Introduction The financial and communal impact of a catastrophe instantiated by geophysical activity is significant. Landslides, subsidence, earthquakes and volcanoes endlessly impact on lives
BRIEFING MEMO ON RESERVOIR TRIGGERED SEISMICITY (RTS)
") BRIEFING MEMO ON RESERVOIR TRIGGERED SEISMICITY (RTS) 1. General. The issue of reservoir-triggered seismicity (RTS) has been controversial, and hotly debated, for many decades. There has been general recognition
BRIEFING MEMO ON RESERVOIR TRIGGERED SEISMICITY (RTS) 1. General. The issue of reservoir-triggered seismicity (RTS) has been controversial, and hotly debated, for many decades. There has been general recognition
Monitoring long-term ground movements and Deep Seated Gravitational
 Monitoring long-term ground movements and Deep Seated Gravitational Slope Deformations by InSAR time series: cases studies in Italy Salvatore Stramondo (1), M. Saroli (1, 2), M. Moro (1, 2), S. Atzori
Seismic Activity near the Sunda and Andaman Trenches in the Sumatra Subduction Zone
 IJMS 2017 vol. 4 (2): 49-54 International Journal of Multidisciplinary Studies (IJMS) Volume 4, Issue 2, 2017 DOI: http://doi.org/10.4038/ijms.v4i2.22 Seismic Activity near the Sunda and Andaman Trenches
Summary so far. Geological structures Earthquakes and their mechanisms Continuous versus block-like behavior Link with dynamics?
 Summary so far Geodetic measurements velocities velocity gradient tensor (spatial derivatives of velocity) Velocity gradient tensor = strain rate (sym.) + rotation rate (antisym.) Strain rate tensor can
ERS-ENVISAT CROSS-INTERFEROMETRY SIGNATURES OVER DESERTS. Urs Wegmüller, Maurizio Santoro and Christian Mätzler
 ERS-ENVISAT CROSS-INTERFEROMETRY SIGNATURES OVER DESERTS Urs Wegmüller, Maurizio Santoro and Christian Mätzler Gamma Remote Sensing AG, Worbstrasse 225, CH-3073 Gümligen, Switzerland, http://www.gamma-rs.ch,
Synthetic Seismicity Models of Multiple Interacting Faults
 Synthetic Seismicity Models of Multiple Interacting Faults Russell Robinson and Rafael Benites Institute of Geological & Nuclear Sciences, Box 30368, Lower Hutt, New Zealand (email: r.robinson@gns.cri.nz).
DETECTION OF CRUSTAL DEFORMATION OF THE NORTHERN PAKISTAN EARTHQUAKE BY SATELLITE DATA. Submitted by Japan **
 UNITED NATIONS E/CONF.97/5/CRP. 5 ECONOMIC AND SOCIAL COUNCIL Seventeenth United Nations Regional Cartographic Conference for Asia and the Pacific Bangkok, 18-22 September 2006 Item 6 (b) of the provisional
The PaTrop Experiment
 Improved estimation of the tropospheric delay component in GNSS and InSAR measurements in the Western Corinth Gulf (Greece), by the use of a highresolution meteorological model: The PaTrop Experiment N.
Co-seismic and post-seismic slip from multiple earthquakes in the northern Chile subduction zone: Joint study using InSAR, GPS, and seismology
 133 Chapter 4 Co-seismic and post-seismic slip from multiple earthquakes in the northern Chile subduction zone: Joint study using InSAR, GPS, and seismology 134 Abstract We use InSAR, GPS, and seismic
Post-seismic motion following the 1997 Manyi (Tibet) earthquake: InSAR observations and modelling
 earthquake: InSAR observations and modelling") Geophys. J. Int. (7) 69, 9 7 doi:./j.365-46x.6.33.x Post-seismic motion following the 997 Manyi (Tibet) earthquake: InSAR observations and modelling Isabelle Ryder, Barry Parsons, Tim J. Wright and Gareth
Geophys. J. Int. (7) 69, 9 7 doi:./j.365-46x.6.33.x Post-seismic motion following the 997 Manyi (Tibet) earthquake: InSAR observations and modelling Isabelle Ryder, Barry Parsons, Tim J. Wright and Gareth
INSAR ATMOSPHERIC DELAY MIGITIGATION BY GPS; CASE STUDY IZMIT EARTQUAKE INTERFEROGRAMS
 INSAR ATMOSPHERIC DELAY MIGITIGATION BY GPS; CASE STUDY IZMIT EARTQUAKE INTERFEROGRAMS M.U. Altın a, *, E. Tari a, L. Ge b a ITU, Civil Engineering Faculty, 80626 Maslak Istanbul, Turkey (altinm, tari)@itu.edu.tr
GPS and GIS Assisted Radar Interferometry
 GPS and GIS Assisted Radar Interferometry Linlin Ge, Xiaojing Li, Chris Rizos, and Makoto Omura Abstract Error in radar satellite orbit determination is a common problem in radar interferometry (INSAR).
Modeling of Atmospheric Effects on InSAR Measurements With the Method of Stochastic Simulation
 Modeling of Atmospheric Effects on InSAR Measurements With the Method of Stochastic Simulation Z. W. LI, X. L. DING Department of Land Surveying and Geo-Informatics, Hong Kong Polytechnic University, Hung
APLICATION OF INSAR TO THE STUDY OF GROUND DEFORMATION IN THE MEXICALI VALLEY, B. C., MEXICO.
 APLICATION OF INSAR TO THE STUDY OF GROUND DEFORMATION IN THE MEXICALI VALLEY, B. C., MEXICO. O. Sarychikhina (1), R. Mellors (2), E. Glowacka (1). (1) Centro de Investigacion Cientifica y Educaccion Superior
Radar Remote Sensing: Monitoring Ground Deformations and Geohazards from Space
 Radar Remote Sensing: Monitoring Ground Deformations and Geohazards from Space Xiaoli Ding Department of Land Surveying and Geo-Informatics The Hong Kong Polytechnic University A Question 100 km 100 km
Co-seismic slip from the 1995 July 30 M w = 8.1 Antofagasta, Chile, earthquake as constrained by InSAR and GPS observations
 Geophys. J. Int. (2002) 150, 362 376 Co-seismic slip from the 1995 July 30 M w = 8.1 Antofagasta, Chile, earthquake as constrained by InSAR and GPS observations M. E. Pritchard, 1 M. Simons, 1 P. A. Rosen,
The April 6 th 2009, L Aquila (Italy) earthquake: DInSAR analysis and seismic source model inversion
 earthquake: DInSAR analysis and seismic source model inversion") ESA ESRIN 30th November - 4th December 2009 Frascati, Italy The April 6 th 2009, L Aquila (Italy) earthquake: DInSAR analysis and seismic source model inversion Simone Atzori, Christian Bignami, Marco
ESA ESRIN 30th November - 4th December 2009 Frascati, Italy The April 6 th 2009, L Aquila (Italy) earthquake: DInSAR analysis and seismic source model inversion Simone Atzori, Christian Bignami, Marco
MONITORING SURFACE DEFORMATION IN ACTIVE MARGIN SETTINGS WITH THE SCANSAR TECHNIQUE USING WIDE SWATH ENVISAT DATA
 MONITORING SURFACE DEFORMATION IN ACTIVE MARGIN SETTINGS WITH THE SCANSAR TECHNIQUE USING WIDE SWATH ENVISAT DATA J. Anderssohn (1) and H. Kaufmann (2) (1) GeoForschungsZentrum Potsdam, Department of Geodesy
Journal of South American Earth Sciences
 Journal of South American Earth Sciences 31 (211) 214e226 Contents lists available at ScienceDirect Journal of South American Earth Sciences journal homepage: www.elsevier.com/locate/jsames Variability
Elizabeth H. Hearn modified from W. Behr
 Reconciling postseismic and interseismic surface deformation around strike-slip faults: Earthquake-cycle models with finite ruptures and viscous shear zones Elizabeth H. Hearn hearn.liz@gmail.com modified
Materials and Methods The deformation within the process zone of a propagating fault can be modeled using an elastic approximation.
 Materials and Methods The deformation within the process zone of a propagating fault can be modeled using an elastic approximation. In the process zone, stress amplitudes are poorly determined and much
Case Study 1: 2014 Chiang Rai Sequence
 Case Study 1: 2014 Chiang Rai Sequence Overview Mw 6.1 earthquake on 5 May 2014 at 11:08:43 UTC Largest recorded earthquake in Thailand Fault Orientation How does the orientation of the fault affect the
Originally published as:
 Originally published as: Lorenzo Martín, F., Wang, R., Roth, F. (2002): The effect of input parameters on visco-elastic models of crustal deformation. - Física de la Tierra, 14, 33-54 The effect of input
RADAR Remote Sensing Application Examples
 RADAR Remote Sensing Application Examples! All-weather capability: Microwave penetrates clouds! Construction of short-interval time series through cloud cover - crop-growth cycle! Roughness - Land cover,
RELOCATION OF THE MACHAZE AND LACERDA EARTHQUAKES IN MOZAMBIQUE AND THE RUPTURE PROCESS OF THE 2006 Mw7.0 MACHAZE EARTHQUAKE
 RELOCATION OF THE MACHAZE AND LACERDA EARTHQUAKES IN MOZAMBIQUE AND THE RUPTURE PROCESS OF THE 2006 Mw7.0 MACHAZE EARTHQUAKE Paulino C. FEITIO* Supervisors: Nobuo HURUKAWA** MEE07165 Toshiaki YOKOI** ABSTRACT
Surface changes caused by erosion and sedimentation were treated by solving: (2)
") GSA DATA REPOSITORY 214279 GUY SIMPSON Model with dynamic faulting and surface processes The model used for the simulations reported in Figures 1-3 of the main text is based on two dimensional (plane strain)
GSA DATA REPOSITORY 214279 GUY SIMPSON Model with dynamic faulting and surface processes The model used for the simulations reported in Figures 1-3 of the main text is based on two dimensional (plane strain)
Kinematics of the Southern California Fault System Constrained by GPS Measurements
 Title Page Kinematics of the Southern California Fault System Constrained by GPS Measurements Brendan Meade and Bradford Hager Three basic questions Large historical earthquakes One basic question How
Journal of Geophysical Research Letters Supporting Information for
 Journal of Geophysical Research Letters Supporting Information for InSAR observations of strain accumulation and fault creep along the Chaman Fault system, Pakistan and Afghanistan H. Fattahi 1, F. Amelung
Crustal deformation and fault slip during the seismic cycle in the North Chile subduction zone, from GPS and InSAR observations
 Geophys J Int (24) 158, 695 711 doi: 11111/j1365-246X242326x Crustal deformation and fault slip during the seismic cycle in the North Chile subduction zone, from GPS and InSAR observations M Chlieh, 1,
Inversion of Earthquake Rupture Process:Theory and Applications
 Inversion of Earthquake Rupture Process:Theory and Applications Yun-tai CHEN 12 * Yong ZHANG 12 Li-sheng XU 2 1School of the Earth and Space Sciences, Peking University, Beijing 100871 2Institute of Geophysics,
Today: Basic regional framework. Western U.S. setting Eastern California Shear Zone (ECSZ) 1992 Landers EQ 1999 Hector Mine EQ Fault structure
 1992 Landers EQ 1999 Hector Mine EQ Fault structure") Today: Basic regional framework Western U.S. setting Eastern California Shear Zone (ECSZ) 1992 Landers EQ 1999 Hector Mine EQ Fault structure 1 2 Mojave and Southern Basin and Range - distribution of strike-slip
Today: Basic regional framework Western U.S. setting Eastern California Shear Zone (ECSZ) 1992 Landers EQ 1999 Hector Mine EQ Fault structure 1 2 Mojave and Southern Basin and Range - distribution of strike-slip
ERS-ENVISAT Cross-interferometry for Coastal DEM Construction
 ERS-ENVISAT Cross-interferometry for Coastal DEM Construction Sang-Hoon Hong and Joong-Sun Won Department of Earth System Sciences, Yonsei University, 134 Shinchon-dong, Seodaemun-gu, 120-749, Seoul, Korea
4600 Rickenbacker Cswy, Miami 33149, FL. U.S.A., (2)
") POSTSEISMIC DEFORMATION FOLLOWING THE 2010 HAITI EARTHQUAKE: TIME-DEPENDENT SURFACE SUBSIDENCE INDUCED BY GROUNDWATER FLOW IN RESPONSE TO A SUDDEN UPLIFT Shimon Wdowinski (1), Sang-Hoon Hong (1)(2) (1)
POSTSEISMIC DEFORMATION FOLLOWING THE 2010 HAITI EARTHQUAKE: TIME-DEPENDENT SURFACE SUBSIDENCE INDUCED BY GROUNDWATER FLOW IN RESPONSE TO A SUDDEN UPLIFT Shimon Wdowinski (1), Sang-Hoon Hong (1)(2) (1)
Study megathrust creep to understand megathrust earthquakes
 1 Study megathrust creep to understand megathrust earthquakes Kelin Wang Pacific Geoscience Centre, Geological Survey of Canada, kelin.wang@canada.ca Introduction Once upon a time, there was a belief that
Testing Mechanisms of Subduction Zone Segmentation and Seismogenesis With Slip Distributions From Recent Andean Earthquakes
 Smith ScholarWorks Geosciences: Faculty Publications Geosciences 11-22-2010 Testing Mechanisms of Subduction Zone Segmentation and Seismogenesis With Slip Distributions From Recent Andean Earthquakes John
InSAR measurements of volcanic deformation at Etna forward modelling of atmospheric errors for interferogram correction
 InSAR measurements of volcanic deformation at Etna forward modelling of atmospheric errors for interferogram correction Rachel Holley, Geoff Wadge, Min Zhu Environmental Systems Science Centre, University
Rotation of the Principal Stress Directions Due to Earthquake Faulting and Its Seismological Implications
 Bulletin of the Seismological Society of America, Vol. 85, No. 5, pp. 1513-1517, October 1995 Rotation of the Principal Stress Directions Due to Earthquake Faulting and Its Seismological Implications by
GPS Strain & Earthquakes Unit 5: 2014 South Napa earthquake GPS strain analysis student exercise
 GPS Strain & Earthquakes Unit 5: 2014 South Napa earthquake GPS strain analysis student exercise Strain Analysis Introduction Name: The earthquake cycle can be viewed as a process of slow strain accumulation
MODELING INTERFEROGRAM STACKS FOR SENTINEL - 1
 MODELING INTERFEROGRAM STACKS FOR SENTINEL - 1 Fabio Rocca (1) (1) Politecnico di Milano, Via Ponzio 34/5, 20133 Milano, Italy, Email: rocca@elet.polimi.it ABSTRACT The dispersion of the optimal estimate
Earthquake Doublet Sequences: Evidence of Static Triggering in the Strong Convergent Zones of Taiwan
 Terr. Atmos. Ocean. Sci., Vol. 19, No. 6, 589-594, December 2008 doi: 10.3319/TAO.2008.19.6.589(PT) Earthquake Doublet Sequences: Evidence of Static Triggering in the Strong Convergent Zones of Taiwan
Dynamic Earthquake Triggering Due to Stress from Surface Wave Particle Displacement
 Emily Morton Geop 523: Theoretical Seismology 29 April 2011 Introduction Dynamic Earthquake Triggering Due to Stress from Surface Wave Particle Displacement Earthquakes can be triggered by other earthquakes.
The Earthquake Cycle Chapter :: n/a
 The Earthquake Cycle Chapter :: n/a A German seismogram of the 1906 SF EQ Image courtesy of San Francisco Public Library Stages of the Earthquake Cycle The Earthquake cycle is split into several distinct
EARTHQUAKE LOCATIONS INDICATE PLATE BOUNDARIES EARTHQUAKE MECHANISMS SHOW MOTION
 6-1 6: EARTHQUAKE FOCAL MECHANISMS AND PLATE MOTIONS Hebgen Lake, Montana 1959 Ms 7.5 1 Stein & Wysession, 2003 Owens Valley, California 1872 Mw ~7.5 EARTHQUAKE LOCATIONS INDICATE PLATE BOUNDARIES EARTHQUAKE
Elastic models of deformation in nature: why shouldn t we use the present day fault geometry?
 Elastic models of deformation in nature: why shouldn t we use the present day fault geometry? B. Freeman 1, G. Yielding, 1 S.J. Dee 1, 2, & P.G. Bretan 1 1 Badley Geoscience Limited, UK 2 BP Exploration
Deformation cycles of great subduction earthquakes in a viscoelastic Earth
 Deformation cycles of great subduction earthquakes in a viscoelastic Earth Kelin Wang Pacific Geoscience Centre, Geological Survey of Canada School of Earth and Ocean Science, University of Victoria????
The influence of short wavelength variations in viscosity on subduction dynamics
 1 Introduction Deformation within the earth, driven by mantle convection due primarily to cooling and subduction of oceanic lithosphere, is expressed at every length scale in various geophysical observations.
Characterization of stress changes in subduction zones from space- and ground-based geodetic observations
 University of Iowa Iowa Research Online Theses and Dissertations Spring 2017 Characterization of stress changes in subduction zones from space- and ground-based geodetic observations Bryan James Stressler
Slow Deformation of Mt. Baekdu Stratovolcano Observed by Satellite Radar Interferometry
 Slow Deformation of Mt. Baekdu Stratovolcano Observed by Satellite Radar Interferometry Sang-Wan Kim and Joong-Sun Won Department of Earth System Sciences, Yonsei University 134 Shinchon-dong, Seodaemun-gu,
The Size and Duration of the Sumatra-Andaman Earthquake from Far-Field Static Offsets
 The Size and Duration of the Sumatra-Andaman Earthquake from Far-Field Static Offsets P. Banerjee, 1 F. F. Pollitz, 2 R. Bürgmann 3 * 1 Wadia Institute of Himalayan Geology, Dehra Dun, 248001, India. 2
SUPPLEMENTARY INFORMATION
 SUPPLEMENTARY INFORMATION doi: 10.1038/ngeo739 Supplementary Information to variability and distributed deformation in the Marmara Sea fault system Tobias Hergert 1 and Oliver Heidbach 1,* 1 Geophysical
2. Tsunami Source Details
 2. Tsunami Source Details The Northland area faces a range of potential tsunamigenic sources that include several local and distant fault systems and underwater landslides. A NIWA study (Goff et al. 2006)
SUPPLEMENTARY INFORMATION
 doi: 1.138/nature962 Data processing A network of 5 continuously recording GPS stations (LAGU, CHIN, ENAP, GUAD and JUAN) was installed after the earthquake (Figure 1, main text). The data considered in
Ground displacement in a fault zone in the presence of asperities
 BOLLETTINO DI GEOFISICA TEORICA ED APPLICATA VOL. 40, N. 2, pp. 95-110; JUNE 2000 Ground displacement in a fault zone in the presence of asperities S. SANTINI (1),A.PIOMBO (2) and M. DRAGONI (2) (1) Istituto
Study on the feature of surface rupture zone of the west of Kunlunshan pass earthquake ( M S 811) with high spatial resolution satellite images
 with high spatial resolution satellite images") 48 2 2005 3 CHINESE JOURNAL OF GEOPHYSICS Vol. 48, No. 2 Mar., 2005,,. M S 811.,2005,48 (2) :321 326 Shan X J, Li J H, Ma C. Study on the feature of surface rupture zone of the West of Kunlunshan Pass
48 2 2005 3 CHINESE JOURNAL OF GEOPHYSICS Vol. 48, No. 2 Mar., 2005,,. M S 811.,2005,48 (2) :321 326 Shan X J, Li J H, Ma C. Study on the feature of surface rupture zone of the West of Kunlunshan Pass
Differentiating earthquake tsunamis from other sources; how do we tell the difference?
 Differentiating earthquake tsunamis from other sources; how do we tell the difference? David Tappin (1), Stephan Grilli (2), Jeffrey Harris (2), Timothy Masterlark (3), James Kirby (4), Fengyan Shi Shi
Neotectonics of the Pedro de Valdivia Area, northern Chile
 Neotectonics of the Pedro de Valdivia Area, northern Chile Angelo Villalobos 1*, Joaquín Cortés-Aranda 1, Luis Astudillo 1, Rodrigo Riquelme 1 and Arturo Jensen 1 (1) Universidad Católica del Norte, 0610
Dynamic analysis. 1. Force and stress
 Dynamic analysis 1. Force and stress Dynamics is the part of structural geology that involves energy, force, stress, and strength. It's very important to distinguish dynamic concepts from kinematic ones.
On the nucleation of creep and the interaction between creep and seismic slip on rate- and state-dependent faults
 Click Here for Full Article GEOPHYSICAL RESEARCH LETTERS, VOL. 34, L15303, doi:10.1029/2007gl030337, 2007 On the nucleation of creep and the interaction between creep and seismic slip on rate- and state-dependent
Recent crustal deformation in the Antofagasta region (northern Chile) and the subduction process
 and the subduction process") Geophys. J. Int. (1998) 132, 302 338 Recent crustal deformation in the Antofagasta region (northern Chile) and the subduction process B. Delouis,1,* H. Philip,2 L. Dorbath1,3 and A. Cisternas1 1 Institut
Geophys. J. Int. (1998) 132, 302 338 Recent crustal deformation in the Antofagasta region (northern Chile) and the subduction process B. Delouis,1,* H. Philip,2 L. Dorbath1,3 and A. Cisternas1 1 Institut
LAB 1: ORIENTATION OF LINES AND PLANES
 LAB 1: ORIENTATION OF LINES AND PLANES Read the introductory section, chapter 1, pages 1-3, of the manual by Rowland et al (2007) and make sure you understand the concepts of bearing, strike, dip, trend,
ERAD Water vapor observations with SAR, microwave radiometer and GPS: comparison of scaling characteristics
 Proceedings of ERAD (2002): 190 194 c Copernicus GmbH 2002 ERAD 2002 Water vapor observations with SAR, microwave radiometer and GPS: comparison of scaling characteristics D. N. Moisseev 1, R. F. Hanssen
InSAR water vapour correction models: GPS, MODIS, MERIS and InSAR integration
 InSAR water vapour correction models: GPS, MODIS, MERIS and InSAR integration Zhenhong Li (1), Eric J. Fielding (2), Paul Cross (1), and Jan-Peter Muller (1) (1): Department of Geomatic Engineering, University
San Francisco Bay Area Earthquake Simulations: A step toward a Standard Physical Earthquake Model
 San Francisco Bay Area Earthquake Simulations: A step toward a Standard Physical Earthquake Model Steven N. Ward Institute of Geophysics and Planetary Physics, University of California, Santa Cruz, CA,
Widespread Ground Motion Distribution Caused by Rupture Directivity during the 2015 Gorkha, Nepal Earthquake
 Widespread Ground Motion Distribution Caused by Rupture Directivity during the 2015 Gorkha, Nepal Earthquake Kazuki Koketsu 1, Hiroe Miyake 2, Srinagesh Davuluri 3 and Soma Nath Sapkota 4 1. Corresponding
SONGS SSC. Tom Freeman GeoPentech PRELIMINARY RESULTS
 SONGS SSC Tom Freeman GeoPentech PRELIMINARY RESULTS Focused Questions Summarize the tectonic setting What is the seismogenic thickness? Are you including deep ruptures in the upper mantle (~30 km)? Do
Displacement field and slip distribution of the 2005 Kashmir earthquake from SAR imagery
 Click Here for Full Article GEOPHYSICAL RESEARCH LETTERS, VOL. 33,, doi:10.1029/2006gl027193, 2006 Displacement field and slip distribution of the 2005 Kashmir earthquake from SAR imagery E. Pathier, 1
Seismic and aseismic processes in elastodynamic simulations of spontaneous fault slip
 Seismic and aseismic processes in elastodynamic simulations of spontaneous fault slip Most earthquake simulations study either one large seismic event with full inertial effects or long-term slip history
Separating Tectonic, Magmatic, Hydrological, and Landslide Signals in GPS Measurements near Lake Tahoe, Nevada-California
 Separating Tectonic, Magmatic, Hydrological, and Landslide Signals in GPS Measurements near Lake Tahoe, Nevada-California Geoffrey Blewitt, Corné Kreemer, William C. Hammond, & Hans-Peter Plag NV Geodetic
SOURCE MODELING OF RECENT LARGE INLAND CRUSTAL EARTHQUAKES IN JAPAN AND SOURCE CHARACTERIZATION FOR STRONG MOTION PREDICTION
 SOURCE MODELING OF RECENT LARGE INLAND CRUSTAL EARTHQUAKES IN JAPAN AND SOURCE CHARACTERIZATION FOR STRONG MOTION PREDICTION Kimiyuki Asano 1 and Tomotaka Iwata 2 1 Assistant Professor, Disaster Prevention
Magnitude 8.2 NORTHWEST OF IQUIQUE, CHILE
 An 8.2-magnitude earthquake struck off the coast of northern Chile, generating a local tsunami. The USGS reported the earthquake was centered 95 km (59 miles) northwest of Iquique at a depth of 20.1km