Supplementary Figure 1. Normalized glacier terminus elevation changes versus normalized glacier length changes.
|
|
|
- Tamsin Phelps
- 5 years ago
- Views:
Transcription
1 Supplementary Figure 1. Normalized glacier terminus elevation changes versus normalized glacier length changes.
2 Supplementary Figure 2. Normalized glacier lengths through time, as shown in Fig. 2 in the main text, but divided into several size classes based upon their LGM extent.
3 Supplementary Figure 3. Scatterplots of normalized glacier lengths (x-axes) versus normalized forcings (y-axes) showing root-mean-squared deviation (RMSD) and coefficient of determination (r 2 ). Forcings considered include CO 2 (ref. 1 ), AMOC variations as represented by a Pa/Th record 2, ice sheets as represented by eustatic sea level 3, obliquity, precession, and local insolation (JJA for northern extratropical sites, DJF for southern extratropical sites, mean annual for tropical sites).
4 ALL simulation
5 GHG simulation
6 ORB simulation
7 ICE simulation
 in the upper left panel for the")
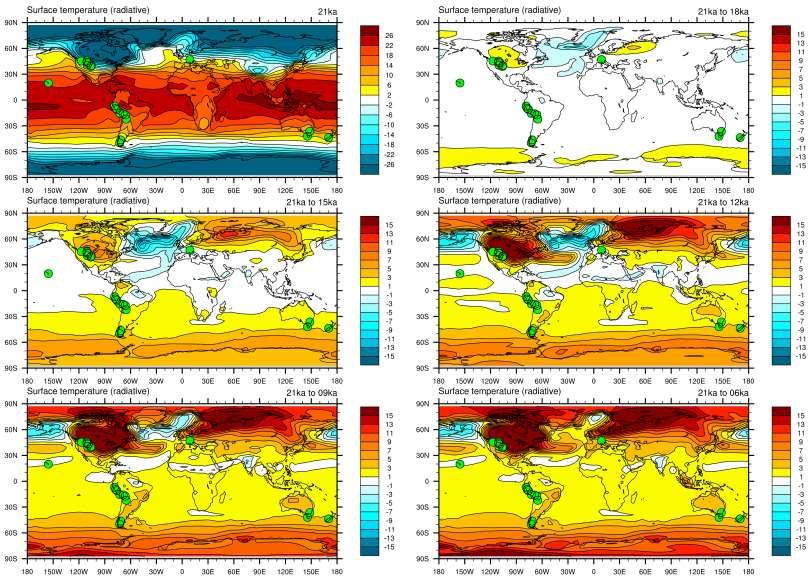
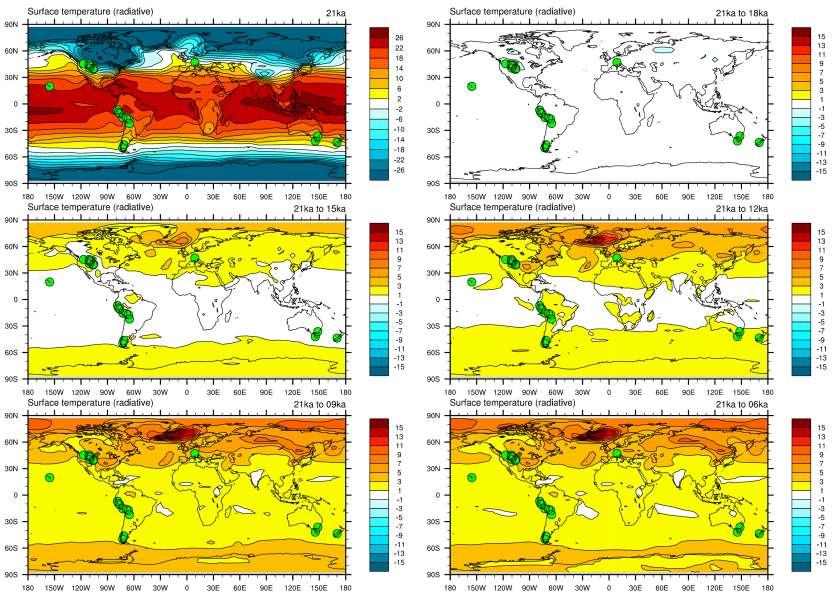
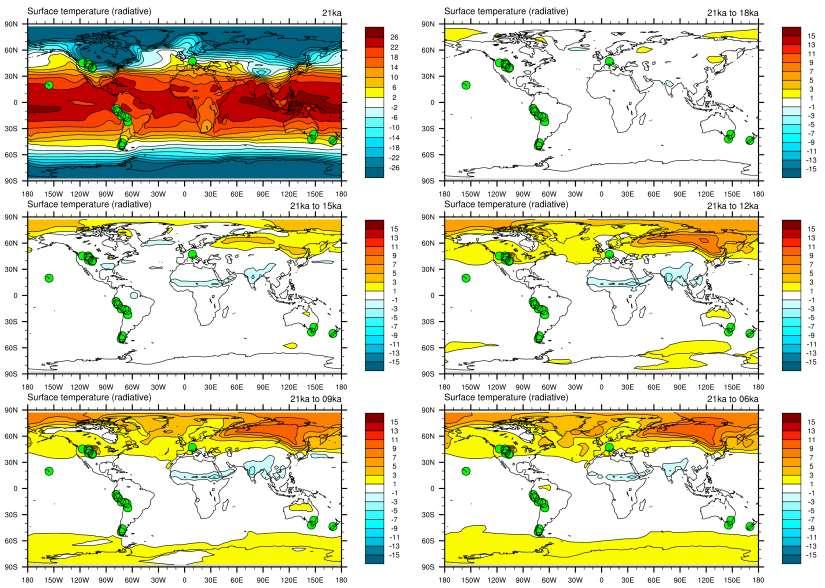
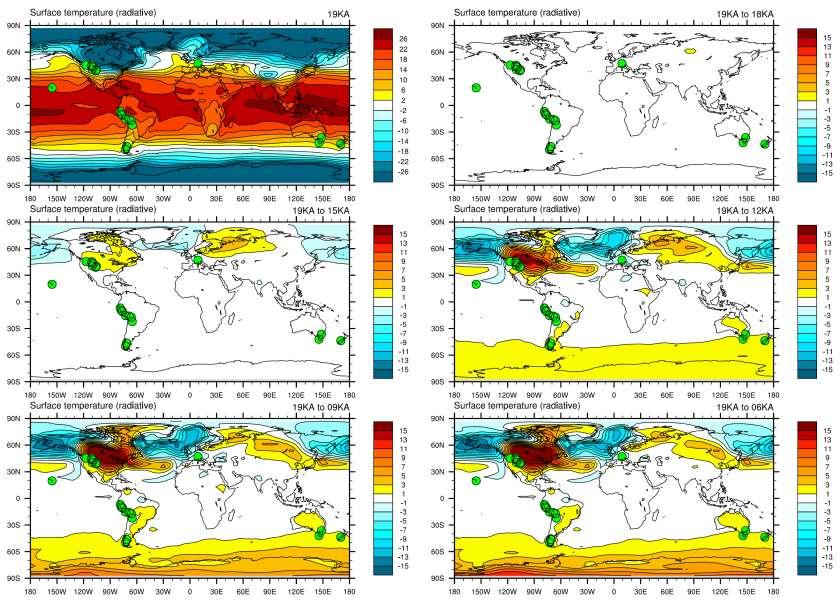
8 MOC simulation Supplementary Figure 4. Each figure above shows mean annual surface temperature at the Last Glacial Maximum (LGM; 21 ka for simulation ALL, GHG, and ORB, and 19 ka for simulation ICE and MOC) in the upper left panel for the various transient simulations, followed by surface temperature anomalies from the LGM at 18, 15, 12, 9, and 6 ka. Light blue dots on each map represent the locations of the glacial moraines synthesized in this study. Units are C.
 Valley profiles for several subtropical and equatorial Andes sites between the local LGM moraine and cirque headwall or modern glacier terminus.")
9 Supplementary Figure 5. (a) Valley profiles for several subtropical and equatorial Andes sites between the local LGM moraine and cirque headwall or modern glacier terminus. (b) The corresponding normalized glacier length and elevation histories for these sites. Gray bar highlights deglacial CO 2 and global temperature rise.
 strength")
10 Supplementary Figure 6. Atlantic Meridional Overturning Circulation (AMOC) strength in the transient model simulations.

11 Supplementary Figure 7. Histogram showing the deviation of boulder ages from the mean age on each moraine. The number of samples on either side of the mean is indicated at the top of the figure. Only moraines with three or more boulder ages were included. Boulders considered outliers by the original authors were excluded.
12 Supplementary Figure 8. Northern and Southern Hemisphere freshwater forcing used in the MOC and ALL simulations.

13 Supplementary Figure 9. As in Figure 3 in the manuscript, but here showing normalized glacier elevation changes rather than length changes.
14 Supplementary Table 1 Sea-level, high-latitude (SLHL) production rates for 10 Be using nuclide-specific LSD scaling Study SLHL Production Rate (at g -1 y -1 ) Fenton et al. 4 Norway 3.59 ± 0.18 (1.7) Claude et al. 5 Chironico landslide, Switzerland 3.94 ± 0.24 (2.1) Ballantyne and Stone 6 Scotland 4.01 ± 0.14 (0.2) Kaplan et al. 7 Puerto Bandera only, Patagonia 3.93 ± 0.10 (1.3) Goehring et al. 8 Norway 4.01 ± 0.12 (3.4) Balco et al. 9 NE North America 4.10 ± 0.20 (1.8) Kelly et al. 10 Peru * 4.13 ± 0.09 (2.5) Putnam et al. 11 New Zealand 3.77 ± 0.08 (0.4) Young et al. 12 Arctic 3.82 ± 0.13 (0.3) Lifton et al. 13 Lake Bonneville 4.20 ± 0.09 (1.1) Mean All 3.9 ± 0.2 Mean No Fenton ± 0.1 Notes Production rates only considered significant to one decimal place. 2 nd decimal place only carried for rounding. Numbers in parentheses and italics following each site production rate are reduced 2 values for the fit at each site. Erosion rate and surface shielding corrections taken from original studies. * Samples Q-47, Q-48 removed from dataset following Kelly et al. 10. Samples Q-40a, Q-44a, and Q-83a also removed to prevent circularity since they were used to calculate surface erosion rates used for the other samples in the study. Including the latter 3 samples does not significantly change the site production rate (4.09 ± Be at g -1 y -1 ). Assume erosion rates as stated in Kelly et al Production rate from Fenton et al. 4 (including all corrections from original study) fails Chauvenet s critierion 14, and thus is considered an outlier for this dataset.
15 Supplementary Table 2 SLHL production rates for 3 He using nuclide-specific LSD scaling Study SLHL Production Rate (at g -1 y -1 ) Ackert et al. 15 Patagonia* ± 1.7 (19.3) Amidon et al. 16 Lake Bonneville (pyroxene) ± 10.6 (0.2) Blard et al. 17 Mt. Etna* ± 3.7 (15.7) Blard et al. 17 Hawaii* ± 7.5 (1.6) Blard et al. 18 Altiplano ± 4.1 (2.0) Cerling and Craig 19, Cerling 20 Western U.S. and France* ± 3.5 (4.3) Dunai and Wijbrans 21 Canary Islands* ± 13.1 (0.1) Kurz et al. 22 Hawaii* ± 13.2 (7.4) Goehring et al. 23 Lake Bonneville* ± 2.1 (18.2) Licciardi et al. 24 Western U.S.* ± 4.3 (1.1) Licciardi et al. 25 Iceland* ± 5.3 (5.6) Foeken et al. 26 Cape Verde Islands 94.7 ± 4.6 (2.5) Mean 122 ± 14 Notes Production rates only considered significant to whole numbers. First decimal place only carried for rounding. Numbers in parentheses and italics following each site production rate are reduced 2 values for the fit at each site. Erosion rate and surface shielding corrections taken from original studies * Included in Goehring et al. 23
16 Supplementary Note 1 Excluding Asian data Cosmogenic ages from Asia were excluded from our analysis for two reasons. First, moraine boulder ages from this region tend to exhibit relatively large scatter and there is thus greater uncertainty in the timing of glacier fluctuations there. For instance, Heyman 41 synthesized 1855 ages on 113 moraines from the Tibetan Plateau and surrounding regions and found that more than half have uncertainties >15%, with many exceeding 30%. Second, most moraines dated in this region are from different valleys, and thus the retreat of individual glaciers from maximum to minimum extents cannot be scaled into the normalized units that we use to compare deglaciations across different regions and to potential forcings. For example, in Heyman s 41 synthesis, only one valley has a Class A moraine (those with uncertainties <15%) representing the local LGM (taken to be Marine Isotope Stage 2, or ka) with an additional Class A deglacial-age moraine upvalley. Supplementary Note 2 Greenhouse gas forcing While we focus on the relationship between glacier retreat and CO 2 forcing in the main text, a more complete treatment of greenhouse-gas forcing would also include the effects from CH 4 and N 2 O. Nonetheless, our approximation is justified since CO 2 contributed nearly 80% of the combined radiative forcing from these gases, and CO 2 forcing rose to within 10% of its preindustrial value by 11 ka.
17 Supplementary References 1 Marcott, S. A. et al. Centennial-scale changes in the global carbon cycle during the last deglaciation. Nature 514, , doi: /nature13799 (2014). 2 McManus, J. F., Francois, R., Gherardi, J. M., Keigwin, L. D. & Brown-Leger, S. Collapse and rapid resumption of Atlantic meridional circulation linked to deglacial climate changes. Nature 428, (2004). 3 Lambeck, K., Rouby, H., Purcell, A., Sun, Y. & Sambridge, M. Sea level and global ice volumes from the Last Glacial Maximum to the Holocene. Proceedings of the National Academy of Sciences 111, , doi: /pnas (2014). 4 Fenton, C. R. et al. Regional 10Be production rate calibration for the past 12 ka deduced from the radiocarbon-dated Grøtlandsura and Russenes rock avalanches at 69 N, Norway. Quaternary Geochronology 6, , doi: (2011). 5 Claude, A. et al. The Chironico landslide (Valle Leventina, southern Swiss Alps): age and evolution. Swiss J Geosci 107, , doi: /s z (2014). 6 Ballantyne, C. K. & Stone, J. O. Did large ice caps persist on low ground in north-west Scotland during the Lateglacial Interstade? Journal of Quaternary Science 27, , doi: /jqs.1544 (2012). 7 Kaplan, M. R. et al. In-situ cosmogenic 10Be production rate at Lago Argentino, Patagonia: Implications for late-glacial climate chronology. Earth and Planetary Science Letters 309, 21-32, doi: (2011). 8 Goehring, B. M. et al. Late glacial and holocene 10Be production rates for western Norway. Journal of Quaternary Science 27, 89-96, doi: /jqs.1517 (2012). 9 Balco, G. et al. Regional beryllium-10 production rate calibration for late-glacial northeastern North America. Quaternary Geochronology 4, , doi: /j.quageo (2009). 10 Kelly, M. A. et al. A locally calibrated, late glacial 10Be production rate from a lowlatitude, high-altitude site in the Peruvian Andes. Quaternary Geochronology, doi: (2013). 11 Putnam, A. E. et al. In situ cosmogenic 10Be production-rate calibration from the Southern Alps, New Zealand. Quaternary Geochronology 5, , doi: /j.quageo (2010). 12 Young, N. E., Schaefer, J. M., Briner, J. P. & Goehring, B. M. A 10Be production-rate calibration for the Arctic. Journal of Quaternary Science 28, , doi: /jqs.2642 (2013). 13 Lifton, N. et al. In situ cosmogenic nuclide production rate calibration for the CRONUS- Earth project from Lake Bonneville, Utah, shoreline features. Quaternary Geochronology, doi: (2015). 14 Bevington, P. R. & Robinson, D. K. Data Reduction and Error Analysis for the Physical Sciences. Second edn, (WCB/McGraw-Hill, 1992). 15 Ackert, J. R. P., Singer, B. S., Guillou, H., Kaplan, M. R. & Kurz, M. D. Long-term cosmogenic 3He production rates from 40Ar/39Ar and K-Ar dated Patagonian lava flows at 47[deg]S. Earth and Planetary Science Letters 210, (2003).
18 16 Amidon, W. H. & Farley, K. A. Cosmogenic 3He production rates in apatite, zircon and pyroxene inferred from Bonneville flood erosional surfaces. Quaternary Geochronology 6, 10-21, doi: (2011). 17 Blard, P. H. et al. Cosmogenic 3He production rates revisited from evidences of grain size dependent release of matrix-sited helium. Earth and Planetary Science Letters 247, (2006). 18 Blard, P. H. et al. Cosmogenic 3He production rate in the high tropical Andes (3800 m, 20 S): Implications for the local last glacial maximum. Earth and Planetary Science Letters , , doi: (2013). 19 Cerling, T. E. & Craig, H. Cosmogenic 3He production rates from 39oN to 46oN latitude, western USA and France. Geochimica et Cosmochimica Acta 58, (1994). 20 Cerling, T. E. Dating geomorphic surfaces using cosmogenic 3 He. qr 33, (1990). 21 Dunai, T. J. & Wijbrans, J. R. Long-term cosmogenic 3He production rates (152 ka- 1.35Ma) from 40Ar/39Ar dated basalt flows at 29 degrees N lattitude. Earth and Planetary Science Letters 176, (2000). 22 Kurz, M. D., Colodner, D., Trull, T. W., Moore, R. B. & O Brien, K. Cosmic ray exposure dating with in situ produced cosmogenic 3 He: Results from young Hawaiian lava flows. Earth and Planetary Science Letters 97, (1990). 23 Goehring, B. M. et al. A reevaluation of in situ cosmogenic 3He production rates. Quaternary Geochronology 5, , doi: /j.quageo (2010). 24 Licciardi, J. M., Kurz, M. D., Clark, P. U. & Brook, E. J. Calibration of cosmogenic 3 He production rates from Holocene lava flows in Oregon, USA, and effects of the Earth's magnetic field. Earth and Planetary Science Letters 172, (1999). 25 Licciardi, J. M., Kurz, M. D. & Curtice, J. M. Cosmogenic 3He production rates from Holocene lava flows in Iceland. Earth and Planetary Science Letters 246, (2006). 26 Foeken, J. P. T., Stuart, F. M. & Mark, D. F. Long-term low latitude cosmogenic 3He production rate determined from a 126 ka basalt from Fogo, Cape Verdes. Earth and Planetary Science Letters , 14-25, doi: (2012).
Supplementary Figure 1. New downcore data from this study. Triangles represent the depth of radiocarbon dates. Error bars represent 2 standard error
 Supplementary Figure 1. New downcore data from this study. Triangles represent the depth of radiocarbon dates. Error bars represent 2 standard error of measurement (s.e.m.). 1 Supplementary Figure 2. Particle
Supplementary Fig. 1. Locations of thinning transects and photos of example samples. Mt Suess/Gondola Ridge transects extended metres above
 Supplementary Fig. 1. Locations of thinning transects and photos of example samples. Mt Suess/Gondola Ridge transects extended 260 24 metres above the modern surface of Mackay Glacier, and included 16
Rapid Communication. Constraining Holocene 10 Be production rates in Greenland. Introduction. Jakobshavn Isfjord, west Greenland. Radiocarbon dating
 JOURNAL OF QUATERNARY SCIENCE (2012) 27(1) 2 6 ISSN 0267-8179. DOI: 10.1002/jqs.1562 Rapid Communication Constraining Holocene 10 Be production rates in Greenland JASON P. BRINER, 1 * NICOLÁS E. YOUNG,
This article appeared in a journal published by Elsevier. The attached copy is furnished to the author for internal non-commercial research and
 This article appeared in a journal published by Elsevier. The attached copy is furnished to the author for internal non-commercial research and education use, including for instruction at the authors institution
GSA DATA REPOSITORY
 GSA DATA REPOSITORY 2012186 SUPPLEMENTARY MATERIAL Northern Hemisphere forcing of the last deglaciation in southern Patagonia Daniel S. Murray, Anders E. Carlson*, Brad S. Singer, Faron S. Anslow, Feng
Determining the Timing and Rate of Laurentide Ice Sheet Thinning During the Last Deglaciation in New England with 10Be Dipsticks Christopher Halsted
 Determining the Timing and Rate of Laurentide Ice Sheet Thinning During the Last Deglaciation in New England with 10 Be Dipsticks A thesis proposal prepared by Christopher Halsted In partial fulfillment
GET PAID FOR YOUR SAMPLES! GO TO
 Volume 3 October 2008 Newsletter Table of Contents CRONUS-Earth 5 th Annual Meeting Page 1 CRONUS-Earth Fellow Update B. Goehring Page 2 CRONUS-Earth Fellow Update D. Argento Page 5 The CRONUS-Earth Inter-comparison
This article appeared in a journal published by Elsevier. The attached copy is furnished to the author for internal non-commercial research and
 This article appeared in a journal published by Elsevier. The attached copy is furnished to the author for internal non-commercial research and education use, including for instruction at the authors institution
ARTICLE IN PRESS. Quaternary Science Reviews
 Quaternary Science Reviews xxx (2009) 1 13 Contents lists available at ScienceDirect Quaternary Science Reviews journal homepage: www.elsevier.com/locate/quascirev Relative timing of last glacial maximum
APPENDIX 1: EXTENDED SAMPLE INFORMATION.
 1 APPENDIX 1: EXTENDED SAMPLE INFORMATION. Location map of the giant bar between Inya and Little Jaloman (topographic map 1:50,000). The circle marks the sampling location. Giant bar boulders (location
radionuclide laboratory using procedures according to Kohl and Nishiizumi (1992), Ivy-Ochs
, Ivy-Ochs") GSA DATA REPOSITORY 2010117 APPENDIX DR1 Methodology: Cosmogenic 10 Be exposure dating The cosmogenic 10 Be samples were processed at the University of Colorado cosmogenic radionuclide laboratory using
GSA DATA REPOSITORY 2010117 APPENDIX DR1 Methodology: Cosmogenic 10 Be exposure dating The cosmogenic 10 Be samples were processed at the University of Colorado cosmogenic radionuclide laboratory using
Calibration of the in situ cosmogenic 14 C production rate in New Zealand's Southern Alps
 1 2 Calibration of the in situ cosmogenic 14 C production rate in New Zealand's Southern Alps 3 4 5 6 7 8 9 10 11 12 13 14 15 16 17 18 19 20 21 22 23 24 Irene Schimmelpfennig 1*, Joerg M. Schaefer 1, Brent
Welcome to ATMS 111 Global Warming.
 Welcome to ATMS 111 Global Warming http://www.atmos.washington.edu/2010q1/111 Isotopic Evidence 16 O isotopes "light 18 O isotopes "heavy" Evaporation favors light Rain favors heavy Cloud above ice is
Rapid Climate Change: Heinrich/Bolling- Allerod Events and the Thermohaline Circulation. By: Andy Lesage April 13, 2010 Atmos.
 Rapid Climate Change: Heinrich/Bolling- Allerod Events and the Thermohaline Circulation By: Andy Lesage April 13, 2010 Atmos. 6030 Outline Background Heinrich Event I/Bolling-Allerod Transition (Liu et
Ice Sheets and Late Quaternary Environmental Change
 Ice Sheets and Late Quaternary Environmental Change Martin J. Siegert Bristol Glaciology Centre, School of Geographical Sciences University of Bristol JOHN WILEY & SONS, LTD Chichester New York Weinheim
Contributions and unrealized potential contributions of cosmogenic-nuclide exposure dating to glacier chronology,
 Contributions and unrealized potential contributions of cosmogenic-nuclide exposure dating to glacier chronology, 1990-2010 Greg Balco a, a Berkeley Geochronology Center, 2455 Ridge Road, Berkeley CA 94709
Geomorphic setting and field methods. The overall study area encompasses the region
 GSA Data Repository 2018035 Leydet et al., 2018, Opening of glacial Lake Agassiz s eastern outlets by the start of the Younger Dryas cold period: Geology, https://doi.org/10.1130/g39501.1. 1 2 3 4 5 6
ATOC OUR CHANGING ENVIRONMENT
 ATOC 1060-002 OUR CHANGING ENVIRONMENT Class 22 (Chp 15, Chp 14 Pages 288-290) Objectives of Today s Class Chp 15 Global Warming, Part 1: Recent and Future Climate: Recent climate: The Holocene Climate
CORRELATION OF CLIMATIC AND SOLAR VARIATIONS OVER THE PAST 500 YEARS AND PREDICTING GLOBAL CLIMATE CHANGES FROM RECURRING CLIMATE CYCLES
 Easterbrook, D.J., 2008, Correlation of climatic and solar variations over the past 500 years and predicting global climate changes from recurring climate cycles: International Geological Congress, Oslo,
Cosmogenic dating of Late Pleistocene glaciation, southern tropical Andes, Peru
 JOURNAL OF QUATERNARY SCIENCE (2015) 30(8) 841 847 ISSN 0267-8179. DOI: 10.1002/jqs.2822 Cosmogenic dating of Late Pleistocene glaciation, southern tropical Andes, Peru JEREMY D. SHAKUN, 1 * PETER U. CLARK,
Sensitivity of the Younger Dryas climate to changes in freshwater, orbital, and greenhouse gas forcing in CESM1.
 OCE-1536630 EAR-0903071 Sensitivity of the Younger Dryas climate to changes in freshwater, orbital, and greenhouse gas forcing in CESM1. The 21 st Annual CESM Workshop Paleoclimate Working Group Taylor
Lake Levels and Climate Change in Maine and Eastern North America during the last 12,000 years
 Maine Geologic Facts and Localities December, 2000 Lake Levels and Climate Change in Maine and Eastern North America during the last 12,000 years Text by Robert A. Johnston, Department of Agriculture,
Supporting Information for Glacial Atlantic overturning increased by wind stress in climate models
 GEOPHYSICAL RESEARCH LETTERS Supporting Information for Glacial Atlantic overturning increased by wind stress in climate models Juan Muglia 1 and Andreas Schmittner 1 Contents of this file 1. Figures S1
Atlantic overturning in decline?
 Atlantic overturning in decline? Article Accepted Version Robson, J., Hodson, D., Hawkins, E. and Sutton, R. (2014) Atlantic overturning in decline? Nature Geoscience, 7 (1). pp. 2 3. ISSN 1752 0894 doi:
Page 1. Name:
 Name: 1) Which property would best distinguish sediment deposited by a river from sediment deposited by a glacier? thickness of sediment layers age of fossils found in the sediment mineral composition
SUPPLEMENTARY INFORMATION
 SUPPLEMENTARY INFORMATION DOI: 1.138/NGEO168 "Strength and geometry of the glacial Atlantic Meridional Overturning Circulation" S2 Map of core locations Core locations of the Holocene and LGM 231 / 23
ttp://news.discovery.com/earth/iceland-volcano-aurora.html
 ttp://news.discovery.com/earth/iceland-volcano-aurora.html Outline Role of volcanism on the climate system Distribution of Arctic volcanoes Types of eruptions Frequency of Arctic eruptions Influence on
M. Ballarotta 1, L. Brodeau 1, J. Brandefelt 2, P. Lundberg 1, and K. Döös 1. This supplementary part includes the Figures S1 to S16 and Table S1.
 Supplementary Information: Last Glacial Maximum World-Ocean simulations at eddy-permitting and coarse resolutions: Do eddies contribute to a better consistency between models and paleo-proxies? M. Ballarotta
Lecture 21: Glaciers and Paleoclimate Read: Chapter 15 Homework due Thursday Nov. 12. What we ll learn today:! Learning Objectives (LO)
") Learning Objectives (LO) Lecture 21: Glaciers and Paleoclimate Read: Chapter 15 Homework due Thursday Nov. 12 What we ll learn today:! 1. 1. Glaciers and where they occur! 2. 2. Compare depositional and
Learning Objectives (LO) Lecture 21: Glaciers and Paleoclimate Read: Chapter 15 Homework due Thursday Nov. 12 What we ll learn today:! 1. 1. Glaciers and where they occur! 2. 2. Compare depositional and
lecture 12 Paleoclimate
 lecture 12 Paleoclimate OVERVIEW OF EARTH S CLIMATIC HISTORY Geologic time scales http://www.snowballearth.org/index.html Features of the climate during the Cretaceous period the land-sea distribution
Supplemental Online Material. Lifton et al. - Constraints on late Quaternary glacial history, E. Kyrgyz Tian Shan
 Supplemental Online Material Lifton et al. - Constraints on late Quaternary glacial history, E. Kyrgyz Tian Shan Lifton et al. Constraints on late Quaternary glacial history, E. Kyrgyz Tian Shan Page 2
GSA Data Repository item for Munroe et al., Geology, Latest Pleistocene advance of alpine
 Munroe et al., p. DR1 GSA Data Repository item for Munroe et al., Geology, Latest Pleistocene advance of alpine glaciers in the southwestern Uinta Mountains, Utah, USA: Evidence for the influence of local
Centennial-scale Climate Change from Decadally-paced Explosive Volcanism
 Centennial-scale Climate Change from Decadally-paced Explosive Volcanism Yafang Zhong and Gifford Miller INSTAAR, University of Colorado at Boulder, USA Bette Otto-Bliesner, Caspar Ammann, Marika Holland,
Sutherland et al: Glacial chronology, NZ
 Orbital forcing of mid-latitude southern hemisphere glaciation since 100 ka, inferred from cosmogenic nuclide ages of moraine boulders from the Cascade Plateau, southwest New Zealand Rupert Sutherland
Name Roy G Biv Page 1
 Name Roy G Biv Base your answers to questions 1 through 3 on the diagram below. The arrows show the direction in which sediment is being transported along the shoreline. A barrier beach has formed, creating
Paleoclimatology ATMS/ESS/OCEAN 589. Abrupt Climate Change During the Last Glacial Period
 Paleoclimatology ATMS/ESS/OCEAN 589 Ice Age Cycles Are they fundamentaly about ice, about CO2, or both? Abrupt Climate Change During the Last Glacial Period Lessons for the future? The Holocene Early Holocene
6. What has been the most effective erosive agent in the climate system? a. Water b. Ice c. Wind
 Multiple Choice. 1. Heinrich Events a. Show increased abundance of warm-water species of planktic foraminifera b. Show greater intensity since the last deglaciation c. Show increased accumulation of ice-rafted
Obliquity Control On Southern Hemisphere Climate During The Last Glacial
 www.nature.com/scientificreports OPEN received: 04 February 2015 accepted: 02 June 2015 Published: 26 June 2015 Obliquity Control On Southern Hemisphere Climate During The Last Glacial C.J. Fogwill 1,
Geochronology and paleoclimatic implications of the last deglaciation of the Mauna Kea Ice Cap, Hawaii
 1 1 2 3 4 Geochronology and paleoclimatic implications of the last deglaciation of the Mauna Kea Ice Cap, Hawaii Faron S. Anslow a, Peter U. Clark b,*, Mark D. Kurz c, Steven W. Hostetler d 5 6 7 8 9 10
The Distribution of Cold Environments
 The Distribution of Cold Environments Over 25% of the surface of our planet can be said to have a cold environment, but defining what we actually mean by that can be very challenging. This is because cold
Supplementary Materials for
 advances.sciencemag.org/cgi/content/full/4/5/eaar5040/dc1 Supplementary Materials for Deglaciation of the Pacific coastal corridor directly preceded the human colonization of the Americas Alia J. Lesnek,
To sample the shoreline we selected a site about 280 m west of the nearest inselberg
 1 SUPPLEMENTAL METHODS 2 3 4 5 6 7 8 9 10 11 12 13 14 15 16 17 18 19 20 21 22 23 24 EXPOSURE DATING To sample the shoreline we selected a site about 280 m west of the nearest inselberg (Jebel Hawaja; Figure
Chapter 15 Millennial Oscillations in Climate
 Chapter 15 Millennial Oscillations in Climate This chapter includes millennial oscillations during glaciations, millennial oscillations during the last 8000 years, causes of millennial-scale oscillations,
1. Deglacial climate changes
 Review 3 Major Topics Deglacial climate changes (last 21,000 years) Millennial oscillations (thousands of years) Historical Climate Change (last 1000 years) Climate Changes Since the 1800s Climate Change
GOLDSCHMIDT 2009 ABSTRACT DEADLINE FEBRUARY 21. CRONUS-EU/CRONUS-Earth Science Workshop at GOLDSCHMIDT 2009 June 24, 2009
 Issue 4 February 2009 Newsletter Table of Contents Recap of the 2008 Annual Meeting Page 1 CRONUS-EU/CRONUS-Earth Science Workshop Page 2 CRONUS-Earth Mailing List Page 2 In Situ Cosmogenic 14 C from Surfaces
Paleoclimate: What can the past tell us about the present and future? Global Warming Science February 14, 2012 David McGee
 Paleoclimate: What can the past tell us about the present and future? 12.340 Global Warming Science February 14, 2012 David McGee 1 Recent observed trends: Greenhouse gases Image courtesy of NOAA. 2 Recent
Natural and anthropogenic climate change Lessons from ice cores
 Natural and anthropogenic climate change Lessons from ice cores Eric Wolff British Antarctic Survey, Cambridge ewwo@bas.ac.uk ASE Annual Conference 2011; ESTA/ESEU lecture Outline What is British Antarctic
Second-Order Draft Chapter 10 IPCC WG1 Fourth Assessment Report
 Second-Order Draft Chapter IPCC WG Fourth Assessment Report Figure... Multi model mean changes in a) zonal mean cloud fraction (in %), shown as a cross section though the atmosphere, and b) total cloud
Climate of the Past. A. Govin et al.
 Clim. Past Discuss., 9, C3570 C3579, 2014 www.clim-past-discuss.net/9/c3570/2014/ Author(s) 2014. This work is distributed under the Creative Commons Attribute 3.0 License. Climate of the Past Discussions
The Tswaing Impact Crater, South Africa: derivation of a long terrestrial rainfall record for the southern mid-latitudes
 The Tswaing Impact Crater, South Africa: derivation of a long terrestrial rainfall record for the southern mid-latitudes T.C. PARTRIDGE Climatology Research Group, University of the Witwatersrand, Johannesburg,
PMIP Ocean Workshop 2013 Program Outline
 PMIP Ocean Workshop 2013 Program Outline We, Dec. 4 8:30-9:15 Introductory Discussion 9:15-10:15 Model-Data Comparison 10:30-12:00 Quantifying Uncertainties 1:00-2:30 LGM and Deglacial Changes in the Tropics
Today s Climate in Perspective: Hendrick Avercamp ( ) ~1608; Rijksmuseum, Amsterdam
 ~1608; Rijksmuseum, Amsterdam") Today s Climate in Perspective: Paleoclimate Evidence Hendrick Avercamp (1585-1634) ~1608; Rijksmuseum, Amsterdam Observations Instrumental surface temperature records? (Le Treut et al., 2007 IPCC AR4
Today s Climate in Perspective: Paleoclimate Evidence Hendrick Avercamp (1585-1634) ~1608; Rijksmuseum, Amsterdam Observations Instrumental surface temperature records? (Le Treut et al., 2007 IPCC AR4
SUPPLEMENTARY INFORMATION
 SUPPLEMENTARY INFORMATION doi:10.1038/nature11784 Methods The ECHO-G model and simulations The ECHO-G model 29 consists of the 19-level ECHAM4 atmospheric model and 20-level HOPE-G ocean circulation model.
Holocene ice recession at Polygon Spur, Reedy Glacier, Antarctica
 652708HOL0010.1177/0959683616652708The HoloceneHall et al. research-article2016 Research paper Holocene ice recession at Polygon Spur, Reedy Glacier, Antarctica The Holocene 2017, Vol. 27(1) 122 129 The
Chapter outline. Reference 12/13/2016
 Chapter 2. observation CC EST 5103 Climate Change Science Rezaul Karim Environmental Science & Technology Jessore University of science & Technology Chapter outline Temperature in the instrumental record
An integrated speleothem proxy and climate modeling study of the last deglacial climate in the Pacific Northwest
 An integrated speleothem proxy and climate modeling study of the last deglacial climate in the Pacific Northwest Jerry Potter UC Davis, University of Michigan, NASA GSFC Isabel Montanez, University of
Climate Change 2007: The Physical Science Basis
 Climate Change 2007: The Physical Science Basis Working Group I Contribution to the IPCC Fourth Assessment Report Presented by R.K. Pachauri, IPCC Chair and Bubu Jallow, WG 1 Vice Chair Nairobi, 6 February
We re living in the Ice Age!
 Chapter 18. Coping with the Weather: Causes and Consequences of Naturally Induce Climate Change 지구시스템의이해 We re living in the Ice Age! 1 Phanerozoic Climate 서늘해지고 더웠고 따뜻했고 3 Climate Rollercoaster 4 2 Time
Observed changes in climate and their effects
 1 1.1 Observations of climate change Since the TAR, progress in understanding how climate is changing in space and time has been gained through improvements and extensions of numerous datasets and data
Geological Field Trips in Southern Idaho, Eastern Oregon, and Northern Nevada
 Geological Field Trips in Southern Idaho, Eastern Oregon, and Northern Nevada Edited by Kathleen M. Haller and Spencer H. Wood Any use of trade, firm, or product names is for descriptive purposes only
Which landscape best represents the shape of the valleys occupied by glaciers? A) B) C) D)
 B) C) D)") 1. Glaciers often form parallel scratches and grooves in bedrock because glaciers A) deposit sediment in unsorted piles B) deposit rounded sand in V-shaped valleys C) continually melt and refreeze D) drag
1. Glaciers often form parallel scratches and grooves in bedrock because glaciers A) deposit sediment in unsorted piles B) deposit rounded sand in V-shaped valleys C) continually melt and refreeze D) drag
SAMPLE PAGE. pulses. The Ice Age By: Sue Peterson
 Page 61 Objective sight words (pulses, intermittent, isotopes, chronicle, methane, tectonic plates, volcanism, configurations, land-locked, erratic); concepts (geological evidence and specific terminology
Glaciology (as opposed to Glacial Geology) Why important? What are glaciers? How do they work?
 Why important? What are glaciers? How do they work?") Glaciology (as opposed to Glacial Geology) Why important? What are glaciers? How do they work? Glaciers are important because of their role in creating glacial landscapes (erosional and depositional features).
Glaciology (as opposed to Glacial Geology) Why important? What are glaciers? How do they work? Glaciers are important because of their role in creating glacial landscapes (erosional and depositional features).
Outline 23: The Ice Ages-Cenozoic Climatic History
 Outline 23: The Ice Ages-Cenozoic Climatic History Continental Glacier in Antarctica Valley Glaciers in Alaska, note the moraines Valley Glaciers in Alaska, note the moraines Mendenhall Glacier, Juneau,
How do glaciers form?
 Glaciers What is a Glacier? A large mass of moving ice that exists year round is called a glacier. Glaciers are formed when snowfall exceeds snow melt year after year Snow and ice remain on the ground
Outline 24: The Holocene Record
 Outline 24: The Holocene Record Climate Change in the Late Cenozoic New York Harbor in an ice-free world (= Eocene sea level) Kenneth Miller, Rutgers University An Ice-Free World: eastern U.S. shoreline
Ruddiman CHAPTER 13. Earth during the LGM ca. 20 ka BP
 Ruddiman CHAPTER 13 Earth during the LGM ca. 20 ka BP The Last Glacial Maximum When? How much more ice than today? How much colder was it than today (global average)? How much lower were snowlines? Did
Solar variability and Climate Change
 Solar variability and Climate Change Ulrich Cubasch Freie Universität, Berlin Joint work with Fidel Gonzalez-Rouco, Tom Crowley, Gabi Hegerl, Stefanie Legutke, Jürg Luterbacher, Ulrich Schlese, Hans von
8. Climate changes Short-term regional variations
 8. Climate changes 8.1. Short-term regional variations By short-term climate changes, we refer here to changes occurring over years to decades. Over this timescale, climate is influenced by interactions
Supplementary Figure 1: Modern burial of organic carbon in deep sea sediment (gc m -2 a -1 ) 1.
 1.") Supplementary Figure 1: Modern burial of organic carbon in deep sea sediment (gc m -2 a -1 ) 1. Supplementary Figure 2: The 7 province maps used in this study. Each color corresponds to a single province:
Supplementary Figure 1: Modern burial of organic carbon in deep sea sediment (gc m -2 a -1 ) 1. Supplementary Figure 2: The 7 province maps used in this study. Each color corresponds to a single province:
Orbital-Scale Interactions in the Climate System. Speaker:
 Orbital-Scale Interactions in the Climate System Speaker: Introduction First, many orbital-scale response are examined.then return to the problem of interactions between atmospheric CO 2 and the ice sheets
History. Late 18 th /early 19 th century Europeans observed that erratic boulders dispersed due to the retention of glaciers caused by climate chance
 Ice ages What is an ice age? Geological period of long-term reduction in the temperature of the Earth's surface and atmosphere which results in the formation and expansion of continental ice sheets, polar
IODP Proposal Cover Sheet 915 -
 IODP Proposal Cover Sheet 915 - Pre North Atlantic Fjord Sediment Archives Received for: 2017-04-03 Title Proponents Fjord sediment archives: assessing the recent (post LGM) millennial to sub-decadal scale
Deducing Erosion Rates of the Mt. Langley Summit Flat using 21 Ne in Quartz. Curtis Baden 1. David L. Shuster 1,2, Advisor. Greg Balco 2, Collaborator
 Deducing Erosion Rates of the Mt. Langley Summit Flat using 21 Ne in Quartz Curtis Baden 1 David L. Shuster 1,2, Advisor Greg Balco 2, Collaborator 1: Earth and Planetary Science; University of California,
Website Lecture 3 The Physical Environment Part 1
 Website http://websites.rcc.edu/halama Lecture 3 The Physical Environment Part 1 1 Lectures 3 & 4 1. Biogeochemical Cycling 2. Solar Radiation 3. The Atmosphere 4. The Global Ocean 5. Weather and Climate
An Arctic Perspective on Climate Change
 An Arctic Perspective on Climate Change 23 Oct 2012 Gifford Miller (and many others) University of Colorado Boulder The Earth is warming How do we know? Temperature Anomaly ( C) It s a fact Global Land
Past, present and future
 Southern New Jersey and Delaware sea levels: Past, present and future Benjamin P. Horton Sea Level Research Department of Marine and Coastal Science Rutgers University bphorton@marine.rutgers.edu DRIVERS
Tropical Moist Rainforest
 Tropical or Lowlatitude Climates: Controlled by equatorial tropical air masses Tropical Moist Rainforest Rainfall is heavy in all months - more than 250 cm. (100 in.). Common temperatures of 27 C (80 F)
mountain rivers fixed channel boundaries (bedrock banks and bed) high transport capacity low storage input output
 high transport capacity low storage input output") mountain rivers fixed channel boundaries (bedrock banks and bed) high transport capacity low storage input output strong interaction between streams & hillslopes Sediment Budgets for Mountain Rivers Little
mountain rivers fixed channel boundaries (bedrock banks and bed) high transport capacity low storage input output strong interaction between streams & hillslopes Sediment Budgets for Mountain Rivers Little
The recent retreat of glaciers in the world
 The recent retreat of glaciers in the world Consequences for the global environment Dr Bernard Francou Director of Research Emeritus Grenoble-Alpes University - France Glaciers are part of the cryosphere
New perspectives on old data: What the earth s past tells us about future sea level rise
 New perspectives on old data: What the earth s past tells us about future sea level rise Bindschadler, Science, 1998 Andrea Dutton Department of Geological Sciences University of Florida Historical record
Transformational Climate Science. The future of climate change research following the IPCC Fifth Assessment Report
 Transformational Climate Science The future of climate change research following the IPCC Fifth Assessment Report www.exeter.ac.uk/climate2014 Working Group I The challenge of climate change #climate2014
Ice on Earth: An overview and examples on physical properties
 Ice on Earth: An overview and examples on physical properties - Ice on Earth during the Pleistocene - Present-day polar and temperate ice masses - Transformation of snow to ice - Mass balance, ice deformation,
Glacial Modification of Terrain
 Glacial Modification Part I Stupendous glaciers and crystal snowflakes -- every form of animate or inanimate existence leaves its impress upon the soul of man. 1 -Orison Swett Marden Glacial Modification
PHYSICAL GEOGRAPHY. By Brett Lucas
 PHYSICAL GEOGRAPHY By Brett Lucas GLACIAL PROCESSES Glacial Processes The Impact of Glaciers on the Landscape Glaciations Past and Present Types of Glaciers Glacier Formation and Movement The Effects of
Chapter 1 Section 2. Land, Water, and Climate
 Chapter 1 Section 2 Land, Water, and Climate Vocabulary 1. Landforms- natural features of the Earth s land surface 2. Elevation- height above sea level 3. Relief- changes in height 4. Core- most inner
AMOC Impacts on Climate
 AMOC Impacts on Climate Rong Zhang GFDL/NOAA, Princeton, NJ, USA Paleo-AMOC Workshop, Boulder, CO, USA May 24, 2016 Atlantic Meridional Overturning Circulation (AMOC) Kuklbrodt et al. 2007 McManus et al.,
Lecture Outline Lecture Outline Monday April 9-16, 2018 Questions? Announcements:
 Lecture Outline Lecture Outline Monday April 9-16, 2018 Questions? Announcements: Geology 101 Night Video: The Day After Tomorrow Hollywood disaster movie about the onset of a glacial period When: Monday
Modes of Global Climate Variability during Marine Isotope Stage 3 (60 26 ka)
") 15 MARCH 2010 P I S I A S E T A L. 1581 Modes of Global Climate Variability during Marine Isotope Stage 3 (60 26 ka) NICKLAS G. PISIAS College of Oceanic and Atmospheric Sciences, Oregon State University,
15 MARCH 2010 P I S I A S E T A L. 1581 Modes of Global Climate Variability during Marine Isotope Stage 3 (60 26 ka) NICKLAS G. PISIAS College of Oceanic and Atmospheric Sciences, Oregon State University,
Continental Hydrology, Rapid Climate Change, and the Intensity of the Atlantic MOC: Insights from Paleoclimatology
 Continental Hydrology, Rapid Climate Change, and the Intensity of the Atlantic MOC: Insights from Paleoclimatology W.R. Peltier Department of Physics University of Toronto WOCE derived N-S salinity section
Glacial-Interglacial Cycling: Ice, orbital theory, and climate. Dr. Tracy M. Quan IMCS
 Glacial-Interglacial Cycling: Ice, orbital theory, and climate Dr. Tracy M. Quan IMCS quan@marine.rutgers.edu Outline -The past - discovery of glacial periods - introduction of orbital theory -The present
MAPS REGENTS REVIEW PRACTICE
 Base your answers to questions 1 and 2 on the topographic map and on your knowledge of Earth science. Points A and B represent locations on Earth's surface. Elevations are shown in feet. The 50-ft and
The Nansen-Zhu International Research Centre: Beijing, China
 The Nansen-Zhu International Research Centre: Beijing, China Vision To become an internationally acknowledged climate research and training centre with emphasis on tropical and highlatitude regions, and
Amplitude and Rhythm of Winter Half-year Temperature Change in Eastern China for the Past 2000 Years
 Letters Article ID: 1673-1719 (2007) Suppl.-0026-05 Amplitude and Rhythm of Winter Half-year Temperature Change in Eastern China for the Past 2000 Years Ge Quansheng 1, Zheng Jingyun 1, Liu Jian 2 1 Institute
The Ice Age sequence in the Quaternary
 The Ice Age sequence in the Quaternary Subdivisions of the Quaternary Period System Series Stage Age (Ma) Holocene 0 0.0117 Tarantian (Upper) 0.0117 0.126 Quaternary Ionian (Middle) 0.126 0.781 Pleistocene
Listing of Sessions per INQUA Commission
 Listing of Sessions per INQUA Commission Coastal and Marine Processes Arctic landscape evolution and long-term coastal change (Poster only) Back to the future: Submerged shorelines on the shelf as tools
Climate Variability and Change Past, Present and Future An Overview
 Climate Variability and Change Past, Present and Future An Overview Dr Jim Salinger National Institute of Water and Atmospheric Research Auckland, New Zealand INTERNATIONAL WORKSHOP ON REDUCING VULNERABILITY
THE RELATION OF GREAT BASIN LATE QUATERNARY HYDROLOGIC AND CRYOLOGIC VARIABILITY TO NORTH ATLANTIC CLIMATE OSCILLATIONS
 THE RELATION OF GREAT BASIN LATE QUATERNARY HYDROLOGIC AND CRYOLOGIC VARIABILITY TO NORTH ATLANTIC CLIMATE OSCILLATIONS L. Benson a, R. Spencer b, D. Rhode c, L. Louderback d, R. Rye e a U. S. Geological
This article appeared in a journal published by Elsevier. The attached copy is furnished to the author for internal non-commercial research and
 This article appeared in a journal published by Elsevier. The attached copy is furnished to the author for internal non-commercial research and education use, including for instruction at the authors institution
Monday, December 4, 2017 The Pleistocene Glaciations (Chapter 14) Week 14 Assessment, closes Wednesday Dec 6
 Week 14 Assessment, closes Wednesday Dec 6") Monday, December 4, 2017 The Pleistocene Glaciations (Chapter 14) Week 14 Assessment, closes Wednesday Dec 6 Week 15 Assessment will be last one, closes Wednesday Dec 13 Homework 5 due Wednesday, Dec 6
Monday, December 4, 2017 The Pleistocene Glaciations (Chapter 14) Week 14 Assessment, closes Wednesday Dec 6 Week 15 Assessment will be last one, closes Wednesday Dec 13 Homework 5 due Wednesday, Dec 6