A MULTI-CHANNEL SEISMIC AND BATHYMERIC INVESTIGATION OF THE CENTRAL MARIANA CONVERGENT MARGIN
|
|
|
- Esther Cain
- 5 years ago
- Views:
Transcription
1 A MULTI-CHANNEL SEISMIC AND BATHYMERIC INVESTIGATION OF THE CENTRAL MARIANA CONVERGENT MARGIN A DISSERTATION SUBMITTED TO THE GRADUATE DIVISION OF THE UNIVERSITY OF HAWAI I AT MĀNOA IN PARTIAL FULFILLMENT OF THE REQUIREMENTS FOR THE DEGREE OF DOCTOR OF PHILOSOPHY IN GEOLOGY AND GEOPHYSICS December 2008 By Adrienne Jean Oakley Dissertation Committee: Brian Taylor, Chairperson Gregory F. Moore Patricia Fryer Patricia Cooper John Wiltshire
2 We certify that we have read this dissertation and that, in our opinion, it is satisfactory in scope and quality as a dissertation for the degree of Doctor of Philosophy in Geology and Geophysics. DISSERTATION COMMITTEE Chairperson ii
3 ACKNOWLEDGEMENTS I would like to thank my family and friends for their support and encouragement. I am also grateful to the many professors with whom I worked both at Bowdoin College and the University of Hawai i. I am especially thankful for the time and energy that my advisor, Brian Taylor, gave to me during my graduate work. Greg Moore provided training, guidance and an ever critical eye, and my work is better for it. I am grateful for the support and enthusiasm I received from my other committee members Patty Fryer, Pat Cooper and John Wiltshire. I would also like to recognize the contributions of Andrew Goodliffe, Julia Morgan, Barry Taylor, Christopher Bochicchio, Emily Chapp, and Toshihiro Ike, without whom this project could not have been completed. I would like to thank the captain and crew of the R/V Maurice Ewing as well as the other EW0202/03 cruise participants. I am grateful to the NOAA Pacific Islands Fisheries Science Center, J. Gardner, A. Klaus, M. Nakanishi and N. Seama for providing multibeam bathymetry data used in this study. This research was supported by NSF grant OCE as part of the MARGINS Program. iii
4 ABSTRACT New multi-channel seismic (MCS) and bathymetry data collected in 2002 image the central Mariana margin (14-19 N) from the subducting Pacific Plate to the West Mariana Ridge (WMR) remnant arc. These data provide the best and most complete images of the Mariana subduction system. Previous to this study, the standard view of the Mariana system came from subduction cartoons that typified the margin at 18 N. I investigate subduction processes along strike of the margin and provide essential information to the NSF MARGINS Subduction Factory Initiative that can be used in creating a mass balance of material through the Mariana subduction zone. Subducting oceanic crustal thickness varies along the central Mariana margin from km, and sediment thicknesses range from km. The Mariana Trench axis is commonly a graben that accommodates an abrupt change (within <25 km) of plate dip from ~2º on the incoming plate to >8º beneath the outer forearc. I infer that the upper plate fails there rather than simply bends under the applied loads. Beneath the serpentinite seamounts on the Mariana forearc, the subducting plate dips 9-12º and the top of the plate is ~20-22 km below sea level. This is the first study to show the internal structure of serpentinite seamounts on the outer Mariana forearc and model their deformation and interaction with underlying sediments. Serpentinite seamounts, representing some of the first subduction factory outputs, are formed by the episodic eruption of mudflows from a central conduit. The seamounts, emplaced on faulted and sedimented forearc basement, spread laterally and are subject to gravitational deformation at they grow. Using MCS reflection and swath bathymetry data, combined with DSDP drilling and seismic refraction studies, I iv
5 define the boundary between rifted arc and accreted backarc basin crust on both sides of the Mariana Trough and support the hypothesis that the backarc basin is asymmetric. The modern Mariana Arc, with the exception of a few cross-chain volcanoes, is built entirely on rifted arc crust between 14 and 19 N. The Mariana Trough is opening nonrigidly and is characterized by two predominant abyssal hill trends (NNW-SSE and N-S). v
6 TABLE OF CONTENTS Acknowledgements...iii Abstract...iv List of Tables...x List of Figures...xi Chapter 1: Introduction...1 Chapter 2: Pacific Plate Subduction beneath the central Mariana and Izu-Bonin Forearcs: New insights from an old margin...10 Abstract...10 Introduction...11 Geologic Setting and Previous Work...15 Data Acquisition and Processing...18 Data Description...20 The Incoming Pacific Plate and Mariana Trench...20 The Incoming Pacific Plate and Izu-Bonin Trench...22 Pacific Plate stratigraphy and crustal thickness...22 Toe of the inner trench slope...23 Inner Trench Slope...25 Outer Mariana forearc and depths to the subducting plate...27 Discussion...29 Flexure of the incoming Pacific Plate and its failure at the Mariana Trench graben...29 Inputs to the Mariana Subduction Factory...32 vi
7 Subducting Pacific Plate seamounts and the inner trench slope...37 Serpentinite seamounts, forearc mantle and the subducting plate...41 Summary...42 Appendix: Methods...46 Figures...48 Chapter 3: Emplacement, Growth, and Gravitational Deformation of Serpentinite Seamounts on the Mariana Forearc...78 Summary...78 Introduction...80 Geologic Setting...82 IBM Subduction and Mariana Forearc Processes...82 Giant Mud Volcanoes...86 Data acquisition and processing...88 Serpentinite Seamount Description...89 Big Blue Seamount...89 Celestial Seamount...92 Turquoise Seamount...95 Numerical Simulations of Seamount Gravitational Deformation...97 Evidence for Gravitational Deformation...97 Internal and Basal Strengths of the Seamounts...98 Discrete Element Simulations...99 Discussion Growth and Deformation of Serpentinite Seamounts vii
8 Summit Depressions, Conduits and Faults The role of fluids Seamount Composition Conclusions Appendix Figures Chapter 4: Sedimentary, volcanic and tectonic processes of the central Mariana arc: Part 1: Mariana Trough backarc basin formation and the West Mariana Ridge Abstract Introduction Background Tectonics, Volcanism and Sedimentation 152 Mariana Trough Description Bathymetry Seismic Interpretation The West Mariana Ridge (WMR) The Spreading axis and eastern margin of the Mariana Trough Discussion Remnant Arcs and the Location of Arc Rupture The boundary between rifted arc and backarc basin crust Results from DSDP Drilling across the central Mariana system The rifted boundaries of the WMR remnant arc viii
9 The eastern margin of the Mariana Trough The substrate of the Mariana Arc Mariana Trough asymmetry Mariana Trough spreading and segmentation Active deformation along the margins of the Mariana Trough Conclusions Figures Chapter 5: Conclusions References ix
10 LIST OF TABLES Table Page D Processing Sequence (using ProMAX) PROMAX 2D Processing Sequence x
11 LIST OF FIGURES Figure Page 1.1. Regional location map Regional location map Time and depth sections of MCS Line with velocity model Highlighted Mariana forearc bathymetry with plate-depth picks Bathymetric profiles across the central Mariana Trench and depth vs. latitude along the trench axis and outer forearc Time and depth sections of MCS Line Time and depth sections of MCS Line Time and depth sections of MCS Line Bonin Trench bathymetry and bathymetric profiles Bonin and Mariana Lower Slope Terrace Pacific Plate inputs A. Toe of slope along Lines and B. Toe of slope along Lines and The incoming Pacific Plate chert layer and top of subducted plate plotted in depth vs. distance from the trench by MCS profile number D image of the subducting Pacific Plate Cross-section of the Mariana Subduction System along MCS Line Regional location map A. Schematic subduction diagram. B. Seamount emplacement diagram Map of Big Blue Seamount MCS Line over Big Blue xi
12 3.5. MCS Line over Big Blue Map of Celestial and Turquoise MR-1 side-scan sonar MCS Line in time MCS Line in time MCS Line in depth over Celestial Seamount MCS Line across Turquoise Seamount Basal thrusting on the flanks of Turquoise Seamount DEM simulation results for an undeformable substrate DEM simulation results for a deformable substrate Serpentinite Mud Volcanoes Appendix Figure 3.1.Velocity model for Celestial Seamount depth conversion A. Regional bathymetric location map. B. Regional bathymetric location map. C. Approximate locations of bathymetry datasets in Figure Bathymetric map of the central Mariana arc/backarc region Enlarged maps with shot numbers along interpreted MCS lines Interpreted map with color bathymetry removed MCS profiles in time over the West Mariana Ridge Time sections of Conrad Line 55 and MCS Line MCS profiles in time over the spreading axis and eastern margin of the Mariana Trough Time section of MCS Line Time section of MCS Line xii
13 4.10. A. 2D Refraction model from Takahashi et al., B. Refection profile collected during the refraction survey A. Rifting along the Izu-Bonin arc. B. Oblique rifting/spreading along the West Mariana Ridge Cross-section of the central Mariana convergent margin xiii
14 Chapter 1: Introduction Oceanic lithosphere is recycled at subduction zones, causing earthquakes, tsunamis and explosive volcanism. Ore deposits, geothermal energy and continental crustal genesis are also associated with subduction. During the subduction process, some raw materials from the down-going plate are transferred to the overriding plate creating products in the form of melts, aqueous fluids and gases, metalliferous hydrothermal deposits, arc volcanoes, and serpentinite seamounts. The remainder of the subducting plate returns to the deep mantle. The Subduction Factory Initiative was created by the MARGINS Program (funded by the National Science Foundation (NSF)) to investigate chemical, biological, volcanic, tectonic, and seismic processes involved in Earth s recycling at convergent margins [MARGINS, 2003]. Two margins were chosen as focus areas for the SubFac Initiative: Central America and Izu-Bonin-Mariana (IBM). My study concentrates on the Mariana convergent plate margin, at the southern end of the IBM system (Figure 1.1). The Mariana trench-arc-backarc is the classic example of an intraoceanic, nonaccretionary subduction system [Karig, 1971a; 1971b; Forsyth and Uyeda, 1975; Uyeda, 1982; Ricard et al., 1988] and the history of subduction input, volcanic output, and backarc spreading are well studied. The Mariana margin subducts very old oceanic lithosphere (~170 Ma) and is isolated from any continental influence on sedimentation or magmatism. The absence of a large prism of accreted sediment, coupled with the relatively thin (< 500 m) volcaniclastic/pelagic sediment cover on the inner trench slope, makes the Mariana system ideal for studying forearc (the area between the active arc and the trench) structure and fault patterns that are often hidden in systems 1
15 with a thick sediment cover. Active serpentinite seamounts, representing the first (most trench-proximal) material outputs of the subduction factory, are found only on the Izu- Bonin-Mariana forearc (Figure 1.1). Although active serpentinite seamounts have not yet been found in other forearcs, they do have analogs in ancient convergent margins worldwide. As the first major phase of a US-Japanese collaborative NSF-MARGINS funded project titled "Multi-scale seismic imaging of the Mariana Subduction Factory," we collected 5124 km of multi-channel seismic (MCS) data between 14 N and 19 N across the central Mariana arc system in February- March of 2002 (cruise: EW0202). Coincident gravity, magnetic, and Hydrosweep DS2 data were collected on all 48 lines. The resulting geophysical transects extend from the Pacific Plate to the West Mariana Ridge remnant arc (Figure 1.1). A following survey (EW0203) imaged the frontal-arc high and active arc of the Mariana island-arc system using controlled-source wide-angle reflection/refraction and multi-channel seismic reflection. The MCS profiles collected in 2002 offer the best and most complete images of the central Mariana margin. These new data, combined with regional bathymetry and recent seismic refraction studies, provided me with a unique opportunity to investigate major scientific problems in the central Mariana margin, including: 1. What are the inputs to the Mariana Subduction Factory? (Chapter 2) One of the main goals of the MARGINS Subduction Factory Initiative was to determine a mass balance of material through the Mariana subduction zone, and relate inputs to outputs. The first step toward accomplishing this is to 2
16 quantify the sediment and crustal inputs from the incoming Pacific Plate and see how they vary along-strike of the margin. MCS profiles east of the Mariana Trench image Pacific Plate basement and Moho. 2. What is the geometry of the subducting Pacific Plate and how is it related to plate flexure? (Chapter 2) Normal faults caused by the flexural bending of the incoming plate into the trench may facilitate the addition of fluid to the subduction system by serving as conduits for seawater to move downward into the subducting plate. Knowing how the shape of the plate changes as it enters the subduction zone has implications for brittle upper plate failure vs. plate flexure. New bathymetry and MCS data along the central Mariana margin image the incoming Pacific Plate from ~100 km east of the trench axis, to ~70 km west of the axis beneath the outer forearc. 3. Are incoming sediments subducted, accreted or underplated along the trench? (Chapter 2) Sediments may be scraped off the downgoing plate to form accretionary prisms, underplated beneath the forearc, and/or subducted to the depths of magma generation and beyond. Even in regions without large accretionary prisms some degree of offscraping and/or underplating of sediments can occur and may reduce the amount of sediment and fluid delivered to the subduction factory. Therefore an analysis of processes occurring within the trench and at the toe of the slope is 3
17 needed to understand and quantify subduction inputs. Our seismic data across the toe of the inner trench slope allow us to determine to what extent accretion and/or sediment subduction occur along the Mariana Trench. 4. How is the outer forearc affected by the subduction of Pacific Plate seamounts? (Chapter 2) Previous work hypothesizes that the Mariana forearc has responded to past subduction of seamounts with vertical tectonism and that strain partitioning (the transfer of strain from one plate to another across a plate boundary) varies alongstrike of the system. Our new data include several lines across the outer forearc enabling us to test this hypothesis. It has also been suggested that there is a relationship between serpentinite seamounts and faulting in the outer forearc. Extensional faults may provide pathways for rising serpentinite muds and slabderived fluids/gases to reach the seafloor. 5. What are the dips and depths of the subducting plate beneath serpentinite seamounts on the outer Mariana forearc? (Chapter 2) Serpentinite seamounts vent slab-derived fluids and gasses and deepderived solids, representing some of the first outputs of the subduction system. The compaction and dehydration reactions that release fluid from the slab are depth and temperature-controlled, and therefore the fluid flux through the subduction zone is governed by the geometry of the subducting plate. This 4
18 geometry is not well constrained by earthquake locations beneath the outer forearc, but can be determined based on depth-converted MCS data. 6. What do the structure and morphology of serpentinite seamounts on the outer Mariana forearc tell us about their formation and deformation? (Chapter 3) New MCS and bathymetric data reveal the large-scale structures of five serpentinite seamounts, as well as the pre-seamount basement geometry and sediment stratigraphy. Knowing the internal structure sheds light onto how these seamounts are formed and deformed and allows us to evaluate models for their emplacement and growth. Understanding how, when and where serpentinite seamounts are emplaced is important to correctly characterize the flux of slabderived material through the subduction system. 7. What is the nature of arc rifting and backarc basin spreading in the central Mariana system? (Chapter 4) The boundary between rifted arc and backarc basin accreted crust in island-arc settings is poorly constrained, partially because of the lack of wellstudied examples, and also because of the presence of thick volcaniclastic sediments that mask basement topography. Knowing this boundary allows us to evaluate the symmetry or asymmetry of oceanic accretion in backarc basins and determine the substrate upon which modern arc volcanoes are built. It is 5
19 necessary to know what underlies arc volcanoes in order to understand the outputs of the subduction factory and eventual formation of felsic continental crust. New MCS profiles across the eastern and western margins of the Mariana Trough reveal subsurface basement topography and provide structural constraints on the extent of rifted arc crust versus accreted backarc basin crust, and new bathymetry data image the West Mariana Ridge and the variable trends of abyssal hill fabric across the Mariana Trough. These data, combined with results from drilling and seismic refraction, allow us to evaluate the nature of arc rifting and backarc basin spreading in the central Mariana system and determine the substrate of the modern volcanic arc. These issues are addressed in the three main chapters of this dissertation. Chapters 3 and 4 concentrate solely on the Mariana arc system; however, Chapter 2 includes previously unpublished data from the Izu-Bonin forearc. The chapters are presented from East to West. Chapter 2 is taken from a published paper that seeks to understand and image Pacific Plate subduction beneath the central Mariana and Izu- Bonin forearcs. Based on new MCS and bathymetry data, I created a cross-section showing the important features of Pacific Plate subduction beneath the central Mariana forearc, including sediment and crustal inputs to the subduction system, a trench axis graben, and subducted plate geometry. Chapter 3 is a published paper that focuses on the emplacement and deformation of serpentinite mud volcanoes on the outer Mariana forearc. This is the first published work to show the internal structure of serpentinite seamounts and model their deformation and interaction with underlying sediments. The 6
20 data support the interpretation that serpentinite seamounts on the Mariana forearc are formed by the episodic eruption of mudflows from a central conduit. Discrete element method (DEM) numerical simulations successfully reproduce the morphology of the serpentinite seamounts and model their interaction with underlying forearc sediments. Chapter 4 investigates the sedimentary, volcanic and tectonic processes in the Central Mariana Arc system using MCS, bathymetry and seismic refraction data. These data reveal structure and stratigraphy related to three volcanic arcs and two periods of arc rifting. I interpret the boundary between accreted backarc basin and rifted arc crust along the margins of the Mariana Trough and determine the substrate of the modern volcanic arc. I discuss the rifting of the West Mariana Ridge and show how it is related to Mariana Trough backarc basin formation. The data support the hypothesis that the Mariana Trough is asymmetric and show that the basin is dominated by two abyssal hill trends: NNW-SSE and N-S. To conclude, in Chapter 5 I will summarize the findings from the three previous chapters and present a cross-section along a reflection profile that shows the major features of the central Mariana convergent margin from the outer trench slope to the West Mariana Ridge remnant arc (Figure 1.1). 7
21 Figure 1.1: Regional location map. PSP= Philippine Sea Plate, PP= Pacific Plate, IBM=Izu-Bonin-Mariana Trenches, MT= Mariana Trough Backarc Basin, WMR= West Mariana Ridge, PVB= Parece Vela Basin, PKR= Palau-Kyushu Ridge, WPB= West Philippine Basin. Bathymetry, highlighted from the east, over the central Mariana convergent margin with major features labeled. Gray lines indicate EW Multi-channel seismic and Conrad 1979 survey lines. Black triangles locate Ocean Bottom Seismometers used for refraction studies. Circles with crosshairs are Deep Sea Drilling Project Sites. Contour interval = 1km. 8

22 9
23 Chapter 2: Pacific Plate Subduction beneath the central Mariana and Izu-Bonin Forearcs: New insights from an old margin This chapter was originally published in Geochemistry, Geophysics and Geosystems. The full reference is: Oakley, A. J., B. Taylor, G.F. Moore (2008), Pacific Plate Subduction beneath the central Mariana and Izu-Bonin Forearcs: New insights from an old margin, Geochem., Geophys., Geosyst. It is produced herein courtesy of American Geophysical Union, who is the sole copyright holder. Abstract Multichannel seismic (MCS) profiles and bathymetric data from the central Mariana and Izu-Bonin subduction systems image the subducting Pacific Plate from the outer trench slope to beneath serpentinite seamounts on the outer forearc. Subducting oceanic crust varies along the Mariana margin from km thick and is covered by km thick sediments and numerous seamounts. Oceanic crustal thickness east of the Izu-Bonin Trench is ~6 km. Faulting resulting from flexure of the incoming Pacific Plate begins up to 100 km east of the trench axis, near the 6 km depth contour. The plate is cut by normal faults that reactivate inherited tectonic fabric where that fabric strikes <25º to the trench. Where the strike is >25º, incoming crust breaks along new faults with a trench-parallel strike. The Mariana Trench axis is commonly a graben that accommodates an abrupt change (within <25 km) of plate dip from <4º (commonly 2 ) on the incoming plate to >8º beneath the outer forearc. We infer that the plate fails there rather than simply bends under the applied loads. Along portions of the Mariana margin, subducting seamounts displace the trench axis westward and uplift the toe of the slope. Surprisingly, west of the toe, there is no geophysical evidence of disturbance of the upper 10
24 plate in response to seamount subduction, nor of significant subduction erosion or sediment underplating. MCS profiles across the base of the Mariana inner trench slope provide evidence for both complete subduction and small-scale accretion of Pacific Plate sediments; however we found no evidence for long-term sediment accretion. The subducting plate dips 9-12º beneath serpentinite seamounts on the Izu-Bonin and Mariana Forearcs. Along the Mariana margin, the majority of these seamounts are located ~50-70 km west of the trench where the mantle wedge is 3-7 km thick between 8-10 km thick forearc crust and the top of the subducting plate. The apparent lack of significant deformation of the Mariana Forearc crust by subducting seamounts may be the result of a weak serpentinized mantle wedge and/or progressive fracturing as the subducting plate increases in dip as it passes through the trench graben. Introduction Subduction zones recycle near-surface materials (sediments, fluids, crust and depleted mantle lithosphere) to beneath the zone of arc and back-arc magma genesis and thence deeper into the asthenosphere. From the trench outer rise to the deep subducted slab, the inputs to the subduction zone are deformed, added to, and subtracted from, resulting in diverse surficial products and mantle modifications, earthquake seismicity patterns and slab geometries. Arc volcanism carries the signatures of subducted sediments, fluids, and crust to varying degrees, raising questions as to what processes are responsible for the variability (e.g.[plank and Langmuir, 1993; Elliott et al., 1997]). Normal faulting that accompanies flexural bending of the incoming plate into the trench [Bodine and Watts, 1979] may facilitate the addition of fluid to the subduction 11
25 system [Ranero and Sallares, 2004]). For example, Ranero et al. [2003] propose that normal faults along the Middle-America Trench cut >20 km into the subducting plate and serve as pathways for fluids to serpentinize the subducting plate mantle. The subduction of seamounts may locally uplift and tectonically erode the toe of the overriding plate, which collapses as the seamount passes under the slope (e.g., [Lallemand et al., 1989; Dominguez et al., 1998]). Sediments may be scraped off the downgoing plate to form accretionary prisms, underplated beneath the forearc, and/or subducted to the depths of magma generation and beyond [von Huene and Scholl, 1991]. Relating the subduction inputs to volcanic outputs is simplified in non-accretionary intra-oceanic subduction zones where the sedimentary section is assumed to be subducted completely and where there is no continental influence on sedimentation or magmatism. The Izu-Bonin- Mariana (IBM) arc trench backarc is the classic example of an intraoceanic subduction system [Karig, 1971a; 1971b; Forsyth and Uyeda, 1975; Uyeda, 1982; Ricard et al., 1988] and the history of subduction input, volcanic output and back-arc spreading are well studied. von Huene and Scholl [1991] showed that sediment supply controls the balance between accretion and nonaccretion along subduction zones. On a global scale, regions with incoming sediments thicker than 1 km commonly have accretionary wedges, whereas areas with thinner incoming sediments are generally non-accretionary and may be erosional [Clift and Vannucchi, 2004]. The Mariana region has been cited as a type location for subduction erosion along a convergent margin [Hussong and Uyeda, 1981b], although this hypothesis is controversial [Karig and Ranken, 1983]. In regions without large accretionary prisms, small-scale offscraping and/or underplating of sediments may 12
26 reduce the amount of sediment and fluid delivered to the subduction factory, and erosion of the forearc in the wake of subducting seamounts may add material to the downgoing plate. Therefore an analysis of processes occurring within the trench and at the toe of the slope is essential to understand and quantify subduction inputs. Only a portion of the fluids that enter the subduction system bound in pore spaces and hydrous minerals in the subducting lithosphere will escape beneath the forearc. Some fluid will descend to depths suitable for arc magma formation, while a small amount will subduct into the deep mantle [Schmidt and Poli, 1998]. Peacock [1990] calculates that most pore fluids are expelled at depths <10-40 km, and Schmidt and Poli [1998] predict that 30-70% of subducted water is released beneath the forearc. The fluids migrating up from the subducting plate will cool and serpentinize the overriding forearc mantle [Peacock, 1990]. As evidence of these processes, serpentinite mud volcanoes erupt hydrated and comminuted mantle peridotite onto the Izu-Bonin-Mariana forearc [Fryer et al., 1985; Oakley et al., 2007] (Figure 2.1). These mud volcanoes vent slabderived fluids and represent some of the first outputs of the subduction system. The compaction and dehydration reactions that release fluid from the slab are depthcontrolled, and therefore the fluid flux through the subduction zone is governed by the geometry of the subducting plate. This geometry is poorly constrained in most forearcs because of the large depth uncertainties in the location of teleseismic earthquakes [Engdahl et al., 1998]. With few local seismometer stations, seismicity data do not resolve the depth to the subducting plate beneath the serpentinite seamounts on the IBM forearc. 13
27 In this paper we present a detailed study of the central Mariana subduction zone and previously unpublished data from the Izu-Bonin region. Using multichannel seismic (MCS) reflection and swath bathymetry data, combined with the results of previous drilling, dredging and seismic surveys, we quantify subduction inputs, describe Pacific Plate flexure and propose that the plate fails, rather than simply bends, forming a trench axis graben. We show that the incoming sedimentary section is completely subducted in some regions of the central Mariana margin, but that small, ephemeral accretionary prisms occur in others. We find shallower dips and depths of the subducting plate beneath the outer forearc than previously estimated, indicating a thinner mantle wedge beneath the serpentinite seamounts and much less release of subducted water. Unlike other margins, we are surprised to find little evidence for disturbance of the upper plate by subduction of large seamounts on the Pacific Plate. The standard view of the Mariana system comes from subduction cartoons that typify the margin at 18ºN (e.g. [Hussong and Uyeda, 1981a; Eiler, 2003]), but this view is oversimplified and does not take into account variations along the margin. Here, we present variations along-strike of the Pacific Plate with implications for subduction factory inputs and plate flexure and create a new cross-section of Pacific Plate subduction beneath the central Mariana Forearc. Our data reveal fundamental attributes of the Mariana subduction zone and enable improved comparisons with other intraoceanic margins such as Izu-Bonin and Tonga. 14
28 Geologic Setting and Previous Work Subduction began in the Izu-Bonin-Mariana convergent margin circa 50 Ma [Taylor, 1992; Cosca et al., 1998]. Pacific Plate magnetic isochrons (M21-M25; Ma) strike obliquely to the Mariana Trench (Figure 2.1) [Nakanishi et al., 1992a]. Thinly sedimented (typically less than 500 meters), Mesozoic Pacific Plate lithosphere subducts beneath the Mariana arc system [LaTraille and Hussong, 1980; Hussong and Fryer, 1981; Nakanishi et al., 1992b]. The dip of the subducted Pacific Plate increases to near-vertical beneath the active volcanoes of the Mariana arc ~220 km from the Mariana Trench [Katsumata and Sykes, 1969; Isacks and Barazangi, 1977; Chiu et al., 1991; Engdahl et al., 1998], but details of the slab geometry beneath the forearc are poorly resolved [Engdahl et al., 1998]. Ewing et al. [1968] characterized the seismic stratigraphy of the western Pacific using four units: 1. upper transparent layer, 2. upper opaque layer, 3. lower transparent layer, 4. acoustic basement. Early Deep Sea Drilling Program (DSDP) drilling legs (e.g. 6, 7, 17, and 20) showed that the upper opaque layer correlates with a layer of chert abundant in the North Pacific. Later drilling discovered a lower chert layer above, and sometimes in contact with, basement. In some regions, acoustic basement corresponds with this chert layer. Regional mapping of the stratigraphy of the Jurassic basins in the western Pacific [Abrams et al., 1992] shows that pockets of thick sediments, usually volcaniclastics, are derived locally from seamounts on the Pacific Plate. Outside of these pockets, the incoming sediments are primarily <0.5 km thick and composed of clay, chert and volcaniclastic layers [Abrams et al., 1992]. Ocean Drilling Program (ODP) Hole 801C drilled in the Pigafetta Basin at ~ N, E, sampled ~170 Ma 15
29 normal mid-ocean-ridge basalt crust formed at a fast (160 mm/yr) spreading center, comparable with the modern East Pacific Rise. Twenty meters of red radiolarites and claystones overlie basement at mbsf [Abrams et al., 1993]. The sedimentary section at Hole 801C is characterized by two chert layers (lower and upper) separated by a thick (192 m) deposit of mid-cretaceous volcaniclastic turbidites likely shed from the Magellan Seamount chain. The thinner (63 m) upper layer (upper opaque) is composed of chert-porcelainite and is overlain by 56 m of pelagic clay (upper transparent). At ODP Site 1149 (31º 20 N, 143º 21 E), along the Izu-Bonin Trench (Figure 2.1 inset), the subducting sediment section lacks the thick volcaniclastic sequence sampled to the south and includes an upper layer of ash and siliceous clay [Shipboard Scientific Party, 2000]. The Pacific Plate crust subducting into the Izu-Bonin Trench is ~132 Ma and was formed at spreading rates of 51 mm/yr [Shipboard Scientific Party, 2000]. Bending along the Izu-Bonin Trench is associated with large-offset horsts and graben that do not occur along the Mariana Trench to the south [Bodine and Watts, 1979]. West of the outer rise and north of the Ogasawara Plateau, the seafloor entering the Izu-Bonin Trench has few seamounts [Wessel, 2001]. East of the Mariana Trench, the subducting Pacific Plate is dotted with seamounts 2-3 km high [Wessel, 2001] (Figure 2.1). Subduction of bathymetric highs on the incoming plate locally uplifts the toe of the overriding plate and can cause oversteepening and erosion, resulting in the creation of a reentrant and shallowing of the trench floor [Lonsdale, 1986; Lallemand and Le Pichon, 1987; Lallemand et al., 1989; von Huene and Scholl, 1991; Lallemand et al., 1994]. The effect of seamount subduction is well documented along other margins including the Japan Trench, Tonga and Costa Rica (e.g. 16
30 [Lallemand and Le Pichon, 1987; Ballance et al., 1989; Lallemand et al., 1989; Yamazaki and Okamura, 1989; Ranero and von Huene, 2000]), and previous work states that subducting oceanic plateaus and seamounts have uplifted the Mariana Forearc, creating and re-activating faults [Fryer and Fryer, 1987; Fryer et al., 1995; Fryer et al., 2000]. Sandbox models and geophysical observations suggest that the subduction of bathymetric highs (ridges and seamounts) is responsible for an important part of tectonic erosion along the inner trench slope (e.g. [Ballance et al., 1989; Yamazaki and Okamura, 1989; Dominguez et al., 2000]). Drilling, dredging and seismic imaging reveal that the outer Mariana forearc does not have a substantial sedimentary cover or accretionary prism, but primarily exposes middle-upper Eocene igneous basement composed of arc tholeiites and boninites [Hussong and Uyeda, 1981b; Mrozowski et al., 1981; Bloomer, 1983]. The presence of igneous rocks of island arc affinity on the inner trench slope is one reason why Mariana has been classified as an erosional margin [Bloomer and Hawkins, 1983]. Serpentinite seamounts occur ~30 to 100 km west of the IBM Trench axis [Fryer and Hussong, 1981; Fryer and Fryer, 1987; Horine et al., 1990; Fryer and Mottl, 1992] and retain some blueschist minerals originating at depths >20 km [Maekawa et al., 1995; Gharib, 2006]). Active carbonate and Mg-silicate chimneys and cold-fluid seeps at the summits of many serpentinite seamounts provide samples of the chemical precipitates and fluids that result from initial slab de-volatilization [Fryer et al., 1985; Haggerty, 1987; Mottl, 1992; Mottl et al., 2003; Straub and Layne, 2003]. The chemistry of these vent fluids varies systematically with distance from the trench, implying little mixing of fluids along the subduction interface [Mottl et al., 2003; Mottl et al., 2004]. These data 17
31 support the current model for Mariana serpentinite mud volcano formation that suggests that there is serpentinized mantle directly beneath the edifice [Fryer et al., 2000]. The restriction of the serpentinite seamounts to a band of forearc ~70 km wide may be related to slab dewatering processes, controlled by temperature and depth, and the location of the forearc mantle wedge. Because serpentine minerals are stable until depths greater than the region of magma generation in cold subduction zones like IBM [Ulmer and Trommsdorff, 1995; Schmidt and Poli, 1998; Hyndman and Peacock, 2003], the primary fluids liberated from the subducted plate beneath the Mariana forearc are derived from oceanic sediments and crust, rather than serpentinized mantle. Data Acquisition and Processing We collected multi-channel seismic (MCS) data from the central Mariana arc system in February-March, 2002 aboard the R/V Maurice Ewing towing a 6-km, 480- channel streamer cable. Shots were fired every 50 meters from a tuned, 6817 inch 3 array of 20 airguns. The processing sequence applied to all lines is listed in Appendix Table 1. In areas where water depths are less than 4 km, the plate reflection is obscured by the seafloor multiple necessitating the use of multiple suppression techniques. The seismic data are presented here in two-way travel time (TWTT) with a vertical exaggeration (VE) of 3x at the sea floor, and in depth at VE=2x. Our velocity models for depth conversion in the outer forearc are based on a refraction survey across the Mariana Forearc that extends to the 6 km depth limit of the OBSs used [Takahashi et al., 2007]. This refraction line is coincident with MCS Line 53-54, which trends ESE across the northern flank of Celestial Seamount (Figure 2.2). The velocity model of 18
32 Takahashi et al. [2007] has a low velocity wedge beneath the serpentinite seamount. The velocities of the subducting plate are not represented in the OBS crustal velocity model; therefore, we did not include incoming plate velocities beneath the outer forearc in the depth conversion. Interval velocities for the incoming plate were based upon data from DSDP and ODP drill sites east of the trench (Sites 801 and 459). Our velocity model is overlain in depth on MCS Line in Figure 2.2. In addition to the standard crustal/sediment velocities shown in Figure 2.2, we used a velocity of 1505 m/s (a slight increase from the water column velocity) plus a vertical gradient of 1400 m/s/s to depth convert material at the toe of the slope and serpentinite seamounts where present. These values successfully correct for velocity pull up of the top of plate reflection near the base of the inner trench slope. The rationale for the velocities applied to the serpentinite seamounts is detailed in [Oakley et al., 2007]. MCS data from the Izu-Bonin margin collected aboard the R/V Robert Conrad in 1976 are processed through migration and presented in TWTT. Depths to the top of the subducting plate on Bonin Line 39 were determined using the refraction velocities of Kamimura et al. [2002]. The Mariana bathymetric maps used in this study contain Hydrosweep data from the EW0202/03 cruises, Simrad EM300 data from a 2003 R/V Thompson cruise, 1997 HAWAII MR-1 data, and data from a composite of regional studies conducted on ships from the Japan Agency for Marine Earth Science and Technology (JAMSTEC) (N. Seama and M. Nakanishi, private communications, 2002). The Izu-Bonin bathymetry uses multibeam data provided by the second author, A. Klaus, A. Taira and K. Fujioka 19
33 (JAMSTEC and Ocean Research Institute, University of Tokyo). The bathymetric images are illuminated from the east to highlight relief. Data Description The Incoming Pacific Plate and Mariana Trench The character of the subducting Pacific Plate and trench varies along the central Mariana margin (Figures 2.1 & 2.4) and can be divided into four regions based on the morphology and structure seen on bathymetric and seismic profiles of the incoming plate (Figure 2.3). These four regions (A-D) are well-represented by MCS Lines 22-23, 53-54, and which, in this paper, we show from the incoming Pacific Plate to the outer Mariana forearc (Figures 2.2 and ). A bathymetry profile along the axis of the Mariana Trench reveals regional variations on the incoming plate (Figure 2.4). In both regions A and C, the trench floor shallows to <6 km because there are seamounts/ridges in the trench. Region B is characterized by the subduction of low relief seafloor with a nearly constant trench axis depth of 8.5 ± 0.2 km. In Region D, the depth of the Mariana Trench increases toward the south from <8 km to >9 km. The outer trench slope of the incoming plate follows this same southward deepening trend. In Region A, (MCS Lines and 47) the incoming plate is relatively smooth with a few seamounts and no large horsts or graben (Figures 2.4 and 2.5). Although the outer flexural bulge is ~200 km east of the trench axis, bending-related faulting begins ~95 km east of the trench near the 6 km depth contour (Figure 2.4). The faults in this 20
34 region strike sub-parallel to the trench axis. Fault offsets are generally less than 200 m except for those bounding the trench axis graben. Seamounts enter the Mariana Trench in Region A near 18º and 18º30 N, locally steepening the outer trench slope. In Region B (MCS Lines through 53-54), there are both trench parallel bending faults and faults striking NNE, oblique to the trench. The trend of the oblique faults is similar to that of the Mesozoic magnetic lineations identified by Nakanishi et al. [1992a] (Figure 2.1), therefore these fractures likely represent reactivated abyssal hill seafloor fabric. Profile 6 (Figure 2.4) and Line (Figure 2.2) cross graben formed by obliquely striking faults with a larger offset (~200 m) than those to the north. Much larger offset ( m), trench-parallel faults occur proximal to the trench axis. In Region B flexural faults again begin near the 6 km contour, which varies southward from ~95 km east of the trench axis in the north to ~55 km on Line (Figures 2.2 and 2.4). MCS Line (Figure 2.6) lies within Region C which is characterized by the subduction of a fractured WNW-trending ridge and seamount chain (Figures 2.1 and 2.3). East of the delcano Guyot, the seafloor is flat with no visible offsets (Figures 2.3 and 2.4). West of the guyot, the seafloor is fractured and hummocky and, where visible, sediment and chert horizons are discontinuous (Figure 2.6). The trench shallows to nearly 5 km in this region and cusps to the west between Line and Profile 5, but drops steeply to ~8 km on either side of the ridge (Figure 2.4). In Region D, the Pacific Plate bends steeply into the trench and the incoming seamounts are deformed by normal faults in response to plate flexure (Figure 2.4). The trench curves to the SSW and the axis is roughly parallel to the oblique normal faults 21
35 visible to the north. Fault offsets along Line range from ~ m (Figure 2.7). The trench floor, at > 9 km, is the deepest in the study area (Figure 2.4). The Incoming Pacific Plate and Izu-Bonin Trench Bathymetric profiles across the Izu-Bonin Trench highlight differences between the subducting Pacific Plate in central Mariana and further north along the IBM margin (Figure 2.8). The incoming plate has few seamounts and is characterized by much larger offset normal faults (~500 m) and a more pronounced horst and graben morphology. As in the Mariana region, bending related faults begin ~100 km from the trench, near the 6 km depth contour; in contrast, however, nearly all of the flexural faults along the Izu- Bonin Trench are sub-parallel to the axis. The exception is the NNW trending graben imaged in the bathymetry and crossed by MCS Line Bonin 39 (Figure 2.9). Bonin Line 39 reveals a trench floor that is deeper and wider than in central Mariana (Figure 2.9). Pacific Plate stratigraphy and crustal thickness Sediment and Pacific Plate crustal thicknesses vary along strike of the IBM margin (Figure 2.10) [Abrams et al., 1993]. In the seismic sections, a lower-amplitude, discontinuous basement reflection is sometimes visible beneath the strong lower chert horizon, enabling us to calculate sediment thickness (Figure 2.10). Pacific Plate Moho occurs on three of the six trench-perpendicular Mariana MCS lines and along MCS Line Bonin 39 (Figure 2.10). East of the Izu-Bonin Trench, an ~0.3 km thick sediment package overlays basement and a Moho reflection is imaged ~6 km below the basement horizon. This seismic line crosses ODP Hole 1149D (Figures 2.8 and 2.10). East of the 22
36 Mariana Trench, we image Moho in parts of Regions A, B and D. A strong chert layer reflection and discontinuous basement horizon are visible on Line (Region A) where the sedimentary section is ~1 km thick. Moho is visible ~ 5.3 km below oceanic basement. To the south, along Line (Region B), sediment and crustal thicknesses increase. The doubling of the sediment package is likely because of volcaniclastic sediments shed from the surrounding seamounts (Figure 2.4) including the one shown to the west (Figure 2.10). On Line (Region D), 0.5 km of sediments overlie a strong chert horizon and there is no basement reflection. Moho is located between 14 and 15 km depth. Toe of the inner trench slope Our seismic data across the toe of the inner trench slope allow us to determine to what extent accretion and/or sediment and seamount subduction occur along the central Mariana Trench. Lines (Region A) and (Region C) show deformation related to subducting seamounts. The incoming sediment and chert horizons are discontinuous and cannot be traced into the trench. There is evidence for uplift at the toe of the inner trench slope in a cross-sectional view and bowing up of the forearc in the bathymetry as the leading edge of the seamounts subducts (Figures 2.1, 2.5& 2.6). The subducting delcano guyot is faulted and degraded west of E (Figure 2.1). We interpret accretion at the toe of the inner trench slope along Line (Region B) (Figure 2.11A). The incoming sediment package above the lower chert layer is thin, ~0.25 km and discontinuous reflections below this layer may represent basement. Line has numerous low-angle, dipping reflections both at the distal toe of the slope 23
37 and in the mound at the base of the inner trench slope. The top few 10s of meters of sediment are off-scraped at the toe of the slope by a frontal thrust terminating at the upper chert layer. A dipping reflection (shown in red), interpreted to be a thrust fault, terminates at the lower chert horizon near Shot Point (SP) and separates the two packages of dipping horizons. The lower chert layer is visible west of the trench axis beneath the dipping reflections to near SP The dipping reflections on Line were not removed by migration tests and are also visible in stacked data, suggesting that these are real features and not noise introduced by migration. A package of slope sediments (yellow) covers the top of the deformed sediments at the toe, and we interpret other pockets of thin sediments to the west. Interspersed with the dipping reflections are discontinuous horizons with a near-horizontal or slightly east-dipping slope. We interpret complete sediment subduction beyond the toe of the inner trench slope along Line (Region B) (Figure 2.11A). The wide trench floor is formed by the subduction of a large graben complex and is underlain by ~0.5 km of oceanic sediment. There is negligible trench fill. The top of the sediment package and both chert layers are visible beneath the toe of the inner trench slope up to 10 km west of the trench axis. In Region D, both Lines and are characterized by highly faulted incoming sediments ~0.5 km thick and a strong, faulted lower chert layer visible beneath the toe of the slope (Figure 2.11B). Beneath the toe of the slope there are normal fault offsets in the lower chert horizon and sediment layers. On Line the incoming sediment package thickens beneath the toe of the slope and reflections are slightly folded. The lower chert layer shallows to the west through a series of stair-stepping normal 24
38 faults, reaching a high less than 9 km deep. We image both horizontal and low-angle dipping reflections at the toe of the inner trench slope; however we are unable to resolve coherent sediment packages west of the trench axis. On Line (Figure 2.11B) graben separated by SE-dipping normal faults subduct beneath the inner trench slope. Reflections parallel to the faulted chert layer and horizontal reflections are visible beneath the toe of the slope. There is no evidence for thickening of the sediment package. Sediments and both chert layers subduct past the trench, however, only the lower chert horizon can be resolved beyond 5-7 km west of the axis. Inner Trench Slope The bathymetric map and profiles on Figure 2.4 illustrate along-strike variations on the inner trench slope of the central Mariana system. In Region A the inner trench slope is steep (~8.5º), with no visible faults or significant sediment east of the trench slope break (SP 2900) (Figure 2.5). Further west on Line 22-23, high angle normal faults offset seafloor and sediments less than 0.5 km thick in a 38-km wide basin between two basement highs. In Region B, Line 16-19, which images forearc in between structural highs, is characterized by nearly flat seafloor at ~4 km depth until ~35 km west of the trench where it bends and plunges into the trench with a slope of ~6.5º (Figure 2.4). Further south in Region B, profiles 2 and show a more gradual descent along the inner trench slope (~5.3º). On Line a 0.8 km thick sediment package is visible beneath and to the west of the flank of Celestial Serpentinite Seamount (Figure 2.2). These sediments are overthrust by a mound buttressing Celestial Seamount to the east 25
39 that is likely to be another serpentinite seamount [Oakley et al., 2007]. Basement exposure begins near SP 5850 and continues down the inner trench slope (Figure 2.2). On Line (Region C), which crosses Celestial Ridge (the bathymetric high upon which Celestial Seamount is built), we see a thin (<400m) section of forearc sediments that pinches out near SP 2900, exposing basement on the trench slope break (SP 2600) and down the narrow (20 km) inner trench slope (Figure 2.6). Forearc morphology and profiles across it are distinctly different south of ~15ºN in Region D. A good example is Line (Figure 2.7) which has no trench slope break but instead slopes gradually from the forearc basin to a lower slope terrace (outlined by a dashed line on Figure 2.4). This region lacks the large forearc highs present in the north. There is a thin, <0.3 km, veneer of sediments draping the outer forearc. Seismic and bathymetric profiles along the inner trench slope in Region D closely resemble profiles across the Izu-Bonin forearc (Figures 2.8 and 2.9). The Izu-Bonin region has a well-defined lower slope terrace with serpentinite seamounts. Line s profile is similar to that of Bonin Profile 1 which crosses Torishima Serpentinite Seamount, and the section along Line closely resembles Bonin Profile 2, whereas Bonin Line 39 crosses the lower slope terrace between two serpentinite seamounts (Figure 2.9). The lower slope terrace along both margins has little sediment cover. Aside from the small high-angle normal faults offsetting sediments in a slope basin on Line 83-84, there are no visible faults that would account for the subsidence or marked deepening in these regions of the outer IBM forearc. 26
40 Outer Mariana forearc and depths to the subducting plate Several serpentinite seamounts located between 14º-18.5º N lie in a narrow swath of forearc km from the trench axis (Figure 2.1). We created a bathymetric profile parallel to the trench axis and east of the line of serpentinite seamounts (shown in crimson on Figure 2.4) to illustrate potential influences on the morphology of the forearc from the subducting plate. The southward deepening trend along the trench axis in Region D is roughly mirrored by the overriding forearc. In Regions A and C, shallow trench morphology corresponds with highs on the outer forearc; however, not all of the bathymetric highs visible on the forearc profile appear to correlate with highs on the incoming plate such as the large (>2 km tall) feature at 17º 20 N in Region B. The origin of this structure is unknown and it was not transected by our survey. Beneath the outer Mariana forearc there is a prominent, low-frequency reflection from the top of the subducting plate, visible on 17 seismic profiles (Figure 2.1). A similar reflection is also imaged on Bonin Line 39 (Figure 2.9). On the MCS lines shown, hollow circles represent depths to the top of the plate. In addition to the subducted plate, on Line 83-84, at ~ 13 seconds TWTT, there is a prominent, discontinuous reflection that may represent subducted Pacific Plate Moho (Figure 2.9). On several seismic lines the top of the subducting plate is visible below the flanks of serpentinite seamounts on the outer forearc, although it is not imaged directly beneath the edifices (Figure 2.3). We use our interpretations of depths to the top of the subducted plate across the entire central Mariana forearc and depths to the lower chert layer on the Pacific Plate east of the trench to map subducting plate morphology on both sides of the trench (Figures 27
41 2.12 and 2.13). We plot depths across the Izu-Bonin Trench along with existing data from the Tonga Trench for comparison (Figure 2.12A). The subducted plate along the Izu-Bonin margin and the northern Tonga margin dips 10-11º beneath the forearc. The top of oceanic crust on Tonga Line is shallower and steeper (12º) beneath the forearc than the other two lines. Unlike central Mariana, both Izu-Bonin and Tonga are characterized by the subduction of large offset horsts and graben. Along-strike the central Mariana margin there are variations in the profile of the subducting Pacific Plate (Figure 2.12B). In Region A, the relatively smooth incoming plate bends gently into the trench axis and a seamount locally increases the dip of the outer trench slope. The plate reaches ~20 km depth beneath Big Blue Serpentinite Seamount. Seismic Line crosses from Region B into Region C (Figure 2.3). The morphology of the incoming plate is typical of Region B; however, plate depths beneath the outer forearc plot within Region C. Overall the plate is shallower in Region C likely because of the subducting delcano ridge (Figures 2.3 and 2.6). Deformation caused by a subducting bathymetric high is consistent with the shallower trench floor (Figure 2.4) and the westward deflection of the trench axis seen in Region C (Figure 2.3). In Region D, the outer trench slope on Lines and is steepened as the western flank of the Victoria Guyot approaches the trench axis (Figure 2.3). The subducted plate on Line is slightly steeper and 1-2 km deeper than on Line (Figure 2.12B). The seafloor is deepest in this region of the outer Mariana forearc, providing the best and most extensive images of the subducted plate un-obscured by the seafloor multiple (Figures 2.7 and 2.9). On Line 79-80, the subducted plate penetrates 22 km depth within a distance of 70 km from the trench, illustrating that the plate, along with the trench, is also deepest in 28
42 Region D. Across the central Mariana margin, the subducting plate dips 9-12º beneath the serpentinite mud volcanoes. Depth to the plate beneath the base of the serpentinite seamounts decreases from ~17 km (Big Blue) to 7 km (SS) with shallowest depths closest to the trench (Figure 2.12B). The regional variations in morphology of the Pacific Plate subducting beneath the central Mariana Forearc are well illustrated in 3D (Figure 2.13). The subducted plate is not a simple curvi-planar surface. Although the dip of the plate beneath the outer forearc is relatively constant across the 4 regions (9-12 ) (Figure 2.12B), there are isolated highs and regional undulations. The plate is shallowest in Region C, west of the delcano Guyot, and deepest in Region D beneath the lower slope terrace. Discussion Flexure of the incoming Pacific Plate and its failure at the Mariana Trench graben The Pacific Plate with its superposed seamounts is offset by plate flexure normal faults (Figures 2.4, 2.8 and 2.13). Normal faults begin near the 6 km depth contour at ~55 km and ~95 km east of the trench on Lines and respectively (Figures 2.2 and 2.4). Where the Pacific Plate fabric strikes more than 25 from trench-parallel (e.g., north of ~17 40'N), new faults are formed during bending, whereas abyssal hill faults are preferentially reactivated when this angle is less than 25 (Figures 2.1 and 2.4), as is seen globally [Billen et al., 2007]. In Region B we observe both reactivated abyssal hill fabric and new trench parallel faults as a function of the changing azimuths of the trench axis and plate fabric (Figures 2.1, 2.3, 2.4 and 2.13). 29
43 Bending related faults begin ~100 km east of the trench on Bonin Line 39, again near the 6 km contour (Figure 2.8). In contrast to the Mariana system, nearly all of the flexural faults along the Izu-Bonin Trench are sub-parallel to the axis, consistent with the observation that magnetic anomaly lineations strike sub-perpendicular to the trench [Nakanishi et al., 1992a] and therefore abyssal hill fabrics are not reactivated. A large relief NNW trending graben south of 31º 25 N is an exception to this and is likely a reactivated fracture zone (Figure 2.8). Flexural fault offsets along the Izu-Bonin margin are commonly ~500 meters, similar to large-offset horsts and graben in other margins like Middle America and Tonga [Bodine and Watts, 1979; Lonsdale, 1986; Ranero et al., 2003], whereas, in the Mariana system, outside of the trench graben, maximum offsets are rarely 300 meters (compare Figures 2.4 and 2.8). Large normal fault offsets ( m) of the subducting plate in the Mariana system occur typically within ± 10 km (maximum 15 km) of the trench axis (Figures 2.1, 2.4, and 2.11). The Mariana Trench axis is commonly a graben (Figures 2.2, 2.4 and 2.11). There is an abrupt change in Pacific Plate dip from <4º (mostly 2º) at ~10 km east of the trench axis to >8º by 10 km to the west (Figure 2.12B). This significant change of dip in such a short distance relative to the plate flexural wavelength suggests that the plate fails rather than simply bends under the applied loads. We infer that the trench graben is the surficial structural expression of plate rupture which has been proposed to occur in response to the pull of the downgoing slab (e.g. [Kanamori, 1971; Abe, 1972; Kanamori, 1986; Ammon et al., 2008]. We are unable to image the normal 30
44 faults to depth and we do not have any direct evidence of the corresponding mid-lower plate failure mechanism. The Izu-Bonin Trench axis is also a graben (Figures 2.8 and 2.9), however, the abrupt change in plate dip occurs ~20 km east of the trench axis (Figure 2.12A). This is also true along the Tonga Trench. Large offset horsts and graben occur along the outer trench slope in Tonga and Izu-Bonin but are not restricted to within 10 km of the trench axis as we observe in Mariana (Figure 2.12). For all three intra-oceanic margins the change in the dip of the incoming plate corresponds to the formation of large offset graben. We propose that for these margins the sharp change in plate dip corresponds to the creation of large offset normal faults where the plate fails rather than flexes (e.g. [Kanamori, 1971; Abe, 1972]). Seismic reflection data from New Zealand along the Hikurangi Subduction Zone show a kink in the subducting Pacific Plate at ~120 km from the trench axis [Henrys et al., 2006]. The change in dip of the plate (from 3 to >15 ) coincides with the onset of intraplate seismicity. Earthquakes near the plate interface have low-angle thrusting mechanisms, whereas focal mechanisms show normal faulting events within the crust of the subducting plate. Henrys et al. [2006] propose that the sharp change in dip of the subducting plate is caused by simple shear on reactivated steeply dipping normal faults akin to the down-stepping motion of an escalator. Pacific Plate subduction along the Japan Trench is also characterized by a sharp change in plate dip [Ito et al., 2004; Ito et al., 2005; Fujie et al., 2006]. This increase in dip (from 5-13 ) occurs approximately km landward of the trench axis [Fujie et 31
45 al., 2006] and corresponds with the updip limit of rupture zones of large earthquakes [Ito et al., 2005]. The kinks in plate dip (Hikurangi, Tonga, IBM, and Japan), and the few great (>M8) normal faulting earthquakes at subduction zones (Sanriku, 1933; Sumba, 1977; Kuril, 2007) occur seaward of the updip limit of rupture zones of large earthquakes or in regions of weak seismic coupling, where and/or when slab pull forces can operate unimpeded by interplate frictional coupling on the subducting plate (c.f. [Ammon et al., 2008]). Inputs to the Mariana Subduction Factory In order to correctly quantify the inputs delivered to the Mariana subduction factory, we need to understand the processes (subduction, accretion, erosion, and underplating) that affect the toe of the system. Our interpretation of Lines and suggests complete subduction of the entire ~0.5 km thick sedimentary section (Figures 2.11A, B). There is no current offscraping at the toe of the slope. The trench floor is deep (>8 km) and wide and contains little to no ponded sediment. The toe of the slope on Lines and show evidence for sediment accretion in Regions B and D (Figures 2.11A, B). On Line sediments within a graben beneath the distal toe of the slope are folded and thickened, indicating horizontal compression. The presence of low-angle, arcward-dipping reflections suggests that some material above the lower chert layer may be incorporated into thrusts and accreted. On Line 16-19, the top m of sediment is off-scraped at the distal edge forming a small accretionary wedge. The upper chert layer subducts beneath the outer toe, but may 32
46 become underplated further toward the arc where a larger fault offsets sediments down to the lower chert horizon (Figure 2.11A). Arcward-dipping reflections between SP , suggest that thrusting occurs west of the toe of the slope. DSDP Site 461 was drilled 20.5 m into a small ridge at the base of the inner trench slope on Line (Figures 2.1 and 2.11A). DSDP Leg 60 scientists inferred, based on the island-arc affinities of the materials recovered, that the ridge is part of a large slump extending into the trench [Hussong and Uyeda, 1981b]. The discovery of calcareous sediments at Site 460 (also along the inner trench slope below the modern CCD) (Figure 2.1), led them to propose that significant subsidence has occurred on the outer Mariana Forearc, implying erosion of the margin [Hussong and Uyeda, 1981b]. We conclude however, based on the current evidence for accretion at the toe and the lowangle dipping reflections within the ridge on Line 16-19, that it is primarily an accretionary structure made up of thrust packages of accreted sediments. Thin slope sediments are present in isolated packages along the inner trench slope and on top of the accretionary wedge. It is likely that Leg 60 drilling only penetrated these sediments, which would be mostly material derived from exposures on the upper part of the inner trench slope and transported downslope. Near-horizontal to E-dipping reflections imaged within the wedge may be created by slope sediments or slump packages of slope sediments (Figure 2.11A). Our interpretation does not support subsidence and erosion in Region B. Although the interpretation of accretion of sediments less than 1 km thick along Line 16-19, and possibly along 83-84, appears inconsistent with the global trend seen by von Huene and Scholl [1991] and Clift and Vannucchi [2004], this may be a question of 33
47 scale. Small-scale accretion at the toe of the inner trench slope does not classify the central Mariana margin as accretionary. Subduction in the Mariana system began 50 million years ago [Taylor, 1992; Cosca et al., 1998]. If the entire sedimentary section above the lower chert layer (~ km thick) was consistently accreted over this time we would expect to see a much larger accretionary prism along the Mariana Trench. For example we can calculate the potential size of an accretionary wedge along the central Mariana subduction zone using the method described by von Huene and Scholl [1991]. Assuming an average subduction rate of 45 km/ma over the last 50 Ma, and complete accretion of a 0.25 km thick sediment package with an average initial porosity of 40%, the accretionary prism would cover km 2 /km of trench. The size of the small prism along Line is less than 20 km 2, suggesting that this is not a long-lived or constantly accreting feature. The only evidence for accretion in the Mariana subduction zone is at the toe of the inner trench slope and these small accretionary prisms are likely to be ephemeral features. We found no evidence for thrusting further upslope. We interpret the horizon representing the lower chert layer to be subducting beneath the toe of the forearc throughout the study area. This layer is not offset by thrust faults, therefore we assume that it, along with any sediment (volcaniclastics/claystones) between chert and igneous basement, are subducting along all four regions of the central Mariana Trench. Our data do not image sediments farther than ~10 west of the trench, therefore it is possible that sediments subducting beyond the toe of the slope may become underplated beneath the forearc. However, the sediment section entering the Mariana Trench is thin and geochemical data from the active arc argue against underplating. Both subducted sedimentary and oceanic crustal components are identifiable in erupted 34
48 Mariana arc basalts, and the basalts follow the global trend in Ba sediment input vs. Ba arc output [Elliott et al., 1997], suggesting that at least some Pacific Plate sediments reach the zone of magma generation. Our interpretations show that, with the exception of small-scale accretion at the toe of Line 16-19, the entire incoming sedimentary section is being subducted beyond the forearc region. These interpretations and comparison with the drilling results from IODP Hole 801C in the Western Pacific allow us to quantify the inputs to the Mariana subduction system (Figure 2.10). The thickness of the incoming sediment section on the Pacific Plate between 14 and 19 N ranges from 0.5 to 2 km. Oceanic crust in Region B is 6.8 km thick, compared with 5.3 km near 18ºN in Region A and 6 km in the Izu-Bonin region. If the lower chert layer on Line (Figure 2.10) is in contact with or representative of the top of oceanic crust, then crustal thicknesses in Region D are also ~7 km. The thickened crust may be related to the numerous, large seamounts in these regions (Figure 2.1). Igneous intrusions can locally thicken the crust and/or large seamounts may depress Moho. Along Line 53-54, in Region B, the complete sediment section (likely similar to that described above for Hole 801C), along with ~7 km of oceanic crust are being subducted. The average water content and porosity, calculated from measurements of wet and dry weights and dry volume, of the sedimentary section drilled at Site 801 are 22% and 40% respectively [Shipboard Scientific Party, 1990]. Based on these numbers and assuming complete compaction by 15 km depth, 1m 2 of 500 m thick subducted Pacific Plate sediment will lose g of water. Schmidt and Poli [1998] suggest that a vertical, 1m 2 section of 7 km-thick oceanic crust releases 8 ± 2 x 10 6 g H2O/ km depth 35
49 from km. In addition, fault planes formed by plate flexure may create pathways for fluid to enter the subducting oceanic crust; however, this amount is difficult to quantify [Ranero and Sallares, 2004]. The top of the subducted Pacific Plate is ~20-22 km deep near the majority of the larger serpentinite seamounts (e.g. Big Blue, Turquoise and Peacock). The amount of water released by pore space compaction of incoming sediments is insignificant compared to the amount of water contained in the subducting altered igneous oceanic crust. However, if the oceanic crustal section does not begin to dewater until depths greater than 20 km [Schmidt and Poli, 1998], then the incoming sediment section controls fluid release beneath the outer forearc (Figure 2.12B). Therefore, complete accretion of the sedimentary section above the lower chert layer, as seen along Line 16-19, will result in a local decrease in the amount of water released beneath the serpentinite seamounts. Although the subducted Pacific Plate is nearly vertical beneath the Mariana Arc, its dip is shallow more than 80 km west of the trench, which has a large effect on estimates of the amount of water released beneath the outer forearc and the amount of mantle wedge that is hydrated. In their recent publication, Savov et al. [2007] use a subduction angle of 20º, extrapolated from earthquake seismicity [Stern et al., 2003], to calculate the volume of mantle beneath the Mariana Forearc. Our results show that the dip of the subducting plate does not exceed 12º more than 80 km west of the Mariana and Izu-Bonin Trenches (Figure 2.12). The velocity models used to depth convert our MCS data were based on seismic refraction studies across the Mariana and Izu-Bonin Forearcs [LaTraille and Hussong, 1980; Kamimura et al., 2002; Takahashi et al., 2007]. The Takahashi model is coincident with Line which allowed us to relate layer 36
50 thicknesses and velocity gradients in the model directly to the seismic data (Figure 2.2). Our estimates of subducting plate geometry determined from these depth sections are more accurate than previously published values based solely on earthquake data. Savov et al s [2007] use of a plate dip 8º greater than our calculations results in a significant overestimate of the thickness of the mantle wedge between the plate and the forearc crust and the amount of water released beneath the serpentinite seamounts. Subducting Pacific Plate seamounts and the inner trench slope New data from the Mariana subduction zone provide an excellent example of active seamount subduction (Figures 2.5, 2.6 and 2.13). The seamounts near Lines (Region A) and (Region C) are in a similar stage of subduction to the Daiichi- Kashima Seamount in the Japan Trench [Lallemand et al., 1989]. The toe of the inner trench slope is uplifted as the flank of a seamount begins to subduct (see Figure 2.10b in [Yamazaki and Okamura, 1989]). Forearc material is translated arcward and upward, resulting in the westward migration of the trench axis in map view (Figure 2.13). When the seamount has subducted completely, the oversteepened inner trench slope will slump and deform until it reaches a stable condition [Lallemand and Le Pichon, 1987; von Huene and Culotta, 1989]. Slumped sediments from the upper slope that reach the trench may be reaccreted to the margin, or subducted, effectively removing material from the overriding plate. The trench floor is shallowest in Region C, possibly because of slumped material from the oversteepened inner trench slope, as well as the presence of deformed incoming seamounts. 37
51 The inner trench slope along the central Mariana system is primarily composed of forearc basement with little sediment cover except in isolated pockets. We did not image any large faults. According to Bloomer and Hawkins [1983], serpentinized ultramafic rocks are an important component of the inner slope as they occurred in 10 of 19 dredges ranging from the bottom of the trench up to the trench-slope break. Dredges reveal ~40% serpentinized ultramafic rocks from the inner slope in Regions A and B between Lines (SP ) and (SP ) and in Region D near 16º 45 N [Bloomer and Hawkins, 1983] (Figure 2.1). These may be derived from serpentinite mud volcanoes upslope in these areas (e.g. Big Blue, Peacock, Blue Moon). Alternatively, there may be some mantle outcrops along the inner trench slope. Sedimentation on the outer Mariana forearc is sparse and therefore we have no seismic resolution to answer the question of underplating vs. erosion along the inner trench slope. However, stratigraphic relationships in the inner forearc basin indicate that the forearc in Region D is currently subsiding and tilting toward the trench [Chapp et al., 2005; Chapp et al., Submitted]. This subsidence is relatively recent as evidenced by the onlap of Quaternary sediments onto older, trenchward-tilting, forearc basin sediments. The presence of subsidence in the southern forearc suggests that there is no significant underplating taking place beneath the outer forearc. The forearc subsidence and trenchward tilting of Region D could result from the removal of material from the underside of the forearc or the deepening of the subducting plate due to a change in dip. The presence of the lower slope terrace on the Izu-Bonin Forearc and Region D of the Mariana Forearc is not well understood. There are no obvious faults on Lines Bonin 39, or that would account for the creation of the lower slope terrace, 38
52 although a distinct break in slope is visible on the bathymetry (Figures 2.4 and 2.8). Our data show that the subducting Pacific Plate is ~2 km deeper in Region D than in Region A, and plate depths beneath the Izu-Bonin Forearc are ~ km deeper than in Mariana (Figure 2.12). In Region D and along the Izu-Bonin margin, the incoming Pacific Plate is deeper, the outer trench slope is steeper and the abyssal hill fabric is parallel to the trench, creating larger offset flexural faults (Figures 2.4, 2.8, 2.13 and 2.14). The creation of the lower slope terrace and the deepening of the forearc may be related to the geometry of the plate, specifically its increase in depth on both sides of the trench. The 2 km deepening of the subducted plate in Region D would allow for the subsidence seen in the southern Mariana forearc basin; however the plate on Line is a kilometer deeper than on without a corresponding change in forearc bathymetry suggesting that local variations in subducted plate geometry alone may not account for the formation of the entire lower slope terrace and the subsidence. In Region D, serpentinite velocities (1505 m/s plus a vertical gradient of 1400 m/s/s) were used to depth convert the wedge above the subducting plate reflection, including the possible serpentinite seamount, on Lines and These velocities successfully corrected for velocity pull-up along the plate reflection, suggesting that much of the lower slope terrace may be composed of serpentinite material. Previous work inferred that the Mariana forearc has responded to the collision of oceanic plateaus and seamounts with vertical tectonism [Fryer and Fryer, 1987; Fryer et al., 1995], and highs along the trench floor correspond well to highs on the outer forearc in both Regions A and C (Figure 2.4). However, although there are numerous normal faults on the forearc, there is no direct correlation between subducting seamounts and 39
53 ridges and forearc deformation. In fact, in regions like the Celestial Ridge where we might expect to see large faults bounding blocks on the forearc above a subducting ridge, no faults are visible (Figures 2.1 and 2.3). The subducted Pacific Plate is shallowest in Region C beneath Celestial Ridge (Figures 2.12 and 2.13). However, there is no apparent onlap or other evidence in the sediments for recent tilting; therefore it is unclear whether or not there is a link between the subducting seamount chain and this outer forearc high. The lack of evidence for disturbance of the upper plate in response to the subduction of seamounts is surprising. The incoming Pacific Plate includes numerous 2-3 km high seamounts and it is reasonable to infer that the Mariana system has been and will continue to be affected by the subduction of these features (Figures 2.1 and 2.13). Despite this, we do not see direct bathymetric evidence in the forearc (west of the toe of the slope) of the subduction of seamounts. In other regions of the world, subducting seamounts uplift the forearc and leave large reentrants and grooves in their wake as they plow through the inner trench slope disturbing and removing material (i.e. Nankai Trough, Japan Trench, Costa Rica and Tonga [Ballance et al., 1989; Yamazaki and Okamura, 1989; Dominguez et al., 1998; Ranero and von Huene, 2000]. Lallemand and Le Pichon [1987] show that along the Japan Trench, the subduction of a 1.5 km high seamount caused 1 km of uplift and a 7-km reentrant. Although seamounts of this size are currently subducting in Region A, DSDP Leg 60 scientists found no evidence for kilometric uplift or subsidence at Site 458, south-west of Big Blue Serpentinite Seamount (Figure 2.1), suggesting long-term stability in this area of the Mariana Forearc [Hussong and Uyeda, 1981b]. 40
54 The Mariana Forearc is home to the only known active serpentinite mud volcanoes in the world [Fryer and Hussong, 1981; Taylor and Smoot, 1984; Fryer and Fryer, 1987; Horine et al., 1990; Fryer and Mottl, 1992] and the Mariana margin lacks great earthquakes (M>8) common in other subduction zones [Forsyth and Uyeda, 1975; Ricard et al., 1988; Huang and Okal, 1998; Hyndman and Peacock, 2003], suggesting that the presence of a serpentinized outer forearc changes friction properties at the plate boundary. Hyndman and Peacock [2003] propose that serpentinite present at the base of the mantle wedge in the forearc may decrease the coupling between the subducting plate and mantle wedge. The apparent lack of significant deformation of the Mariana Forearc crust by the subduction of large Pacific Plate seamounts may also be the result of a weak serpentinized mantle wedge. In addition, seamounts on the incoming plate are sequentially fractured with increasing offsets as they near the trench axis graben (Figures 2.5, 2.6, 2.7 and 2.13). The dip of the subducted plate increases by a minimum of 7º within each region of the central Mariana margin as it passes through the trench (Figure 2.12). This abrupt change in plate dip near the trench axis, along with the degradation of the subducting seamounts, may explain why we do not see significant deformation along the inner trench slope. Serpentinite seamounts, forearc mantle and the subducting plate Serpentinite mud volcanoes form by the eruption of hydrated forearc mantle. The degree of serpentinization of the forearc mantle wedge is directly related to the amount of water that chemically interacts with mantle peridotite. Forearc mantle lies ~9 km below Celestial Serpentinite Seamount, 64 km from the trench axis [Takahashi et al., 2007]. 41
55 This region of the forearc lies at the trench-ward edge of the refraction study and at the edge of good resolution. The Moho inferred from the refraction data is not visible on coincident MCS reflection data. If we run a trend line through Moho depths along the Takahashi et al. (2007) refraction line toward the trench, it intersects with the subducting plate ~20-30 km west of the trench at ~11 km depth (Figures 2.12B and 2.14). The majority of serpentinite seamounts on the Mariana Forearc are located ~50-70 km west of the trench where there is ~3-7 km of mantle above the subducting plate and below 8-10 km thick forearc crust (Figure 2.12B). The deep lower slope terrace in Region D may be home to the most trenchproximal serpentinite seamount in the Mariana system, analogous to serpentinite seamounts on the Izu-Bonin forearc [Horine et al., 1990] (Figures 2.8 and 2.12A). The mound imaged on Line and in the bathymetry is located approximately 30 km west of the Mariana Trench, near the plate-mantle intersection (Figure 2.12B). With no samples, nor further constraints on the velocity/density structure, and limited seismic coverage, we can not be certain that this feature is a serpentinite seamount; however, the presence of serpentinite material in dredges to the north suggests that this is not an unreasonable hypothesis. Summary Based on new MCS and bathymetry data, we created a cross-section showing the important features of Pacific Plate subduction beneath the central Mariana Forearc (Figure 2.14). Our data elucidate important attributes and along-strike variations of the Izu-Bonin-Mariana subduction zone. Oceanic crustal thicknesses along the incoming 42
56 Pacific Plate are 6 km east of the Izu-Bonin Trench (near ODP Site 1149D) and range from km along the central Mariana margin (14º-19º N). The Pacific oceanic crust is thinly sedimented ( km) except near seamounts where presumed volcaniclastic sediments increase total thicknesses to 2 km. We observed a seismic reflection near the top of the incoming plate that we correlate with the lower chert layer described in DSDP and ODP drilling results (e.g. Legs 60, 129, and 185). MCS and swath bathymetry data show that flexure of the incoming plate forms normal faults beginning up to 100 km east of the IBM trench axis. Normal faults that trend obliquely to the Mariana Trench are formed by the reactivation of inherited tectonic fabric striking <25 to the trench. New, trench parallel bending faults are created where the tectonic fabric strikes >25º. Flexural faults along the Izu-Bonin margin are primarily trench-parallel. Bathymetry and MCS profiles show that the incoming plate east of the trench axis is deformed by larger offset horsts and graben in the Izu-Bonin and Tonga subduction zones than in Mariana. The largest fault offsets along the central Mariana margin ( km) occur along the trench axis, which is commonly a graben. In Mariana a significant change in the dip of the incoming plate from <4º (commonly 2º) to >8º occurs within ~10 km of the trench axis. Along the Izu-Bonin and Tonga margins, a similar increase in subducting plate angle occurs ~20 km east of the trench. In all three regions of weak interplate seismic coupling, the abrupt change in dip of the incoming Pacific Plate corresponds to the formation of large offset graben that likely indicate that the plate has failed rather than simply bent. Similar plate kinks beneath the Japan and Hikurangi forearcs occur seaward of the updip limit of the rupure zones of large earthquakes. The Mariana Trench graben 43
57 and all the plate kinks are likely the result of slab pull stresses breaking the subducting plate. In the central Mariana system, seamounts on the subducting Pacific Plate enter the trench axis at 16ºN and 18ºN and result in the uplift of the toe of the forearc and shallowing and westward migration of the trench axis. There is evidence from the toe of the inner trench slope for both subduction and small-scale accretion of Pacific Plate sediments along the Mariana Trench. In all regions of the central Mariana margin the lower chert layer and any sediment between chert and basement subduct beyond the outer forearc. Small accretionary complexes at the toe of the slope are likely to be ephemeral features. We agree with previous work that there has been no long-term sediment accretion in the central Mariana system. The Mariana inner trench slope primarily exposes igneous basement and is covered by discontinuous pockets of thin slope sediments. No large faults were imaged. Unlike other margins subducting large bathymetric highs, west of the toe of the slope we see no direct evidence for disturbance of the upper plate by seamount subduction. This is a surprising conclusion considering the number and size of seamounts visible on the incoming plate and in the trench axis. The apparent lack of significant deformation of the outer Mariana Forearc in response to seamount subduction may be the result of a weak serpentinized mantle wedge and/or progressive fracturing and degradation of the incoming seamounts as the subducting plate breaks and increases in dip as it passes through the trench graben. There is no evidence for significant underplating of sediments beneath the outer Mariana forearc. Subsidence in the southern forearc may reflect basal erosion or an increased depth/dip of the subducted plate. Depths to the top of the subducting plate are 44
58 deepest along Bonin Line 39 and in Region D of the Mariana Forearc. The formation of the lower slope terrace in these regions may be related to the increased depth of the subducting plate on both sides of the trench. We identified a possible serpentinite seamount on the lower slope terrace in Region D. This seamount, located only 30 km west of the Mariana Trench, may be analogous to serpentinite seamounts on the outer Izu-Bonin Forearc. The MCS data show that the subducting plate dips 9-12 degrees beneath the serpentinite seamounts on the Mariana and Izu-Bonin Forearcs. In Mariana, the majority of the serpentinite seamounts are located ~50-70 km west of the trench and overlie 8-10 km of forearc crust and a thin (3-7 km) mantle wedge. 45
59 Appendix: Methods The MCS processing sequence applied to all lines is listed in Table 2:1. Table 2:1: 2D Processing Sequence (using ProMAX) Resample to 4 ms Edit Bad Traces Geometry Sort to Common Mid-Point Gathers (CMP) at 6.25 m Bandpass Filter ( Hz) Velocity Analysis Normal Moveout correction Top Mute Bottom Mute Pre-stack Deconvolution (to remove air-gun bubble pulse) Radon Velocity Filter CMP ensemble stack Windowed F-K filter below multiple Bottom mute just above multiple Stolt F-K time migration Automatic Gain Control Time-varying Bandpass filter Post migration depth conversion Top mute for display We interpret a strong, continuous reflection visible on all of the Mariana MCS lines over the Pacific Plate at ~ km below seafloor to be correlative with the lower chert layer identified at ODP Site 801 ( mbsf) and use this horizon to indicate the top of the subducting plate. We trace the geophysical contact between the incoming Pacific Plate and the overriding forearc arcward from the trench. Beneath the outer forearc we interpret a prominent, normal polarity, low-frequency reflection to be the top of the subducting plate. This reflection is visible on 17 MCS lines; including two from an R/V Robert Conrad seismic reflection survey in 1976 (Figure 2.1). On the final depth converted sections, we picked depths of points along the reflection at the top of the 46
60 subducting plate (plate-depth picks) beneath the Mariana forearc with an estimated vertical measurement uncertainty of 1 km (Figure 2.3). Based on our confidence in the plate-depth picks we classified them as A or B. A-picks were reproduced during iterative interpretations by at least two of the authors. B-picks represent areas along the plate reflection where interpretations differed between authors, imaging was low quality, and/or no cross-lines were available for comparison. In Figure 2.12 A-picks are plotted by MCS line number and B-picks from all lines are grouped. 3D images of the subducted plate surface and contours were created in ArcGIS using a Cokriging method which incorporated satellite gravity data and plate-depths picks (Figure 2.13). The gravity data were used to constrain variability between the picks and improve the interpolation of the plate surface. We present bathymetry along existing MCS tracks (labeled by line number) as well as artificially generated profiles (Figures 2.4 and 2.8). These profiles are parallel to the track lines and display bathymetry where we have no MCS coverage. 47
61 Figure 2:1: Regional location map. PSP= Philippine Sea Plate, PP= Pacific Plate, IBM=Izu-Bonin-Mariana Trenches, MT= Mariana Trough, WMR= West Mariana Ridge, PVB= Parece Vela Basin, PKR= Palau-Kushu Ridge, WPB= West Philippine Basin. Bathymetry of the central Mariana arc-trench system from combined surveys, sunlit from the east, showing EW0202 seismic lines. Interpreted lines are shown in red. Pacific Plate magnetic lineations from [Nakanishi et al., 1992a] are drawn in white. 48

62 49
63 Figure 2:2: Time and depth sections of MCS Line Location on Figure 2.1. TWTT= Two way travel time. M= seafloor multiple. A black arrow marks the beginning of bending-related faulting on the incoming Pacific Plate. Hollow circles on the incoming plate indicate Pacific Plate Moho. The prominent, low frequency reflection beneath the outer forearc is interpreted to be the top of the subducting plate (indicated by hollow arrows on the time section). Circles locate the points along the plate reflection where depths were recorded (visible in map view on Figure 2.3). Dashed circles represent B-picks. This profile is representative of the Pacific Plate entering the Mariana Trench in Region B. Boxes A and B refer to the areas enlarged in Figures 2.10 and 2.11A. 1. Velocity model overlain in depth on Line based on the refraction line from Takahashi et al, 2007 and Pacific Plate drill sites. 2. Schematic vertical columns in time showing horizons, velocities (m/s) and gradients (m/s/s) used for the depth conversions of all MCS lines. The lower slope column represents a low velocity region near the serpentinite seamounts. Where there were no seamounts present, only the Forearc and Pacific Plate velocity columns were used. 50

64 51
65 Figure 2.3: Highlighted Mariana forearc bathymetry showing the location and depths of all picks along the subducting Pacific Plate chert layer and top of plate reflection from 17 MCS reflection profiles. The serpentinite seamounts on the outer forearc and named seamounts on the Pacific Plate are labeled. 52

66 53
67 Figure 2.4: Bathymetry along MCS tracks and generated profiles across the central Mariana Trench plotted from west to east. Flexure-related faults are outlined in black. The dashed line on the bathymetric map outlines the lower slope terrace in Region D. VE~14x. Depth vs. Latitude along the Central Mariana Trench Axis (blue) and outer forearc (pink). Vertical lines represent region boundaries shown on Figure

68 55
69 Figure 2.5: Time and depth sections of MCS Line Symbols are the same as in Figure 2.2. This profile is representative of the Pacific Plate entering the Mariana Trench in Region A. Normal faults on the incoming plate and the Mariana forearc are interpreted. The toe of the forearc is uplifted as the flank of a Pacific Plate seamount subducts. TSB= trench slope break. M= seafloor multiple. Location on Figure

70 57
71 Figure 2.6: Time and depth sections of MCS Line Symbols are the same as in Figure 2.2. This profile is representative of the Pacific Plate entering the Mariana Trench in Region C. The toe of the forearc is uplifted as the flank of a Pacific Plate seamount subducts. TSB= trench slope break. M= seafloor multiple. Location on Figure

72 59
73 Figure 2.7: Time and depth sections of MCS Line Symbols are the same as in Figure 2.2. The subducting plate reflection is obscured on the lower slope terrace beneath a possible serpentinite seamount. This profile is representative of Region D. Boxes A and B refer to the areas enlarged in Figures 2.10 & 2.11B. M= seafloor multiple. Location on Figure

74 61
75 Figure 2.8: Izu-Bonin Trench bathymetry. Bathymetric profiles along MCS track Line 39 and computer generated profiles across the Izu-Bonin Trench plotted from west to east. Flexure-related faults are outlined in black. VE~14x. 62

76 63
77 Figure 2.9: Time sections (3x) across the lower slope terrace of the Izu-Bonin and Mariana forearcs. Hollow circles indicate the top of the subducting plate in time. Deeper circles on Line represent picks along possible subducted plate mantle. 64

78 65
79 Figure 2.10: Portions of seismic lines showing Pacific Plate inputs. Locations of Mariana blowups are shown on Figures 2.1, 2.2, and

80 67
81 Figure 2.11A : Depth and interpreted depth sections (2x) across the toe of the lower trench slope along Lines and in Region B of the Mariana Trench. The upper and lower chert horizons are visible on each line. Line shows thickening and accretion at the toe of the slope. There is complete sediment subduction along Line

82 69
83 Figure 2.11B. Lines and Incoming Pacific Plate sediments and both chert layers are offset by normal faults. 70

84 71
85 Figure 2.12: The incoming Pacific Plate chert layer and top of subducted plate plotted in depth vs. distance from the trench by MCS profile number. A. Izu- Bonin and Tonga Trenches. B. Central Mariana Trench by region (defined on Figure 2.3). Pacific Plate Moho is visible on Lines 79-80, 83-84, and Green triangles represent the base of the serpentinite seamounts: BB= Big Blue, Tq= Turquoise, C=Celestial, P=Peacock, BM= Blue Moon, SS= Possible Serpentinite Seamount, T=Torishima Seamount, S= Sumisu Seamount. Black lines are representative bathymetric profiles across the forearc in each region (source profile is shown in bold). Subducting plate dips are labeled. Forearc bathymetry along Line and Moho from the refraction line of Takahashi et al. (2007) are shown in Region C. Moho is extrapolated to Region B (dashed orange line). 72
86 73
87 Figure 2.13: 3D images of the subducting Pacific Plate. Black dots represent top of plate-depth picks and Pacific Plate chert layer picks. Contours and subducting plate surface were created in ArcGIS. Contour interval=1km. VE=3x. 74

88 75
89 Figure 2.14: A. Cross-section of the Mariana Subduction System along MCS Line with bathymetry (blue), Moho (green, from Takahashi et al., 2007), top of subducted Pacific Plate (red, this paper) and teleseismic earthquakes recorded within 50 km of the line (black dots, from Engdahl et al., 1998). No VE. Inset locates Figure 2.14B. B. Enlarged crosssection along MCS Line of the outer forearc and subducting plate with numerically annotated features. To illustrate the deeper morphology in Region D, dotted lines show the bathymetry and subducted plate along MCS Line
90 77
91 Chapter 3: Emplacement, Growth, and Gravitational Deformation of Serpentinite Seamounts on the Mariana Forearc This chapter was originally published in Geophysical Journal International. The full reference is: Oakley, A. J., B. Taylor, P. Fryer, G.F. Moore, A.M. Goodliffe, and J.K. Morgan (2007), Emplacement, Growth, and Gravitational Deformation of Serpentinite Seamounts on the Mariana Forearc, Geophys. J. Int., 170, It is produced herein courtesy of Blackwell Publishing, who is the sole copyright holder. Summary Serpentinite seamounts, representing some of the first material outputs of the recycling process that takes place in subduction zones, are found on the outer Mariana forearc. Multi-channel seismic (MCS) and bathymetric data collected in 2002 image the large-scale structures of five seamounts, as well as the pre-seamount basement geometry and sediment stratigraphy. We present data from three edifices that provide insights into seamount growth and internal deformation processes and allow us to support the interpretation that serpentinite mud volcanoes are formed by the episodic eruption of mudflows from a central region. The presence of thrust faulting at the base of Turquoise and Big Blue Seamounts, along with the low surface slopes (5-18º) of all the seamounts studied, lead us to infer that these edifices spread laterally and are subject to gravitational deformation as they grow. Numerical simulations using the discrete element method (DEM) were used to model their growth and the origins of features that we see in MCS sections, such as basal thrusts, inward-dipping reflections and mid-flank benches. The DEM simulations successfully reproduced many of the observed features. Simulations employing very low basal and internal friction coefficients (~0.1 and ~0.4, respectively) 78
92 provide the best match to the overall morphology and structures of the serpentinite seamounts. However the simulations do not capture all of the processes involved in seamount growth, such as withdrawal of material from a central conduit leading to summit deflation; compaction, dewatering and degassing of mud flows; mass wasting in the form of sector collapse; and growth upon a dipping substrate. A strong reflection beneath the summit of Big Blue, the largest serpentinite seamount in the Mariana Forearc, represents the floor of a summit depression that has been partially in-filled by younger muds, supporting the idea that serpentinite seamounts grow by episodic mud volcanism. Boundaries of mud flow units are visible in bathymetric data and as normal polarity, sub-horizontal reflections on seismic profiles. Big Blue Seamount displays complex nesting relationships as it merges with other seamounts to form a large, composite edifice. Flank flows of serpentinite muds on Big Blue and Celestial Seamounts downlap pre-existing forearc substrate. The interface between serpentinite seamounts and the underlying forearc sediments is represented by a reverse polarity reflection beneath Big Blue and Celestial Seamounts, suggesting that the substrate is under-compacted/over-pressured and may be a zone of fluid migration. DEM simulations suggest that this boundary represents a distinct décollement along which the seamounts slide laterally. In contrast, Turquoise Seamount grows laterally, not by stable sliding along the top of forearc sediments, but by incorporating them into large basal thrusts. 79
93 Introduction Oceanic lithosphere is recycled at subduction zones where, with increasing pressure and temperature, compaction, prograde metamorphism and partial melting release fluids into the overriding plate [Morris et al., 1990; Bebout and Scholl, 1996; Tatsumi, 2005]. Hydrous fluids liberated beneath the forearc partially serpentinize the overlying mantle peridotite [Peacock, 1990; Mottl, 1992; Schmidt and Poli, 1998; Hyndman and Peacock, 2003; Rupke et al., 2004]. Protrusions of hydrated mantle form serpentinite seamounts on the outer forearc of the Izu-Bonin-Mariana (IBM) intraoceanic subduction system [Fryer and Hussong, 1981; Taylor and Smoot, 1984; Fryer and Fryer, 1987; Horine et al., 1990; Fryer and Mottl, 1992]. Composed of serpentinite muds with entrained ultramafic and mafic clasts, the seamounts expose at the surface forearc mantle and crustal components that originated at depths greater than 20 km [Maekawa et al., 1995; Fryer et al., 2000; Gharib, 2006]. Active carbonate and Mgsilicate chimneys and cold-fluid seeps at the summits of many of the serpentinite seamounts provide samples of the chemical precipitates and fluids that result from initial slab de-volatilization and supra (above)-slab reactions [Fryer et al., 1985; Haggerty, 1987; Mottl, 1992; Mottl et al., 2003; Straub and Layne, 2003]. Serpentinite seamounts have not yet been found in other active forearcs, but they do have ancient analogs in former convergent margins such as the California Coast Ranges [Hess, 1955; Lockwood, 1971;, 1972; Fryer and Fryer, 1987; Macpherson et al., 1990; Fryer et al., 2000]. Understanding how, when and where these seamounts are emplaced is important to correctly characterize the flux of material through the subduction system. 80
94 Several researchers have proposed models for the mechanism of emplacement and growth of serpentinite seamounts. Some proposed that serpentinite seamounts are blocks of serpentinized mantle exposed by normal faulting in the forearc [LaGabrielle et al., 1992]. Others have interpreted the seamounts to be mud volcanoes, i.e., low density, buoyant mud and slab-derived fluids extruded onto the seafloor along extensional faults [Fryer, 1992b; Fryer and Mottl, 1992; Mottl, 1992; Phipps and Ballotti, 1992]. This interpretation is a refinement of the original diapir model that was based on the density contrast between serpentinized material and surrounding crust and mantle [Lockwood, 1972; Fryer and Hussong, 1981; Bloomer and Hawkins, 1983; Fryer et al., 1985; Horine et al., 1990; Haggerty, 1991; Phipps and Ballotti, 1992]. Multi-channel seismic (MCS) reflection and bathymetric data from serpentinite seamounts on the outer, central Mariana forearc image, for the first time, their structure and their sedimentary and basement substrate. We studied five serpentinite seamounts in this region, including Peacock and Blue Moon seamounts, however, for the purpose of this paper; we will only report a portion of the data for Big Blue, Celestial and Turquoise Seamounts (Figure 3.1). The internal structure of serpentinite seamounts in MCS data most often is chaotic, with few coherent reflections. We were able to clearly image basement and sediment reflections beneath the flanks of the seamounts but not directly below their center. The MCS and complementary bathymetry and side-scan sonar data reveal structures important in seamount growth and deformation and allow us to define key processes in their formation by episodic mud volcanism. We modeled the gravitational deformation of the serpentinite seamounts by constructing two-dimensional particle dynamics simulations using the discrete element method (DEM). Comparison of 81
95 these models to the seamount data helped us to recognize internal deformation processes and served as a guide in predicting the interaction between serpentinite muds and preexisting forearc sediments. Geologic Setting and Previous Work IBM Subduction and Mariana Forearc Processes The IBM region is the classic example of an intraoceanic arc trench backarc system [Karig, 1971a; 1971b]. IBM subduction began about 50 Ma [Taylor, 1992; Cosca et al., 1998]. Currently, the upper-cretaceous to lower-jurassic Pacific Plate subducts beneath the Philippine Sea Plate (Figure 3.1). The southern IBM arc is isolated from any continental influence on sedimentation or magmatism and there is no large sedimentary accretionary prism [Hussong and Uyeda, 1981b; Mrozowski et al., 1981; Bloomer, 1983]. The central Mariana forearc, from the trench axis to the island arc volcanoes, is km wide (Figures 3.1 and 3.2). South of 18 N, a line of bathymetric highs ~40 km to the east of the active volcanoes marks the location of the upper Eocene volcanic chain that, further south, is exposed on the islands from Saipan to Guam [Reagan and Meijer, 1984]. A thick wedge of volcaniclastic sediments thins eastward and laps onto middle Eocene boninitic and arc tholeiitic basement that was drilled at DSDP Sites 458 and 459.[Mrozowski et al., 1981; Cosca et al., 1998] Sediment cover on the outer forearc is thin, typically a few tens to hundreds of meters thick, and is often absent on the inner trench slope. The Mariana forearc is under tension, as indicated by the presence of numerous normal faults that offset both the forearc sediments and the middle-upper Eocene igneous 82
96 basement [Karig, 1971b; Mrozowski and Hayes, 1980; Mrozowski et al., 1981; Bloomer and Hawkins, 1983; Wessel et al., 1994; Stern and Smoot, 1998]. A radial fracture pattern is observed in parts of the forearc, formed as the opening of the Mariana backarc basin increased the radius of curvature of the arc-trench system [Wessel et al., 1994; Stern and Smoot, 1998; Martinez et al., 2000]. The origin of an orthogonal set of NEand NW-trending high-angle faults in the central forearc is less clear. Numerous serpentinite seamounts are situated on the rugged outer Mariana forearc, km from the trench axis (Figure 3.1). Fryer et al. [1995; 2000] proposed that seamount location is related to the distribution of faults in the supra-subduction zone, the area above the subducting slab, which is in turn governed by the composition and rheology of the forearc wedge. They hypothesized that the brittle outer wedge undergoes vertical tectonism in response to the subduction of Pacific Plate seamounts, creating and/or remobilizing deep-penetrating faults through which hydrated serpentinite muds can reach the seafloor. Alternatively, or in addition, an arcward decrease in the degree of serpentinization of the sub-forearc mantle may restrict serpentinite seamounts to the outer portion of the forearc [Stern and Smoot, 1998; Fryer et al., 2000]. The seamounts form as isolated edifices in the south but, for unknown reasons, they are more commonly clustered north of 18 N (Figure 3.1). Composite edifices reach heights of 2.4 km and diameters of 40 km; but typical individual seamount dimensions are 1-2 km and km, respectively. ODP Leg 125 (Sites ) drilled serpentinite seamounts Conical and Torishima as well as sedimented basement on the IBM forearc [Fryer and Pearce, 1992]. Dredging and coring have shown serpentinite seamounts to be composed of a matrix of serpentinite mud and blocks of serpentinized mafic and 83
97 ultramafic rocks [Fryer et al., 1985; Fryer et al., 1990; Horine et al., 1990; Fryer, 1992b; Fryer and Mottl, 1992; Fryer et al., 1995]. Results from ODP Leg 125 drilling on Conical Seamount, an active edifice located at ~19.5 N, reveal that the serpentinite formed by hydration of supra-subduction, depleted mantle peridotite (harzburgite) under high-pressure (5-7 kb), low-temperature (< ºC) conditions [Maekawa et al., 1992; Maekawa et al., 1993; Maekawa et al., 1995]. Phipps and Ballotti [1992] determined that serpentinite muds drilled from Conical Seamount are extremely weak, plastic solids which, when hydrated, have a density of g/cm 3, imparting significant buoyancy relative to the forearc igneous crust. Material cored from the summit depression on Celestial Seamount is dark-blue, serpentine-rich mud. The high acoustic reflectivity on sidescan images of the edifice, combined with the lack of pelagic sediment cover, suggest that the seamount is currently, or was recently active [Fryer et al., 2000]. In contrast, a core taken near the summit of Turquoise Seamount contained 1.6 meters of foraminiferal sand with some volcanic ash and 2 cm of green, oxidized serpentinite mud in the base of the core catcher [Fryer et al., 2000]. From the core contents, along with the low acoustic reflectivity of the seamount in side-scan sonar data, Fryer et al. [2000] concluded that Turquoise Seamount is inactive. Young, active edifices have high-backscatter intensities, whereas older or less active mud volcanoes have a more uniform backscatter character, presumably because of sediment cover. Cores taken at the summit of Big Blue Seamount in 2003 contained fresh serpentinite muds that had not yet been altered by seawater or topped with pelagic sediments, suggesting that the seamount is actively growing [Gharib, 2006]. 84
98 Although nearly vertical below the active Mariana volcanic arc [Katsumata and Sykes, 1969; Chiu et al., 1991; Engdahl et al., 1998; Stern et al., 2003], the Pacific Plate descends beneath the outer forearc at shallow angles of ~7-10, calculated from depth sections of our MCS lines that cross the trench [Oakley et al., 2005]. At shallow depths (<40 km), free water is released from the down-going slab by compaction processes [Peacock, 1990; Mottl, 1992; Rupke et al., 2004]. Deeper (down to 200 km) metamorphic dehydration of hydrous slab minerals takes place, producing more fluid [Mottl, 1992; Schmidt and Poli, 1998; Hyndman and Peacock, 2003; Rupke et al., 2004]. Fluids released beneath the forearc ultimately hydrate the mantle wedge (Figure 3.2). The stability of serpentine minerals formed by the hydration of mantle peridotite has been correlated with the regional temperature of the subduction zone. Hydrous minerals are stable over a broad cross-sectional area in cool forearcs (subducting old, cold lithosphere) like that of the IBM system where temperatures in the mantle wedge may be as low as ºC at km depth [Ulmer and Trommsdorff, 1995; Hyndman and Peacock, 2003]. Hyndman and Peacock [2003], as well as Fryer and Fryer [1987], proposed that early in the history of IBM subduction, sufficient water was released from subducting oceanic crust and sediments to hydrate, and possibly serpentinize the entire forearc mantle. Fryer et al. [1996; 2000], however, infer that a high degree of serpentinization is inconsistent with the fact that many ultramafic samples recovered from serpentinite seamounts on ODP Leg 125 drilling were only 10% serpentinized. These samples provide evidence that even along the conduit of mud volcanoes, the mantle of the overriding plate is not completely serpentinized. Furthermore, preliminary results from 85
99 an OBS refraction study show sub-moho velocities 140 km from the trench axis of ~7.8 km/s, high enough to argue against pervasive mantle serpentinization beneath the inner forearc [Kerr et al., 2002]. Serpentinization is likely to be fracture-controlled, with extensional fault planes serving as conduits for slab-derived fluids in the Mariana forearc [Fryer and Hussong, 1981; Bloomer and Hawkins, 1983]. If so, then the forearc mantle between individual faults may not be greatly affected by serpentinization processes. Although the entire supra-subduction zone mantle may not be uniformly hydrated [Fryer et al., 2000], we anticipate that the greatest degree of serpentinization in the forearc region is likely immediately above the slab and near fault surfaces. Giant Mud Volcanoes In the late 1980 s, following Alvin submersible investigations, scientists proposed that IBM forearc serpentinite seamounts are giant mud volcanoes [Fryer and Fryer, 1987; Haggerty, 1987; Fryer et al., 1990], analogous to those formed by the remobilization of sedimentary sequences in accretionary prisms, although different in size, lithology and geochemistry. In the giant mud volcano model [Fryer, 1992a; Fryer and Mottl, 1992; Fryer et al., 1995; Fryer, 1996; Fryer et al., 1999; Fryer et al., 2000], buoyant, hydrated serpentinite muds travel to the surface along forearc faults (Figure 3.2). Fryer et al. [2000] hypothesized that central conduits may develop at the intersection of fault planes, however, although the seamounts often lie along the trace of major scarps, neither the faults nor the conduits have been directly imaged beneath any of the seamounts in this study. Weak mud flows protrude mainly as a viscous paste flowing 86
100 over preexisting forearc crust and sediments, eventually forming a wide, low relief edifice similar in morphology to a shield volcano. Young mud flows, identified in sidescan sonar images, extend as far as 18 km from the summit area of Conical Seamount [Hussong and Fryer, 1985; Fryer et al., 1990]. The geometry of the flank flows seen in the acoustic imagery, as well as variations in backscatter intensities proportional to sediment cover, led Fryer et al. [2000] to infer that the seamounts are formed by the episodic upwelling of serpentinite mud. Side-scan sonar images also contain evidence for slope instability on the summit and flanks of the seamounts, such as concentric faults, slumps and debris flows. The mud volcano model posits that there is a central area of protrusion, although the conduit may migrate over time, possibly along a fault. A rheological study of muds from Conical Seamount suggests that the ultimate strength of the mud is capable of upward transport of serpentinized peridotite blocks as large as 20 m; however, the blocks would sink back into the conduit if the mud ceased upwelling [Phipps and Ballotti, 1992]. Based on their studies of material drilled from Conical Seamount, Phipps and Ballotti also state that serpentinite muds get stronger and more brittle as they age [1992]. Freshly erupted serpentinite mud is unconsolidated and shows yielding and plastic behavior once deviatoric stresses are applied. More consolidated muds that have been buried and dewatered exhibit some elastic behavior and have higher yield and ultimate strengths [Phipps and Ballotti, 1992]. Serpentinite seamounts, like magmatic volcanoes, may be expected to undergo gravitational deformation resulting in summit subsidence, lateral growth, and slope failure [Morgan and McGovern, 2005a]. 87
101 Data acquisition and processing In February and March of 2002 we conducted a multichannel seismic (MCS) survey of the central Mariana arc system using the R/V Maurice Ewing towing a 6-km, 480-channel streamer cable. Shots were fired every 50 meters from a tuned, 6817 inch 3 array of 20 airguns. The data were recorded in SEG-D format, with a sampling interval of 2 ms. At sea, resampling to 4 ms, application of geometry, trace editing, velocity analysis, inside and outside mutes, stacking and time migration were completed. Additional shore-based processing designed to enhance reflections and remove multiples included methods such as Radon velocity filtering, F-K filtering, and Deconvolution. The data were deconvolved prior to stacking in order to remove false, seafloor parallel reflections created by the airgun bubble pulse. This technique, although successful, had the undesirable effect of partially suppressing the real reflections resulting in a lowamplitude band just below the seafloor. The PROMAX 2D processing sequence applied to all lines is listed in Appendix Table 3.1. The seismic lines presented in this paper were time-migrated after muting the seafloor multiple and then converted to depth (except for Line 67-68). Most of the seismic data are displayed in depth with 3x vertical exaggeration. Interval velocities used in these conversions were based upon data from drill sites in the forearc region (Sites 783, Hole A and 779), refraction data, and corrections for velocity pullup. Details of the depth conversions can be found in Appendix 3.1. The bathymetric maps used in this study contain Hydrosweep data from the EW0202/03 cruises, Simrad EM300 from a 2003 R/V Thompson cruise, 1997 HAWAII MR-1 data, and data from a composite of regional studies conducted on ships from the 88
102 Japan Center for Marine Earth Science and Technology (JAMSTEC) (N. Seama and M. Nakanishi, private communications, 2002). The bathymetric images are illuminated from the east to highlight relief. Lineations sub-parallel to ship tracks are data artifacts at the edges of bathymetry swaths resulting from different sound speed profiles used for adjacent data. Serpentinite Seamount Description Observations from MCS, bathymetric and side-scan sonar data reveal key processes in serpentinite seamount emplacement, growth and gravitational deformation. In this section we describe the structure, reflectivity and morphology of three seamounts, including details that allow us to infer some material properties and formation processes. In subsequent sections we will use these descriptions to compare with results from DEM modeling to further develop our interpretation of seamount growth and deformation. Big Blue Seamount Big Blue Seamount, located between 18ºN and 18º20 N, centered ~70 km west of the trench axis, is the largest serpentinite seamount in the Mariana Forearc. It is the southernmost edifice in a dense cluster of serpentinite seamounts (Figure 3.1). It has an approximate diameter of 40 km, covers an area of roughly 2000 km 2 and reaches a height of 2.4 km above seafloor at its summit. Big Blue is an ovoid composite volcano with an irregular surface expression and slope angles ranging from º (Figure 3.3). MCS Line crosses over the top of Big Blue Seamount which has a more conical portion to the southwest and an irregular-shaped portion with multiple summits and a NE- 89
103 trending ridge to the northeast (Figure 3.3). Although the name Big Blue has traditionally been applied to the entire composite volcano, for the purposes of this paper, Big Blue Seamount will be defined only as the conical portion of the larger edifice, lying primarily to the SW of Line The boundaries of Big Blue Seamount and surrounding edifices, Baby Blue Seamount to the north and Grandma Blue Seamount to the east, are interpreted in orange on Figure 3.3 and indicated with blue arrows on the following seismic images (Figures 3.4 and 3.5). Bathymetric data show a 2 km wide, 3 km long, oval-shaped, NE-trending depression at the apex of Big Blue Seamount (Figure 3.3). This feature is partially filled in by a dome and is bounded by normal faults. Line images the floor of this summit depression as a strong v-shaped reflection beneath seismically transparent material (dashed line on Figure 3.4). Detailed bathymetric surveys using a 30 khz system have identified distinct, lobate flows on the flanks of the mud volcano (interpreted in orange, Figure 3.3). These flows are offset by numerous faults. The sense of motion along these faults is determined on the basis of seafloor offset in seismic data and fault scarp geometry in the bathymetry. Line crosses a series of nested, arcuate, convex-downhill fractures that deform the southern slope of Big Blue Seamount (Figure 3.3). The high-angle normal faults imaged on the flank bathymetry offset seafloor where they are crossed by MCS lines, but are not visible below the seafloor (Figure 3.4). The lack of coherent, subsurface reflections within the serpentinite seamounts makes it impossible to determine the extent of displacement caused by these faults. Where sub-seafloor reflections are present they are primarily low-angle, discrete segments. The dipping reflection near SP 940 may 90
104 be related to the normal fault crossed obliquely by Line The origins of other dipping reflections imaged in this profile are less clear. Line crosses the boundary of a flank mud flow, as indicated by orange lines on Figure 3.3 and the blue arrow on Figure 3.4 (~ SP 900). The boundaries of mud flow units are oval-shaped in map view, indicating directional flow. They do not encircle the summit, and are therefore distinguishable from changes in slope or flank undulations. The flow boundary is represented in the seismic data by a nearly horizontal, normal polarity (same as the seafloor) reflection. At approximately SP 1060, Line crosses the distal southern flank of Big Blue Seamount. To the north, the MCS data image a channel that forms the boundary between Big Blue and the more irregular Grandma Blue Seamount to the northeast. The forearc sediment in this area, overlying a strong basement reflection, is typically less than 0.5 km thick. A reverse polarity (opposite to the seafloor) reflection beneath the southern flanks of Big Blue Seamount represents the top of preexisting forearc sediments (Figures 3.4 and 3.5). The reverse polarity of this reflection indicates that forearc sediments under the distal flanks of the seamount have a lower velocity and/or density than the overlying serpentinite mud. Forearc sediment layers beneath the flank are mostly structurally undisturbed by seamount growth. The extent to which the interface between forearc sediments and serpentinite mud can be traced toward the center of the seamount on seismic sections is indicated with blue T-symbols on Figure 3.3. Layered sediments are not imaged beneath the summit or the N/NW flanks where Big Blue merges with other seamounts (Figures 3.3, 3.4 and 3.5). 91
105 Line crosses portions of three seamounts that display complex nesting relationships (Figures 3.3 and 3.5). Big Blue Seamount overlaps the SW flank of Grandma Blue and both edifices merge with Baby Blue Seamount to the north. To the NW, the seismic line images a channel separating Big Blue Seamount from the northern edifices. Upslope from the channel, the NE-trending boundary between Grandma Blue and Baby Blue Seamounts is interpreted as a thrust fault on Figure 3.3. This fault offsets seafloor and creates an inward-dipping reflection at SP 1282 (Figure 3.5). On the SE flank, ~SP 950, a bench, visible in the bathymetry, has formed above a mid-flank reflection that we infer to be a thrust fault based on analogies with DEM simulations (see Section 6). The southeastern boundary of Big Blue Seamount forms an inward dipping reflection at the base of this bench (dashed in Figure 3.5). Other dipping reflections are visible further downslope. At the base of Grandma Blue Seamount, beneath a reverse polarity reflection, flat-lying forearc sediment layers are truncated along inward-dipping thrust planes that offset the seafloor. Celestial Seamount Celestial Seamount is located ~60 km west of the trench at 16º32 N (Figures 3.1, 3.6 and 3.7). Of the three seamounts described herein, Celestial is most similar in morphology to a single magmatic volcano. It is nearly circular with flank slopes ranging from º. Celestial Seamount has a diameter of ~ 20 km and is topped by a 5 km long, 3.5 km wide, u-shaped summit depression. Celestial sits on the northern edge of a NW-trending basement high and is buttressed to the NE by a ridge/seamount that is thrusting to the NW (Figures 3.6 and 3.7). Normal faults drop the summit of Celestial 92
106 Seamount down to the north, and nested fractures deform the northern flank near SP 4100 on Line The western flank of Celestial is steeper and more irregular at its base than the rest of the seamount. The irregular sector of the seamount is bounded to the south by a north-dipping normal fault that extends down the flank of the seamount to its base. Angular blocks outlined in orange (Figure 3.6) west of Celestial Seamount are likely debris from the collapse of this flank, whereas more circular features may represent small mud mounds (Figures 3.6 and 3.7). Line crosses NW-SE over the summit of Celestial Seamount (Figure 3.8). The surrounding forearc sediments, ~ seconds thick, are moderately well stratified and are overlain by small mud mounds to the NW (Figure 3.8). At ~ SP 612, a SE-dipping normal fault offsets sediments and basement beneath a mud mound. Reflections dipping toward the center of the seamount are imaged on both flanks. The reflection at ~SP 750 occurs at a break in slope that forms a small bench like that seen on Big Blue Seamount. Above the bench, the NW flank of Celestial Seamount is concave up. At ~Shot Point 980 there is a change in slope of the SE flank of the seamount visible in the bathymetry (Figure 3.6). At the base of the section, strong, low frequency midcrustal reflections are visible ~1.25 seconds below basement. Line extends north from Celestial Seamount, across a forearc basin and over the center of Turquoise Seamount (Figures 3.9 and 3.10). This pre-seamount sedimentary basin is a long-lived feature, overlying Eocene basement, with typical sediment thicknesses of km. Basement deepens toward Turquoise Seamount to the north, offset by a series of N-dipping normal faults (Figure 3.9). Forearc sediments imaged beneath the southern flank of Celestial Seamount on Line onlap southward- 93
107 shoaling basement, indicating that the seamount protruded through the edge of the sedimentary basin (Figures 3.9 and 3.10). Flat-lying, coherent sediment reflections visible under the lower flanks of the seamount are not imaged beneath its upper flanks and summit (Figure 3.6). This may be due to difficulties in imaging through thick serpentinite mud; however, it is also likely that beneath the central portion of the seamount, sediment layers are disturbed by seamount growth processes, reducing their coherence and visibility in MCS sections. To the south, near a change in flank slope (~SP 4350), the sediment horizons gradually become indistinguishable from the chaotic internal structure of the seamount (Figure 3.10). Beneath the northern flank of Celestial Seamount, strong, flat-lying sediment horizons terminate abruptly at a series of low frequency, south-dipping reflections between 4 and 5 km depth. The southern slopes of Celestial Seamount are concave up and bi-linear with an 8 difference between the upper flank slope (15 ) and the lower flank slope (7 ) (Figure 3.10). A reverse polarity reflection beneath the flanks of Celestial Seamount represents the top of preexisting forearc sediments (Figures ). Changes in the slope of this reflection on time sections correlate with changes in seafloor slope and are caused by velocity pullup under the seamount flanks (Figure 3.9). We calculated the minimum velocities for the distal flanks of the seamount that correct for this pullup and restore the forearc sediments to the regional gradient. These velocities were used for the depth conversion in Figure The average velocities for the wedge above the reverse polarity reflection range from ~ m/s for the lower slope and increase to ~2500 m/s under the center of the seamount (as modeled in Appendix Fig. 3.1). 94
108 On Line (Figure 3.9), between Turquoise and Celestial Seamounts, at the base of the section, below 10 seconds TWTT, there is a prominent, low frequency horizon that we correlate with reflections from the top of the subducting Pacific Plate seen on dip lines [Oakley et al., 2005]. The downgoing slab is located ~3.5-4 seconds TWTT below basement between Turquoise and Celestial Seamounts. On crossing lines (not shown) the slab dips an average of 7-10º and reaches depths of km bsl near the serpentinite seamounts (for a range of inferred basement velocities of km/s). Turquoise Seamount Turquoise Seamount, at 17ºN, is centered approximately 70 km west of the trench axis within a forearc low (Figures 3.1, 3.6 and 3.7). It is an oval-shaped seamount, ~30 km in diameter from N-S, and ~45 km E-W. It has gently (5-10º) sloping flanks and no obvious summit depression, although the region is offset by normal faults. The eastern portion of the seamount is deformed by parallel, NE-trending normal faults that form a horst and graben. The resulting ridges and valleys fall in line with a 25 km long normal fault and sub-parallel strike-slip fault (indicated by a flower structure in MCS data) to the southwest of the seamount (Figures 3.6 and 3.7). Both faults are currently active as they offset seafloor in seismic, side-scan sonar, and bathymetric data. South of Turquoise Seamount a series of seafloor lineations visible on side-scan sonar images (Figure 3.7) primarily trend NW-SE, nearly orthogonal to the large faults discussed above. Where the sense of offset on these lineations is clear on crossing seismic lines, we have indicated the style of faulting (mainly normal faults) on Figure 3.6. Some of these lineations extend into and offset seafloor on the southern flank of Turquoise Seamount (Figures 3.6 and 95
109 3.7). Lineations on Turquoise between SP 3100 and 3200 correspond to undulations on the flanks of the seamount visible in MCS data (Figure 3.11). Seismic line crosses N-S over Turquoise Seamount (Figures 3.9, 3.11 and 3.12). The basement reflection on Line is prominent on the flanks and, although it diminishes in amplitude, is still traceable beneath the center of the seamount (Figure 3.11). The thinning of the pre-existing forearc sediment package beneath Turquoise Seamount is a result of onlap onto a shoaling basement (from 5.7 to 4.7 km depth, Figure 3.11) that forms the northern edge of a forearc reentrant and basin, discussed above for Celestial Seamount. Just south of SP 3500, Line crosses a possible flow lobe boundary visible on side-scan sonar data. Beneath the distal flanks of Turquoise Seamount, a large thrust fault, terminating at basement, separates inward-tilted reflections in the hanging wall from primarily flatlying to gently folded sediments in the foot wall (Figures 3.11 and 3.12). We interpret the hanging wall reflections to be a thrust package of forearc sediments because mud volcanoes elsewhere, both serpentinite and those found in accretionary systems, do not display parallel, coherent internal reflections (e.g. [Limonov et al., 1997; Depreiter et al., 2005]). The reflection at the base of the deformed sediment package on the southern flank of the seamount appears to be reverse polarity (Figures 3.11 and 3.12). No clear décollement is formed beneath the northern flank. The thrust fault approaches but does not offset seafloor on either flank, and erosion has created a seafloor low at the top of the deformed sediments on the southern flank. The displacement of forearc sediments at the toe of Turquoise Seamount forms a steep basal slope meters high (Figure 3.12). This slope can be traced around the 96
110 base on the northern, western and southern portions of the seamount (Figures 3.6 and 3.7). The flank on the eastern part of Turquoise Seamount has the lowest slope (5º). Numerical Simulations of Seamount Gravitational Deformation Evidence for Gravitational Deformation The presence of thrust faulting at the base of Turquoise and Big Blue/Grandma Blue Seamounts, along with the low surface slopes of all the seamounts studied, lead us to infer that lateral spreading is occurring within the seamounts and that these edifices are subject to gravitational deformation as they grow. We used discrete element method (DEM) simulations to model this deformation in the serpentinite seamounts. Two-dimensional (2D) DEM simulations of granular piles subject to Coulomb failure provide a first-order look at the deformation modes and deformational geometries that may develop during progressive seamount growth. This method and its application to gravitational spreading are described in detail by Morgan and McGovern [2005a; 2005b], who showed that under uniform basal and internal strength conditions, the granular piles grow self-similarly, developing distinctive stratigraphic relationships, morphologies, and structures dependent upon these rheological conditions. Here we expand the application of this method to explore lower strength conditions thought to be representative of serpentinite seamounts, as well as a variety of boundary conditions including seamount growth upon deformable substrates modeled after forearc sediments. We use more numerous particle assemblages in order to yield higher resolution deformation structures. 97
111 Internal and Basal Strengths of the Seamounts The previous DEM simulations conducted by Morgan and McGovern [2005a; 2005b] demonstrated that surface slopes of granular piles are strongly dependent on basal friction conditions, and are also good predictors of the mode of gravitational deformation they experience. For example, piles constructed on a strong, cohesive substrate exhibit particle avalanching, outward dipping layers and steep slopes, quite unlike those of the serpentinite seamounts (see Figure 3 in: Morgan and McGovern 2005a). Therefore, in order to simulate gravitational deformation of serpentinite seamounts, we needed preliminary estimates of their coefficients of internal and basal friction. Critical Coulomb wedge theory defines a relationship between the sum of surface slope (α) and basal slope (β),i.e., the critical taper angle, and the basal and internal friction coefficients [Davis et al., 1983]. The serpentinite seamounts have consistently low surface slopes of 5-18, although the slopes along an individual flank are not constant. Based on the seismic depth conversions, we obtain basal slopes of 0-2º. Assuming average densities of 1000 g/cm 3 and 2200 g/cm 3 for water and mud respectively, no overpressure, an internal friction coefficient of 0.30, and our measured α and β values, we iteratively calculated basal friction coefficients using the exact solution by Dahlen [1984]. Based on these assumptions, we determined that the low surface slopes on serpentinite seamounts imply very low basal friction coefficients (i.e., µ bas <= 0.1). Models employing low coefficients of basal and internal friction reproduce the overall morphology of the serpentinite seamounts. 98
112 Discrete Element Simulations The DEM assemblages are composed of homogeneous particles of two different sizes, with radii equivalent to 160 and 120 m, within a domain measuring 50 km across (Figures 3.13 and 3.14). Up to ~12,000 particles are generated in increments of 225, and allowed to settle under gravity to build a granular pile. Particle colors are cycled every four increments to show the stratigraphy. The elastic particles are subject to frictional sliding and, in aggregate, reproduce Coulomb rheology, developing displacement discontinuities that correspond to faults within the pile [Morgan and McGovern, 2005a]. Basal and internal friction coefficients in these simulations varied from ~ and ~ respectively, with low-strength serpentinite muds and their interfaces with forearc sediments falling into the lower ranges of these values [Moore et al., 2004]. Two basal boundary configurations were used: in the first, granular piles were constructed upon a rigid planar base, assuming no seamount interaction with the substrate (Figure 3.13); in the second, piles were constructed upon a pre-existing layer of particles (Figure 3.14), to simulate the growth of serpentinite seamounts upon pre-existing forearc sediments. Two sets of DEM simulations are presented here. Pile growth with an internal friction coefficient of 0.46, constructed upon a rigid, non-cohesive base with a basal friction coefficient of 0.09, develops low surface slopes with concave up morphologies (Figure 3.13a). Colored layers dip outward beneath the summit and are rotated to inward dips beneath the outer flanks. Deep-seated faults extend from the axis of the pile to the basal surface and activate outward sliding of the flanks along a basal décollement (Figure 3.13b). Resistance to sliding leads to transient toe thrusts, and local over-steepening of 99
113 the distal flanks (Stage 12, Figure 3.13). Coulomb wedge theory predicts that the seamount will deform until the flank reaches a critical taper at which time it will slide stably. In Stage 13 (not shown), the distal toe of the pile is underlain by a strong décollement and is no longer oversteepened. The cycle is repeated as the shear stress along the base of the pile episodically overcomes basal resistance to sliding, leading to lateral gravitational spreading of the seamount. The concave up morphologies of the piles are best characterized as bi-linear in form (Figure 3.13a). The steeper upper slopes are underlain by active normal faults (Figure 3.13b), and have been shown previously [Morgan and McGovern, 2005a] to be consistent with critical Coulomb wedges undergoing extension [i.e., limiting slopes of Dahlen [1984]]. The lower flanks, in contrast, define stable geometries in which the flank cores slide outward with little additional internal deformation [Morgan and McGovern, 2005a]. The DEM simulations show undulations on the flanks of the seamount that in 3-D would presumably be circumferential. These undulations, or wrinkles, on the surface are related to the internal deformation and lateral spreading of the volcano (i.e. Stage 14, Figure 3.13). Pile growth upon a pre-existing, deformable granular substrate, with internal friction coefficients of 0.3, results in significant substrate thinning beneath the pile, and substrate deformation beneath the distal flanks (Figure 3.14a). No single décollement surface is activated in these models. Instead, the high-angle normal faults beneath the summit extend into the underlying strata, rotating to progressively lower angles with distance from the pile axis, forming thrust faults that emerge near the toe of the pile (Figure 3.14b). In this way, thrust slices of the underlying material (red and gray) are 100
114 accreted to the seamount. The thrust packages at the edge of the simulated seamount are subsequently buried by younger deposits that avalanche down the pile slopes (Figure 3.14a). The surface slope angles in both simulations range from 8 to 17 consistent with those measured for all of the serpentinite seamounts. All modeled simulations are characterized by mid-flank detachments emergent near the change in flank slope. The DEM simulations presented here are carried out by raining particles from above in 2-D and consequently they do not simulate all of the processes active within growing and deforming serpentinite seamounts. For example, these simulations ignore central conduit intrusion or withdrawal, as well as growth upon a dipping substrate and do not model deformation in the third dimension. Additionally, the modeled particles are homogeneous throughout the granular pile, or within the substrate, and do not reflect temporal and spatial variations in properties that might influence seamount deformation. However, even with these limitations, the simulations provide significant general insight into the characteristics of serpentinite seamount growth and deformation and the interactions of the serpentinite muds and forearc sediments, which are considered in more detail below. Comparison of numerical models to observations enables us to predict the origin of some of the features seen in MCS profiles and to supplement our understanding in areas where data interpretation may otherwise be ambiguous. 101
115 Discussion Growth and Deformation of Serpentinite Seamounts The DEM simulations successfully reproduced the overall morphology of serpentinite mud volcanoes as well as many of the features observed in the data such as basal thrusts, inward-dipping reflections and mid-flank benches. For example, the simulations suggest that bench features like those on the slopes of Big Blue and Celestial Seamounts (Figures 3.5 and 3.8) are caused by mid-flank thrusting related to lateral seamount spreading (Figure 3.14, Stage 23). In order to provide the best match to the morphology of the serpentinite seamounts, including their low surface slopes of 5-18º, DEM models require distinctly low basal and internal friction coefficients. Under these conditions, the bi-linear slopes of the modeled piles (Figure 3.13) are consistent with the change in slope angle seen on Celestial Seamount (Figures ). In the simulations, such slope changes coincide with the locations of internal detachment faults. The DEM simulations serve as guides in predicting the interaction between serpentinite material and the forearc substrate, processes that cannot always be directly interpreted from the seismic images. Based on the large thrust packages at the toe of Turquoise Seamount, and the small-scale thrusting on the Big Blue/Grandma Blue edifice, we propose that serpentinite mud volcanoes undergo volcano spreading (e.g., [Borgia, 1994]) and lateral accretion. The DEM simulations demonstrate the feasibility of this process. Instead of sliding along a well-defined décollement at the top of forearc sediments, Turquoise Seamount spreads by displacing pre-existing forearc sediments, forming large thrusts at its base (Figures 3.11 and 3.12). Prior compaction and dewatering of these sediments will have increased their strength, [Phipps and Ballotti, 102
116 1992] allowing them to deform as a coherent package, maintaining the bedding planes we see in the data (Figure 3.12). This conclusion is also consistent with the recovery of siltstones (not unlithified sediments or serpentinite muds) in a dredge from the lower western flank of Turquoise Seamount [Bloomer and Hawkins, 1983]. On Line (Figure 3.5), thrust slices of forearc sediments are off-scraped and incorporated into the SE flank of the Big Blue/Grandma Blue composite volcano. Again, siltstones were recovered in a dredge from this locality [Bloomer and Hawkins, 1983]. DEM simulations of pile growth above a deformable substrate show that deformation internal to the pile extends into the substrate, adding thrust slices of the underlying material to the distal toes of the edifice (Figure 3.14). In this simulation, there is no cohesion between the base of the model and the substrate (i.e. basement and forearc sediments), therefore allowing for the incorporation of substrate material into the base of the deforming edifice. The DEM simulation predicts substrate deformation and thinning beneath the edifice by compaction and lateral displacement along thrust faults (Figure 3.14, Stages 23 and 28), although these processes are impossible to recognize beneath the chaotic seamount interiors. When cohesion is added, coupling basement and substrate (not shown), the model favors slip along the interface between the substrate sediments and the overlying growing edifice and thinning occurs only by compaction. The DEM simulations, however, do not explain why, when constructed upon the same substrate, one seamount will exhibit thrusting and the other will slide stably as in the case of Turquoise and Celestial Seamounts. The internally stratified sediment package beneath Celestial Seamount is truncated by inward-dipping reflections on the northern flank (Figure 3.10). These reflections may be related to faulting internal to the seamount, or may be caused by the 103
117 displacement of forearc sediment layers, possibly a precursor to a thrust like that at the base of Turquoise Seamount. Another feature common to both observations and DEM simulations are undulations, or wrinkles, on the flanks of the seamount. In the 2-D simulations, these features are the surface expression of internal deformation caused by seamount settling and lateral growth by thrust faulting (Figure 3.13). In 3-D, the undulations are concentric about the flanks of the seamounts. Backscatter images from Conical Seamount provide a good example of concentric ridges on the flanks of a serpentinite mud volcano (see Figure 3.4 in [Fryer et al., 1990]). Subtle changes in slope are visible on the bathymetric and side-scan data along the flanks of Celestial and Turquoise Seamounts (Figures 3.6 and 3.7). Elsewhere, features interpreted on the bathymetry are lobate, ovoid, and do not circumvent the seamount, suggesting that they represent individual mud flows, and not wrinkles or slope change in map view (Figure 3.3). The majority of such flows have been identified on the SW flank of Big Blue Seamount. Based on bathymetry and sidescan data, we recognized that mud flows forming serpentinite seamounts, unlike the granular packages in DEM simulations, often spread out preferentially in one direction, occasionally extending beyond the bounds of, and therefore covering, the older flows. These flows originate from a central area of protrusion, with the most recent filling in the depression at the summit, providing evidence for the episodic eruption of mud flow units. The flanks of Big Blue Seamount are deformed by nested normal faults associated with downslope slumping and sliding of young mud flows (Figures 3.3 and 3.4). As an active seamount continues to grow and deform, over-steepening of its flanks compared to its strength can cause mass wasting, both in the form of surficial 104
118 avalanching (Figure 3.13b) and sector collapse. The channeling on the SW flank of Celestial Seamount is likely caused by mass wasting, leading to the deposition of debris piles imaged in the bathymetry and side-scan sonar (Figures 3.6 and 3.7). Some of the mud mounds to the west of Celestial Seamount also show evidence of flank collapse. The morphology and low surface slope of the eastern flank of Turquoise Seamount suggest that it may be sliding/slumping downslope toward the Mariana Trench (Figure 3.6) Big Blue Seamount is part of the largest, most complex seamount edifice on the Mariana forearc. To the north and east, the seamount is buttressed by other edifices (Baby Blue and Grandma Blue, respectively), and channels visible in bathymetry and seismic images form boundaries between the seamounts (Figures ). The interaction between coalescing mud volcanoes has caused internal deformation (Figures 3.4 and 3.5). Although we have not modeled this type of interaction here, DEM simulations of volcano interactions, applied to Mauna Loa and Kilauea volcanoes on the Island of Hawaii, showed that growth of one volcano upon the flanks of another leads to thinning and spreading of the underlying edifice [Morgan, 2006]. However, if volcanoes buttress each other, the associated resistance to lateral spreading leads to horizontal compression and formation of low-angle thrust faults at their intersections. Such thrust faulting is visible in the MCS data and bathymetry where the seamounts coalesce (Figures ). Big Blue Seamount is built upon the SW flank of Grandma Blue Seamount, likely causing deformation of that edifice. The normal fault on the lower SE slope of Grandma Blue (~SP 860) may be related to flank subsidence, and the small-scale thrusting at the base of the seamount indicates lateral spreading (Figure 3.5). 105
119 Summit Depressions, Conduits and Faults The depression at the summit of Big Blue Seamount, bounded by normal faults, (Figures ) is likely formed by the dewatering and degassing of serpentinite muds and/or withdrawal of material from the summit of the volcano causing deflation and collapse. The depression is partially in-filled by domes of serpentinite mud that were cored in 1997 and 2003 [Fryer et al., 1999; Gharib, 2006]. The strong reflection at the base of the summit depression may be caused by a difference in acoustic impedance related to age and consolidation: fresh, hydrated, gaseous muds are less dense and lower velocity than older, more compacted serpentinites. It is likely that the domes consist of young serpentinite material as the seafloor is devoid of sediment and fresh serpentinite muds cored at the summit were very little altered by seawater [Gharib, 2006]. This feature provides evidence that serpentinite seamounts grow episodically. There is active normal faulting in the summit depression at the apex of Celestial Seamount (Figures 3.6 and 3.10). The slope of the summit of Celestial Seamount may be caused by mass wasting to the north. In contrast to Big Blue Seamount, the summit depression has not been filled in by continued mud protrusion. Again, the presence of this depression may be related to the deflation of the summit region caused by degassing of serpentinite muds or the withdrawal of material from a central conduit, indicating either a dormant stage in the formation of Celestial Seamount, or a migration in the path of erupting serpentinite muds depriving the summit region. Line crosses small mud mounds west of Celestial Seamount (Figure 3.8). The mounds show variations in degree of backscatter, suggesting differences in degree of sediment cover and therefore age [Fryer et al., 1999]. Some of these mud mounds have 106
120 been cored, revealing serpentinite material. The normal fault imaged beneath the mound at ~SP 612 may be a conduit for the upwelling mud indicating that this satellite cone is in the initial stages of mud volcano formation. This is the only place in our data where a fault conduit is directly imaged beneath inferred serpentinite material. Confirmation of the composition and structure of this small mound is necessary in order to determine if it can be considered a serpentinite mud volcano. The strong, irregular boundary between high and low backscatter on the seafloor west of Celestial Seamount is indicated by the white line on the side-scan sonar image, Figure 3.7. The shape of the outline, its proximity to both the serpentinite seamount and the small mud mounds suggest that the high backscatter is caused by a recent flow. The orthogonal fault sets interpreted on the bathymetry in Figure 3.6 and visible in the side-scan sonar imagery (Figure 3.7) trending toward Turquoise Seamount, lend indirect support to the concept that the conduits of serpentinite mud volcanoes form along intersecting fault planes [Fryer et al., 2000]. The NE-trending faults to the east of the Turquoise summit may be related to large regional faults of the same trend, although no direct correlation can be made. Lineations extending into the southern flank of Turquoise Seamount offset seafloor and suggest that faulting is actively occurring beneath the edifice (Figures 3.6 and 3.7). The role of fluids Water may play an important role in the growth and deformation of serpentinite mud volcanoes and their interaction with the underlying substrate. The interface between the serpentinite seamount and forearc sediments is represented by a reverse polarity 107
121 reflection at the base of Big Blue/Grandma Blue and Celestial Seamounts. We infer that the sediments are under-compacted (and/or over-pressured) beneath the outer flanks of the serpentinite seamounts [Moore et al., 1991; Moore and Vrolijk, 1992]. The sediments in the outer forearc are primarily volcaniclastic turbidities, ash and pelagic muds [Hussong et al., 1981]. Sedimentation rates are low (6-20 m/my), but vary through time (DSDP Leg 60, Sites 458 and 459). Leg 126 ODP drilling results from the Bonin forearc (Sites 787, 792 and 793) suggest that forearc sediments in the IBM have an average of 50% porosity from 500 to 700 m below seafloor [Taylor and Fujioka, 1990]. Water is released into this system by serpentinite mud and fluids rising along the conduit of the volcano, along with the compaction of forearc sediments beneath the center of the seamount, where the velocity/density structure normally increases with depth. From either source, fluids will travel along zones of high permeability, following a pressure gradient. In addition to signifying zones where the underlying sediments cannot dewater and are therefore over-pressured, reverse polarity reflections sometimes indicate pathways of fluid migration, as seen in accretionary prisms (i.e. [Moore et al., 1991; Moore and Vrolijk, 1992]). Some of the inward-dipping reflections internal to the serpentinite seamounts, such as those beneath the northern flank of Celestial Seamount (Figure 3.10), may represent pathways for fluid to escape from compacting mud. The DEM simulation above an undeformable substrate (Figure 3.13) is consistent with observations made at Celestial and Big Blue Seamounts, suggesting that they are growing laterally by sliding along pronounced décollements at the bases of the seamounts, leaving the underlying material little disturbed. These décollements may be represented by the reverse polarity reflections evident at the top of forearc sediments. On 108
122 Big Blue Line (Figure 3.4) the southern flank of the seamount is underlain by a reverse polarity reflection and the distal toe of the flank is oversteepened. This geometry is modeled in DEM simulations that show that intermittent resistance to sliding leads to transient toe thrusts, and local over-steepening of the distal flanks (Stage 12, Figure 3.13). The presence of the slip surface at the base of the seamounts may be explained by the presence of high pore pressures in the underlying forearc sediments, caused by the active upwelling of fluids, or introduced with fresh serpentinite muds that reduce the shear strength of the material, decoupling seamount and substrate deformation. Either explanation requires recent or active mud volcanism and fluid migration in the region. Fluid seeps vent slab-derived fluids at the summits of Celestial and Big Blue Seamounts [Mottl et al., 2003]. These fluids presumably reach the summit along a central conduit through the edifice, and may also flow along the boundary between serpentinite mud and sediments (Figure 3.15A). Therefore, we may expect to find chimneys and seeps at the base of the serpentinite seamounts, although, to date these regions have not been explored. Although we only have direct evidence for these two pathways for rising fluid and mud within the seamounts, we can not rule out the presence of other conduits, sills and intrusions that contribute to the formation of serpentinite mud volcanoes. Turquoise Seamount is unique in this region in terms of edifice deformation and interaction with underlying forearc sediments. The fact that Turquoise Seamount, located in a trough, is spreading uphill, whereas Celestial Seamount has formed on a forearc high, may account for their differing interaction with the underlying forearc sediments. This indicates that basal slope, a factor not addressed in the DEM simulations, plays a role in seamount-substrate interactions. Turquoise has the lowest surface slopes of the 109
123 serpentinite seamounts studied, and the most undulations on its flanks. The overall morphology of Turquoise Seamount, as modeled by DEM simulations, suggests more gravitational spreading compared to Big Blue and Celestial Seamounts. In contrast to the other seamounts, there is no reverse polarity reflection at the top of forearc sediments underlying Turquoise Seamount (Figures 3.11 and 3.12). However, the reflection at the base of the deformed sediment package beneath the southern flank appears to be reverse polarity. Backscatter imagery suggests no recent summit eruptions [Fryer et al., 2000]. Based on seismic and morphologic comparisons with Big Blue and Celestial Seamounts, and the fact that there are no fluid seeps or fresh serpentinite muds at its summit, we conclude that Turquoise Seamount is not actively growing but is laterally spreading (Figure 3.15B). The deformation at the base of Turquoise Seamount is consistent with a fault-bend-fold (e.g. [Suppe, 1983]), the top of which has been partially eroded (Figure 3.15B). If Turquoise is inactive, no fresh muds or fluids are flowing through the seamount and substrate; therefore there are no over-pressured sediments or zones of fluid migration along which to slip. In order to grow laterally, Turquoise Seamount displaces the sediments in its path. Seamount Composition The velocities needed to un-kink the reflection at the base of the serpentinite seamounts in depth conversions range from an average of 2000 m/s above the reverse polarity reflection to ~2500 m/s near the center of the seamount. Where sampled by drilling and observed in outcrops, serpentinite seamounts are highly heterogeneous, comprised of solid blocks of serpentinite suspended in a mud matrix. Cobbles have been 110
124 observed in fault scarps [Fryer et al., 1985; Fryer et al., 1990; Fryer, 1992b; Fryer and Mottl, 1992; Fryer et al., 1995]. The core of the volcano may incorporate more blocks/clasts in the mud matrix with an average density higher than that seen at the distal edges. Higher velocities under the center of the seamount are consistent with a greater proportion of ultramafic blocks there, but may also be related to higher degrees of compaction and deformation of serpentinite material in the core of the volcano. Conclusions Our data support the interpretation [Fryer, 1992a] that serpentinite seamounts in the Mariana forearc are formed by the episodic eruption of mudflows from a central conduit. The strong reflection beneath the summit of Big Blue Seamount represents a depression that has been partially in-filled by younger muds, supporting the idea that serpentinite seamount growth is episodic. Summit deflation and depression formation may occur when material withdraws from the conduit during inactive periods, and/or by dewatering and degassing of fresh muds. The boundaries of distinct mudflow units on Big Blue Seamount are visible in both bathymetric and seismic data. Big Blue Seamount displays complex nesting relationships as it overlaps with other seamounts to form a large, composite edifice. Serpentinite seamounts rest on faulted and sedimented Mariana forearc basement. Although located within the same region of the forearc, and formed above sediments of similar age and composition, the serpentinite mud volcanoes differ in their interaction with the forearc substrate. Big Blue and Celestial Seamounts slide over the top of the pre-existing sediment package, leaving the underlying material largely undisturbed, 111
125 whereas Turquoise Seamount displaces forearc sediments forming large thrusts at its base. The DEM simulations show that extension of detachment faults into a deformable substrate beneath the growing seamounts provides a mechanism for incorporating thrust slices of the underlying material into the distal toes of the seamount, as interpreted for Turquoise Seamount and the SW flank of Big Blue/Grandma Blue composite seamount. Where this substrate is less deformable, and/or greater fluid pressures enable a pronounced décollement to form, stable sliding occurs. Such is the case beneath the outer flanks of Celestial and Big Blue Seamounts where the reflection at the top of the forearc sediments is reverse polarity. Stable sliding may be explained by the presence of high pore pressures that reduce shear strength along the interface between serpentinite muds and forearc sediments, lowering basal friction and decoupling seamount and substrate deformation. Serpentinite mud and fluids travel to the summit along the conduit of the volcano and may also flow along the interface between serpentinite muds and forearc sediments. Turquoise is the only seamount imaged in this region of the Mariana forearc that grows laterally, not by sliding stably on top of forearc sediments, but by incorporating them into large thrusts at its base. Turquoise Seamount formed in a trough causing it to dig into the sediments at its base as it impinges on the surrounding slopes during lateral growth. From the low slopes of the seamount and its extensive basal deformation we infer, based on DEM simulations, that Turquoise Seamount has undergone more gravitational spreading than Big Blue and Celestial Seamounts. There are no fresh serpentinite muds or fluids found at the summit of Turquoise and bathymetric, seismic, 112
126 and side-scan data do not show evidence for recent mud flows, therefore, it is likely that Turquoise Seamount is not volcanically active. The recent flows infilling the depression at the summit of Big Blue Seamount, along with the presence of actively venting fluid seeps, suggest that this seamount is currently active. The small mud mound to the west of Celestial Seamount, underlain by a normal fault, may represent a serpentinite mud volcano in the initial stages of formation. 113
127 Appendix: MCS Processing and Depth Conversions Table 3.1: PROMAX 2D Processing Sequence Resample to 4 ms Edit Bad Traces Geometry Sort to Common Mid-Point Gathers (CMP) Bandpass Filter ( Hz) Form Supergathers Velocity Analysis Correct Normal Moveout Top Mute Bottom Mute Pre-stack Deconvolution CMP ensemble stack Bottom mute for migration Stolt F-K time migration F-K filter Automatic Gain Control Post migration depth conversion Top mute for display Forearc sediment and basement reflections are pulled-up in time profiles beneath the serpentinite seamounts. The velocities chosen for depth conversion correct for pullup by making the minimum velocity correction that restored the forearc sediment reflections beneath the flanks of the seamount to a regional gradient. The velocity model used to convert time to depth for Celestial Seamount is shown in Appendix Figure 3.3. We used a similar model to produce MCS depth sections for Big Blue Seamount. Beneath a 1500 m/s velocity for the water column, we used velocities of 1600 m/s plus a gradient of 1500 m/s/s in order to have an average velocity of ~2000 m/s in the forearc sediments, a value supported by an OBS refraction survey across the Mariana Forearc [Takahashi, 2003]. The refraction line of Takahashi et al. follows an ESE-trending MCS 114
128 line that crosses the northern flank of Celestial Seamount, with modeled average velocities within the seamount of m/s. In order to model these values, we applied a starting velocity of 1600 m/s plus a gradient of 1500 m/s/s to the serpentinite seamounts. In addition to this vertical gradient, we added a horizontal gradient of 0.5 m/s/cdp (0.08 km/s/km) to increase the velocity in the central portion of the edifice. The horizontal gradient starts at the inflection point of the reflection representing the top of forearc sediments under both flanks of the seamount (labeled in Appendix Figure 3.1 and seen time sections on Figures 8 and 9) and successfully un-kinks the horizon in depth sections. This model results in a velocity inversion between serpentinite material and forearc sediments beneath the seamount. The presence of a reverse polarity reflection (defined as having polarity opposite to the seafloor reflection) at the top of forearc sediments beneath the flanks of the seamounts also suggests that there is an impedance (= velocity x density) inversion at this boundary. We applied a 4.0 km/s velocity to the basement horizon with a vertical gradient of 2.5 km/s/s for 0.8 seconds. At basement seconds, a velocity of 6.0 km/s was applied with a gradient of 0.8 km/s/s down to the bottom of the profile. The velocities below basement result in an average crustal velocity in the outer forearc of km/s, a value supported by various forearc velocity models [LaTraille and Hussong, 1980; Takahashi, 2003]. Pre-stack depth migrations (PSDM) require precise knowledge of the velocity structure in a region in order to create an accurate representation of the seismic data in depth. With no drill well ties for this data set, it was difficult to constrain a velocity model beyond what is geologically reasonable based on known material properties, velocity pullup relationships, and extrapolation from dill sites in the forearc region. In an 115
129 attempt to create the most geologically accurate image we applied PROMAX 2D Prestack Kirchhoff Depth Migration to the south flank of Turquoise Seamount (Line 42-44). Ultimately, we found that for the thrust at the base of the seamount, post-stack time migrations converted into depth did a better job of imaging structures in the data than PSDM. Our lack of success with PSDM is likely related to poor velocity constraints in this region. However, velocity model results from iterations performed during the PSDM process allowed us to improve upon the time-migration velocity model used for all of the other seamounts (1.5 km/s plus a gradient of 0.5 km/s/s). For example, in the Turquoise post-stack time migration model we applied a 4 km/s velocity to the basement horizon to correct for a bow-tie structure beneath this reflection. We also added a horizontal gradient of 0.2 m/s/cdp (0.032 km/s/km) to increase the velocities in the thrust packages and the center of the seamount. For the depth conversion of Turquoise Seamount, we applied a vertical gradient of 1.6 km/s km/s/s within the seamount and sediments, calculated to reach approximately 4 km/s at the basement horizon beneath the seamount. The velocities and gradients applied below basement are consistent with Appendix Figure 3.1. The geometry of the flanks of Turquoise Seamount differs from that of Big Blue and Celestial Seamounts in that there is no reverse polarity reflection at the top of forearc sediments that experiences velocity pullup. Since we did not have this constraint for our depth conversion, we did not include the horizontal gradient in depth employed for the other seamounts in order to un-kink this horizon. 116
130 Figure 3.1: Regional location map. PSP= Philippine Sea Plate, PP= Pacific Plate IBM= Izu-Bonin-Mariana Trenches, MT= Mariana Trough. Bathymetry of the central Mariana arc-trench system from combined surveys, sunlit from the east, showing EW0202 seismic lines. Interpreted lines are shown in red. Boxes 1 and 2 locate Figures 3.3, 3.6 and

131 118
132 Figure 3.2: A. Schematic diagram of the major features of the forearc of an intraoceanic subduction system. B. Diagram of the emplacement of serpentinite mud volcanoes on the outer Mariana Forearc. Modified from Fryer et al. [2000]; no vertical exaggeration. 119
133 120
134 Figure 3.3: Map of Big Blue Seamount showing locations of seismic lines with shot numbers on interpreted bathymetry (Hydrosweep, MR-1, Simrad EM300 and regional surveys). Interpreted EW0202 lines are shown in red. Contour interval= 200m. Contour labels in km. A blue T-symbol on the track lines indicates the summit-ward extent to which the interface between forearc sediments and serpentinite can be traced beneath the seamounts. 121
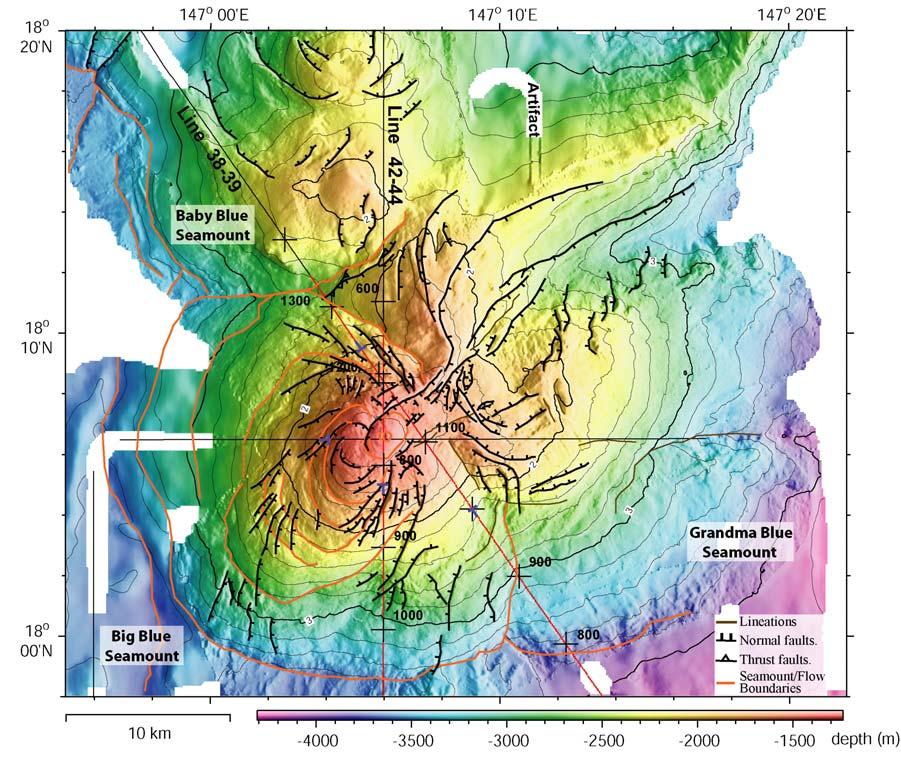
135 122
136 Figure 3.4: Seismic Line (depth converted) over Big Blue Seamount. Normal faulting on the SW flank is related to near surface deformation associated with downhill movement of this sector of the seamount. The reflection at the top of forearc sediments is reverse polarity beneath the southern flank of the seamount. Blue arrows mark flow lobe/seamount boundaries visible in the bathymetry and interpreted on Figure 3.3. Black arrows indicate seafloor offset and displacement direction. Location on Figure

137 124
138 Figure 3.5: Seismic line (depth converted) over Big Blue Seamount. Basal thrusting is visible on the toe of the SE flank. Blue arrows indicate the boundaries of Big Blue Seamount interpreted on Figure 3.3. Black arrows indicate seafloor offset and displacement direction. Location on Figure

139 126
140 Figure 3.6: Map of Celestial and Turquoise Seamounts showing locations of seismic lines with shot numbers on interpreted bathymetry (Hydrosweep, MR1, Simrad EM300 and regional surveys). Interpreted seismic lines are shown in red, other MCS tracks from EW0202 are indicated by solid black lines, and 6-channel seismic data collected along MR-1 side-scan tracks are represented by dashed black lines. Track sub-parallel bathymetry lineations are data artifacts. Contour interval= 200m. Contour labels in km. A blue T-symbol on the track lines indicates the summit-ward extent to which the interface between forearc sediments and serpentinite can be traced beneath the seamounts. 127

141 128
142 Figure 3.7: MR-1 side-scan sonar image of Celestial and Turquoise seamounts with seismic lines. Interpreted seismic lines are shown in red, other MCS tracks from EW0202 are indicated by solid blue lines, and 6-channel seismic data collected during the MR-1 survey are represented by dashed blue lines. Contour interval= 1000 m. Contour labels in km. 129

143 130
144 Figure 3.8: Time section of MCS Line across Celestial Seamount. Small mud mounds sit on top of forearc sediments. The NW flank of Celestial is convex upward. The summit of the seamount is deformed by high angle normal faults. Location on Figure

145 132
146 Figure 3.9: A. Time migrated MCS Line crossing N-S over Turquoise and Celestial Seamounts. Notice the change in slope of the reverse polarity reflection on Celestial Seamount. TWTT= Two-way travel time. Location on Figure

147 134
148 Figure 3.10: MCS Line (depth converted) over Celestial Seamount. Basin onlap is shown on the southern flank. The reverse polarity reflection at the top of forearc sediments is a surface along which the seamount slips. Strong, low frequency, mid-crustal reflections are visible between 7.5 and 8.0 km depth. Line intersects with Line within the depression at the summit of Celestial. Location on Figure

149 136
150 Figure 3.11: Time and depth sections of MCS Line across Turquoise Seamount. A time varying bandpass filter was applied in these images to minimize the negative effects of bubble pulse removal and to enhance shallow reflections. Basal thrusts at the seamount toe displace forearc sediments. Blue arrow indicates a possible mud flow lobe boundary interpreted on Figure 3.6. Boxes A and B refer to areas enlarged in Figure Location on Figure

151 138
152 Figure 3.12: Basal thrusting on the flanks of Turquoise Seamount. Strong, low frequency, dipping reflections separate deformed forearc sediments from truncated flat-lying layers. Sediment layers onlap basement on the northern edge of a large forearc basin. 139

153 140
154 Figure 3.13: DEM simulation results for an undeformable substrate: µ-base- 0.09; µ-internal A. Particle configuration, with alternating color layers, incrementing from the base of the pile. B. Incremental displacement discontinuities, showing regions of high shear strain. Red and blue colors denote right- and left-lateral shear strain, respectively, with color intensity increasing with strain magnitude. Low coefficients of basal friction produce slip along a basal décollement. Low internal friction coefficients result in broad spreading of the edifice which is accommodated by deep-seated normal faulting and summit subsidence. Notice the change in slope between the central portion of the seamount where surficial avalanching is occurring and the flanks where basal slip and toe thrusting take place. 141
155 142
156 Figure 3.14: DEM simulation results for a deformable substrate: µ-base- 0.09; µ-internal- 0.30, no cohesion. A. Particle configuration. B. Incremental displacement discontinuities, showing regions of high shear strain. Colors as in Figure Spreading above a deformable substrate allows normal faults to extend into the substrate and incorporate it into the edifice, building small thrust wedges at the toes of the flanks. 143

157 144
158 Figure 3.15: Serpentinite Mud Volcanoes. A. The seamount is built in a sedimented forearc basin by a series of individual flows fed through a central conduit. A depression at the summit of the seamount is partially infilled by recent mud flows. Carbonate and Mg-silicate chimneys and fluid seeps vent slabderived fluids at the summit of the seamount. Water produced both by the upwelling of serpentinite mud and fluids, and from the compaction of underlying substrate, may flow along the boundary between serpentinite mud and sediments, reducing shear strength and enabling the seamount to slide laterally. If the underlying sediments are unable to dewater, they will be over-pressured and the high pore pressures at the boundary will decouple seamount and substrate deformation. B. An inactive mud volcano in which all fluid upwelling has ceased. Active fluid seeps and chimneys are not found at the summit and a large basal thrust, the top of which has been eroded, displaces the entire forearc sediment package and accommodates seamount spreading. 145

159 146
160 Appendix Figure 3.1: Velocity model for Celestial Seamount depth conversion. In addition to a vertical gradient, we added a horizontal gradient of 0.5 m/s/cdp (0.08 km/s/s) to increase the velocity in the central portion of the seamount above the preexisting forearc strata. The horizontal gradient starts in time at the inflection point of the reflection representing the top of forearc sediments under both flanks of the seamount (e.g. Figure 9). When converted to depth, this reflection is flattened (e.g. Figure 3.11). Similar velocity models were used to depth convert Big Blue and Turquoise Seamounts. 147
161 148
162 Chapter 4: Sedimentary, volcanic and tectonic processes of the central Mariana arc: Part 1: Mariana Trough backarc basin formation and the West Mariana Ridge Abstract We present new multi-channel seismic (MCS) profiles and bathymetric data from the central Marianas that image the West Mariana Ridge (WMR) remnant arc, both margins of the Mariana Trough backarc basin, the modern arc and Eocene frontal arc high (FAH). These data reveal structure and stratigraphy related to three periods of arc volcanism and two periods of arc rifting. We interpret the boundary between accreted backarc basin and rifted arc crust along the Mariana Trough and support these findings with drilling results and recent seismic refraction and gravity studies. We show that with the exception of a few cross-chain volcanoes that straddle the boundary between crustal types, the modern Mariana Arc is built entirely on rifted arc crust between 14 and 19 N. Our data indicate that there is more accreted backarc seafloor to the west of the Mariana Trough spreading axis than to the east, confirming previous evidence for an asymmetric basin. The rifted margin of the WMR remnant arc forms a stepped pattern along the western boundary of the Mariana Trough, between and 19 N. In this region, linear volcanic cross-chains behind the WMR are aligned with the trend of Mariana Trough spreading segments and the WMR ridges extend into the backarc basin along the same strike. These ridges are magmatic accommodation zones which, to the north along the Izu-Bonin Arc, punctuate tectonic extension. For the WMR we hypothesize that rift basins are more commonly the sites where spreading segment offsets nucleate, whereas magmatic centers of spreading segments are sites where magmatism continues from arc 149
163 volcanism, through rifting to backarc spreading. The Mariana Trough is opening nonrigidly and is characterized by two predominant abyssal hill trends, NNW-SSE in the north, and N-S in the south. Between the only two basin-crossing fracture zones at ~15.5 and 17.5, N-S axes propagated north at the expense of NNW axes. Introduction One of the enigmas of convergent margin evolution is the existence of periodic phases of extension that result in arc rifting and backarc basin formation. The processes associated with the rifting and subsequent separation of continental lithosphere have been a major research focus and drilling objective (e.g. [Ruppel, 1995; Peron-Pinvidic and Manatschal, 2008]). Similar processes and questions are involved in the rifting of arc lithosphere prior to backarc spreading (e.g., the extent and nature of crustal stretching, the duration of rifting, and the interaction between vertical tectonics, rift sedimentation, and volcanism). Studies of lithospheric rheology suggest that the thick crust and high heat flow of the volcanic line constitute a rheological weak zone that focuses rifting in its vicinity [Molnar and Atwater, 1978; Kusznir and Park, 1987]. However, the exact location of arc rupture can vary with respect to this line. Rifting of the arc can occur along, in front of, or behind the volcanic front and continues until the lithosphere is sufficiently thinned for seafloor spreading to occur [Hawkins et al., 1984; Taylor, 1992; Martinez and Taylor, 2006]. The boundary between rifted arc and accreted backarc basin crust in island-arc settings is poorly constrained, partially because of the lack of well studied examples, and 150
164 also because of the presence of thick volcaniclastic sediments that conceal basement topography. Knowing this boundary allows us to evaluate the symmetry of oceanic accretion in backarc basins and determine the substrate upon which modern arc volcanoes are built. It is necessary to know what underlies arc volcanoes in order to understand the outputs of the so-called subduction factory and, ultimately, the formation of felsic continental crust. The Mariana system, at the southern end of the Izu-Bonin-Mariana (IBM) subduction system, is an intra-oceanic convergent margin undergoing extension (Figure 4.1). The basic tectonic framework for the history of the Mariana system has been in place since the early work of Karig (i.e. [Karig, 1970; Karig, 1971b; Karig et al., 1978]). The IBM arc began with Middle Eocene suprasubduction-zone magmatism (boninites and island arc tholeiites), similar to that observed in many ophiolites [Stern and Bloomer, 1992; Taylor, 1992; Bloomer et al., 1995]. The IBM island arc volcanic front was fully developed by the Late Middle Eocene (44 Ma) [Ishizuka et al., 2006]. Since then, the arc was episodically rifted, and successive backarc spreading in the Parece Vela Basin and Mariana Trough isolated the remnant arcs (Palau-Kyushu Ridge and West Mariana Ridge (WMR)) up to 1,300 km from the present IBM trench (Figure 4.1). Although the 50 Ma tectonic and magmatic history of the IBM arc is well known, the nature of the rifting and spreading that formed the Mariana Trough and the boundaries between rifted arc and accreted backarc basin crust are poorly constrained. Thick volcaniclastic sediments shed from the active arc mask basement topography on the eastern margin of the Mariana Trough, and there are no published detailed magnetic surveys from the central backarc basin (14-19 N), making a determination of spreading history difficult. 151
165 Multi-channel seismic (MCS) profiles collected in 2002 offer the best and most complete seismic reflection images of the central Mariana convergent margin; previously surveyed in 1976 [Mrozowski and Hayes, 1980]. In this paper we present the results of recent surveys over the central Mariana Arc, frontal-arc high, backarc basin, and remnant arc from 13 to N (Figure 4.2). We use MCS reflection and swath bathymetry data, combined with the results of previous drilling, seismic reflection and refraction studies to define the boundary between rifted arc and accreted backarc basin crust on both sides of the Mariana Trough and determine the substrate upon which the modern arc volcanoes are built. In addition, we present new, high-resolution bathymetry over the WMR, Mariana Trough and Mariana Arc that reveal the morphology and active deformation of the modern and remnant arc volcanoes along with backarc basin fabric. Using swath bathymetry data, combined with MCS profiles, we propose a spreading history for the Mariana Trough near 17 N. Our data reveal fundamental attributes of this archetypal intra-oceanic arc system that allow for improved comparisons with other extensional margins. Background Tectonics, Volcanism and Sedimentation Subduction began in the Mariana convergent margin circa 50 Ma [Taylor, 1992; Bloomer et al., 1995; Cosca et al., 1998]. Three stages of arc growth and two episodes of arc rifting are known from studies of island outcrops and drill cores from the Mariana subduction zone (DSDP and ODP legs: 59, 60,125, 126). Initial suprasubduction-zone magmatism generated a broad zone of boninitic crust ~300 km wide before the onset of 152
166 focused, calc-alkaline volcanism [Meiger, 1980; Taylor, 1992; Bloomer et al., 1995]. A volcanic island arc formed by the Late Middle Eocene (~44 Ma) at the location of the present day frontal-arc high (FAH) [Ishizuka et al., 2006]. The Eocene arc rifted in the Late Eocene to Early Oligocene prior to seafloor spreading in the Parece Vela backarc basin, which separated the FAH from the Palau-Kyushu Ridge remnant arc (Figure 4.1). Drill cores from DSDP Legs 59 and 60 show that explosive Oligocene volcanism on the FAH continued during rifting until ~29-31 Ma [Shipboard Scientific Party, 1978b; 1978a; Scott et al., 1980]. This rifting and subsequent spreading, from 29 Ma to 15 Ma, propagated north and south creating the characteristic bow-shape of the Mariana subduction zone [Mrozowski and Hayes, 1979; Taylor, 1992; Okino et al., 1998]. Volcanism may have slowed or ceased until ~20 Ma, when the Mio-Pliocene volcanic arc built up west of the rifted Eo-Oligocene arc [Hussong and Uyeda, 1981b; Meijer et al., 1983; Taylor, 1992]. DSDP Leg 60 drilling in the Mariana forearc shows an increase in volcanism until 9 Ma [Shipboard Scientific Party, 1978c; 1978d]. The Mio-Pliocene arc was then rifted, and seafloor spreading in the Mariana Trough backarc basin, beginning at ~5 Ma, rafted away the WMR remnant arc [Hussong and Uyeda, 1981b; Seama and Fujiwara, 1993]. Rifting and spreading propagated north, further increasing the curvature of the Mariana island arc system [Martinez et al., 1995]. A third period of explosive volcanism is ongoing along the modern Mariana arc, which is building west of the Eocene FAH [Hilton et al., 2005]. From 16 N-20.5 N most of the active arc volcanoes are subaerial; south of 16 N they are all submarine [Stern et al., 1984] (Figures 1 and 2). 153
167 Arc volcanoes, because of their thicker crust and higher heat flow than surrounding oceanic crust, create a linear zone of lithospheric weakness that controls the location of arc rifting, but the location of volcanic centers and rift boundaries may vary both along-strike of an arc and over time. Along the Izu-Bonin arc, Taylor [1992] found that the large relict Oligocene rift structures do not control the Quaternary rifts. In addition, rifts are wider and deeper between, rather than adjacent to, arc volcanoes suggesting that arc magmatism accommodates some of the extension with intrusions rather than faulting taking up the strain near the arc volcanoes [Taylor et al., 1991]. Rifted volcanic margins evolve by a combination of extrusive volcanism, intrusive magmatism, extension, uplift, and erosion (e.g. [Menzies et al., 2002]). Extension results in normal faulting, subsidence, and thinning of the crust. Active faulting provides conduits for the emplacement of dikes, sills, and lava flows of both arc and backarc basin basalt composition. Over time the active zone of extension shifts laterally away from the arc. Eventually, true seafloor spreading begins and newly accreted oceanic crust is produced [Martinez et al., 2000]. Mariana Trough The Mariana Trough is an active backarc basin which, south of 23.5 N, separates the modern Mariana volcanic arc from the remnant WMR [Karig, 1971b] (Figure 4.1). The Mariana Trough is a geologically young feature formed since ~8 Ma [Seama and Fujiwara, 1993]. The spreading axis, like the WMR and modern arc, has a bow shape with ridge segments of varying length (20-50 km), which are separated by both right- and left-lateral non-transform offsets and transform faults [Sinton and Hussong, 1983; StUben 154
168 et al., 1998] (Figure 4.1). The Pagan Fracture Zone (PFZ) [Fryer and Hussong, 1981] and another near 15.5 N are the only ridge offsets that cross the entire basin (Figure 4.2). In the northern and central portions of the basin, the spreading axis has a morphology similar to a slow-spreading mid-oceanic ridge with spreading rates of mm/year [Bibee et al., 1980; Hussong and Uyeda, 1982; Honsho et al., 1997; Kato et al., 2003]. However, some characteristics differ from typical mid-ocean ridge spreading. First, axial and flank depths of the Mariana Trough are deeper than most mid-ocean ridges of comparable age; second, the relief of the seafloor flanking the axis is typically ~1 km greater; and third, abyssal hill fabric trends are more variable [Karig et al., 1978; Martinez et al., 2000]. The southern Mariana Trough (south of ~14º N) is morphologically different from the central and northern basin, and more closely resembles fast-spreading or magmatically robust (e.g. hotspot) ridges [Martinez et al., 2000]. It is characterized by an axial high, rather than a trough and is spreading at a rate of 45 mm/yr near Guam [Kato et al., 2003]. The southward-increasing Mariana backarc spreading rates are associated with subduction rates along the Mariana Trench that increase from 40±5 mm/yr at 19 N to 65±10 mm/yr at 13.5 N [Kato et al., 2003]. Arc rifting and backarc basin formation are commonly thought to be caused by extension induced by the seaward migration of the trench, termed trench rollback [Elsasser, 1971; Moberly, 1972; Dewey, 1980]. However, this is disputed along the central Mariana margin where the near vertical subducting plate [Katsumata and Sykes, 1969; Isacks and Barazangi, 1977; Chiu et al., 1991; Engdahl et al., 1998] acts as a seaanchor resisting lateral motion [Scholz and Campos, 1995; Stern et al., 2003]. Backarc 155
169 basin spreading along this region of the Mariana system may be caused by the combined effects of the sea-anchor force and convergence of the Philippine Sea and Eurasian Plates. In contrast, the increase in spreading rate of the southern Mariana Trough may be affected by trench rollback along the Challenger Deep segment of the Mariana Trench [Martinez et al., 2000; Fryer et al., 2003; Gvirtzman and Stern, 2004]. Martinez et al. [2000] propose that the region between the trench and the backarc spreading center or interplate zone undergoes intense deformation in response to the changing morphology of the trench and the increase in curvature of the Mariana Arc. Rifting of the Mariana arc is suggested to have evolved through a two stage process: 1) stretching of the arc to produce a block-faulted terrain and 2) transition to seafloor spreading [Fryer and Hussong, 1981; Baker et al., 1996]. Based on early bathymetric and magnetic surveys at 18º N, DSDP Leg 60 scientists proposed that backarc spreading was essentially symmetric in the Mariana Trough, implying that oceanic crust and abyssal hill fabric to the east were buried under thick volcaniclastic sediments derived from the active arc [Bibee et al., 1980; Hussong and Uyeda, 1981b]. However, the extent of accreted backarc basin crust on the eastern margin of the basin, proximal to the active volcanic arc, and the locations of paleo spreading axes are unknown. With the refinement of the location of the modern spreading axis based on higher-resolution bathymetric mapping and side-scan sonar imaging (e.g. [Deschamps and Fujiwara, 2003; Yamazaki et al., 2003; Deschamps et al., 2005; Kitada et al., 2006]) and its proximity to the eastern edge of the trough, the basin appears to have opened in a highly asymmetric manner. In general, the spreading center is km closer to the Mariana Arc than the WMR [Fryer, 1995] (Figures 4.1 and 4.2), suggesting asymmetrical 156
170 crustal accretion or, alternatively, that the active arc is constructed primarily on accreted lithosphere [Hussong and Uyeda, 1981b]. Some studies, interpret magmatic accretion to be asymmetric [Fryer, 1995; StUben et al., 1998; Deschamps and Fujiwara, 2003]. Deschamps and Fujiwara [2003] found that half spreading rates along segments of the central Mariana Trough axis near 18 N were 2-3 times higher on the western side of the basin than the eastern during the Brunhes-Matuyama period [Asada et al., 2007]. Asymmetric spreading (though less extreme) is common along the axis of slow spreading ridges such as the Mid Atlantic Ridge; and asymmetric backarc basin formation is seen in the northern and southern Mariana Trough, Okinawa Trough and Lau-Havre-Taupo basin [Tucholke and Lin, 1994; Martinez et al., 1995; Baker et al., 1996; Parson and Wright, 1996; Yamazaki and Murakami, 1998; Martinez and Taylor, 2002]. In their recent work, Asada et al. [2007] suggest that the asymmetry of the Mariana Trough is caused by repetitive, small-scale ridge jumps to the east. In this model, seafloor accretion along individual spreading segments would primarily be symmetric, but the ridge jumps would result in an overall asymmetric basin. Description Bathymetry The bathymetric maps used in this study include swath multibeam data from the EW0202/03 cruises, data over the Mariana Arc and FAH provided by NOAA Pacific Islands Fisheries Science Center and NOAA Vents Program, Pacific Marine Environmental Laboratory, data over the WMR courtesy of James Gardner at the Center for Coastal & Ocean Mapping, University of New Hampshire, data from a 157
171 composite of regional studies conducted on ships from the Japan Center for Marine Earth Science and Technology (JAMSTEC) supplied by Nobu Seama [Kitada et al., 2006], as well as 1997 HAWAII MR-1 data (Figure 4.1C). We interpreted the bathymetry based on maps with several different illuminations to minimize artifacts. Sense of motion along faults was determined on the basis of seafloor offset in seismic data and fault scarp geometry in the bathymetry. New multibeam bathymetry data over the WMR show numerous well-developed canyons and dendritic drainage patterns emptying into the Parece Vela Basin that have formed large depositional aprons (Figures 4.2 and 4.3) (Gardner et. al, In Prep). There are many inactive volcanoes bordering the Parece Vela Basin. North of 16 N, these volcanoes form linear cross-chains (~45-60 to the ridge) that appear to align with the centers of Mariana Trough spreading segments, suggesting magmatic segmentation. North of 15.5 N, WMR ridges extend eastward into the backarc along these same NE- SW trends. Although individual peaks reach nearly to sea level, the majority of the WMR remnant arc is at depths of 2-3 km below sea level (Figure 4.2). In general, the eastern slopes of the WMR are steeper than the western slopes, because of normal faulting (as shown later in the MCS data). This is especially true south of 15 N where the remnant arc is narrower. The average depth of the central Mariana Trough (14-19 N) is ~ 4 km (Figure 4.2). The basin floor consists of a series of NNW-SSE to N-S trending, linear ridges and valleys, which are characteristic of abyssal hill fabric found at a slow-spreading midocean ridge [Fryer and Hussong, 1981]. The spreading ridge segmentation boundaries and spreading axis in the Mariana Trough were interpreted based on bathymetry, acoustic 158
172 imagery and MCS data, and differ somewhat from previously published locations (e.g. [Kitada et al., 2006]) (Figure 4.2). Several MCS lines cross the axial ridge and rift valley of the spreading axis [Hawkins et al., 1990], allowing us to refine its location, and, using the new bathymetry, we based our segmentation boundaries on spreading ridge offsets and abyssal hill fabric (e.g. changes in fabric trends, inside corner highs, etc.). The segmentation boundaries indicate transform and non-transform offsets, including ridge propagation. The trend of the abyssal hill fabric varies across the basin and along-strike. North of the Pagan Fracture Zone (PFZ) the trend is primarily NNW-SSE. South to ~15.5 N, the fabric changes across the basin, rotating from NNW-SSE to nearly N-S near E. The different trends are separated by a propagator and the eastern portion of the PFZ (solid, green line Figure 4.4). South of the PFZ, a NNW-trending, large-relief abyssal hill on the eastern margin of the basin (crossed by MCS Line 50), is discordant with the abyssal fabric and the trend of the spreading center in this region; however, it conforms to the trend of the abyssal hills on the western margin of the Mariana Trough. Few other abyssal hills rise above the volcaniclastic sediment apron that covers the eastern basin north of 15 N. South of 15 N, the spreading axis trends NNE and the offaxis fabric generally parallels it, except near 14.5 N where it trends slightly west of north. Submarine channels/canyons and concentric ridges are common on the western flanks of the modern arc volcanoes and in the backarc (Figures 4.2 and 4.3) [Hussong and Fryer, 1983]. Submarine canyons transport sediments from the arc to the backarc basin [Draut and Clift, 2006]. One large (~ 56 km long) canyon extends from West 159
173 Pagan Volcano into the backarc basin. It appears to follow/empty into the PFZ (Figure 4.2). Concentric ridges on the outer flanks of volcanoes along the Kermadec arc are interpreted as mega-bedforms associated with pyroclastic density flows and edifice foundering [Wright et al., 2006]. Excellent examples of these features are also seen in the Lau Basin (F. Martinez, unpublished data) and along the Izu-Bonin arc [Tani et al., 2008]. The modern arc along the central Mariana convergent margin consists of large, individual volcanoes (e.g. Pagan, Agrigan) to the north and smaller, submarine volcanoes to the south (Figures ) [Stern et al., 1984]. The relief of the frontal-arc high (FAH) is roughly the inverse of this: subariel from N, submarine from N and apparently absent between N. The size of the WMR compliments that of the FAH: wide north of 15.5 N and narrow to the south (Figure 4.4). Several cross-chain, backarc volcanoes are associated with the modern Mariana Arc [Hussong and Fryer, 1983] (Figures 4.2 and 4.4). The longest cross-chains include three volcanoes. We imaged numerous volcanic intrusions along and across the active arc (Figure 4.4). Some are located within intra-arc basins and some on the Eocene platform. Many of these intrusions are associated with active or recently active normal faults that offset the seafloor. West of Guguan Volcano at N, a small volcano is located between two N-NNW-trending lineations interpreted to be abyssal hills (Figures 4.3B and 4.4). Not knowing the composition (arc vs. backarc) of this volcano, we have colored it green on Figure
174 Seismic Interpretation The West Mariana Ridge (WMR) MCS Lines , , , and Conrad Line 55 cross the WMR remnant arc and western margin of the Mariana Trough backarc basin between and 18.5 N (Figures 4.3A, 4.5 and 4.6). These lines show the thick volcaniclastic cover of the western flank and summit of the WMR, the variable morphology of its eastern flank, and the boundary between rifted arc and accreted backarc basin crust. The western flank of the WMR is characterized by numerous cross-chain volcanoes and submarine channels and canyons (Figures 4.3A and 4.5). MCS Line , which crosses E-W over the WMR at N (Figure 4.5C), reveals an apron of volcaniclastic sediments that thickens westward to 2 s TWTT into the Parece Vela backarc basin. The seafloor is marked by large distributary channels and dendritic drainage pathways (Figure 4.3A). The cross-chain volcano on the western flank of the WMR imaged on both Lines (SP 6400) and (SP 1000) appears to be undeformed by the rifting of the Miocene arc (Figure 4.5B,C). The morphology of the summit and eastern flank of the WMR varies along-strike. In the north, along Line (Figure 4.5A), the eastern flank of the WMR consists of numerous down-dropped and west-tilted fault blocks bounded by east-dipping normal faults. These blocks are covered by a uniform layer of nearly flat-lying sediments. The flank of the WMR basement deepens eastward from ~3.5-6 s TWTT. At the base of the 161
175 flank, a basin (SP ) is filled with flat-lying, sedimentary layers that onlap the edges, suggesting that they were formed by the deposition of turbidites. To the south, between Lines 55 and , the summit of the WMR forms an elongate, thickly (1.5 to >2 s TWTT) sedimented ridge, roughly 40-km-long by 15-kmwide (Figure 4.3A). Sediment thickness increases north along the ridge, thickening into the basin formed between Lines and (Figures 4.2 and 4.3A, Line not shown). MCS Line crosses the northern tip of this ridge (Figure 4.5B). The summit of the WMR is eroded by dendritic drainage channels (Figure 4.3A). Between SP 1050 and 1400 the seafloor is hummocky, likely because of erosion from numerous channels (Figure 4.5A). East- and west-dipping normal faults deform sediments probably shed from the surrounding volcanoes, forming a rift basin infilled by younger sediments (~SP ). Near DSDP Site 451 there is a package of eastdipping, parallel volcaniclastic sediment horizons offset by normal faults that dip west at ~60-65 (assuming average sediment velocity of 2 km/s). This thick package of sediments is separated from more recent, seafloor sub-parallel reflections by an unconformity (black line on Figure 4.5B). These upper sediments are primarily deposited in a basin between ~SP 1430 and East-dipping normal faults that offset the seafloor deform the upper sediment package between SP Near SP 1800, the deeper sediment horizons change dip from east to west and are offset by east-dipping normal faults. The blue, dashed line roughly marks the base of the dipping volcaniclastic sediments. The sediment package is thickest in the basin near SP To the east, Line images a robust magmatic section of the WMR trending NE (Figures 4.3A and 4.5B). This portion of the WMR extends a linear ridge, deformed 162
176 by both west- and east-dipping normal faults, into the Mariana Trough along a flow line, revealing a zone of rifting up to 70 km in width (Figures 4.2 and 4.5B). Here, rifted fault blocks and abyssal hills have similar strike and morphology. Near 18º N, Line 55 from an R/V Robert Conrad seismic reflection survey in 1976 crosses E-W over DSDP drill Site 451 (Figures 4.2, 4.3A and 4.6A). The rollover morphology of the WMR summit and eastern flank is similar to what is described for Lines above and below. Near SP 3650 fault dips switch from west to east-dipping. A large rifted fault block near SP 3400 forms a prominent ridge in the bathymetry. Line crosses over the summit of the elongate ridge which is faulted and flexed down from ~2 to 6 s TWTT (Figure 4.5C). As along Line , the faults on top of the bathymetric high dip to the west offsetting sediment horizons that dip to the east; however we do not image a comparable package of seafloor conformable horizons overlying the east-dipping sediments. In addition, there are no down-dropped fault blocks on the eastern flank like those seen on MCS profiles to the north and south. Near SP 5500 and 5300, flat-lying sediments are deposited in basins bounded by rifted fault blocks. MCS Line (Figure 4.6B) parallels Line , ~60 km to the south. Here, the WMR is deformed by west- and east-dipping normal faults, many of which reach the seafloor. Thick packages of sediments dip west and east on either side of the WMR. A dashed, blue line separates two distinct sediment packages. The lower sediment package represents pre-rift deposition along the WMR. The upper section includes syn-rift to recent sedimentation and correlates with the package of dipping 163
177 horizons seen to the north on Line (Figure 4.5B). West-dipping sediments in the upper package thicken to the SW and are eroded by a large channel at SP 300. Near SP 750, sediments switch from west-dipping to east-dipping. On top of the package of eastdipping reflections, between SP , a series of blocks are back-tilted on eastdipping normal faults, forming small half-graben infilled by seafloor-parallel reflections. Beneath these blocks, near SP 1120, clear reflections from the east-dipping sediment horizons terminate abruptly. To the east, Line images an east-dipping, low-angle normal fault which reaches the seafloor near ~SP The eastern extent of the fault marks the boundary between rifted WMR crust and accreted backarc basin crust (Figure 4.6B). Depth conversions using crustal velocities of km/s below the sediments, determined from the range of velocities in the refraction model of Takahashi et al., [2008], result in angles for the lower segment of the fault of The low-angle fault forms the western boundary of a NNW-trending basin visible in the bathymetry (Figures 4.2 and 4.3A). An active normal fault near SP 1355 offsets flat-lying sediments and seafloor within the basin. To the north, along Conrad Line 55, a low-angle normal fault bounds a bathymetric low with a similar trend to that seen along Line (~SP 3030) (Figure 4.6A). Again, there is recently active normal faulting within the basin above the lowangle fault (~SP 3055). We interpret the eastern side of the low-angle fault, where it abuts basement with abyssal hill fabric, to be the arc-backarc boundary. Based on the low-angle faults visible on Lines and 55, drilling results from DSDP drill Site 453 (discussed below) and abyssal hill fabric revealed in the swath 164
178 bathymetry, we interpret the rifted arc- accreted backarc basin crust boundary to be within NNW-trending graben at the eastern edge of the WMR on all of the MCS profiles (Figures 4.2, 4.5 and 4.6). East of these graben, the seafloor topography is characterized by rough, moderate-relief (~0.5 s TWTT) abyssal hill fabric draped by thin sediments that are likely hemipelagic in origin. Backarc basin crust is mostly unreflective beneath basement and lacks the deeper structures seen along the WMR. The spreading axis and eastern margin of the Mariana Trough Several MCS lines cross the eastern margin and abyssal hills of the Mariana Trough and extend across the spreading axis. The data are presented here from north to south (Figures 4.3B, and ). Line The eastern portion of MCS Line runs ENE across the modern arc between Agrigan and Pagan Volcanoes (Figures 4.3B and 4.7A). Along this line, the Mariana Trough spreading axis (indicated by a red arrow on Figure 4.7) is bounded on both sides by NNW-SSE trending symmetric abyssal hills with high relief. Alvin submersible dives in the Mariana Trough in 1987 showed that the spreading axis between N and N is an axial ridge within a km wide rift valley (e.g. [Craig et al., 1987; Hawkins et al., 1990]). There is little sediment within the rift valley. East of the axis, sediments fill a basement low (~SP 2050) (Figure 4.7A). Abyssal hills are buried by thick, flat-lying, volcaniclastic sediments within 35 km of the spreading axis. Seafloor, corrugated by channels and possible sediment waves, shoals to the east between 165
179 the arc volcanoes (Figure 4.3B). We interpret two basement ridges near SP 1550 and 2000 to be abyssal hills that are onlapped by and buried beneath volcaniclastic sediments shed from the active arc, indicating that backarc basin crust (dashed blue line) extends at least this far east. We do not image any coherent reflections within the backarc basin crust. East of the abyssal hills, a reflection separates relatively flat-lying sediments from unreflective basement (dashed black line). The character of both the sediments and the basement changes at ~SP 1250 and to the east. Sediment horizons become increasingly chaotic and are variably tilted. In addition, there are strong, discontinuous horizons deeper in the section (~6.5-7 s TWTT) (Figure 4.7A). We interpret the change in seismic character near ~SP 1250 to mark the transition from backarc basin accreted crust to rifted and sedimented arc crust. Line MCS Line crosses a spreading segment of the Mariana Trough and images the modern arc south of Pagan Volcano (Figures 4.3B and 4.7B). The axis along is located within an ~15 km-wide rift valley, bounded by NNW-SSE-trending abyssal hills. The backarc basin sediments are primarily flat-lying and increase in thickness toward the active arc. A buried abyssal hill at ~SP 3900 is interpreted to be an extension of the ridge visible in the bathymetry just south of Line (Figures 4.2 and 4.3B) and imaged on Line (Figure 4.7C) and indicates that backarc basin crust extends at least this far to the east. We interpret strong, flat-lying reflections in the sediment basin to the west of West Pagan Seamount to be sills based on their seismic character, high amplitude, and abrupt lateral termination. These reflections absorb a significant amount of seismic energy and make identification of the underlying basement difficult. Strong sediment 166
180 and basement (dashed blue line) horizons extend from the backarc basin to beneath the seamount (Figure 4.7B). A thick package of recent sediments from Pagan Volcano onlaps onto the eastern flank of West Pagan Seamount. Sediments horizons to the east of the seamount are offset by normal faults and truncated by piercement structures. Piercement structures, representing volcanic intrusions, occur near SP 3150, 3300 and on the SE flank of West Pagan Seamount at 3400 (Figures 4.4 and 4.7B). Line MCS Line trends E-W across the faulted northern flank of Alamagan Volcano at N (Figures 4.3B and 4.7C). The spreading axis imaged on Line lies within an asymmetric, ~11 km-wide axial valley with a depth of 5.4 s TWTT (~4170 m). The ridges to the east and west of the axis reach shoals of 4.25 s and 3.5 s TWTT, respectively and trend NNW-SSE. Abyssal hill relief decreases to the east and there is a buried ridge near SP 7200, also imaged on Line This abyssal hill is onlapped by a package of sediments that thins to the west, away from Alamagan Volcano. Low-relief basement (dashed blue line, Figure 4.7C) deepens toward the arc. Backarc basin crust extends at least as far as SP 7200; however, the rifted arc/backarc boundary cannot be further constrained by structures in the MCS data. At ~SP 7400, Line crosses a narrow portion of the large channel in the backarc basin visible in the bathymetry (Figure 4.3B). Sediment horizons to the west of Alamagan are offset by normal faults (~SP ). On the northern flank of the volcano, sediments and seafloor are deformed by active normal faults. Sediments between SP 8320 and 8400 are back tilted to the west indicating present-day motion on east-dipping normal faults (Figure 4.7C). Line
181 MCS Line trends ESE-WNW across the inflated center of an hourglass segment of the Mariana Trough spreading axis [Deschamps et al., 2005] and images the arc north of Sarigan Volcano at N (Figures 4.3B and 4.8). Along Line 53-54, the spreading axis is shallower than to the north, ~4.5 s TWTT (<4 km) and has subdued abyssal hill relief (~0.5 s TWTT). Abyssal hill fabric is sigmoidal trending roughly N-S at the segment ends (Figure 4.3B). Primarily flat-lying sediments infill valleys between the abyssal hills which extend east to SP Arcward of this, a relatively flat, strong, continuous horizon (dashed blue line, Figure 4.8) underlies a coherent sediment package. This reflection may represent the top of backarc basin crust; however, there are strong reflections further down in the section that suggest a deeper basement. Further north, along Line 10-13, sills obscure basement and form flat-lying reflections. There, we interpret basement to be beneath the sills and reverberations near 6 s TWTT (Figure 4.7B). Velocities between the two dashed blue lines on Figure 4.8 are ~3-4 km/s [Takahashi et al., 2008]; which suggests interbedding of sediments and basaltic intrusions, supporting our interpretation of a true basement horizon near 6 s TWTT. At ~SP 1600, a rifted fault block on the western flank of the modern arc is onlapped by backarc basin sediments and downlapped by volcaniclastics from the active arc. The west-dipping normal fault that bounds the block forms a sloping boundary between rifted arc and accreted backarc basin crust (Figure 4.8). Where the fault intersects the lower basement horizon, material to the east of the fault is rifted arc crust, and material to the west is backarc basin crust. Line
182 MCS Line crosses the broad FAH platform between the islands of Saipan and Tinian and extends over the smooth seafloor of the eastern Mariana Trough (Figures 4.3C and 4.9). In this region, the arc volcanoes and FAH trend NNE-SSW, and abyssal hill fabric trends N-S (Figure 4.2). Seafloor between the arc volcanoes is hummocky and the flanks of the volcanoes are deformed by concentric ridges and channels (Figure 4.3B). A large volcaniclastic sediment apron thins arcward and is eroded by channels (Figure 4.9). The dashed blue horizon separates coherent, seafloor parallel horizons (>1 s TWTT thick) from relatively non-reflective basement. Beneath basement, an eastdipping reflection (~SP 40) is possibly a thrust fault which resulted in an asymmetric fold in the sediments above. Alternatively, the deformation in the sediments could be caused by a west-dipping, high-angle normal fault. The faulting is no longer active. Near SP 400, a west-dipping normal fault bounds a basement block onlapped by sediments. On top of the block and to the east, we draw a black dashed line at the base of a package of chaotic and discontinuous sediment horizons. Sediments dip both east and west and are offset by west-dipping normal faults. The basement block may indicate the western extent of rifted arc crust. Near SP 1050 a high which is probably a rifted fault block, is onlapped by recent sediments shed from the active arc. The presence of rifted arc material on the western flank of the FAH, in line with the modern volcanoes, suggests that arc crust extends at least this far west. Between the basement block and the fault block (~SP ), the MCS data is highly reflective and chaotic down to the seafloor multiple, differing from the relatively non-reflective backarc basin crust imaged along the eastern margin of the Mariana Trough (Figures ). Coherence in the upper section of the profile increases to the east. East of the fault block near SP 1050, the purple 169
183 horizon separates a package of coherent, west-dipping horizons from older, deeper sediments that parallel the flank of the FAH. Both packages are offset by normal faults. Discussion Remnant Arcs and the Location of Arc Rupture The IBM backarc system includes two remnant arcs, the Palau-Kyushu Ridge (PKR) and the West Mariana Ridge (WMR) (Figure 4.1). Comparison of the two shows that the location of arc rupture and the nature of rifting can vary over time within one subduction system. Detailed, recent swath bathymetry and MCS surveys show that most of the PKR south of 25 N is a flexed West Philippine Basin rift-flank bounded by faults on the east and with a few cross-chain volcanoes to the west [Okino et al., 1998; Okino et al., 1999; Nishizawa et al., 2005]. This is significant because it implies that the split of the Eocene arc occurred on the backarc side, leaving the Eo-Oligocene arc (FAH) and forearc to the east of the Parece Vela Basin (Figure 4.1). In addition, a recent refraction study across the PKR imaged an igneous crustal thickness of ~20 km at 20.5 N [Nishizawa et al., 2007], similar to the FAH. However, Nishizawa et al. [2007] did not image a thick middle crust with a velocity of ~6-6.5 km/s or a strong discontinuity at the mid/lower crust boundary, both of which also characterize the Eocene arc [Takahashi et al., 2007; Calvert et al., 2008]. Nishizawa et al. [2007] hypothesize that the thinner PKR middle crust may be a result of its rifting from the edge of the volcanic arc where the arc crust was not particularly thick. 170
184 In contrast, the split of the Miocene Mariana arc north of N appears to have occurred primarily on the forearc side, with the majority of the Miocene volcanic front now located in the WMR. The WMR forms a broad bathymetric high consisting of discrete arc volcanoes and numerous backarc cross-chain volcanoes (Figure 4.2). The summit is deformed by both east and west-dipping normal faults, and a thick, pre-rift sediment package paralleling the flanks of the WMR along Line (Figures 4.3A and 4.6B) may represent volcaniclastic deposition on both sides of the Miocene arc. North of N there is no distinct, bathymetric scarp separating the WMR from the Mariana Trough, in contrast to that which is seen between the PKR and Parece-Vela Basin ([Okino et al., 1999; Nishizawa et al., 2005;, 2007]), suggesting that the break-up of the Eocene arc was more localized. The structural evolution of the WMR during rifting may be similar to that proposed for the Sumisu Rift in the Izu-Bonin Arc to the north [Taylor et al., 1991]. During early rifting, a half graben formed with synthetically faulted structural rollovers on the hanging wall of a west-dipping fault (see Figure 13 in [Taylor et al., 1991]. This stage is indicated in the seismic data by east-dipping sediment horizons offset by westdipping normal faults (Figures 4.5 and 4.6). As rifting progressed, the basin became more symmetric forming a full graben including antithetic (east-dipping) normal faults. MCS data over the eastern flank of the WMR show rollover to the west and rifted fault blocks to the east. Along Line , late-stage faulting reverses stratigraphic tilting (SP ). In some regions, such as along Line (Figure 4.5B), the secondary rifting stage forms ridges that extend into the Mariana Trough, suggesting 171
185 protracted extension prior to break-up. South of N however, the edge of the WMR is sharper and the overall ridge is narrower (Figure 4.2). The Miocene arc can not be simply reconstructed. The trace of the Pagan Fracture Zone (PFZ), the abyssal hill fabric in the basin, and the residual GPS vectors shown by Kato et al., [2003] are not consistent with opening of the backarc basin as a rigid plate with a single Euler pole (Figure 4.4). Therefore, any rotation around a single pole results in unreasonable reconstructions. The block of rifted arc crust along Line (Figure 4.8) provides one constraint on the eastern boundary of the WMR for basin reconstruction, and suggests that the arc line during the Miocene was west of the modern arc near 17 N. The boundary between rifted arc and backarc basin crust The Mariana Trough is comprised of two distinct crustal types: 1) rifted arc crust and 2) accreted backarc basin crust. The arc crust on both conjugate margins was created since the Eocene by active arc volcanism. It was subsequently faulted and rifted resulting in extension and subsidence. The accreted backarc basin crust in the study area is characterized by a series of linear ridges and valleys forming abyssal hills with large relief typical of slow spreading. On the western margin of the Mariana Trough, we have shown that it is difficult to distinguish between the two crustal types based on seafloor morphology alone and on the eastern margin abyssal hill fabric is buried beneath sediments derived from the active arc. MCS profiles across the eastern and western margins of the Mariana Trough reveal subsurface basement topography and provide structural constraints on the extent of rifted arc crust versus backarc basin crust. 172
186 Although determination of the boundary between rifted arc crust and accreted backarc basin crust is ambiguous based on seismic data alone, our interpretation of basement morphology combined with results from drilling, seismic refraction, and bathymetry surveys allow us to determine the nature of rifting and spreading in the central Mariana system. Results from DSDP Drilling across the central Mariana system DSDP Site 451, located on the eastern side of the West Mariana Ridge, penetrated m of primarily volcaniclastic sediments and sedimentary rocks [Kroenke et al., 1981]. The hole likely terminated in a basalt flow or sill, and did not reach true basement. Hole 451 is located at SP 1580 on Line and penetrates a series of east-dipping, faulted horizons (Figure 4.5 inset). Based on the ages of the deepest sediment (Upper Miocene, ~11-13 Ma), Leg 59 scientists determined that arc volcanic basement was constructed by 11 Ma. Following this, 850 m of volcaniclastic debris accumulated rapidly (~400 m/ma) during a period of intense volcanism [Kroenke et al., 1981]. Faulting and tilting of the sediments occurred, followed by a decrease in accumulation rate of volcanic ash. The most recent sediments are biogenic oozes that drape the seafloor. DSDP Site 453, on the western edge of the Mariana Trough, drilled 605 meters into a sedimented basin near SP 4975 on Line (Figure 4.5C). Leg 60 scientists determined that Site 453 sampled crust from the WMR, and not backarc basin crust, providing a constraint on the extent of rifted arc material on the western margin of the Mariana Trough (Figures 4.2 and 4.4) [Hussong and Uyeda, 1981a]. The site is located 173
187 on the southern edge of a ridge that extends NE from the WMR into the Mariana Trough (Figure 4.2). The gabbros retrieved at the drill site belong to a group that characteristically occurs in calc-alkaline island arcs and the metabasalts are chemically related to rocks drilled on the WMR at Site 451 [Kroenke et al., 1981; Natland, 1981]. Based on hydrothermal alteration of the breccias at temperatures of C, Natland [1981] determined that magmas were likely extruded or intruded near Site 453 during the initial stages of rifting of the Mariana Trough. Site 453 falls within a small, sedimented basin imaged on Line , thereby constraining the arc-backarc boundary on the seismic data (Figure 4.5 inset). Based on the seismic velocities reported for the recovered sections of core, we created a drill section in time that is overlain on the MCS data (Figure 4.5 inset). Unit 1, consisting of muds, silts and sands, corresponds to primarily flat-lying horizons within the basin. The fill is derived from pelagic and hemipelagic sediments, including air-fall tephra [Draut and Clift, 2006]. Compared with other drill sites in the Mariana Trough, Hole 453 is characterized by a decreased volcanic component likely because of its increase in distance from the active arc with the opening of the backarc basin [Hussong and Uyeda, 1981a]. Beneath Unit 1, 114 m of breccia were encountered. Leg 60 scientists determined that this unit was derived from mass wasting from the surrounding ridges. The placement of the drill hole on the new, higher resolution MCS data suggests that Hole 453 did encounter the top of basement, as also shown by Günther et al. [2006]. The presence of exposed arc gabbros beneath the sediments is consistent with the removal of formerly overlying upper crustal rocks by normal faulting during rifting. 174
188 DSDP Drill Site 454, ~20 km west of the Mariana Trough spreading axis ( ~10 km south of SP 3200 on Line ), sampled fresh pillow basalts [Hussong and Uyeda, 1981a] (Figures 4.2 and 4.3B). Site 456, ~30 km east of the axis near SP 4160 on Line 10-13, was drilled into a small sediment pond perched on a bathymetric high (Figures 4.3B and 4.7B). It penetrated hemipelagic and biogenic sediment (i.e., vitric mudstone, tuff, nannofossil ooze and ash) overlying basement composed of hydrothermally altered pillow basalts interbedded with sediments. To the east, Site 455 recovered ~100 m of volcanic muds, sand and ash as well as gravel, mudstone and tuff. It collapsed and was abandoned before basement was reached, therefore drilling results at this site can not be used to constrain the arc-backarc boundary. However, Conrad MCS Lines 47 and 52 (not shown) image a NNW-trending abyssal ridge at N, E (Figure 4.2) (profiles 5 and 6 in [Mrozowski et al., 1981]). Site 455 was drilled on the NE edge of this feature suggesting that it does lie on accreted backarc basin crust. Drilling at Site 457 on the northern flank of Alamagan volcano was unable to penetrate recent pyroclastic sand and ash, and failed to sample the arc substrate [Hussong and Uyeda, 1981a]. The rifted boundaries of the WMR remnant arc Along Line and Conrad Line 55 we see low-angle normal faults at the boundary between the remnant arc and the Mariana Trough (Figure 4.6). To the north and south of MCS Line , between 17º 24 N and 17º 45 N, the rifting-tospreading transition along the western margin of the Mariana Trough is marked in the bathymetry by a NNW-trending low (black, solid line, Figure 4.2). Near 18º N, the low- 175
189 angle normal fault on Line 55 bounds a bathymetric low with a similar trend. At ~17 55 N, the western extent of accreted backarc basin crust is known from drilling at Site 453. In regions where the boundary is well constrained by seismic and drilling results, backarc basin crust is never shallower than 3 km (Figure 4.2). Using this knowledge, along with remnant arc morphology and structure visible in the MCS data, abyssal hill fabric and ridge segmentation, we drew the boundary between WMR rifted arc and accreted backarc basin crust (see Figures 4.2 and 4.4). The width of the zone between the dashed black lines indicates our uncertainty in the position of this boundary. Where the line is solid, it is pinned by MCS data or drilling results. The boundary forms an overall, right-stepping en echelon pattern and extends furthest east into the basin between and N (Figures 4.2 and 4.4). Near N, rifted arc crust on the WMR is constrained by the refraction model of Takahashi et al. [2007]. A low-fold reflection profile collected during their OBS refraction survey crosses the entire central basin (Figures 4.2 and 4.10) [Takahashi et al., 2008]. The eastern portion of the line is coincident with MCS Line This profile allows us to tie the refraction model directly to the reflection data. Given the seafloor fabric visible in plan view, segmentation along the PFZ, and crustal structure, we determined that the most likely location for the eastern rifted arc/backarc boundary is between OBS 41 and 42 where the PFZ intersects the WMR (Figures 4.2 and 4.10). This is west of the pick by Takahashi et al. [2007] which falls near OBS 45. We draw our boundary where the upper crust layer pinches out, whereas Takahashi et al. [2007] place it at the distal edge of a thin wedge of middle crust. The arc-backarc boundary may be an east-dipping interface within the crust, thus accounting for some of the discrepancy 176
190 between the picks. The boundary between the WMR and the Parece Vela Basin occurs between OBS 19 and 20, resulting in an ~118 km wide Miocene arc massif along the WNW line of the refraction section. The WMR narrows to the south and its eastern flank, south of N, is steeper and more abrupt than seen to the north, thus more closely resembles the morphology of the PKR between N (Figure 4.1). The lack of high-resolution bathymetry and MCS data across the western margin of the basin south of N adds uncertainty in determining the arc/backarc boundary (Figure 4.2). The boundary may hug the 4 km contour at the base of the slope; however, it is possible that poorly resolved bathymetric highs south of 14 N are part of the rifted remnant arc. It is also possible that these highs represented rafted pieces of arc material within backarc basin crust. The zero mgal contour of the mantle Bouguer anomaly for the Mariana Trough [Kitada et al., 2006] is consistently west of our interpreted WMR/backarc basin boundary where it is best determined between N (purple lines, Figure 4.4). This suggests that in other areas the boundary is more likely towards the east of the dashed band. The eastern margin of the Mariana Trough MCS and bathymetry data provide some constraints on the boundary between rifted arc and accreted backarc basin crust on the eastern margin of the Mariana Trough. The eastern extent of abyssal hills imaged in the bathymetry and MCS data is indicated by light blue lines in Figure 4.4. Dark blue lines denote the western extent of rifted arc crust where identified in the MCS and/or refraction data. West of West Rota Volcano, 177
191 the normal fault interpreted by Stern et al., [2008] to separate rifted arc crust from accreted backarc basin crust is also shown in dark blue. Overall, the rifted arc-backarc boundary on the eastern margin of the Mariana Trough is less well-constrained than on the western margin and is only clearly defined in one location, just south of 17 N, from Line MCS data and 2- and 3-D refraction models [Takahashi et al., 2007; Calvert et al., 2008] (Figures 4.8 and 4.10). Along MCS Line (Figures 4.3B and 4.8), a west-dipping normal fault (SP 1550) separates shallow accreted backarc basin crust and sediments from rifted arc material. Although there is ~30 km between the easternmost abyssal hill and the fault block on Line 53-54, refraction data suggests that the material directly west of the block is accreted backarc basin crust (Figures 4.8 and 4.10). Based on the refraction models, we interpret the boundary at depth (red, dashed line on Figure 4.8) to be near OBS 70 which falls just east of SP The red arrows on Figure 4.8 indicate the point where the fault plane that forms the sloping boundary between crustal types intersects the top of backarc basin crust. Between ~16 and 18 N, Calvert et al. [2008] estimated the 7.4 km/s isovelocity contour that approximates Moho using both the 2-D refraction model of Takahashi et al. [2007] and their 3-D refraction model. The locations of Moho at 10 km below sea level (bsl) and 12.5 km bsl are shown on Figure 4.4. Moho is resolved at 12.5 km along the entire 3-D survey region; however, it is only defined at 10 km beneath the crustal block on Line [Calvert et al., 2008]. Based on this position, we drew a dashed line parallel to the 12.5 km Moho to approximate a 10 km-depth Moho. Crustal thickness beneath the block is ~7 km, increasing to ~9 km near the 12.5 km Moho. Typical 178
192 backarc basin crust across the Mariana Trough is ~5-6 km thick and only increases to ~7 km thick beneath the spreading axis (Figure 4.10). The contours representing the zero mgal mantle Bouguer anomaly on either side of the Mariana Trough are shown in purple on Figure 4.4 [Kitada et al., 2006]. Based on structural constraints from the MCS data, the work of Stern et al., [2008], gravity and refraction data, we extrapolated the eastern boundary between arc crust and accreted backarc basin crust along-strike of the central Mariana margin (dark blue dashed line on Figure 4.4). All of the data converge at the rifted fault block along Line allowing us to precisely define the arc-backarc boundary at this location. The gravity data is affected by local crustal thickening caused by volcanic edifices and thick volcaniclastic aprons; therefore the zero mgal contour is sometimes further west than our interpretation. We interpret the step in basement near SP 400 on Line (Figure 4.9), which also corresponds to the location of the zero mgal contour, to be the boundary between accreted backarc and rifted arc crust. The rifted fault block imaged on Line is ~30 km to the east, however, there is no additional data that would justify moving the boundary so far arcward. The substrate of the Mariana Arc Our data allow us to determine if the active volcanoes of the central Mariana Arc are built on/through rifted arc crust or accreted backarc basin crust. North of the central Mariana margin, the Miocene arc volcanoes of the Izu-Bonin margin are built on stretched Eo-Oligocene arc crust [Taylor, 1992]. Bloomer et al. [1989] postulated that modern Mariana arc volcanoes are situated on or near the easternmost bounding faults of 179
193 the backarc basin. A recent study determined that this is the case for West Rota Volcano (WRV) located in the southern Mariana system at ~14º 20 N (Figure 4.2) [Stern et al., 2008]. WRV was formed along a NNE-trending normal fault, to the east of a large boundary fault (see Fig. 3 in [Stern et al., 2008]). Stern et al., [2008] interpret these faults to separate rifted frontal arc crust to the east from thin, accreted backarc basin crust to the west. They hypothesize that the felsic magmas erupted from WRV are sourced from the mid-crustal felsic layer beneath the modern arc and FAH (Figure 4.10), implying that the volcano is build on rifted arc crust, along or just east of the arc-backarc boundary. In some regions, such as along Line (Figure 4.8), we have strong evidence that the modern arc is built on rifted arc crust. In contrast, Tracey Seamount, a submarine arc volcano west of Guam [Dixon and Stern, 1983], straddles the arc-backarc boundary (Figure 4.4). Based on the gravity data and bounding faults to the north, we hypothesize that the arc volcano is built at least partially on accreted backarc basin crust; however, we have no MCS data in this region to further support this claim. Arc volcanoes south of 13 N lie very close to the spreading axis and are likely built on accreted backarc basin crust [Fryer et al., 1998; Martinez et al., 2000]. Several cross-chain volcanoes (e.g. West Pagan, West Guguan) also lie near or along the boundary between the two crustal types (Figure 4.4). The westernmost volcano imaged in the MCS data (17º 20 N, E) is located between two linear ridges interpreted to be abyssal hills and is built entirely on accreted backarc basin crust (Figures 4.2 and 4.4). This seamount, visible on MCS Line 50 (not shown), does not show the large volcaniclastic aprons on its flanks that are common to cross-chain and arc volcanoes in this region (Figure 4.7), suggesting that it 180
194 may be a small backarc volcano and not part of an arc cross-chain. Our data show that the main volcanoes of the modern Mariana Arc, north of 14 N, are underlain by rifted arc crust, and do not lie on accreted backarc basin material, implying asymmetry of the central Mariana Trough spreading. Mariana Trough asymmetry Abyssal hill relief in the Mariana Trough decreases rapidly, within ~40 km east of the axis (Figure 4.7). This decrease is more than can be accounted for by subsidence caused by increase in seafloor age and sediment loading. Our data show that there is more accreted backarc seafloor to the west of the Mariana Trough spreading axis than to the east resulting in an asymmetric basin (Figure 4.4). Although the overall basin is asymmetric, MCS profiles across different segments of the Mariana Trough spreading axis show relatively symmetric axial walls and fault distribution; with the exception of the axis along Line (Figure 4.7C). This is inconsistent with the model of asymmetric spreading determined for the slow-spreading Mid Atlantic Ridge [Allerton et al., 2000]. Backarc basins are thought to evolve from highly asymmetric rifting to more symmetric spreading (e.g. [Barker and Hill, 1980; Martinez et al., 1995]). Asada et al. [2007] propose a model for Mariana Trough asymmetry where seafloor accretion along individual spreading segments is primarily symmetric, but repetitive, small-scale ridge jumps to the east results in an overall asymmetric basin. Our data is consistent with progressive ridge jumps to the east. 181
195 Mariana Trough spreading and segmentation MCS profiles across the spreading axis of the Mariana Trough show the variations in spreading center morphology and abyssal hill relief along strike of the basin (Figures 4.7 and 4.8). The depth of the spreading center shallows south of 14.5 N, and abyssal hill fabric overall becomes less symmetric and more subdued. There is very little sediment within km of the axis. Spreading segments and abyssal hill fabrics along the Mariana Trough are roughly perpendicular to the residual plate motion vectors determined by Kato et al. [2003] (black arrows on Figure 4.4), however, there is some degree of obliquity. Abyssal hill fabric is not uniform along-strike of the Mariana Trough, suggesting changes in spreading center orientation and/or spreading direction. Our interpretation of basin segmentation provides further evidence for non-co-polar opening of the Mariana Trough. Between 15.5 N and 17.5 N, we divide the basin into two regions dominated by NNW-SSE and N-S-trending abyssal hill fabric (green line on Figure 4.4). The two predominant abyssal hill trends are separated by what we interpret to be a propagator to the south and the PFZ to the north. The Takahashi reflection line crosses the entire backarc basin and images abyssal hill fabric across the boundary at ~ N that separates the two trends (black arrow on Figure 4.10B). Based on the spreading fabric in this region of the basin and the abyssal hill topography visible in the seismic data, we have interpreted a possible spreading history for the Mariana Trough along the Takahashi profile (Figure 4.10C). Since the magnetic ages in this region are not well known, we use the numbers 1-3 to indicate relative ages, oldest to youngest, and E and W refer to seafloor created to the east and west of the spreading axis. Spreading during time 1 created deep, smooth basement 182
196 on the edges of the basin and during time 2, spreading created NNW-SSE-trending abyssal hill fabric. A possible paleo-spreading axis during time 2 was characterized by relatively symmetric spreading that propagated into existing time 1 crust and rafted 1E east toward the modern arc. Subsequently the spreading center moved (jumped?) arcward and reoriented. Spreading then began along the modern axis creating N-Strending fabric (time 3). Accretion along this segment further isolated 1E, and possibly a portion of 2E, from their conjugates 1W and 2W along the WMR (Figure 4.10C). The Takahashi profile crosses obliquely over two different spreading segments of the Mariana Trough. Although the overall pattern of younger N-S- trending seafloor in between older NNW-SSE- trending abyssal hills would remain the same, spreading along individual segments would appear more symmetric if the profile was perpendicular to the fabric. In support of this model, a NNW-trending abyssal hill imaged on Line 50 (not shown) on the eastern margin of the Mariana Trough is discordant with the strike of the modern spreading axis and conforms to the trend of the fabric near the WMR (Figures 4.2 and 4.4). The presence of this hill suggests that the conjugate of the NNW-trending backarc basin crust along the WMR lies along the modern arc in this region (e.g. 1W and 2W, Figure 4.10). Our interpretation suggests that between the fracture zones at ~15.5 N and 17.5 N the modern spreading center propagated approximately N through preexisting backarc basin crust trending NNW-SSE. Currently, the N-S axis near 17 N appears to be propagating to the south. Many linear volcanic cross-chains, striking ~45-60 to the WMR, appear to be aligned with the trends of Mariana Trough spreading segments suggesting magmatic segmentation (Figure 4.2). Between and 18 N, WMR ridges extend into the 183
197 backarc basin. These ridges, such as the one imaged on Line (Figure 4.5B), represent a zone of extended and intruded arc crust that is indistinguishable from abyssal hill fabric based on seafloor morphology alone (Figures 4.2 and 4.3A). By analogy to the Izu-Bonin arc and rifts [Taylor et al., 1991] we infer that along these ridges, extension is accommodated by arc magmatism rather than backarc spreading. Hydrothermal alteration at DSDP Site 453, at the southern edge of NE-trending ridge (Figure 4.2), is attributed to the extrusion or intrusion of magmas near the drill site during rifting [Natland, 1981]. The western arc-backarc boundary forms an en echelon pattern, stepping to the right across segment boundaries (Figure 4.2). To the north, along the Izu-Bonin arc, a zigzag pattern of half-graben characterizes the Oligocene and Quaternary rifts [Taylor, 1992]. The Izu-Bonin backarc region has not yet progressed to seafloor spreading, and may serve as a model for initial arc rifting along the Mariana Arc (Figure 4.11). In the Izu-Bonin arc, the spacing of the arc volcanoes influences rift basin segmentation by punctuating tectonic extension along strike by magmatic accommodation zones (MAZs) [Taylor et al., 1991] (Figure 4.11A). It appears from the WMR that these MAZs, in turn, transitioned into the magmatic centers of spreading segments (Figure 4.11B). In this, perhaps counter-intuitive interpretation, rift basins are more commonly the sites where spreading segment offsets nucleate, whereas spreading segment centers are sites where magmatism continues from arc volcanism, through rifting to backarc spreading. This correlation is likely dependent on where, along-strike, the arc rifts, which was just on the forearc side of the volcanic front in the case of the WMR. The relationship between MAZs and spreading segment centers is not evident in regions where arcs are less oblique 184
198 (e.g. 18 S Lau, Northern Mariana). In the northern Marianas, not all linear cross-chains along the WMR extend into the backarc basin; however, near 20 N a v-shaped wedge of arc crust protrudes into the basin (see Figure 2 in [Yamazaki et al., 2003]). Active deformation along the margins of the Mariana Trough The flanks and summits of many of the arc volcanoes are deformed by normal faults (e.g. Figures 4.2 and 4.7). This deformation may be caused by flank instability and caldera collapse as well as ongoing extension. Between the volcanic front and the FAH, normal faults trend sub-parallel to the arc (essentially N-S north of 16 N) indicating stretching perpendicular to the arc (Figure 4.2). Active deformation contemporaneous with the buildup of the modern arc is seen as west-dipping normal faults that offset the seafloor on the western flank of both the active volcanic front and the FAH (Figure 4.2). Extension provides pathways for volcanic intrusions (dikes, sills, piercement structures). Indeed, several piercement structures visible in the MCS data along the active arc and FAH are associated with seafloor offsets (Figures 4.2 and 4.4); and sills intrude sediment basins on the eastern margin of Mariana Trough (Figure 4.7). Intrusive volcanism (piercement structures and sills) occurs in a ~60 km-wide zone between the backarc and FAH along Line (Figures 4.4 and 4.7). There are also active faults within sedimented graben along the western margin of the Mariana Trough and the eastern flank of the WMR is deformed by east and westdipping normal faults that reach the seafloor (Figures 4.5 and 4.6). Active normal faulting on both margins of the central Mariana backarc basin suggests that extensional deformation is continuing despite the ongoing accretion at the spreading center, however 185
199 the amount of strain accommodated by these faults is small compared with other marginal basins (c.f. Woodlark, [Taylor et al., 1995]). Conclusions MCS reflection and swath bathymetry data, combined with DSDP drilling and seismic refraction studies define the boundary between rifted arc and accreted backarc basin crust on both sides of the Mariana Trough (Figure 4.4). The boundary is structurally well-constrained on MCS Lines , 55 and (Figures 4.6 and 4.8). On Lines and 55, low-angle (~17-20 ) normal faults form on the eastern margin of the West Mariana Ridge (WMR) where remnant arc crust bounds accreted backarc basin crust. The western extent of backarc basin crust is also constrained by the presence of arc-affinity basement at DSDP drill Site 453 and a recent seismic refraction study across the central Mariana system [Takahashi et al., 2007] (Figure 4.2). Our interpretation suggests that the WMR is ~118 km wide along the refraction line near N. The rifted arc-backarc basin boundary forms an en echelon pattern along the western margin of the Mariana Trough, particularly between and 19 N. In this region, linear volcanic cross-chains behind the WMR are aligned with the trend of Mariana Trough segments and remnant arc ridges extend into the backarc basin. These ridges, such as the one at N imaged on Line (Figures 4.3 and 4.5B, SP ), represent a zone of extended and intruded arc crust. Along the Izu-Bonin arc to the north, magmatic accommodation zones punctuate tectonic extension [Taylor et al., 1991]. The morphology of the WMR suggests that rift basins are more commonly the 186
200 sites where spreading segment offsets nucleate, whereas spreading segment centers are sites where magmatism continues from arc volcanism, through rifting to backarc spreading (Figure 4.11). The summit and eastern flank of the WMR are deformed by both east and westdipping normal faults, many of which reach the seafloor. Thick, pre-rift sediment packages paralleling the flanks of the remnant arc along Line (Figure 4.6B) may represent volcaniclastic deposition on both sides of the Miocene arc. Our data suggest that the Miocene arc rifted slightly on its forearc side. The structural evolution of the WMR during rifting is similar to what is proposed for the Sumisu Rift in the Izu-Bonin Arc to the north [Taylor et al., 1991]. MCS Line (Figure 4.8) and recent refraction studies image a rifted fault block that marks the extent of accreted backarc basin crust on the eastern margin of the Mariana Trough. Our interpretation of the arc-backarc boundary along-strike of the central Mariana margin is constrained by MCS, gravity and refraction data (dashed blue line, Figure 4.4). All of the data converge at the rifted block on Line 53-54, allowing us to accurately define the boundary between rifted arc and accreted backarc crust near 17 N. We show that although some cross-chain volcanoes straddle the boundary between the two crustal types, all of the volcanoes along the volcanic front from N are built on rifted arc crust, implying asymmetry of the Mariana Trough (Figure 4.4). South of 14 N, Tracey Seamount, an arc volcano west of Guam, may be at least partially built on accreted backarc basin crust, as is suggested for the arc volcanoes of the southern Mariana Trough (e.g. [Martinez et al., 2000]). 187
201 The Mariana Trough is opening non-rigidly and is characterized by two predominant abyssal hill trends (NNW-SSE and N-S) separated by a propagator and the eastern portion of the Pagan Fracture Zone. Our interpretation of NNW-SSE-trending fabric on both margins of the Mariana Trough with N-S striking abyssal hills sandwiched in between, suggests that a spreading center propagated approximately north through preexisting backarc basin crust between 15.5 N and 17.5 N. 188
202 Figure 4.1: A. Regional bathymetric location map. PSP = Philippine Sea Plate, PP = Pacific Plate, IBM =Izu-Bonin- Mariana Trenches, MT = Mariana Trough, WMR = West Mariana Ridge, PVB = Parece Vela Basin, PKR = Palau-Kyushu Ridge, WPB = West Philippine Basin. B. Regional bathymetric location map. M = Mariana Trench, M/E = Modern Arc and Eocene Frontal Arc High. Red line = MT spreading axis. Orange line = Mariana Trench. Box locates study area shown in Figure 4.2. Contour interval is 1 km. C. Approximate locations of bathymetry datasets in Figure 4.2. Orange: Center for Coastal and Ocean Mapping, University of New Hampshire (UNH); Blue: JAMSTEC; Green: EW0202/03; Yellow: HAWAII MR-1; Red: NOAA. The maps presented in this paper are illuminated from the east to highlight relief. Lineations subparallel to ship tracks are data artifacts at the edges of bathymetry swaths resulting from slightly different sound speed profiles used for adjacent data. 189

203 190
204 Figure 4.2: Bathymetric map of the central Mariana arc/backarc region from combined surveys, sunlit from the east, showing EW and Conrad seismic lines. Interpreted lines are shown in purple. Sense of motion along faults was determined on the basis of seafloor offset in seismic data and fault scarp geometry in the bathymetry. Contour interval is 1 km. 191

205 192
206 Figure 4.3: Enlarged maps with shot numbers along interpreted MCS lines. Representative morphological features (channels, ridges, dendritic drainage) are labeled. A. WMR lines. Triangles indicate OBS locations. Every tenth OBS is numbered. B. Eastern margin and spreading axis of the Mariana Trough. C. Line Contour interval is 1 km. 193

207 194
208 Figure 4.4: Interpreted map with color bathymetry removed showing the boundaries of the Mariana Trough, basin segmentation and volcanic constructs of the WMR, Modern arc and frontal arc high. Contour interval is 1 km. 195

209 196
210 Figure 4.5: MCS profiles in time over the West Mariana Ridge and western margin of the Mariana Trough. These lines show the thick volcaniclastic cover of the summit and western flank of the WMR, the variable morphology of the eastern flank, and the boundary between rifted arc and accreted backarc basin crust. The WMR is deformed by active and inactive normal faults, both west and east-dipping, and channels. MCS data over the eastern flank of the WMR show rollover to the west and rifted fault blocks to the east. Dashed boxes locate enlarged time sections and DSDP drill sites. The arc/backarc boundary is shown in map view on Figure 2. To the east of the boundary, abyssal hill fabric with a moderate relief of ~0.5 s TWTT is draped by thin sediments. Locations on Figure

211 198
212 Figure 4.6: Time sections of Conrad Line 55 and MCS Line over the summit and eastern flank of the WMR. Line 55 images east-dipping horizons offset by west-dipping normal faults on the rolled-over eastern flank. On Line the lower sediment package represents pre-rift deposition along the WMR. The upper section, underlain by a blue, dashed line, includes syn-rift to recent sedimentation. At the base of the eastern flank on Line , a low angle normal fault (~18-20 ) marks the boundary between the rifted WMR crust and accreted backarc basin crust. A similar feature is imaged within a sedimented basin on Conrad Line 55. East of the low-angle faults, higher angle, east-dipping normal faults offset seafloor. Locations on Figure

213 200
214 Figure 4.7: MCS profiles in time over the spreading axis and eastern margin of the Mariana Trough. These lines image the axial ridge (red arrow) and rift valley of the spreading axis and surrounding abyssal hill fabric. Abyssal hills are onlapped by flat-lying sediments and are buried within ~40 km of the spreading axis. Onlap is indicated by black arrows. Several strong horizons are interpreted to be formed by sills. The top of oceanic crust is shown by dashed blue lines. Along MCS Line 16-19, seismic data below the seafloor multiple has been cut out. Locations on Figure

215 202
216 Figure 4.8: A. Time section of MCS Line which is coincident with the refraction line of Takahashi et al., Abyssal hill fabric is subdued across this segment of the Mariana Trough spreading axis. Sediments onlap an abyssal hill near SP East of the abyssal hill, the top of backarc basin crust may be represented by the strong, flat horizon underlying the sediment package (upper, blue dashed line) however; it is likely that basement occurs deeper in the section near 6 s TWTT (lower, blue dashed line). There is a rifted fault block centered near SP 1650 which separates arc crust from accreted backarc basin crust. The top of the block is indicated by a black, dashed line. B. 3D refraction model extracted along Line 53-54, modified from Figure 10 in Cavert et al., OBS locations from Takahashi et al., 2007 are indicated by green circles and velocities are in km/s. The arc-backarc boundary at depth determined by recent 2D and 3D refraction studies is shown near SP Red arrows indicate the point where the sloping boundary intersects the top of backarc basin crust. Location on Figure

217 204
218 Figure 4.9: Time section of MCS Line Backarc basin crust (dashed blue) shoals to the east and terminates at a westdipping normal fault bounding a basement block (~SP 400). East of the block, a black dashed horizon offset by westdipping normal faults underlies a chaotic sediment package. The high near SP 1050 is a rifted fault block, onlapped by sediment shed from the modern arc. Location on Figure

219 206
220 Figure 4.10: A. 2D Refraction model from Takahashi et al., 2008 across the central Mariana system. B. Refection profile collected during the refraction survey (from Takahashi et al., 2008). The eastern portion of this line is coincident with MCS Line To the west, the profile crosses the West Mariana Ridge at ~17 10N. The arc/backarc boundaries are shown in red. The black arrow indicates the boundary between predominately NNW-SSE-trending abyssal hill fabrics to the west and N-S-trending fabric to the east. C. Profile of abyssal hill fabric and interpreted bathymetry showing a possible spreading history for the basin along the seismic line (see text for details). Red triangles= OBS locations, Red line= spreading axis, Dashed white lines= segment boundaries, Dashed black lines= age boundaries, Dashed orange line= paleospreading axis. Location on Figure

221 208
G 3. AN ELECTRONIC JOURNAL OF THE EARTH SCIENCES Published by AGU and the Geochemical Society
 Geosystems G 3 AN ELECTRONIC JOURNAL OF THE EARTH SCIENCES Published by AGU and the Geochemical Society Article Volume 9, Number 6 10 June 2008 Q06003, doi:10.1029/2007gc001820 ISSN: 1525-2027 Click Here
Plate Tectonics. entirely rock both and rock
 Plate Tectonics I. Tectonics A. Tectonic Forces are forces generated from within Earth causing rock to become. B. 1. The study of the origin and arrangement of Earth surface including mountain belts, continents,
Marine Science and Oceanography
 Marine Science and Oceanography Marine geology- study of the ocean floor Physical oceanography- study of waves, currents, and tides Marine biology study of nature and distribution of marine organisms Chemical
The influence of short wavelength variations in viscosity on subduction dynamics
 1 Introduction Deformation within the earth, driven by mantle convection due primarily to cooling and subduction of oceanic lithosphere, is expressed at every length scale in various geophysical observations.
USU 1360 TECTONICS / PROCESSES
 USU 1360 TECTONICS / PROCESSES Observe the world map and each enlargement Pacific Northwest Tibet South America Japan 03.00.a1 South Atlantic Arabian Peninsula Observe features near the Pacific Northwest
29. IMPLICATIONS OF DEEP SEA DRILLING, SITES 186 AND 187 ON ISLAND ARC STRUCTURE
 29. IMPLICATIONS OF DEEP SEA DRILLING, SITES 186 AND 187 ON ISLAND ARC STRUCTURE John A. Grow 1, Marine Physical Laboratory, Scripps Institution of Oceanography, La Jolla, California INTRODUCTION Pacific
Earth s Continents and Seafloors. GEOL100 Physical Geology Ray Rector - Instructor
 Earth s Continents and Seafloors GEOL100 Physical Geology Ray Rector - Instructor OCEAN BASINS and CONTINENTAL PLATFORMS Key Concepts I. Earth s rocky surface covered by of two types of crust Dense, thin,
Controlled-source electromagnetic imaging of the Middle America Trench o"shore Nicaragua
 Controlled-source electromagnetic imaging of the Middle America Trench o"shore Nicaragua Kerry Key Scripps Institution of Oceanography Collaborators: Samer Naif (SIO, now LDEO), Steven Constable (SIO),
Subduction zones 3 arc magmatism
 5. 3 Subduction zones 3 arc magmatism Where can we observe magmatic/volcanic activities along subduction zones? Characteristics of arc magmatism (vs. mid-ocean ridge/intraplate magmatism) Structure of
Earthquakes. Earthquakes are caused by a sudden release of energy
 Earthquakes Earthquakes are caused by a sudden release of energy The amount of energy released determines the magnitude of the earthquake Seismic waves carry the energy away from its origin Fig. 18.1 Origin
Chapter Overview. Bathymetry. Measuring Bathymetry. Measuring Bathymetry
 CHAPTER 3 Marine Provinces Chapter Overview The study of bathymetry determines ocean depths and ocean floor topography. Echo sounding and satellites are efficient bathymetric tools. Most ocean floor features
Sendai Earthquake NE Japan March 11, Some explanatory slides Bob Stern, Dave Scholl, others updated March
 Sendai Earthquake NE Japan March 11, 2011 Some explanatory slides Bob Stern, Dave Scholl, others updated March 14 2011 Earth has 11 large plates and many more smaller ones. Plates are 100-200 km thick
Bathymetry Measures the vertical distance from the ocean surface to mountains, valleys, plains, and other sea floor features
 1 2 3 4 5 6 7 8 9 10 11 CHAPTER 3 Marine Provinces Chapter Overview The study of bathymetry determines ocean depths and ocean floor topography. Echo sounding and satellites are efficient bathymetric tools.
A) B) C) D) 4. Which diagram below best represents the pattern of magnetic orientation in the seafloor on the west (left) side of the ocean ridge?
 B) C) D) 4. Which diagram below best represents the pattern of magnetic orientation in the seafloor on the west (left) side of the ocean ridge?") 1. Crustal formation, which may cause the widening of an ocean, is most likely occurring at the boundary between the A) African Plate and the Eurasian Plate B) Pacific Plate and the Philippine Plate C)
1. Crustal formation, which may cause the widening of an ocean, is most likely occurring at the boundary between the A) African Plate and the Eurasian Plate B) Pacific Plate and the Philippine Plate C)
Plate Tectonics. Structure of the Earth
 Plate Tectonics Structure of the Earth The Earth can be considered as being made up of a series of concentric spheres, each made up of materials that differ in terms of composition and mechanical properties.
Map shows 3 main features of ocean floor
 Map shows 3 main features of ocean floor 2017 Pearson Education, Inc. Chapter 3 Marine Provinces 2017 Pearson Education, Inc. 1 Chapter 3 Overview The study of bathymetry determines ocean depths and ocean
The Ocean Floor Earth Science, 13e Chapter 13
 The Ocean Floor Earth Science, 13e Chapter 13 Stanley C. Hatfield Southwestern Illinois College The vast world ocean Earth is often referred to as the blue planet Seventy-one percent of Earth s surface
GENERAL GEOLOGY Fall Chapter 18: The Sea Floor. Partial Examination IV Study Guide Dr. Glen S. Mattioli
 GENERAL GEOLOGY 1113-005 Fall 2008 Partial Examination IV Study Guide Dr. Glen S. Mattioli Note that these are NOT questions, but rather are a list of topics that we have covered either in class or are
Backarc basin Spreading axis* Magmatic front. Convecting asthenosphere. Distance from trench (km)
") Backarc basin preading axis M agmatic arc Magmatic front basin Accretionary prism Outer trench high Depth (km) 0 50 00 50 400 Arc crust Lithospheric mantle Indicates feature that may or may not be present
Backarc basin preading axis M agmatic arc Magmatic front basin Accretionary prism Outer trench high Depth (km) 0 50 00 50 400 Arc crust Lithospheric mantle Indicates feature that may or may not be present
Oceanography, An Invitation to Marine Science 9e Tom Garrison. Ocean Basins Cengage Learning. All Rights Reserved.
 Oceanography, An Invitation to Marine Science 9e Tom Garrison 4 Ocean Basins Key Concepts Tectonic forces shape the seabed The ocean floor is divided into continental margins and deep ocean basins The
Unit 6: The Sea Floor
 Unit 6: The Sea Floor Turn to Page 62 in Introduction to the World s Oceans Study the bathymetric chart What features do you see? How do the Atlantic and Pacific Oceans differ? What do you think accounts
Plate Tectonics: A Unifying Theory
 Plate Tectonics: A Unifying Theory What is Plate Tectonics? - 7 large tectonic plates and many smaller ones that break up the lithosphere - Plates are brittle and float on asthenosphere and glide past
Geography of the world s oceans and major current systems. Lecture 2
 Geography of the world s oceans and major current systems Lecture 2 WHY is the GEOMORPHOLOGY OF THE OCEAN FLOOR important? (in the context of Oceanography) WHY is the GEOMORPHOLOGY OF THE OCEAN FLOOR important?
Ocean Basins, Bathymetry and Sea Levels
 Ocean Basins, Bathymetry and Sea Levels Chapter 4 Please read chapter 5: sediments for next class and start chapter 6 on seawater for Thursday Basic concepts in Chapter 4 Bathymetry the measurement of
10. Paleomagnetism and Polar Wandering Curves.
 Map of ocean floor Evidence in Support of the Theory of Plate Tectonics 10. Paleomagnetism and Polar Wandering Curves. The Earth's magnetic field behaves as if there were a bar magnet in the center of
Continental Margin Geology of Korea : Review and constraints on the opening of the East Sea (Japan Sea)
") Continental Margin Geology of Korea : Review and constraints on the opening of the East Sea (Japan Sea) Han-Joon Kim Marine Satellite & Observation Tech. Korea Ocean Research and Development Institute
Continental Margin Geology of Korea : Review and constraints on the opening of the East Sea (Japan Sea) Han-Joon Kim Marine Satellite & Observation Tech. Korea Ocean Research and Development Institute
Lecture 24: Convergent boundaries November 22, 2006
 Lecture 24: Convergent boundaries November 22, 2006 Convergent boundaries are characterized by consumption of oceaninc crust in subduction zones, with attendant arc volcanism, metamorphism and uplift.
Plate Tectonics - Demonstration
 Name: Reference: Prof. Larry Braile - Educational Resources Copyright 2000. L. Braile. Permission granted for reproduction for non-commercial uses. http://web.ics.purdue.edu/~braile/indexlinks/educ.htm
Lecture Marine Provinces
 Lecture Marine Provinces Measuring bathymetry Ocean depths and topography of ocean floor Sounding Rope/wire with heavy weight Known as lead lining Echo sounding Reflection of sound signals 1925 German
Seafloor Morphology. Techniques of Investigation. Bathymetry and Sediment Studies
 Seafloor Morphology I f we select a grid for the surface of the earth (i.e. 5 km 2 ) and assign it an average elevation in relation to sea level, we can construct a graph of elevation versus area of the
Earth. Temp. increases with depth, the thermal gradient is 25 o C/km. Pressure and density also increase with depth.
 Plate Tectonics Earth Earth overall average density = 5.5 g/cm 3. Temp. increases with depth, the thermal gradient is 25 o C/km. Pressure and density also increase with depth. Spheroid: with a longer major
Earth overall average density = 5.5 g/cm 3 Temp increases with depth, the thermal gradient 30 0 C/km Pressure and the density also increase with
 Plate Tectonics Earth Earth overall average density = 5.5 g/cm 3 Temp increases with depth, the thermal gradient 30 0 C/km Pressure and the density also increase with depth Spheroid: with a longer major
Geologic Evolution of Latin America. Plate Tectonics: General Concepts & Applications to Latin America
 Geologic Evolution of Latin America Plate Tectonics: General Concepts & Applications to Latin America Structure of Earth: 3 major divisions of Core, Mantle, and Crust Upper mantle differs in the way that
Senior Thesis THE WEST PACIFIC MARGIN. Thomas R. Gray. Submitted as partial fulfillment of. the requirements for the degree of
 Senior Thesis BACKARC RIFTING AND THE FORMATION OF BACKARC BASINS ALONG THE WEST PACIFIC MARGIN by Thomas R. Gray 1995 Submitted as partial fulfillment of the requirements for the degree of Bachelor of
UNIT 3 GEOLOGY VOCABULARY FLASHCARDS THESE KEY VOCABULARY WORDS AND PHRASES APPEAR ON THE UNIT 3 CBA
 UNIT 3 GEOLOGY VOCABULARY FLASHCARDS THESE KEY VOCABULARY WORDS AND PHRASES APPEAR ON THE UNIT 3 CBA A map that shows Earth s Topographic Map surface topography, which is Earth s shape and features Contour
Earth / Environmental Science. Ch. 14 THE OCEAN FLOOR
 Earth / Environmental Science Ch. 14 THE OCEAN FLOOR The Blue Planet Nearly 70% of the Earth s surface is covered by the global ocean It was not until the 1800s that the ocean became an important focus
Chapter 2. The Planet Oceanus
 Chapter 2 The Planet Oceanus Composition of the Earth The Earth consists of a series of concentric layers or spheres which differ in chemistry and physical properties. There are two different ways to describe
A seismic refraction study of the Cocos plate offshore Nicaragua and Costa Rica Harm Van Avendonk (UTIG, UT Austin)
") A seismic refraction study of the Cocos plate offshore Nicaragua and Costa Rica Harm Van Avendonk (UTIG, UT Austin)! October 18, 2012 "#$%&'($)*!+,!-&./(!01!2/(+! Plate tectonics:!!large fluxes of solids
A seismic refraction study of the Cocos plate offshore Nicaragua and Costa Rica Harm Van Avendonk (UTIG, UT Austin)! October 18, 2012 "#$%&'($)*!+,!-&./(!01!2/(+! Plate tectonics:!!large fluxes of solids
Section 10.1 The Nature of Volcanic Eruptions This section discusses volcanic eruptions, types of volcanoes, and other volcanic landforms.
 Chapter 10 Section 10.1 The Nature of Volcanic Eruptions This section discusses volcanic eruptions, types of volcanoes, and other volcanic landforms. Reading Strategy Previewing Before you read the section,
overlie the seismogenic zone offshore Costa Rica, making the margin particularly well suited for combined land and ocean geophysical studies (Figure
 Chapter 1 Introduction Historically, highly destructive large magnitude (M w >7.0) underthrusting earthquakes nucleate along the shallow segment of subduction zone megathrust fault, and this region of
3. PLATE TECTONICS LAST NAME (ALL IN CAPS): FIRST NAME: PLATES
: FIRST NAME: PLATES") LAST NAME (ALL IN CAPS): FIRST NAME: PLATES 3. PLATE TECTONICS The outer layers of the Earth are divided into the lithosphere and asthenosphere. The division is based on differences in mechanical properties
LAST NAME (ALL IN CAPS): FIRST NAME: PLATES 3. PLATE TECTONICS The outer layers of the Earth are divided into the lithosphere and asthenosphere. The division is based on differences in mechanical properties
caribbean basins, tectonics and hydrocarbons university of texas institute for geophysics
 Copyright by Trevor John Aitken 2005 CENOZOIC STRATIGRAPHIC AND TECTONIC HISTORY OF THE GRENADA AND TOBAGO BASINS AS DETERMINED FROM MARINE SEISMIC DATA, WELLS, AND ONLAND GEOLOGY by Trevor John Aitken,
MARINE GEOLOGY & GEOGRAPHY
 MARINE GEOLOGY MARINE GEOLOGY & GEOGRAPHY Marine Geology 4 LAYERS OF THE EARTH CRUST THICKNESS: VARIES BETWEEN OCEAN & CONTINENTS 5-40 KM STATE: SOLID ELEMENTS: SILICON, ALUMINUM, CALCIUM, SODIUM, POTASSIUM
PLATE TECTONICS. Continental Drift. Continental Drift. Continental Drift. Continental Drift- Wegener s Evidence
 Continental Drift PLATE TECTONICS E.B. Taylor (1910) and Alfred Wegener (1915) published on Continental Drift. Continental Drift Wegener s evidence 1. Fit of the Continents 2. Fossil Evidence 3. Rock Type
ANOTHER MEXICAN EARTHQUAKE! Magnitude 7.1, Tuesday Sept. 19, 2017
 ANOTHER MEXICAN EARTHQUAKE! Magnitude 7.1, Tuesday Sept. 19, 2017 Why is there no oceanic crust older than 200 million years? SUBDUCTION If new oceanic crust is being continuously created along the earth
Plate Tectonics Tutoiral. Questions. Teacher: Mrs. Zimmerman. Plate Tectonics and Mountains Practice Test
 Teacher: Mrs. Zimmerman Print Close Plate Tectonics and Mountains Practice Test Plate Tectonics Tutoiral URL: http://www.hartrao.ac.za/geodesy/tectonics.html Questions 1. Fossils of organisms that lived
Global Tectonics. Kearey, Philip. Table of Contents ISBN-13: Historical perspective. 2. The interior of the Earth.
 Global Tectonics Kearey, Philip ISBN-13: 9781405107778 Table of Contents Preface. Acknowledgments. 1. Historical perspective. 1.1 Continental drift. 1.2 Sea floor spreading and the birth of plate tectonics.
Lecture Outlines PowerPoint. Chapter 13 Earth Science 11e Tarbuck/Lutgens
 Lecture Outlines PowerPoint Chapter 13 Earth Science 11e Tarbuck/Lutgens 2006 Pearson Prentice Hall This work is protected by United States copyright laws and is provided solely for the use of instructors
Chapter 2 Plate Tectonics and the Ocean Floor
 Chapter 2 Plate Tectonics and the Ocean Floor Matching. Match the term or person with the appropriate phrase. You may use each answer once, more than once or not at all. 1. hydrothermal vents A. convergent
Review participation point: The evidence for a fluid outer core is:
 DDA1 Continental Drift to Plate Tectonics PS 100 Chapter 28 Review participation point: The evidence for a fluid outer core is: A. Average density of the earth is greater than the density of the crust.
Late 20 th Century Tests of the Continental Drift Hypothesis
 Late 20 th Century Tests of the Continental Drift Hypothesis 5 Characteristics of the Ocean Trenches Unless otherwise noted the artwork and photographs in this slide show are original and by Burt Carter.
Captain s Tryouts 2017
 Captain s Tryouts 2017 Dynamic Planet Test Written by: Araneesh Pratap (Chattahoochee High School) Name: Date: Answer all questions on the answer sheet. Point values are given next to each question or
Plate Tectonics Lab II: Background Information
 Plate Tectonics Lab II: Background Information This lab is based on a UW ESS101 Lab. Note: Hand in only the Answer Sheet at the back of this guide to your Instructor Introduction One of the more fundamental
Foundations of Earth Science, 6e Lutgens, Tarbuck, & Tasa
 Foundations of Earth Science, 6e Lutgens, Tarbuck, & Tasa Oceans: The Last Frontier Foundations, 6e - Chapter 9 Stan Hatfield Southwestern Illinois College The vast world ocean Earth is often referred
Chapter 10: Volcanoes and Other Igneous Activity Section 1: The Nature of Volcanic Eruptions I. Factors Affecting Eruptions Group # Main Idea:
 Chapter 10: Volcanoes and Other Igneous Activity Section 1: The Nature of Volcanic Eruptions I. Factors Affecting Eruptions Group # A. Viscosity Group # B. Dissolved Gases Group # II. Volcanic Material
24. Ocean Basins p
 24. Ocean Basins p. 350-372 Background The majority of the planet is covered by ocean- about %. So the majority of the Earth s crust is. This crust is hidden from view beneath the water so it is not as
34. THE GEOLOGICAL AND GEOPHYSICAL SETTING NEAR SITE 462 1
 34. THE GEOLOGICAL AND GEOPHYSICAL SETTING NEAR SITE 462 L. K. Wipperman, 2 Hawaii Institute of Geophysics, University of Hawaii, Honolulu, Hawaii R. L. Larson, 3 Lamont-Doherty Geological Observatory
Full file at
 Essentials of Oceanography, 10e (Trujillo/Keller) Chapter 2 Plate Tectonics and the Ocean Floor Match the term with the appropriate phrase. You may use each answer once, more than once or not at all. A)
2 The Geology and Tectonics of the Tohoku Region
 2 The Geology and Tectonics of the Tohoku Region Japan is part of the "Ring of Fire," the belt of earthquakes and volcanic activity that distinguishes the active margins of the Pacific Ocean from the passive
The Sea Floor. Chapter 2
 The Sea Floor Chapter 2 Geography of the Ocean Basins World ocean is the predominant feature on the Earth in total area Northern Hemisphere = 61% of the total area is ocean. Southern Hemisphere = about
Dynamic Crust Practice
 1. Base your answer to the following question on the cross section below and on your knowledge of Earth science. The cross section represents the distance and age of ocean-floor bedrock found on both sides
CONTENT. A. Changes in the Crust Facts Changes Construction and Destruction. B. Continental Drift What is it? Evidence
 Name Earth Science Date Period TOPIC THE DYNAMIC EARTH CONTENT A. Changes in the Crust Facts Changes Construction and Destruction B. Continental Drift What is it? Evidence C. Theory of Plate Tectonics
Lab 1: Plate Tectonics April 2, 2009
 Name: Lab 1: Plate Tectonics April 2, 2009 Objective: Students will be introduced to the theory of plate tectonics and different styles of plate margins and interactions. Introduction The planet can be
Description of faults
 GLG310 Structural Geology Description of faults Horizontal stretch Crustal thickness Regional elevation Regional character Issues Normal Thrust/reverse Strike-slip >1 1 in one direction and < 1 in
Before Plate Tectonics: Theory of Continental Drift
 Before Plate Tectonics: Theory of Continental Drift Predecessor to modern plate tectonics Shape and fit of the continents was the initial evidence Snider-Pelligrini (1858) Taylor (1908) Wegner (1915) Fig.
Plate Tectonics: The New Paradigm
 Earth s major plates Plate Tectonics: The New Paradigm Associated with Earth's strong, rigid outer layer: Known as the lithosphere Consists of uppermost mantle and overlying crust Overlies a weaker region
TAKE HOME EXAM 8R - Geology
 Name Period Date TAKE HOME EXAM 8R - Geology PART 1 - Multiple Choice 1. A volcanic cone made up of alternating layers of lava and rock particles is a cone. a. cinder b. lava c. shield d. composite 2.
The Structure of the Earth and Plate Tectonics
 The Structure of the Earth and Plate Tectonics Structure of the Earth The Earth is made up of 4 main layers: Inner Core Outer Core Mantle Crust Crust Mantle Outer core Inner core The Crust This is where
The Ocean Floor Chapter 14. Essentials of Geology, 8e. Stan Hatfield and Ken Pinzke Southwestern Illinois College
 The Ocean Floor Chapter 14 Essentials of Geology, 8e Stan Hatfield and Ken Pinzke Southwestern Illinois College The vast world ocean Earth is often referred to as the water planet 71% of Earth s surface
NC Earth Science Essential Standards
 NC Earth Science Essential Standards EEn. 2.1 Explain how processes and forces affect the Lithosphere. EEn. 2.1.1 Explain how the rock cycle, plate tectonics, volcanoes, and earthquakes impact the Lithosphere.
Questions and Topics
 Plate Tectonics and Continental Drift Questions and Topics 1. What are the theories of Plate Tectonics and Continental Drift? 2. What is the evidence that Continents move? 3. What are the forces that
Geophysical Constraints on Incoming Plate Hydration
 Geophysical Constraints on Incoming Plate Hydration Douglas A. Wiens Dept. of Earth and Planetary Sciences Washington University, St. Louis, MO, USA Subduction Cycles the Incoming Plate Subduction Input
The Lithosphere and the Tectonic System. The Structure of the Earth. Temperature 3000º ºC. Mantle
 The Lithosphere and the Tectonic System Objectives: Understand the structure of the planet Earth Review the geologic timescale as a point of reference for the history of the Earth Examine the major relief
Origin and Evolution of the Ocean Floor
 Origin and Evolution of the Ocean Floor Outline Mapping the Ocean Floor Continental Margins Origin of Oceanic Lithosphere Structure of Ocean Crust Mapping the ocean floor Depth originally measured by lowering
OCN 201 Seafloor Spreading and Plate Tectonics. Question
 OCN 201 Seafloor Spreading and Plate Tectonics Question What was wrong from Wegener s theory of continental drift? A. The continents were once all connected in a single supercontinent B. The continents
6. In the diagram below, letters A and B represent locations near the edge of a continent.
 1. Base your answer to the following question on the cross section below and on your knowledge of Earth science. The cross section represents the distance and age of ocean-floor bedrock found on both sides
I. Earth s Layers a. Crust: Earth s outside layer. Made of mostly rock. i. Continental: er; made of mostly granite, forms the continents and shallow
 I. Earth s Layers a. Crust: Earth s outside layer. Made of mostly rock. i. Continental: er; made of mostly granite, forms the continents and shallow sea beds, floats! ii. Oceanic: er; dense rock such as
12/3/2014. Plate Tectonics: A Scientific Revolution Unfolds Earth Science, 13e Chapter 7. Continental drift: an idea before its time
 Plate Tectonics: A Scientific Revolution Unfolds Earth Science, 13e Chapter 7 Stanley C. Hatfield Southwestern Illinois College Continental drift: an idea before its time Alfred Wegener First proposed
We A10 12 Common Reflection Angle Migration Revealing the Complex Deformation Structure beneath Forearc Basin in the Nankai Trough
 We A10 12 Common Reflection Angle Migration Revealing the Complex Deformation Structure beneath Forearc Basin in the Nankai Trough K. Shiraishi* (JAMSTEC), M. Robb (Emerson Paradigm), K. Hosgood (Emerson
The Structure of the Earth and Plate Tectonics
 The Structure of the Earth and Plate Tectonics Agree or Disagree? 1. The Earth if made up of 4 different layers. 2. The crust (where we live) can be made of either less dense continental crust or the more
The continental lithosphere
 Simplicity to complexity: The continental lithosphere Reading: Fowler p350-377 Sampling techniques Seismic refraction Bulk crustal properties, thickness velocity profiles Seismic reflection To image specific
Introduction To Plate Tectonics Evolution. (Continents, Ocean Basins, Mountains and Continental Margins)
") Introduction To Plate Tectonics Evolution (Continents, Ocean Basins, Mountains and Continental Margins) Geo 386 (Arabian Shield Course) Dr. Bassam A. A. Abuamarah Mohanna G E O 3 8 6 A R A B I A N G E
Introduction To Plate Tectonics Evolution (Continents, Ocean Basins, Mountains and Continental Margins) Geo 386 (Arabian Shield Course) Dr. Bassam A. A. Abuamarah Mohanna G E O 3 8 6 A R A B I A N G E
Theory of Plate Tectonics
 Plate Tectonics Theory of Plate Tectonics Lithosphere is made of sections called plates that move around called continental drift Plates move because they float on the asthenosphere Most plates consist
L.O: THE CRUST USE REFERENCE TABLE PAGE 10
 USE REFERENCE TABLE PAGE 10 1. The oceanic crust is thought to be composed mainly of A) granite B) sandstone C) basalt D) rhyolite 2. To get sample material from the mantle, drilling will be done through
Earth Science, (Tarbuck/Lutgens) Chapter 10: Mountain Building
 Chapter 10: Mountain Building") Earth Science, (Tarbuck/Lutgens) Chapter 10: Mountain Building 1) A(n) fault has little or no vertical movements of the two blocks. A) stick slip B) oblique slip C) strike slip D) dip slip 2) In a(n) fault,
Earth Science, (Tarbuck/Lutgens) Chapter 10: Mountain Building 1) A(n) fault has little or no vertical movements of the two blocks. A) stick slip B) oblique slip C) strike slip D) dip slip 2) In a(n) fault,
What Forces Drive Plate Tectonics?
 What Forces Drive Plate Tectonics? The tectonic plates are moving, but with varying rates and directions. What hypotheses have been proposed to explain the plate motion? Convection Cells in the Mantle
MULTIPLE CHOICE. Choose the one alternative that best completes the statement or answers the question.
 Geology 300, Physical Geology Spring 2019 Quiz Chapter 18, Seafloor Name MULTIPLE CHOICE. Choose the one alternative that best completes the statement or answers the question. 1) Abyssal fans are made
Divergent Boundaries: Origin and Evolution of the Ocean Floor
 1 2 3 4 5 6 7 8 9 10 11 12 Divergent Boundaries: Origin and Evolution of the Ocean Floor Earth, 12 th Edition, Chapter 13 Chapter 13 Divergent Boundaries From 1872 to 1876, the HMS Challenger expedition
Continental Drift and Plate Tectonics
 Continental Drift and Plate Tectonics Continental Drift Wegener s continental drift hypothesis stated that the continents had once been joined to form a single supercontinent. Wegener proposed that the
Structure of the Earth
 Structure of the Earth Compositional (Chemical) Layers Crust: Low density Moho: Density boundary between crust and mantle Mantle: Higher density High in Magnesium (Mg) and Iron (Fe) Core: High in Nickel
ARE YOU READY TO THINK? Look at the first slide THINK PAIR SHARE!
 ARE YOU READY TO THINK? Look at the first slide THINK PAIR SHARE! WHAT PROMINENT FEATURE CAN YOU IDENTIFY IN THIS PICTURE? What do you think the different colors represent? Who might find such a picture
Drilling into the Memory of the Earth An Introduction to International Ocean Discovery Program
 Drilling into the Memory of the Earth An Introduction to International Ocean Discovery Program Y. Tatsumi (Dept. Earth & Planetary Sciences) Why is this planet to be the Earth? This is a fundamental question
Introduction to Subduction Zones
 PAGEOPH, Vol. 128, Nos. 3/4 (1988) 0033~4553/88/040449-0551.50 + 0.20/0 9 1988 Birkh/iuser Verlag, Basel Introduction to Subduction Zones LARRY J. RUFF j and HIROO KANAMORI 2 Subduction zones present many
The Dynamic Crust 2) 4) Which diagram represents the most probable result of these forces? 1)
 4) Which diagram represents the most probable result of these forces? 1)") 1. The diagrams below show cross sections of exposed bedrock. Which cross section shows the least evidence of crustal movement? 1) 3) 4. The diagram below represents a section of the Earth's bedrock. The
1. The diagrams below show cross sections of exposed bedrock. Which cross section shows the least evidence of crustal movement? 1) 3) 4. The diagram below represents a section of the Earth's bedrock. The
Plate Tectonics: A Scientific Revolution Unfolds
 Chapter 2 Lecture Earth: An Introduction to Physical Geology Eleventh Edition Plate Tectonics: A Scientific Revolution Unfolds Tarbuck and Lutgens From Continental Drift to Plate Tectonics Prior to the
Copyright McGraw-Hill Education. All rights reserved. No reproduction or distribution without the prior written consent of McGraw-Hill Education
 Copyright McGraw-Hill Education. All rights reserved. No reproduction or distribution without the prior written consent of McGraw-Hill Education Tibetan Plateau and Himalaya -southern Asia 11.00.a VE 10X
Crustal structure and deformation at the northern Manila Trench between Taiwan and Luzon islands
 Available online at www.sciencedirect.com Tectonophysics 466 (2009) 229 240 www.elsevier.com/locate/tecto Crustal structure and deformation at the northern Manila Trench between Taiwan and Luzon islands
Earth as a planet: Interior and Surface layers
 Earth as a planet: Interior and Surface layers Bibliographic material: Langmuir & Broecker (2012) How to build a habitable planet Internal structure of the Earth: Observational techniques Seismology Analysis
Practice Questions: Plate Tectonics
 Practice Questions: Plate Tectonics 1. Base your answer to the following question on The block diagram below shows the boundary between two tectonic plates. Which type of plate boundary is shown? A) divergent
Strike-Slip Faults. ! Fault motion is parallel to the strike of the fault.
 Strike-Slip Faults! Fault motion is parallel to the strike of the fault.! Usually vertical, no hanging-wall/footwall blocks.! Classified by the relative sense of motion. " Right lateral opposite block