Paired measurements of foraminiferal delta 18 O and Mg/Ca ratios of Indian monsoons reconstructed from Holocene to Last Glacial record
|
|
|
- Beatrix Stevens
- 5 years ago
- Views:
Transcription
1 Author version: Acta Geol. Sinica, vol.85; 2011; Paired measurements of foraminiferal delta 18 O and Mg/Ca ratios of Indian monsoons reconstructed from Holocene to Last Glacial record MAHESH Badanal 1,*, BANAKARVirupaxa 1, BURR George 2 1 National Institute of Oceanography (CSIR), Dona Paula, Goa , India; * Corresponding author. mahe687@gmail.com 2 NSF-Arizona AMS Facility, 1118 East 4 th Street, Tucson, AZ , USA Abstract: The effect of seasonally reversing monsoons in the northern Indian Ocean is to impart significant changes in surface salinity (SS). Here, we report SS changes during the last 32 kyr in the Lakshadweep Sea (southeastern Arabian Sea) estimated from paired measurements of δ 18 O and sea surface temperature (SST) utilizing Globigerinoides sacculifer, an upper mixed layer dwelling foraminifera. The heaviest δ 18 O G.sacculifer (- 0.07±0.08 ) is recorded between ka BP, which could be defined as the last glacial maximum (LGM). The δ 18 O G.sacculifer shift between the LGM and Holocene is The SST shows an overall warming of 2 C from the LGM to Holocene (28 C to 30 C). However, coldest SSTs are observed prior to LGM, i.e., ~27 ka BP. The SS was higher (~ 38 psu) throughout most of the recorded last glacial period ( ka BP). This high salinity together with generally lower SSTs suggests a period of sustained weaker summer or stronger winter monsoons. The deglacial warming is associated with rapid reorganization of monsoons and is reflected in decreased salinity to a modern level of ~ 36.5 psu, within a period of ~ 5 kyr. This indicates intensification of summer monsoons during cold to warm climate transition. Key words: Paleoclimate, Arabian Sea, Oxygen isotopes, Mg/Ca Thermometry, Monsoon variability.
2 1 Introduction Semiannually reversing monsoon winds over the Arabian Sea (AS) modulate SST, SS and productivity in space and time (Wyrtki, 1973). Modeling results have shown that an increase in monsoon wind intensity, whether summer or winter, induces surface cooling along with increased productivity in the AS (Murtugudde et al., 2007). The SS structure in the Eastern AS (EAS) is largely dictated by the presence of low-salinity tongue extending upto 15 N latitude (Fig. 1). The summer monsoons during interglacial periods were stronger than the glacial periods during which the winter monsoons were probably overwhelming (Banakar et al., 2005; Reichart et al., 1998; Emeis et al., 1995; Rostek et al., 1993; Anderson and Prell, 1993; Clemens and Prell, 1990; Prell and Van Campo, 1986; Duplessy, 1982). The robust proxy to monitor monsoon intensity could be the variation in SS as it instantly responds to changes in evaporationprecipitation. The SS can be reconstructed from the δ 18 O of seawater. The SST is an important component to be corrected while estimating δ 18 O of seawater from foraminiferal calcite. Reliable SSTs can be obtained using Mg/Ca ratios in planktonic foraminifera (Bijma et al., 1990; Bemis et al., 1998; Nurnberg et al., 1996; Elderfield and Ganssen, 2000). Only few SST estimates from the Mg/Ca method are available for the AS (Anand et al., 2008; Saher et al., 2007; Dahl and Oppo, 2006). In this paper we report the past-sst and -SS variations in the southeastern AS (Lakshadweep Sea) utilizing G. sacculifer picked from a sediment core and discuss their implication with respect to monsoon variability. 2 Materials and Method An upper 150 cm section of a 552 cm long sediment core (SK129-CR05) retrieved on board ORV Sagar Kanya at 9 o 21 N; 71 o 59 E (Lakshadweep Sea: off Kochi, India) from a water depth of 2300 m (Fig. 1) is used for the present study. The sediment core was sub-sampled at 2 cm intervals except for the top peneliquid section, which was 4 cm thick. The calendar ages for the core are based on ten AMS- 14 C dates measured at the NSF-AMS facility, University of Arizona, USA. The radiocarbon dates were corrected for local reservoir age (600 yrs) ( and converted to calendar ages using the CalPal2007_HULU calibration (Danzeglocke et al., 2007). The last dated section ( cm) has yielded an age of ± 386 cal y BP. The age of the core-top section (0-4 cm) is 3048 ± 67 cal y BP (Fig. 2). Around one hundred G. sacculifer tests (without terminal sac, size: μm) from each section were handpicked under a binocular microscope. The tests were broke-open by gently pressing between two glass plates and homogenized with a fine brush. One third of the aliquot was used for oxygen isotope analysis and the remaining two third was subjected to cleaning required before Mg/Ca measurement. We have selected this particular species since the G. sacculifer is not only less susceptible to dissolution as compared to other planktonic species (Dekens et al., 2002; Delaney et al., 1985), but also the inter-chamber distribution of Mg/Ca is nearly uniform (Eggins et al., 2003). The SSTs were estimated using Dekens et al. (2002) G.sacculifer TROPICAL PACIFIC calibration (Mg/Ca = 0.37 exp 0.09[T 0.36(core depth in km) - 2 C]). This calibration is favored because the ocean-atmosphere coupled processes over the northern Indian Ocean are similar to that of the western tropical Pacific warm-pool (Webster and Fasullo, 2002). The Mg/Ca analyses were done at the ICP-OES laboratory of the National Institute of Oceanography (Goa), India. The oxygen isotope measurements were done at the Godwin Laboratory for Paleoclimate Research, University of Cambridge, UK. The measured 18 O/ 16 O ratios are expressed as δ 18 O with reference to Vienna Pee Dee Belemnite (PDB). The precision of the δ 18 O measurements was ± Previously published organic-carbon and -nitrogen data for the same sediment core (Pattan et al., 2003) were utilized to assess the monsoon-productivity relationship in the study region.
3 The cleaning steps for Mg/Ca analysis were performed following the method described by Barker et al. (2003). In brief, the stained and oxide-coated calcite fragments, visible clay lumps, and mineral grains were physically separated from the crushed aliquot and discarded. The clean fragments were washed five times with deionized water followed by methanol to remove clays. Organic coating was removed by treating the fragments with a buffered H 2 O 2. The predissolution Mg-polishing was done using M HNO 3. Before the dissolution in 1.5 ml of 0.75 M HNO 3, the fragments were examined under the microscope to ensure that only the clean calcite was taken for dissolution. As the Mn-coated and stained fragments were removed initially, the oxide removal step was not incorporated. Finally the solution was centrifuged at ~ 10,000 rpm in order to eliminate even faint possibility of contamination by sub-micron (very fine) clay suspension. All reagents used were of supra-pure quality. The solutions were analyzed on a Perkin-Elmer Optima 2000 DV ICP- OES calibrated with five multi-element calibration standards. The Mg/Ca ratios were obtained following the intensityratio calibration techniques described by DeVilliers et al. (2002). A quality control (QC) solution of Mg/Ca (= mmol/mol) was analyzed after every 6 samples. The analytical error for Mg/Ca was within ± 0.6 %. The long-term average of QC (n = 67) measured during the analytical period yielded a mean of ± mmol/mol. The error on long term average of QC is 1.9 %. The Fe, Mn and Al were also measured to monitor the contamination. The scatter plots of Fe/Ca, Al/Ca and Mn/Ca (mmol/mmol) vs. Mg/Ca (mmol/mol) yielded insignificant correlations (R 2 = 0.011; and 0.178) suggesting that the measured Mg/Ca ratios were free from contamination. Local SS was estimated from the residual δ 18 Ο seawater. The residual δ 18 Ο seawater was calculated from the δ 18 Ο G.sacculifer using Epstein et al. (1953) equation after subtracting the contribution from global ice volume (Shackleton, 2000) and measured SST. The residual δ 18 Ο seawater was translated into salinity using Dahl and Oppo (2006) empirical equation. However, Rohling et al. (2000) have demonstrated that salinity estimation from seawater δ 18 O is less reliable than δ 18 Ο seawater itself. Therefore, we place more emphasis on estimated δ 18 Ο seawater than on the estimated salinity. The error on the salinity estimate is ±0.2 psu, hence we discuss only those SS variations which are above this limit. 3 Results and Discussions Based on the depth variation of δ 18 Ο G. sacculifer, the beginning of Holocene is recorded at 37 cm depth dating to 12 ka BP. The beginning of deglaciation occurs at a depth of 57 cm (~16 ka BP). The Marine Isotope Stage (MIS) 3/2 boundary is evident at 121 cm depth dating to 29 ka BP (Fig. 2). The LGM-Holocene δ 18 Ο G.sacculifer difference is This δ 18 Ο gradient incorporates 1.2 changes due to expanded global ice sheets during the glacial maximum and the remainder of 0.87 should therefore indicates changes in the local SS and SST. Conventionally, the recent-most heaviest δ 18 Ο G.sacculifer event has been considered as the LGM. Instead, we have defined the LGM as a period recording the heaviest δ 18 Ο G.sacculifer (-0.07 ) within the measurement precision band of ± 0.08 that covers a time-span of ka BP. A similar observation has been made by Banakar et al. (2010) in another sediment core from the EAS. The δ 18 Ο G.sacculifer transition from LGM to Holocene occurs as a rapid negative excursion beginning at 16 ka BP, leading into Holocene-minimum at 12 ka BP. The timings of LGM/Holocene and MIS-3/2 boundaries and the beginning of deglaciation are nearly consistent with the LR04 benthic δ 18 Ο stack (Lisiecki and Raymo, 2005). The overall Mg/Ca varies between 3.1 and 4.5 mmol/mol, which translate into SST change of 27 C to 30 C. The SST obtained for core-top section (3.05 ka BP) is 30 o C (Fig. 3) and is comparable to the modern SST at the core location, which falls in the equatorial warm-pool (Fig.1: The warmest average SST (~ 30 C) is recorded during most of the Holocene and the colder SST (~ 28 C) during the LGM and the coldest (~ 27 C) during
4 the late MIS-3 and early MIS-2 (32 24 ka BP). The observed SST increase of 2 o C from LGM to Holocene is comparable with previously published SST gradients of 2-3 o C in the AS (Banakar et al., 2010; Saraswat et al., 2005; Rostek et al., 1993). The time-series of SST exhibits step-increase from the coldest conditions (27 C) to attain warmest Holocene conditions (~ 30 C) at ~12 ka BP. The LGM SSTs show a fluctuation of 1 o C around an average of ~28 C (Fig. 3). Within the warm Holocene, an event of SST lowering of ~ 1 C is recorded between 8.5 and 9.5 ka BP (Fig. 3) and is closely comparable with previous observation in the EAS (Banakar et al., 2010). This SST cooling within the Holocene appears to be a regional feature occurring across the AS, which has been interpreted as the surface cooling resulting from intensified monsoons (Dahl and Oppo, 2006; Overpeck et al., 1996). There are three distinct warming events recorded within the LGM climate at ~ 21, ~ 18 and ~ 16 ka BP, which exhibit ~ 1 C elevated SSTs above the average LGM SST of ~ 28 C (Fig. 3). These warming events are similar to the warming events observed in western AS (WAS; Saher et al., 2007) though with some timing offsets. Intermittent weakening of winter winds, reduced upwelling in WAS, and inflow of warm water of South Equatorial origin have been invoked as the cause for these SST warming events (Saher et al., 2007). The winters during glacial periods are expected to be more intense and prolonged than during the interglacial times. The winter monsoon winds have profound influence on the SSTs of the AS under glacial conditions (Duplessy, 1982; Fontugne and Duplessy, 1986) and hence increased SSTs during the LGM period at the outset might suggest weakening of glacial winters. However, the C/N ratios (Fig. 4) do not clearly reflect any change expected during the period of weakened winter winds. Therefore, these warm-sst events within the LGM warrant detailed explanation that is presented in later part of the discussion. Though the LGM SSTs were colder by ~ 1.5 C as compared to Holocene average SST, the coldest SSTs (~27.5 C) are observed at ka BP, i.e., prior to LGM. The lowest SSTs prior to LGM (late MIS 3 and early MIS 2) might have been the result of major cooling in response to most intense winter winds. A recent study of Clark et al. (2009) has show that the growth of global ice sheets to their maximum has occurred between ~33 and 26.5 ka and sustained at their maximum growth until ~20 ka. That is, the time period between 26.5 and 20 ka appears to be the actual global glacial maximum. The coldest SSTs observed during 32 to 25 ka BP in the present record may indicate influence of global climate cooling. However, such cooling appears unlikely in the present case because winter winds should have been most intense leading to increased basin-wide evaporation resulting in increased SS. On the contrary, the SS does not show any significant increase during ka BP and remains nearly uniform around 37 psu until the beginning of deglaciation (Fig. 3). This observation suggests that the observed coldest SSTs were probably the result of intense upwelling in the EAS. This interpretation could be supported by an increased flux of biogenic-calcite and opal during late MIS 3 recorded in the same sediment core (Pattan et al., 2003). The marginal fluctuations in SS prior to LGM may indicate intermittently varied upwelling primarily from the upper thermocline that consist mainly high salinity water originated in northern AS (Prasanna Kumar and Prasad, 1999). The role of low-salinity water inflow from the Bay of Bengal dictating observed SS fluctuations may be ruled out during this time as it was significantly reduced during the last glacial period (Chodankar et al., 2005). The C/N ratios are ~ 8 throughout the Holocene and reach values up to 14 during the late MIS 3 (Pattan et al., 2003), which also records minimum SST. The Redfield ratio of C/N in marine organic matter is ~ 7 and >20 for terrestrial organic matter (Meyers, 1994). The diagenetic alteration of organic matter may also cause a variation in C/N ratios. However, the strong positive correlation between the C and N (r = 0.81; n = 39, Fig. 5) rules out such alteration possibility. Hence, the higher C/N ratios during late MIS 3 must have been caused by increased abundance of terrestrial
5 organic matter in the sediment. From the X-Y plot of SST and SS against the C/N ratios (Fig. 6), it is observed that higher SSTs and lower SS correspond to lower C/N ratios and vice-versa. This in turn suggests that the relative strength of monsoon winds controls the variation of sedimentary C/N ratios in the EAS. The elevated C/N ratios during the glacial period are expected, as the glacial winter winds (land towards sea) might have been intense resulting in increased transfer of terrestrial organic matter in to the EAS (Banakar et al., 2005). An inverse relationship between SST and C/N ratios confirm that the most intense winter winds prevailed prior to LGM during which an upwelling event is also evident. The coherent association of C/N ratios with SSTs (r = 0.83) further strengthen the interpretation that stronger winter winds prevailed during the late MIS 3. The lower C/N ratios associated with higher SSTs of the Holocene indicate the dominance of summer monsoons over winter monsoons leading to reduction in high C/N terrestrial organic matter in the sediment. The SS estimated for the core-top section is 35.1 psu, which is similar to the modern SS at the core location (Fig. 1). The average Holocene SS is ~ 35.2 psu, while it is 37.2 psu for the last glacial period. The SS time series shows marginal variation of ± 0.2 psu during the Holocene. The overall glacial-interglacial variability in SS is ~ 2 psu, which is comparable with the previously observed SS gradient in the EAS (Banakar et al., 2010). The SS reaches the Holocene plateau at ~ 10 ka BP, i.e., 3 ka later than the SST maximum. The decreasing trend of SS started at ~ 18 ka BP, which is consistent with the beginning of deglaciation in LR04 Benthic record of Lisiecki and Raymo (2005). Also, the deglaciation and the Holocene plateau in SS trends follow the LR04 records. Based on the observations made from the SS time-series (Fig. 3), it can be inferred that the E-P in the EAS has varied marginally during the Holocene. Within the LGM, the SS time-series shows distinct increase in salinity by about 0.2 to 0.6 psu occurring concurrently with the SST warming events of 21, 18 and 16 ka BP (Fig. 3). The coupled increases of SST and SS during the above events suggest distinctly different E-P balance than generally expected. In the modern or Holocene climate set-up the increased SSTs are associated with intensified summer monsoons, i.e., increased freshwater flux resulting in basin-wide decrease in the SS. We examine this set-up in light of previously suggested mechanism of warm-sst events within the cold LGM (Saher et al., 2007). The advection of south equatorial warm water into the EAS although can warm the SST, but cannot enhance the salinity because it is inherently less-saline water. If the warm-sst events were the result of intermittent weakening of the winter monsoons then also the salinity would decrease because of reduced evaporation. Interestingly, a recent study has identified regional sub-surface temperature inversion in the present study area (Lakshadweep Sea), where the sub-surface (~40 m) is warmer than the surface water (temperature inversion) and also saltier (see Nisha et al., 2009). Assuming an existence of this sub-surface temperature and salinity inversion during the LGM, the coupled increases in SST and SS in the Lakshadweep Sea may suggest vigorous mixing of subsurface water with the surface layer. Durand et al. (2004) estimated that the heat trapped in the subsurface inversion in the Lakshadweep Sea could result in regional SST warming of over 1 o C due to mixing. Therefore, the observed coupled increases in SST and SS at 21, 18 and 16 ka may indicate relatively intensified summer winds (intensified sub-surface mixing) within the LGM. We examined the relationship of SST and SS with δ 18 Ο G.sacculifer (Fig. 7). The SS association is found to be highly coherent and significant with δ 18 O G.sacculifer (r = 0.94; n=73), while SST exhibits relatively less coherency (r = 0.60; n = 73). This observation suggests that the SST variability was mostly due to changes in local processes. The general trend of the SS time-series overlapping the δ 18 Ο G.sacculifer time-series as well as the LR04 benthic oxygen isotope records indicate a close relationship between the evolution of SS and global ice-volume. However, the influences of local processes are also evident which are reflected as short-term distinct increases in SS during the glacial period as described above.
6 4 Conclusions The SST time-series for Lakshadweep Sea (southeastern Arabian Sea) does not exhibit distinct glacial-interglacial variability suggesting dominance of local processes. The coupled increase in SST and SS within the LGM appears to be the result of mixing of warmer and saltier sub-surface water. Lowest SSTs prior to LGM likely indicate an intense upwelling. The SST cooling at ~ 9 ka BP within the warm Holocene is consistent with previous observation and indicates intensified monsoon winds. Our reconstructions indicate that the latest Holocene (3-4.7 ka BP) has witnessed rapid fluctuation in the summer monsoon intensity as evident in concomitant cooling of SST, lowering of SS, and decreasing δ 18 Ο G.sacculifer. Acknowledgement The samples used in this study were collected during the Cobalt-Crust cruises funded by the Ministry of Earth Sciences. The National Institute of Oceanography provided all logistic support. De-Martino Mitzi of Arizona University carried out AMS-radiocarbon measurements and Mike Hall of Cambridge University measured the oxygen isotopes. The useful comments by the anonymous reviewers are acknowledged. MB thanks EMR-CSIR for Junior/Senior Research Fellowship. This is NIO Contribution No:.. References Anand, P., Kroon, D., Singh, A.D., Ganeshram, R.S., Ganssen, G., and Elderfield, H., Coupled sea surface temperature seawater δ 18 O reconstructions in the Arabian Sea at the millennial scale for the last 35 ka. Paleoceanography. 23: PA4207, doi: /2007PA Anderson, M.D., and Prell, L.W., A 300 ka record of upwelling off Oman during the Late Quaternary: Evidence of the Asian Southwest monsoon. Paleoceanography, 8: Banakar, V.K., Mahesh, B.S., and Burr, G., Climatology of the Eastern Arabian Sea during the last glacial cycle reconstructed from paired measurement of foraminiferal δ 18 O and Mg/Ca. Quaternary Research, doi: /j.yqres Banakar, V.K., Oba, T., Chodankar, A.R., Kuramoto, K., Yamamoto, M., and Minagawa, M., Monsoon related changes in sea surface productivity and water column denitrification in the Eastern Arabian Sea during last glacial cycle. Marine Geology, 219: Barker, S., Greaves, M., and Elderfield, H., A study of cleaning procedure used for foraminiferal Mg/Ca paleothermometry. Geochemistry Geophysics Geosystems, 4: doi: /2003GC Bijma, J., Faber, Jr W.W., and Hemleben, C., Temperature and salinity limits for growth and survival of some planktonic foraminifers in laboratory cultures. Journal Foraminiferal Research, 20: Bemis, B.E., Spero, H.J., Bijma, J., and Lea, D.W., Re-evaluation of the oxygen isotopic composition of planktonic foraminifer: Experimental results and revised paleotemperature equations. Paleoceanography, 13: Chodankar, A.R., Banakar, V.K., and Oba, T., Past 100 ka surface salinity gradient response in the Eastern Arabian Sea to the summer monsoon variation recorded by δ 18 O of G. sacculifer. Global Planetary Change, 47: Clark, P. U., Dyke, A. S., Shakun, J. D., Carlson, A. E., Clark, J., Wohlfarth, B., Mitrovica, J., Hostetler, S. W., and McCabe, A. M., The Last Glacial Maximum. Science, 325: 710 DOI: /science Clemens, S.C., and Prell, W.L., Late Pleistocene Variability of Arabian Sea Summer Monsoon Winds and Continental Aridity: Eolian Records from the Lithogenic Component of Deep-Sea Sediments. Paleoceanography, 5:
7 Dahl, A,K., and Oppo, D.W., Sea surface temperature pattern reconstructions in the Arabian Sea. Paleoceanography, 21: PA1014, doi: /2005PA Danzeglocke, U., Jöris O and Weninger B CalPal-2007 online DeVilliers, S., Greaves, M., and Elderfield, H., An intensity ration calibration method for the accurate determination of Mg/Ca and Sr/Ca of marine carbonates by ICP-AES. Geochemistry Geophysics Geosystems, 3: 2001GC Dekens, P.S., Lea, D.W., Pak, D.K., and Spero, H.J., Core-top calibration of Mg/Ca in tropical foraminifera: Refining paleotemperature estimation. Geochemistry Geophysics Geosystems, 3: 1022, doi: /2001gC Delaney, M.S., Be, A.W., and Boyle, E.A Li, Sr, Mg and Na in foraminiferal calcite shells from laboratory culture, sediment traps and sediment cores. Geochimca et Cosmochimica Acta, 49: Duplessy, J.C., Glacial to interglacial contrast in the northern Indian Ocean. Nature, 295: Durand, F., Shetye, S. R., Vialard, J., Shankar, D., Shenoi, S. S. C. Ethe, C., and Madec, G., Impact of temperature inversions on SST evolution in the South Eastern Arabian Sea during the pre summer monsoon season. Geophysical Research Letters, 31: L01305, doi: /2003gl Eggins, S., Deckker, P., and Marshall, J., Mg/Ca variation in planktonic foraminifera tests: Implications for reconstructing palaeo-seawater temperature and habitat migration. Earth Planetary Science Letters, 212: Elderfield, H., and Ganssen, G., Past temperature and salinity using δ 18 O of surface ocean water inferred from foraminiferal Mg/Ca ratios. Nature, 405: Emeis, K.C., Anderson, D.M., Doose, H., and Schulz, D., Sea-Surface Temperatures and the History of Monsoon Upwelling in the Northwest Arabian Sea during the Last 500,000 Years. Quaternary Research, 43: Epstein, S., Buchsbaum, R., Lowenstam, A., and Urey, H.C., Revised carbonate-water isotopic temperature scale. Bulletin of Geological Society of America, 64: Fontugne, M.R., and Duplessy, J.C., Variations of the monsoon regime during the upper Quaternary: Evidence from carbon isotopic record of organic matter in north Indian Ocean sediment cores. Palaeogeography Palaeoclimatology Palaeoecology, 56: Lisiecki, L.E., and Raymo, M.E., A Pliocene-Pliestocene stack of 57 globally distributed benthic δ 18 O records. Paleoceanography, 20: PA1003: doi: /2004PA Meyers, P.A., Preservation of elemental and isotopic identification of sedimentary organic matter. Chemical Geology, 144: Murtugudde, R., Seager, R., and Thoppil, P., Arabian Sea response to monsoon variations. Paleoceanography, 22: doi: /2007PA Nisha, K., Suryachandra A. R., Gopalakrishna, V. V., Rao, R. R., Girishkumar, M. S., Pankajakshan, T., Ravichandran, M., Rajesh, S., Girish, K., Johnson, Z., Anuradha, M., Gavaskar, S. S. M., Suneel, V., Krishna, S. M., Reduced Near-Surface Thermal Inversions in in the Southeastern Arabian Sea (Lakshadweep Sea). Journal of Physical Oceanography, 39: Nürnberg, D., Bijma, J., and Hemleben, C., Assessing the reliability of magnesium in foraminiferal calcite as a proxy for water mass temperatures. Geochimica et Cosmochimica Acta, 60: Overpeck, J.T., Anderson, D.M., Trumbore, S., and Prell, W.L., The southwest Indian monsoon over the last 18,000 years. Climate Dynamics, 12: Pattan, J.N., Masuzawa, T., Naidu, P.D., Parthiban, G., and Yamamoto, M., Productivity fluctuations in the southeastern Arabian Sea during the last 140 ka. Paleogeography Paleoclimatology Paleoecology, 193: Prasanna Kumar, S., and Prasad, T.G., Formation and spreading of Arabian Sea high salinity water mass. Journal of Geophysical Research, 104:
8 Prell, W.L., and Campo, E.V., Coherent response of Arabian Sea upwelling and pollen transport of late Quaternary monsoonal winds. Nature, 323: Reichart, G.J., Lournes, L.J., and Zachariasse, W.J., Temporal variability in the northern Arabian Sea Oxygen Minimum Zone (OMZ) during the last 225,000 years. Paleoceanography, 13: Rohling, E.J., Paleosalinity: confidence limits and future applications. Marine Geology, 163: Rostek, F., Ruhland, G., Bassinot, F.C., Muller, P.J., Labeyrie, L.D., Lancelot, Y., and Bard, E., Reconstructing sea surface temperature and salinity using δ 18 O and alkenone records. Nature, 364: Saraswat, R., Nigam, R., Weldeab, S., Mackensen, A., and Naidu, P.D., A first look at past sea surface temperatures in the equatorial Indian Ocean from Mg/Ca in foraminifera. Geophysical Research Letters, 32: doi: /2005GL Saher, M.H., Jung, S.J.A., Elderfield, H., Greaves, M., and Kroon, D., Sea surface temperatures of the western Arabian Sea during the last deglaciation. Paleoceanography, 22: PA2208, doi: /2006PA Shackleton, N.J., The 100,000 year ice-age cycle identified and found to lag temperature, carbon dioxide and orbital eccentricity. Science, 289: Shankar, D., Vinayachandran, P.N., and Unnikrishnan, A.S., The monsoon currents in the north Indian Ocean. Progressive Oceanography, 52: Webster, P.J., and Fasullo, J., Monsoons-Dynamic theory, in: Encyclopedia of atmospheric Sciences. Academic Press, 3: Wyrtki, K., Physical oceanography of the Indian Ocean: The Biology of the Indian Ocean, B. Zeitzschel, (Ed.), Springer-Verlag, Berlin, Levitus and Boyer's Annual salinity and temperature online maps. About the First Author Mahesh Badanal Male: born in 1980: Doctoral Student at National Institute of Oceanography (HQ, Goa), a constituent laboratory of Council of Scientific and Industrial Research (New Delhi, India). The author is pursuing his PhD in Marine Sciences (Paleoclimate) with emphasis on reconstruction of past monsoons for the Late Quaternary.
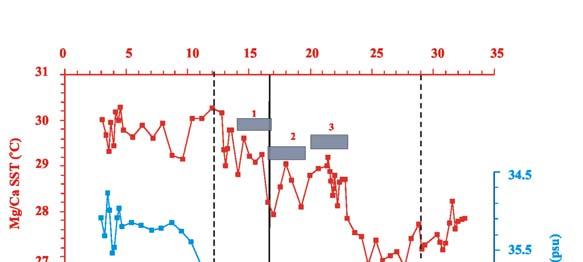
9 Captions to Figures Fig. 1. SK129/CR05 sediment core location (star), shown on annual sea surface salinity (a) and surface temperature (b) maps of the Arabian Sea (AS) ( Note the maximum SST region in which the present core lies. The northwestern AS shows the lowest SST (blue color code), while higher SSTs (red color code) are observed over the southwestern AS. Presence of low-salinity tongue along the west coast of India is evident by isohaline bordering the blue color region. The shaded block-arrows indicate modern reversing monsoon winds. Solid (broken) arrow indicates surface circulation during summer (winter) monsoons (Shankar et al 2002). The numbered filled circles are the locations of other sediment cores studied for Mg/Ca SST reconstructions [SK17 (Anand et al 2008); NIOP929 (Saher et al 2007)]. Fig. 2. The δ 18 O G.sacculifer variation plotted against core depth (cm). The upward triangles along depth axis are the radiocarbon dated sections shown along with their calibrated calendar ages. The ages for remaining sections of the sediment core were obtained by calculating the sedimentation rates between two adjacent 14 C dated sections. The broken vertical lines denote the marine oxygen isotope stage (MIS) boundaries. Fig. 3. Composite plot of oxygen-isotope, SST (Red) and surface salinity (SS: blue) variations recorded in SK129/CR05 compared with LR04 benthic-δ 18 O record (Lisiecki and Raymo, 2005). Vertical broken lines are the MIS 1/2 and 2/3 boundaries. LGM (shaded box) is the presently defined coldest event depicted by the heaviest δ 18 O G.sacculifer variation. Only latest part of the MIS-3 is covered by the radiocarbon dated interval. The shaded boxes 1 to 3 in SST panel represent three warming events within the LGM. The numbered (4-6) blue color filled squares on LR04 benthic record indicate MIS boundaries: 4 = MIS1/MIS2, 5 = Beginning of deglaciation; 6 = MIS2/3. Fig. 4. Time-series of SST (red), salinity (blue) and C/N ratios of sedimentary organic matter (black) in the studied sediment core. The C/N data is from Pattan et al. (2003). The shaded region indicates period of upwelling (high productivity) and intensified surface cooling (see text for details). Fig. 5. Scatter plot of total organic carbon vs nitrogen. Fig. 6. Scatter plots of C/N vs sea surface temperature (SST) and surface salinity (SS). Fig. 7. Scatter plots of SST and SS vs δ 18 Ο G.sacculifer. AS-Arabian Sea; EAS-Eastern Arabian Sea; BoB-Bay of Bengal; SST-Sea Surface Temperature; SS-Surface Salinity; ASHSW- Arabian Sea High Saline Water; MIS-Marine Oxygen Isotope Stage; LGM-Last Glacial Maximum; C/N-Carbon/Nitrogen; E-P Evaporation minus Precipitation


10 Figures:

11

12
13
A comparison of Mg/Ca ratios in Globigerinoides ruber (white): sensu stricto versus a mixture of genotypes
: sensu stricto versus a mixture of genotypes") Author Version: J. Geol. Soc. India, vol.87(3); 2016; 323-326 A comparison of Mg/Ca ratios in Globigerinoides ruber (white): sensu stricto versus a mixture of genotypes SUSHANT S. NAIK* CSIR-National Institute
Author Version: J. Geol. Soc. India, vol.87(3); 2016; 323-326 A comparison of Mg/Ca ratios in Globigerinoides ruber (white): sensu stricto versus a mixture of genotypes SUSHANT S. NAIK* CSIR-National Institute
Middle Eocene western north Atlantic biostratigraphy and environmental conditions
 Shari Hilding-Kronforst Shari Hilding-Kronforst is currently a Ph.D. candidate at Texas A&M University. Born in Illinois, she received a microscope at age 8 and dinosaur models at age 9. She completed
Does the Mg/Ca in Foraminifera Tests Provide a Reliable Temperature Proxy?
 Grand Valley State University ScholarWorks@GVSU Student Summer Scholars Undergraduate Research and Creative Practice 2009 Does the Mg/Ca in Foraminifera Tests Provide a Reliable Temperature Proxy? Sarah
Supporting Online Material for
 www.sciencemag.org/cgi/content/full/316/5829/1303/dc1 Supporting Online Material for 155,000 Years of West African Monsoon and Ocean Thermal Evolution Syee Weldeab,* David W. Lea, Ralph R. Schneider, Nils
Tropical Ocean Temperatures Over the Past 3.5 Million Years
 www.sciencemag.org/cgi/content/full/328/5985/1530/dc1 Supporting Online Material for Tropical Ocean Temperatures Over the Past 3.5 Million Years Timothy D. Herbert, Laura Cleaveland Peterson, Kira T. Lawrence,
A multi-proxy study of planktonic foraminifera to identify past millennialscale. climate variability in the East Asian Monsoon and the Western Pacific
 This pdf file consists of all pages containing figures within: A multi-proxy study of planktonic foraminifera to identify past millennialscale climate variability in the East Asian Monsoon and the Western
size fraction for elemental measurement. Samples for Mg/Ca were cleaned using the full
 DR2008246 SUPPLEMENTARY ONLINE MATERIALS Methods 51GGC and 36GGC. Samples were taken for elemental and isotopic analyses at 2 (51GGC) and 4 (36GGC) cm intervals giving a time resolution of 200 to 300 years
Holocene Evolution of the Indonesian Throughflow and the Western Pacific Warm Pool
 SUPPLEMENTARY INFORMATION Holocene Evolution of the Indonesian Throughflow and the Western Pacific Warm Pool by Braddock K. Linsley, Yair Rosenthal and Delia W. Oppo Supplementary Discussion: Salinity
Tracers. 1. Conservative tracers. 2. Non-conservative tracers. Temperature, salinity, SiO 2, Nd, 18 O. dissolved oxygen, phosphate, nitrate
 Tracers 1. Conservative tracers Temperature, salinity, SiO 2, Nd, 18 O 2. Non-conservative tracers dissolved oxygen, phosphate, nitrate Temperature itself is a tracer but other tracers (like oxygen isotopes)
Supplemental Information for. Persistent intermediate water warming during cold stadials in the SE Nordic seas. during the last 65 kyr
 GSA DATA REPOSITORY2014248 Supplemental Information for Persistent intermediate water warming during cold stadials in the SE Nordic seas during the last 65 kyr By Mohamed M. Ezat, Tine L. Rasmussen, Jeroen
Supplementary Figure 1. New downcore data from this study. Triangles represent the depth of radiocarbon dates. Error bars represent 2 standard error
 Supplementary Figure 1. New downcore data from this study. Triangles represent the depth of radiocarbon dates. Error bars represent 2 standard error of measurement (s.e.m.). 1 Supplementary Figure 2. Particle
SUPPLEMENTARY INFORMATION
 SUPPLEMENTARY INFORMATION Site Information: Table S1: Sites Modern Location Modern SST ( C) PO4(µM)-0m PO4(µM)-75m 130-806 0.5N, 159.5E 29.2 0.24 0.34 *(6) 154-925 4.5N, 43.5W 27.4 0.24 0.35 *(S35) 198-1208
GSA DATA REPOSITORY Hoffmann et al. Methods
 GSA DAA REPOSIORY 2014203 Hoffmann et al. Methods he planktonic stable isotope data were obtained from core M78/1-235-1 off the coast of rinidad (Schönfeld et al., 2011). Samples were collected in intervals
Lake Levels and Climate Change in Maine and Eastern North America during the last 12,000 years
 Maine Geologic Facts and Localities December, 2000 Lake Levels and Climate Change in Maine and Eastern North America during the last 12,000 years Text by Robert A. Johnston, Department of Agriculture,
Muted change in Atlantic overturning circulation over some glacial-aged Heinrich events
 SUPPLEMENTARY INFORMATION DOI: 10.1038/NGEO2045 Muted change in Atlantic overturning circulation over some glacial-aged Heinrich events Jean Lynch-Stieglitz 1, Matthew W. Schmidt 2, L. Gene Henry 1,7,
Long term variability in the tide gauge records along the coasts of the north Indian Ocean
 Long term variability in the tide gauge records along the coasts of the north Indian Ocean Introduction A. S. Unnikrishnan National Institute of Oceanography, Dona Paula, Goa, India 403004 e-mail: unni@nio.org
Chapter 15 Millennial Oscillations in Climate
 Chapter 15 Millennial Oscillations in Climate This chapter includes millennial oscillations during glaciations, millennial oscillations during the last 8000 years, causes of millennial-scale oscillations,
M. Wary et al. Correspondence to: M. Wary
 Supplement of Clim. Past, 11, 1507 1525, 2015 http://www.clim-past.net/11/1507/2015/ doi:10.5194/cp-11-1507-2015-supplement Author(s) 2015. CC Attribution 3.0 License. Supplement of Stratification of surface
Ice Ages and Changes in Earth s Orbit. Topic Outline
 Ice Ages and Changes in Earth s Orbit Topic Outline Introduction to the Quaternary Oxygen isotopes as an indicator of ice volume Temporal variations in ice volume Periodic changes in Earth s orbit Relationship
Air sea temperature decoupling in western Europe during the last interglacial glacial transition
 María Fernanda Sánchez Goñi, Edouard Bard, Amaelle Landais, Linda Rossignol, Francesco d Errico SUPPLEMENTARY INFORMATION DOI: 10.1038/NGEO1924 Air sea temperature decoupling in western Europe during the
GSA DATA REPOSITORY Table DR1 displays the station locations and number of specimens employed in each
 GSA DATA REPOSITORY 2010022 Beer et al. Station Locations and Number of Specimens Table DR1 displays the station locations and number of specimens employed in each aliquot. A mean of 24 specimens were
Father of Glacial theory. First investigations of glaciers and mountain geology,
 First investigations of glaciers and mountain geology, 1750-1800 Glaciation happens! -- Historical perspective It happens in cycles -- How do we know this? What are Milankovitch cycles? Sub-Milankovitch
lecture 12 Paleoclimate
 lecture 12 Paleoclimate OVERVIEW OF EARTH S CLIMATIC HISTORY Geologic time scales http://www.snowballearth.org/index.html Features of the climate during the Cretaceous period the land-sea distribution
Calibration of Mg/Ca thermometry in planktonic foraminifera from a sediment trap time series
 1 Calibration of Mg/Ca thermometry in planktonic foraminifera from a sediment trap time series Pallavi Jha and Henry Elderfield Department of Earth Sciences, University of Cambridge, Cambridge, UK Maureen
Deciphering the Modern Calcification Depth of Globigerina Bulloides in the Southwestern Indian Ocean from its Oxygen Isotopic Composition
 Author version: J. Foraminifer. Res.: 40(3); 2010; 220-230 Deciphering the Modern Calcification Depth of Globigerina Bulloides in the Southwestern Indian Ocean from its Oxygen Isotopic Composition R. SARASWAT
Speleothems and Climate Models
 Earth and Life Institute Georges Lemaître Centre for Earth and Climate Research Université catholique de Louvain, Belgium Speleothems and Climate Models Qiuzhen YIN Summer School on Speleothem Science,
Ocean & climate: an introduction and paleoceanographic perspective
 Ocean & climate: an introduction and paleoceanographic perspective Edouard BARD Chaire de l évolution du climat et de l'océan du Collège de France CEREGE, UMR CNRS, AMU, IRD, CdF Aix-en-Provence The ocean
We re living in the Ice Age!
 Chapter 18. Coping with the Weather: Causes and Consequences of Naturally Induce Climate Change 지구시스템의이해 We re living in the Ice Age! 1 Phanerozoic Climate 서늘해지고 더웠고 따뜻했고 3 Climate Rollercoaster 4 2 Time
The Tswaing Impact Crater, South Africa: derivation of a long terrestrial rainfall record for the southern mid-latitudes
 The Tswaing Impact Crater, South Africa: derivation of a long terrestrial rainfall record for the southern mid-latitudes T.C. PARTRIDGE Climatology Research Group, University of the Witwatersrand, Johannesburg,
Supporting Online Material
 Supporting Online Material Materials and Methods Planktonic foraminiferal δ 18 O and Mg/Ca Core MD97-2120 was sampled at 2 cm intervals for stable oxygen isotope analyses on Globigerina bulloides (250-355
Calibration of the planktonic foraminiferal Mg/Ca paleothermometer: Sediment trap results from the Guaymas Basin, Gulf of California
 PALEOCEANOGRAPHY, VOL. 20,, doi:10.1029/2004pa001077, 2005 Calibration of the planktonic foraminiferal Mg/Ca paleothermometer: Sediment trap results from the Guaymas Basin, Gulf of California Martha C.
PALEOCEANOGRAPHY, VOL. 26, PA2225, doi: /2010pa002035, 2011
 PALEOCEANOGRAPHY, VOL. 26,, doi:10.1029/2010pa002035, 2011 Western equatorial Pacific deep water carbonate chemistry during the Last Glacial Maximum and deglaciation: Using planktic foraminiferal Mg/Ca
Abstract. Key words: Oxygen Isotope, Mg/Ca, Globigerinoides ruber, Salinity, Indian Ocean, Insolation
 Author version: Acta Geol. Sin., vol.86; 2012; 1265-1275 Linkage between seasonal insolation gradient in the tropical northern hemisphere and the sea surface salinity of the equatorial Indian Ocean during
8. Climate changes Short-term regional variations
 8. Climate changes 8.1. Short-term regional variations By short-term climate changes, we refer here to changes occurring over years to decades. Over this timescale, climate is influenced by interactions
Seasonal Climate Outlook for South Asia (June to September) Issued in May 2014
 Issued in May 2014") Ministry of Earth Sciences Earth System Science Organization India Meteorological Department WMO Regional Climate Centre (Demonstration Phase) Pune, India Seasonal Climate Outlook for South Asia (June
Ministry of Earth Sciences Earth System Science Organization India Meteorological Department WMO Regional Climate Centre (Demonstration Phase) Pune, India Seasonal Climate Outlook for South Asia (June
PMIP Ocean Workshop 2013 Program Outline
 PMIP Ocean Workshop 2013 Program Outline We, Dec. 4 8:30-9:15 Introductory Discussion 9:15-10:15 Model-Data Comparison 10:30-12:00 Quantifying Uncertainties 1:00-2:30 LGM and Deglacial Changes in the Tropics
G 3. AN ELECTRONIC JOURNAL OF THE EARTH SCIENCES Published by AGU and the Geochemical Society
 Geosystems G 3 AN ELECTRONIC JOURNAL OF THE EARTH SCIENCES Published by AGU and the Geochemical Society Article Volume 9, Number 10 4 October 2008 Q10001, doi:10.1029/2007gc001931 ISSN: 1525-2027 A 5 million
Geol. 656 Isotope Geochemistry
 STABLE ISOTOPES IN PALEOCLIMATOLOGY I INTRODUCTION At least since the classic work of Louis Agassiz in 1840, geologists have contemplated the question of how the Earth s climate might have varied in the
Gulf Stream Temperature, Salinity, and Transport during the Last Millennium
 Gulf Stream Temperature, Salinity, and Transport during the Last Millennium David Lund - University of Michigan Part I - Geostrophic estimation of Gulf Stream flow - Gulf Stream strength varied by ~10%
Stable Isotope Tracers
 Stable Isotope Tracers OCN 623 Chemical Oceanography 5 March 2015 Reading: Emerson and Hedges, Chapter 5, p.134-153 (c) 2015 David Ho and Frank Sansone Outline Stable Isotopes - Introduction & Notation
Name Date Class. growth rings of trees, fossilized pollen, and ocean. in the northern hemisphere.
 Lesson Outline LESSON 2 A. Long-Term Cycles 1. A(n) climate cycle takes much longer than a lifetime to complete. a. To learn about long-term climate cycles, scientists study natural records, such as growth
ATOC OUR CHANGING ENVIRONMENT
 ATOC 1060-002 OUR CHANGING ENVIRONMENT Class 22 (Chp 15, Chp 14 Pages 288-290) Objectives of Today s Class Chp 15 Global Warming, Part 1: Recent and Future Climate: Recent climate: The Holocene Climate
G 3. AN ELECTRONIC JOURNAL OF THE EARTH SCIENCES Published by AGU and the Geochemical Society
 Geosystems G 3 AN ELECTRONIC JOURNAL OF THE EARTH SCIENCES Published by AGU and the Geochemical Society Mg/Ca ratios in the planktonic foraminifer Neogloboquadrina pachyderma (sinistral) in the northern
SUPPLEMENTARY INFORMATION
 SUPPLEMENTARY INFORMATION DOI: 1.138/NGEO168 "Strength and geometry of the glacial Atlantic Meridional Overturning Circulation" S2 Map of core locations Core locations of the Holocene and LGM 231 / 23
Supplementary Figure 1. Foraminifer shell weights and coating composition. Correlation of mean foraminiferal shell weights of (a) G.
 G.") Supplementary Figure 1. Foraminifer shell weights and coating composition. Correlation of mean foraminiferal shell weights of (a) G. bulloides and (b) Uvigerina spp. with respective U/Ca cc+c (grey) and
Supplementary Figure 1. Foraminifer shell weights and coating composition. Correlation of mean foraminiferal shell weights of (a) G. bulloides and (b) Uvigerina spp. with respective U/Ca cc+c (grey) and
A Broecker Brief Origin of the Atlantic s glacial age lower deep water
 A Broecker Brief Origin of the Atlantic s glacial age lower deep water Today s deep Atlantic shows no hint of nutrient stratification (see Figure 1). By contrast, during the last glacial maximum (LGM),
Announcements. First problem set due next Tuesday. Review for first exam next Thursday. Quiz on Booth (1994) after break today.
 after break today.") Announcements First problem set due next Tuesday. Review for first exam next Thursday. Quiz on Booth (1994) after break today. Intertidal, Lowes Cove, ME Marine Sediments: Clues to the ocean s past There
Announcements First problem set due next Tuesday. Review for first exam next Thursday. Quiz on Booth (1994) after break today. Intertidal, Lowes Cove, ME Marine Sediments: Clues to the ocean s past There
: ' N,
 PLANKTIC FORAMINIFER FAUNAL SEA SURFACE TEMPERATURE RECORDS OF THE PAST TWO GLACIAL TERMINATIONS IN THE SOUTH CHINA SEA NEAR WAN-AN SHALLOW (IMAGES CORE MD972151) ABSTRACT The South China Sea is the largest
Loess and dust. Jonathan A. Holmes Environmental Change Research Centre
 Loess and dust Jonathan A. Holmes Environmental Change Research Centre Why is dust important? Mineral dust is an important constituent of the solid load in Earth's atmosphere, the total atmospheric aerosol
Climate and Environment
 Climate and Environment Oxygen Isotope Fractionation and Measuring Ancient Temperatures Oxygen Isotope Ratio Cycles Oxygen isotope ratio cycles are cyclical variations in the ratio of the mass of oxygen
Abrupt Holocene climate change as an important factor for human migration in West Greenland
 1 Appendix: Supporting Information Abrupt Holocene climate change as an important factor for human migration in West Greenland D Andrea et al. SI Text 1) Radiocarbon dating and chronology The sedimentation
2/18/2013 Estimating Climate Sensitivity From Past Climates Outline
 Estimating Climate Sensitivity From Past Climates Outline Zero-dimensional model of climate system Climate sensitivity Climate feedbacks Forcings vs. feedbacks Paleocalibration vs. paleoclimate modeling
Ice on Earth: An overview and examples on physical properties
 Ice on Earth: An overview and examples on physical properties - Ice on Earth during the Pleistocene - Present-day polar and temperate ice masses - Transformation of snow to ice - Mass balance, ice deformation,
Tightly linked zonal and meridional sea surface temperature gradients over the past five million years
 SUPPLEMENTARY INFORMATION DOI: 10.1038/NGEO2577 Tightly linked zonal and meridional sea surface temperature gradients over the past five million years Alexey V. Fedorov 1*, Natalie J. Burls 1,4, Kira T.
6. What has been the most effective erosive agent in the climate system? a. Water b. Ice c. Wind
 Multiple Choice. 1. Heinrich Events a. Show increased abundance of warm-water species of planktic foraminifera b. Show greater intensity since the last deglaciation c. Show increased accumulation of ice-rafted
Impact of atmospheric CO 2 doubling on the North Pacific Subtropical Mode Water
 GEOPHYSICAL RESEARCH LETTERS, VOL. 36, L06602, doi:10.1029/2008gl037075, 2009 Impact of atmospheric CO 2 doubling on the North Pacific Subtropical Mode Water Hyun-Chul Lee 1,2 Received 19 December 2008;
Earth and Planetary Science Letters
 Earth and Planetary Science Letters 269 (2008) 585-595 Contents lists available at ScienceDirect Earth and Planetary Science Letters journal homepage: www.elsevier.com/locate/epsl Implications of seawater
Paleoclimate indicators
 Paleoclimate indicators Rock types as indicators of climate Accumulation of significant thicknesses of limestone and reef-bearing limestone is restricted to ~20º + - equator Gowganda tillite, Ontario
Fluctuations in productivity and denitrification in the southeastern Arabian Sea during the late Quaternary
 University of Wollongong Research Online Faculty of Science - Papers (Archive) Faculty of Science, Medicine and Health 2010 Fluctuations in productivity and denitrification in the southeastern Arabian
I EOS. TRANSACfIONS. AMERICAN GEOPHYSICAL UNION Natural Variability of Arctic Sea Ice Over the Holocene
 Eos, Vol. 87, No. 28, 11 July 2006 VOLUME 87 NUMBER 28 11 JULY 2006 I EOS. TRANSACfIONS. AMERICAN GEOPHYSICAL UNION Natural Variability of Arctic Sea Ice Over the Holocene PAGES 273,275 The area and volume
1. Introduction 2. Ocean circulation a) Temperature, salinity, density b) Thermohaline circulation c) Wind-driven surface currents d) Circulation and
 Temperature, salinity, density b) Thermohaline circulation c) Wind-driven surface currents d) Circulation and") 1. Introduction 2. Ocean circulation a) Temperature, salinity, density b) Thermohaline circulation c) Wind-driven surface currents d) Circulation and climate change e) Oceanic water residence times 3.
1. Introduction 2. Ocean circulation a) Temperature, salinity, density b) Thermohaline circulation c) Wind-driven surface currents d) Circulation and climate change e) Oceanic water residence times 3.
G 3. AN ELECTRONIC JOURNAL OF THE EARTH SCIENCES Published by AGU and the Geochemical Society
 Geosystems G 3 AN ELECTRONIC JOURNAL OF THE EARTH SCIENCES Published by AGU and the Geochemical Society Technical Brief Volume 4, Number 9 5 September 2003 8407, doi:10.1029/2003gc000559 ISSN: 1525-2027
Climate of the Past. A. Govin et al.
 Clim. Past Discuss., 9, C3570 C3579, 2014 www.clim-past-discuss.net/9/c3570/2014/ Author(s) 2014. This work is distributed under the Creative Commons Attribute 3.0 License. Climate of the Past Discussions
Planktonic foraminiferal Mg/Ca as a proxy for past oceanic temperatures: a methodological overview and data compilation for
 ARTICLE IN PRESS Quaternary Science Reviews 24 (2005) 821 84 Planktonic foraminiferal Mg/Ca as a proxy for past oceanic temperatures: a methodological overview and data compilation for the Last Glacial
Where is all the water?
 Where is all the water? The distribution of water at the Earth's surface % of total Oceans 97.25 Ice caps and glaciers 2.05 Groundwater 0.68 Lakes 0.01 Soils 0.005 Atmosphere (as vapour) 0.001 Rivers 0.0001
Development of the Global Environment
 Development of the Global Environment G302: Spring 2004 A course focused on exploration of changes in the Earth system through geological history Simon C. Brassell Geological Sciences simon@indiana.edu
Natural Climate Variability: Longer Term
 Natural Climate Variability: Longer Term Natural Climate Change Today: Natural Climate Change-2: Ice Ages, and Deep Time Geologic Time Scale background: Need a system for talking about unimaginable lengths
Orbital-Scale Interactions in the Climate System. Speaker:
 Orbital-Scale Interactions in the Climate System Speaker: Introduction First, many orbital-scale response are examined.then return to the problem of interactions between atmospheric CO 2 and the ice sheets
SUPPLEMENTARY INFORMATION
 doi:.38/nature777 Carbonate dissolution in TNO57-21 There are several possible ways to reconstruct the history of carbonate dissolution in marine sediments although each has potential pitfalls, such as
PCC 589 Paleoclimatology
 PCC 589 Paleoclimatology 1. Oxygen Isotopes, Temperature and Ice Volume First of four lectures covering: 1) Oxygen isotope in carbonate shells, and how they reflect a combination of ice volume (or sea
Uncertainties in seawater thermometry deriving from intratest and intertest Mg/Ca variability in Globigerinoides ruber
 Click Here for Full Article PALEOCEANOGRAPHY, VOL. 23,, doi:10.1029/2007pa001452, 2008 Uncertainties in seawater thermometry deriving from intratest and intertest Mg/Ca variability in Globigerinoides ruber
Sea surface temperatures of the western Arabian Sea during the last deglaciation
 Click Here for Full Article PALEOCEANOGRAPHY, VOL. 22,, doi:10.1029/2006pa001292, 2007 Sea surface temperatures of the western Arabian Sea during the last deglaciation M. H. Saher, 1 S. J. A. Jung, 1 H.
Supplementary Figure 1: Modern burial of organic carbon in deep sea sediment (gc m -2 a -1 ) 1.
 1.") Supplementary Figure 1: Modern burial of organic carbon in deep sea sediment (gc m -2 a -1 ) 1. Supplementary Figure 2: The 7 province maps used in this study. Each color corresponds to a single province:
Supplementary Figure 1: Modern burial of organic carbon in deep sea sediment (gc m -2 a -1 ) 1. Supplementary Figure 2: The 7 province maps used in this study. Each color corresponds to a single province:
Rapid Climate Change: Heinrich/Bolling- Allerod Events and the Thermohaline Circulation. By: Andy Lesage April 13, 2010 Atmos.
 Rapid Climate Change: Heinrich/Bolling- Allerod Events and the Thermohaline Circulation By: Andy Lesage April 13, 2010 Atmos. 6030 Outline Background Heinrich Event I/Bolling-Allerod Transition (Liu et
SUPPLEMENTARY INFORMATION
 GSA Data Repository 2016346 Breathing more deeply: Deep ocean carbon storage during the mid-pleistocene climate transition Caroline H. Lear et al. 1 2 3 4 5 6 7 8 9 10 11 12 13 14 15 16 17 18 19 20 21
The Ice Age sequence in the Quaternary
 The Ice Age sequence in the Quaternary Subdivisions of the Quaternary Period System Series Stage Age (Ma) Holocene 0 0.0117 Tarantian (Upper) 0.0117 0.126 Quaternary Ionian (Middle) 0.126 0.781 Pleistocene
Glacial-Interglacial Cycling: Ice, orbital theory, and climate. Dr. Tracy M. Quan IMCS
 Glacial-Interglacial Cycling: Ice, orbital theory, and climate Dr. Tracy M. Quan IMCS quan@marine.rutgers.edu Outline -The past - discovery of glacial periods - introduction of orbital theory -The present
Reduced Near-Surface Thermal Inversions in in the Southeastern Arabian Sea (Lakshadweep Sea)*
*") 1184 J O U R N A L O F P H Y S I C A L O C E A N O G R A P H Y VOLUME 39 Reduced Near-Surface Thermal Inversions in 2005 06 in the Southeastern Arabian Sea (Lakshadweep Sea)* K. NISHA, 1 SURYACHANDRA A.
1184 J O U R N A L O F P H Y S I C A L O C E A N O G R A P H Y VOLUME 39 Reduced Near-Surface Thermal Inversions in 2005 06 in the Southeastern Arabian Sea (Lakshadweep Sea)* K. NISHA, 1 SURYACHANDRA A.
BIODATA. Pre Degree KeralaUniversity 1990 Physics, Chemistry, 76.6 Ist Class. B.Sc. KeralaUniversity 1993 Geology (Main), Physics, Mathematics
, Physics, Mathematics") BIODATA DR.N.R.NISHA Assistant Professor Department of Marine Geology & Geophysics Cochin University of Science & Technology Cochin-16 Ph. 04842366478 E-mail: nisharavindran@yahoo.com, nrnisha@cusat.ac.in
BIODATA DR.N.R.NISHA Assistant Professor Department of Marine Geology & Geophysics Cochin University of Science & Technology Cochin-16 Ph. 04842366478 E-mail: nisharavindran@yahoo.com, nrnisha@cusat.ac.in
AMOC Impacts on Climate
 AMOC Impacts on Climate Rong Zhang GFDL/NOAA, Princeton, NJ, USA Paleo-AMOC Workshop, Boulder, CO, USA May 24, 2016 Atlantic Meridional Overturning Circulation (AMOC) Kuklbrodt et al. 2007 McManus et al.,
Pleistocene Glaciation (Ch.14) Geologic evidence Milankovitch cycles Glacial climate feedbacks
 Geologic evidence Milankovitch cycles Glacial climate feedbacks") Pleistocene Glaciation (Ch.14) Geologic evidence Milankovitch cycles Glacial climate feedbacks End of last ice-age rise of human civilization Modern ice-ages begin Asteroid impact end of dinosaurs Cambrian
Pleistocene Glaciation (Ch.14) Geologic evidence Milankovitch cycles Glacial climate feedbacks End of last ice-age rise of human civilization Modern ice-ages begin Asteroid impact end of dinosaurs Cambrian
Biogeochemical changes over long time scales
 Biogeochemical changes over long time scales Eric Galbraith McGill University, Montreal, Canada Overview What is a long time? Long timescale observations from marine sediments Very quick look at biogeochemical
the 2 past three decades
 SUPPLEMENTARY INFORMATION DOI: 10.1038/NCLIMATE2840 Atlantic-induced 1 pan-tropical climate change over the 2 past three decades 3 4 5 6 7 8 9 10 POP simulation forced by the Atlantic-induced atmospheric
Chapter 2 Variability and Long-Term Changes in Surface Air Temperatures Over the Indian Subcontinent
 Chapter 2 Variability and Long-Term Changes in Surface Air Temperatures Over the Indian Subcontinent A.K. Srivastava, D.R. Kothawale and M.N. Rajeevan 1 Introduction Surface air temperature is one of the
Global ocean response to orbital forcing in the Holocene
 PALEOCEANOGRAPHY, VOL. 18, NO. 2, 1041, doi:10.1029/2002pa000819, 2003 Global ocean response to orbital forcing in the Holocene Z. Liu Center for Climatic Research, University of Wisconsin, Madison, Wisconsin,
Paleoclimate: What can the past tell us about the present and future? Global Warming Science February 14, 2012 David McGee
 Paleoclimate: What can the past tell us about the present and future? 12.340 Global Warming Science February 14, 2012 David McGee 1 Recent observed trends: Greenhouse gases Image courtesy of NOAA. 2 Recent
Investigating snow accumulation variability on the Antarctic Peninsula using Ground Penetrating Radar. - A tool for interpreting ice core records
 Investigating snow accumulation variability on the Antarctic Peninsula using Ground - A tool for interpreting ice core records Elizabeth R. Thomas June 2008 Scientific Report in support of Loan 824 Identifying
Sea surface temperature pattern reconstructions in the Arabian Sea
 PALEOCEANOGRAPHY, VOL. 21,, doi:10.1029/2005pa001162, 2006 Sea surface temperature pattern reconstructions in the Arabian Sea Kristina A. Dahl 1,2 and Delia W. Oppo 3 Received 30 March 2005; revised 18
45 mm VARIABILITY OF THE BRAZIL-MALVINAS CONFLUENCE SINCE THE LAST GLACIAL MAXIMUM
 VARIABILITY OF THE BRAZIL-MALVINAS CONFLUENCE SINCE THE LAST GLACIAL MAXIMUM Cristiano M. Chiessi 1 ; Jeroen Groeneveld 2 ; Stefan Mulitza 3 ; Debora C. Redivo 1 ; Luiz F.C. Sabanay 1 chiessi@usp.br 1
Bay of Bengal Surface and Thermocline and the Arabian Sea
 DISTRIBUTION STATEMENT A. Approved for public release; distribution is unlimited. Bay of Bengal Surface and Thermocline and the Arabian Sea Arnold L. Gordon Lamont-Doherty Earth Observatory of Columbia
1. Oceans. Example 2. oxygen.
 1. Oceans a) Basic facts: There are five oceans on earth, making up about 72% of the planet s surface and holding 97% of the hydrosphere. Oceans supply the planet with most of its oxygen, play a vital
SUPPLEMENTARY INFORMATION
 doi:./nature97 G. ruber G. sacculifer G. ruber Ren et al. 9 G. sacculifer Ren et al. 9 FB-δ N ( vs. air) 7 Supplementary Figure. FB-δ N of single planktonic species G. ruber (dark green) and G. sacculifer
Processes affecting continental shelves
 Marine Sediments Continental Shelves Processes affecting continental shelves 1. Glaciation 2. Sea-level change (±130 m during continental glaciation) 3. Waves and currents 4. Sedimentation 5. Carbonate
Welcome to ATMS 111 Global Warming.
 Welcome to ATMS 111 Global Warming http://www.atmos.washington.edu/2010q1/111 Isotopic Evidence 16 O isotopes "light 18 O isotopes "heavy" Evaporation favors light Rain favors heavy Cloud above ice is
IMPLICATIONS OF THE VAST PLIOCENE WARMPOOL. Chris Brierley and Alexey Fedorov
 IMPLICATIONS OF THE VAST PLIOCENE WARMPOOL Chris Brierley and Alexey Fedorov Outline Introduction to the Early Pliocene When & why should we care? A vast warmpool in the Pacific Paleo-observations & comparison
Dear Editor, On behalf of all co-authors, Jos Wit. Reviewer #1
 Dear Editor, We thank the editor and two anonymous reviewers for their constructive comments, which helped us to improve the manuscript. Below, we address all comments point-by-point, discussing the subsequent
Auxiliary Material. 1. Mg/Ca-SST Quality Control using Al/Ca, Mn/Ca and Weight per Foraminifera
 Auxiliary Material 1. Mg/Ca-SST Quality Control using Al/Ca, Mn/Ca and Weight per Foraminifera 0 G. ruber (white) r 2 =0.06 150 Al/Ca (µmol/mol) 100 50 0 2 2.5 3 3.5 4 4.5 5 Mg/Ca (mmol/mol) Figure S1.
Lecture 18 Paleoceanography 2
 Lecture 18 Paleoceanography 2 May 26, 2010 Trend and Events Climatic evolution in Tertiary Overall drop of sea level General cooling (Figure 9-11) High latitude (deep-water) feature Two major step Middle
GEOPHYSICAL RESEARCH LETTERS, VOL. 35, L18609, doi: /2008gl034792, 2008
 GEOPHYSICAL RESEARCH LETTERS, VOL. 35, L18609, doi:10.1029/2008gl034792, 2008 Sea surface temperature differences between the western equatorial Pacific and northern South China Sea since the Pliocene
Ocean chemistry and atmospheric CO 2 sensitivity to carbon perturbations throughout the Cenozoic
 Click Here for Full Article GEOPHYSICAL RESEARCH LETTERS, VOL. 37,, doi:10.1029/2009gl041436, 2010 Ocean chemistry and atmospheric CO 2 sensitivity to carbon perturbations throughout the Cenozoic Malte