size fraction for elemental measurement. Samples for Mg/Ca were cleaned using the full
|
|
|
- Robyn Douglas
- 5 years ago
- Views:
Transcription
1 DR SUPPLEMENTARY ONLINE MATERIALS Methods 51GGC and 36GGC. Samples were taken for elemental and isotopic analyses at 2 (51GGC) and 4 (36GGC) cm intervals giving a time resolution of 200 to 300 years in each core. Forty Globigerinoides ruber shells were collected from the 212 to 250 μm size fraction for elemental measurement. Samples for Mg/Ca were cleaned using the full trace-metal protocol (oxidizing and reducing steps) (Boyle and Keigwin, 1985/6), and elemental ratios measured by ICP-MS (Rosenthal et al., 1999). Mg/Ca was converted to calcification temperature (CT) using a species-specific (G. ruber) core top calibration for the Atlantic basin (Dekens et al., 2002): Mg/Ca (mmol/mol) = 0.38*exp(0.09*CT) (Eqn.1). Due to the shallow depth of the core sites, dissolution likely had no affect on test Mg/Ca (Dekens et al., 2002). Because G. ruber lives and calcifies in the surface mixed layer, we consider the G. ruber CT a close approximation of sea surface temperature (SST) (Dekens et al., 2002). For 36GGC, seven G. ruber shells were selected from 212 to 250 μm size fraction for isotopic analysis. 18 O calcite was measured on a Finnigan MAT 253 isotope ratio mass spectrometer coupled to a Kiel III carbonate device (Ostermann and Curry, 2000; Lund et al., 2006). Methods for stable isotopic analyses on G. ruber from 51GGC are described in Keigwin and Schlegel (2002) and Keigwin (2004). We corrected 18 O calcite for temperature dependence and removed the effect of continental ice volume on seawater 18 O (Clark and Mix, 2002) to calculate the sea surface salinity (SSS) dependent 18 O seawater ( 18 O sw ). Age models were derived from 13 planktonic radiocarbon dates for 51GGC (Keigwin, 2004) and 14 planktonic and 1 benthic radiocarbon dates for 36GGC (Came et al., 2003). Ages were reservoir corrected, using 1
2 an additional R of 160 years for 36GGC (CALIB database), and calibrated with CALIB with the midpoint chosen for age model construction (Table S1). Methods GGC5. WesampledGGC5at~5cmintervalsandthirtyGloborotalia inflata shells were collected from the 300 to 355 μm size fraction for elemental measurement. We used G. inflata rather than G. ruber at GGC5 because of the core depth. G. inflata is a larger, more robust foraminifera than G. ruber and thus less susceptible to dissolution. Samples for Mg/Ca were cleaned using full trace-metal protocol (Boyle and Keigwin, 1985/6), and elemental ratios measured by ICP-MS (Rosenthal et al., 1999). 18 O calcite was measured on single G. inflata shells using a partially automated VG 903 stable isotope mass spectrometer (McManus et al., 2004). At Bermuda Rise, G. inlfata shows little seasonal variability in CT based on multiple trap measurements of 18 O calcite and its depth habitat is at the thermocline (Anand et al., 2003). Because of the greater depth habitat than G. ruber, G. inflata could migrate through the water column with temperature change (Anand et al., 2003). Migration would only reduce the CT changes and thus 18 O sw changes recorded by G. inflata; thus our calculations should be seen as minimum values, with the possibility of greater decreases in temperature and increases in 18 O sw of the water mass. We note that the agreement, but constant offset between 18 O calcite of G. inflata and G. ruber at Bermuda Rise (Boyle and Keigwin, 1987; McManus et al., 2004) indicates that G. inflata has likely remained in the thermocline through the last deglaciation, without migrating in the water column, thus recording the CT and 18 O sw of the thermocline. 2
3 We corrected 18 O calcite for temperature dependence from the Mg/Ca CT (see below for Mg/Ca-CT calibration) and removed the effect of continental ice volume on seawater 18 O (Clark and Mix, 2002) to calculate the SSS dependent 18 O sw. Our age model for GGC5 comes from McManus et al. (2004) who used 13 planktonic reservoir corrected and calibrated radiocarbon dates to establish the core chronology (Table S1). Because of the water depth of the GGC5 core site (4.55 km), which is actually bathed in deeper Antarctic bottom water from 5.0 km (McCave et al., 1982; Curry and Oppo, 2005), dissolution may affect the Mg/Ca ratio in foraminifera tests, skewing CT estimates toward colder temperatures (Dekens et al., 2002; Benway et al., 2003). To estimate the effects of dissolution as a function of depth, we measured G. inflata Mg/Ca in 9 central to western subtropical and northwestern North Atlantic core tops from water depths between 564 m and 4550 m, and also a Bermuda Rise trap sample from 500 to 1500 m water depth (see Table S2 and Fig. S3). We then compared CT calculated from two different calibrations (Elderfield and Ganssen, 2000; Anand et al., 2003) to the predicted CT for G. inflata depth and seasonal habitat (Deuser, 1987; Levitus and Boyer, 1994; Hillbrecht, 1996; Elderfield and Ganssen, 2000; Anand et al., 2003). However, neither of these calibrations nor the CT determined from 18 O calcite produced a GGC5 core top CT in agreement with modern thermocline temperature of the core site. Thus, we devised a new Mg/Ca-CT calibration following Anand et al. (2003) and Dekens et al. (2002): Mg/Ca (mmol/mol) = 0.299*exp[0.09*(CT-0.61*D)] (Eqn. 2), where D is the core water depth in km (5 km in the case of GGC5). This is the G. inflata Mg/Ca-CT equation derived using sediment trap data from Bermuda (Anand et al., 2003) 3
4 with the additional factor -0.61*D added from Dekens et al. (2002) to account for dissolution effects. The species dependence of this equation is in the pre-exponent factor, 0.299, whereas the factor within the exponent parentheses is general to planktonic foraminifera (Dekens et al., 2002; Anand et al., 2003). We test for the effects of dissolution on a sample prior to the use of (Eqn. 2) by comparing the average G. inflata test weight of a sample with that of the modern average G. inflata sediment trap test weight (see below). Based on the CT calculated from a north-south North Atlantic transect of G. inflata 18 O calcite (Elderfield and Ganssen, 2000), we infer that G. inflata inhabits the upper ~100 m during the spring-summer in the northwestern North Atlantic and the thermocline (~400 m) in the subtropical North Atlantic (Anand et al., 2003). Results from our core top survey suggest that G. inflata CT is better estimated by the Elderfield and Ganssen (2000) Mg/Ca-CT equation than by the Anand et al. (2003) Mg/Ca-CT equation, with the exception being the Bermuda Rise core top (GGC5) and sediment trap samples (Fig. S3 & Table S2). To the west and northwest of Bermuda, the Anand et al. equation consistently over predicts CT, whereas the Elderfield and Ganssen equation is within the calibration error and seasonal variability of the CT. We did not find a relationship between Mg/Ca and water depth down to 3890 m, nor is there a relationship between G. inflata weight and Mg/Ca (Table S2). At 4550 m water depth of our Bermuda Rise site, however, we do detect the effects of dissolution on Mg/Ca, despite G. inflata tests in the Bermuda Rise core top having the greatest average test weight of any of the core top samples (Table S2). 4
5 At Bermuda Rise, where G. inflata inhabits the thermocline with essentially no seasonal variability, the Elderfield and Ganssen (2000) equation underestimates the CT of the trap G. inflata by ~5.7 C, whereas the Anand et al. (2003) equation overestimates trap G. inflata CT by ~1.1 C (Fig. S3). Given that the Anand et al. equation was developed from Bermuda Rise sediment trap samples (Deuser, 1987), this better agreement is expected. However, both equations underestimate the GGC5 core top CT by ~11 C (Elderfield and Ganssen, 2000) and ~4.8 C (Anand et al., 2003), reflecting the effect of dissolution on test Mg/Ca. Using the new equation proposed here that accounts for greater dissolution with greater core water depth, the core top Mg/Ca CT estimate improves to ~15.8 C, closer to the modern thermocline temperature of 17.5 C. However, due to lower sedimentation rates during the Holocene relative the last deglaciation at Bermuda Rise, our core top age may not be modern as assumed in the age model construction (McManus et al., 2004). Thus we estimated the CT for core top G. inflata of ~16.6 C (Fig. S3) using the G. inflata 18 O calcite, an assumed salinity of practical salinity units and the modern salinity- 18 O sw relationship for Bermuda Rise (Anand et al., 2003; LeGrande and Schmidt, 2006). This CT of ~16.6 C is within the Mg/Ca-CT calibration error of ± 1.6 C (see below). In addition, our predicted 18 O sw for the core top from the Mg/Ca CT and G. inflata 18 O calcite is ~1.07 per mil in excellent agreement with the modern 18 O sw for Bermuda Rise of ~1.11 per mil (LeGrande and Schmidt, 2006). We note that this is a constant correction for dissolution, which may have varied in the past. However, given that the current core site is already bathed in Antarctic bottom water, any reduction in Atlantic meridional overturning circulation (AMOC) 5
6 strength would not change the water mass directly overlying the core site as much as it would if the core were shallower (Curry and Oppo, 2005). Thus past reductions in AMOC likely have not imprinted themselves significantly on the dissolution history at GGC5. During the early Holocene, better preservation of carbonate in the ocean due to the out-gassing of carbon dioxide (i.e. Berger, 1977) allowed for little to no dissolution of G. inflata tests at Bermuda Rise, evident in a peak in G. inflata test weight (Fig. S4). Thus we use average G. inflata test weight in GGC5 to detect if dissolution occurred. If the sample has an average G. inflata test weight less than the modern sediment trap weight suggesting dissolution, we use (Eqn. 2) to calculate CT. If the sample has an average G. inflata test weight greater than the modern sediment trap weight suggesting no dissolution, we use the Anand et al. (2003) G. inflata equation to calculate CT: Mg/Ca (mmol/mol) = 0.299*exp(0.09*CT) (Eqn. 3). Indeed, during the early Holocene when G. inflata test weights were greater than modern trap test weights (Fig. S4), the Anand et al. (2003) equation calculates CT of ~18.5 ºC in excellent agreement with the CT calculated from 18 O calcite of ~18.7 ºC (Fig. S4). We note that the use of these two equations to calculate CT does not affect our deglacial record and inferences there from, because all deglacial G. inflata test weights are less than the modern core top weight and thus we use a consistent Mg/Ca-CT equation. Error Analysis. Duplicate G. ruber and G. inflata Mg/Ca measurements suggest a Mg/Ca CT analytical precision of ± 0.12 mmol/mol (± 0.4 ºC). The standard error of the calibration for G. ruber is larger (± 1.2 ºC) (Dekens et al., 2002) but this only affects the absolute temperature, not the estimated change in CT. While we do not have a precisely 6
7 determined standard error for the G. inflata Mg/Ca-CT calibration used here, we suggest a conservative estimate of ± 1.2 ºC (i.e. Dekens et al., 2002; Anand et al., 2003). Thus final CT values have an absolute error of ± 1.6 ºC including the measurement precision and calibration error. 18 O calcite has a long-term reproducibility of ± 0.08 per mil (McManus et al., 2004; Lund et al., 2006). We use Monte Carlo methods assuming a normal distribution in the analytical precision of Mg/Ca, 18 O calcite and Mg/Ca-CT calibration to determine the 18 O sw precision of ± 0.26 per mil for absolute 18 O sw. For comparisons between samples from the same core (e.g. not including the calibration uncertainty), 18 O sw precisions is ± 0.12 per mil. We do not consider the effect of salinity on foraminifera Mg/Ca, where increased salinity increases the Mg/Ca ratio in the test. However, this effect is relatively small (~4 %) when compared to the influence of temperature on test Mg/Ca (Lea et al., 1999). Resolution of the records. GGC5 has a relatively constant sample resolution through the last deglaciation with two exceptions (Fig. S1a, b & c). First, the core only extends to ~20 k.y. B.P., near the end of the Last Glacial Maximum (Clark and Mix, 2002). Second, the latter part of the Younger Dryas cold period k.y. B.P. is less well resolved with only 3 samples. The only interval in 51GGC with lower sample resolution is from k.y. B.P. due to the low sedimentation rates at the core site (Fig. S1d, e & f), with 5 samples in this 4 k.y. period. The sample resolution of 36GGC is relatively constant through out the last deglaciation, with only slightly lower resolution from ~13-11 k.y. B.P.(Fig.S1g,h&i). 7
8 Influence of CT versus 18 O calcite on 18 O sw records. The 18 O sw records generally mimic the 18 O calcite records, especially in the case of GGC5 and 51GGC (Fig. S1). In GGC5, 18 O calcite and 18 O sw are similar, though coincident CT cooling with increases in 18 O calcite reduces the magnitude of 18 O sw increases centered at ~17, 15 and 13 k.y. B.P. (Fig. S1a, b & c). In contrast, CT warming in 51GGC from ~20 to 15 k.y. B.P. increases the concurrent 18 O sw increase (Fig. S1d, e & f). Similarly, CT cooling from ~15 to 13 k.y. B.P. amplifies the contemporaneous 18 O sw decrease. For 36GGC, CT warming from ~15 to 13 k.y. B.P. augments the decrease in 18 O sw (Fig. S1g, h & i). Core Top Records. Our late-holocene CT estimates are 26 ± 1.6 C for 51GGC, 22 ± 1.6 C for 36GGC, and 15.8± 1.6 C for GGC5. The 51GGC CT is in agreement with the modern average summer SST of 27 C. The 36GGC estimate is cooler than the average austral summer SST of 24 C. However, the core top age is 1,114 ± 64 cal yrs BP (Came et al., 2003) indicating that the CT is from an earlier cooler period of earth history. GGC5 is within error of the modern thermocline temperature of 17.5 C, and closer to the 18 O calcite estimated CT of ~16.6 C (Fig. S3). Late Holocene values for 18 O sw of ~1.07 per mil (GGC5), ~0.4 per mil (51GGC) and ~0.6 per mil (36GGC) are in agreement with modern surface 18 O sw of these regions (LeGrande and Schmidt, 2006). 8
9 References Anand, P., Elderfield, H., and Conte, M.H., 2003, Calibration of Mg/Ca thermometry in planktonic foraminifera from a sediment trap time series: Paleoceanography, v. 18, doi: /2002PA Benway, H.M., Haley, B.A., Klinkhammer, G.P., and Mix, A.C., 2003, Adaptation of a flow-through leaching procedure for Mg/Ca paleothermometry: Geochemistry, Geophysics, Geosystems, v. 4, doi: /2002GC Berger, W.H., 1977, Deep-sea carbonate and the deglaciation preservation spike in pteropods and foraminifera: Nature, v. 269, p Boyle, E.A., and Keigwin, L.D., 1985/6, Comparison of Atlantic and Pacific paleochemical records for the last 215,000 years: changes in deep ocean circulation and chemical inventories: Earth and Planetary Science Letters, v. 76, p Boyle, E.A., and Keigwin, L.D., 1987, North Atlantic thermohaline circulation during the past 20,000 years linked to high-latitude surface temperature: Nature, v. 330, p Came, R.E., Oppo, D.W., and Curry, W.B., 2003, Atlantic Ocean circulation during the Younger Dryas: Insights from a new Cd/Ca record from the western subtropical South Atlantic: Paleoceanography, v. 18, doi: /2003PA Clark, P.U., and Mix, A.C., 2002, Ice sheets and sea level of the Last Glacial Maximum: Quaternary Science Reviews, v. 21, p Curry, W.B., and Oppo, D.W., 2005, Glacial water mass geometry and the distribution of d13c and ZCO2 in the western Atlantic Ocean: Paleoceanography, v. 20, doi: /2004PA
10 Dekens, P.S., Lea, D.W., Pak, D.K., and Spero, H.J., 2002, Core top calibration of Mg/Ca in tropical foraminifera: Refining paleotemperature estimation: Geochemistry, Geophysics, Geosystems, v. 3, doi: /2001GC Deuser, W.G., 1987, Seasonal variations in isotopic composition and deep-water fluxes of the tests of perennially abundant planktonic foraminifera of the Sargasso Sea: Results from sediment trap collections and their paleoceanographic significance: Journal of Foraminiferal Research, v. 17, p Elderfield, H., and Ganssen, G., 2000, Past temperature and 18 O of surface ocean waters inferred from foraminiferal Mg/Ca ratios: Nature, v. 405, p Hillbrecht, H., 1996, Extant planktic foraminifera and the physical environment in the Atlantic and Indian Oceans: Mitteilungen aus dem Geologischen Institut der Eidgen, Technischen Hochschule und der Universität Zürich, Neue Folge. No. 300, 93 pp. Keigwin, L.D., 2004, Radiocarbon and stable isotope constraints on Last Glacial Maximum and Younger Dryas ventilation in the western North Atlantic: Paleoceanography, v. 19, doi: /2004PA Keigwin, L.D., and Schlegel, M.A., 2002, Ocean ventilation and sedimentation since the glacial maximum at 3 km in the western North Atlantic: Geochemistry, Geophysics, Geosystems, v. 3, doi: /2001GC Lea, D.W., Mashiotta, T.A., and Spero, H.J., 1999, Controls on magnesium and strontium uptake in planktonic foraminifera determined by live culturing: Geochimica et Cosmochimica Acta, v. 63, p
11 LeGrande, A.N., and Schmidt, G.A., 2006, Global gridded data set of the oxygen isotopic composition in seawater: Geophysical Research Letters, v. 33, doi: /2006GL Levitus, S., and Boyer, T., 1994, World Ocean Atlas 1994 Volume 4: Temperature: NOAA Atlas NESDIS 4, U.S. Department of Commerce, Washington, D.C. Lund, D.C., Lynch-Stieglitz, J., and Curry, W.B., 2006, Gulf Stream density structure and transport during the past millennium: Nature, v. 444, p McCave, I.N., Hollister, C.D., Laines, E.P., Lonsdale, P.F., and Richardson, M.J., 1982, Erosion and deposition on the eastern margin of the Bermuda Rise in the late Quaternary: Deep Sea Research, v. 29, p McManus, J.F., Francois, R., Gherardi, J.-M., Keigwin, L.D., and Brown-Ledger, S., 2004, Collapse and rapid resumption of Atlantic meridional circulation linked to deglacial climate changes: Nature, v. 428, p Ostermann, D.R., and Curry, W.B., 2000, Calibration of stable isotopic data: An enriched 18 O standard used for source gas mixing detection and correction: Paleoceanography, v. 15, p Rosenthal, Y., Field, P., and Sherrell, R., 1999, Precise determination of element/calcium ratios in calcareous samples using Sector Field Inductively Coupled Plasma Mass Spectrometry: Analytical Chemistry, v. 71, p
12 Core Depth (cm) 14 Cage ±Error Calibrated age ±2 GGC GGC GGC GGC GGC GGC GGC GGC GGC GGC GGC GGC GGC GGC GGC GGC GGC GGC GGC GGC GGC GGC GGC GGC GGC GGC GGC GGC GGC GGC GGC GGC GGC GGC GGC GGC GGC GGC GGC GGC GGC Table S1. Radiocarbon dates (reservoir corrected using CALIB database) used in age model reconstruction, calibrated with CALIB
13 Core Top &Trap Depth (m) Lat. N Lon. W Shell wt (μg) Mg/Ca (mmol/mol) CT Anand CT E&G T 400m T 100m T 50m T 0m Bermuda 500- Trap GGC GGC PC MC13A PC PC MC25B PC R PC Table S2. Table of core top and Bermuda sediment trap Mg/Ca values for G. inflata. Core depth, location, average G. inflata weight, measured Mg/Ca, calculated calcification temperature (CT) using Anand et al. (2003) (Anand) and Elderfield and Ganssen (2000) (E&G), and seasonal temperature range at core sites from 400 (400 m has no seasonal variability), 100, 50 and 0 m water depths (Levitus and Boyer, 1994). Core tops are as follows: GGC5 = OCE326-GGC5, 51GGC = KNR140-51GGC, 4PC = DW PC, MC13A = OCE326-MC13A, PC7 = HUD PC7, MC25B = OCE326-MC25B, 119PC = HUD PC, 5R = HUD R, 10PC = DW PC. 13
14 Age (k.y. B.P.) Mg/Ca (mmol/mol) CT 18 O calcite 18 O sw
15 Table S3. 51GGC Mg/Ca, calcification temperature (CT), 18 O calcite and 18 O sw data on age model scale. 15
16 Age (k.y. B.P.) Mg/Ca (mmol/mol) CT 18 O calcite 18 O sw
17 Table S4. 36GGC Mg/Ca, calcification temperature (CT), 18 O calcite and 18 O sw data on age model scale. 17
18 Age (k.y. B.P.) Mg/Ca (mmol/mol) CT 18 O calcite 18 O sw Table S5. GGC5 Mg/Ca, calcification temperature (CT), 18 O calcite and 18 O sw data on age model scale. 18
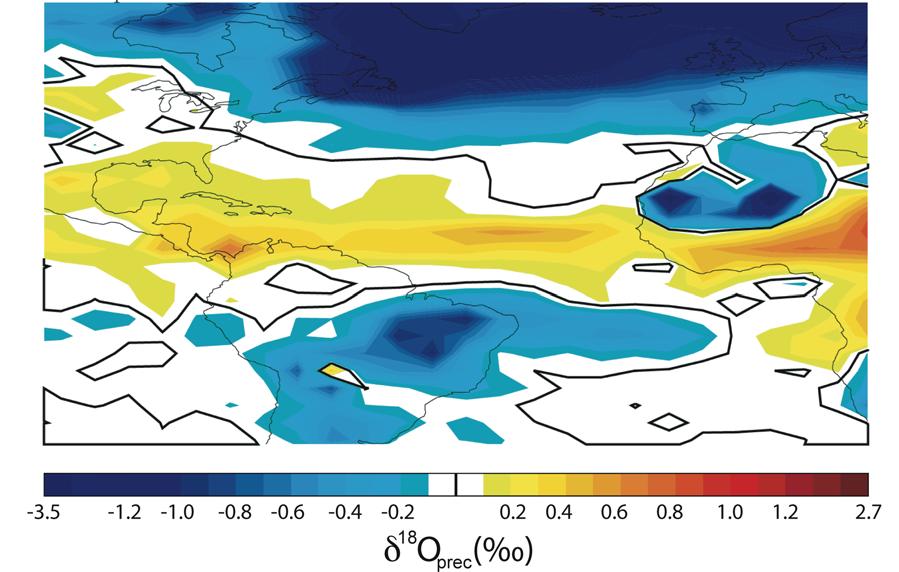
19 Supplementary Figure S1. Mg/Ca-CT, 18 O calcite ( 18 O c )and 18 O seawater ( 18 O sw ) from GGC5 (a-c), 51GGC (d-f), and 36GGC (g-i). (a) GGC5 G. inflata CT (gray dots) with 3- point smoothing (black line). (b) GGC5 G. inlfata 18 O c (gray line). (c) GGC5 18 O sw (black dots) with 3-point smoothing (black line). (d) 51GGC G. ruber CT (gray dots) with 3-point smoothing (black line). (e) 51GGC G. ruber 18 O c (gray line). (f) 51GGC 18 O sw (black dots) with 3-point smoothing (black line). (g) 36GGC G. ruber CT (gray dots) with 3-point smoothing (black line). (h) 36GGC G. ruber 18 O c (gray line). (i) 36GGC 18 O sw (black dots) with 3-point smoothing (black line). Black boxes denote radiocarbon age control (Came et al., 2003; Keigwin, 2004; McManus et al., 2004). Supplementary Figure S2. Change 18 O precipitation ( 18 O prec ) in NASA Goddard Institute for Space Studies ModelE-R in response to 0.1 Sverdrup 100 years freshwater forcing to the North Atlantic with an ~50% reduction in AMOC strength (average of the last 20 years) for the tropical, northern and southern subtropical Atlantic. Note the increase in 18 O prec in the northern tropics and reduction in the southern tropics related to the southward migration of the intertropical convergence zone (ITCZ). Black line denotes zero change in 18 O prec. Supplementary Figure S3. North Atlantic G. inflata core top Mg/Ca calcification temperature (CT) and seasonal temperature variability for inferred calcification depth (Levitus and Boyer, 1994); 400 m for subtropical sites, 100 to 50 m for northwestern Atlantic sites. Data and full core names are given in Table S1. Mg/Ca CT was calculated using the calibrations of Anand et al. (2003) (gray circles) and Elderfield and Ganssen (2000) (black diamonds). Also shown is the CT calculated from the core top 18 O c of G. 19
20 inflata at GGC5 (black square) versus GGC5 CT from Mg/Ca using the revised G. inflata calibration of this study. Supplementary Figure S4. (a) GGC5 Mg/Ca record (black line with triangle symbols), with gray boxes denoting samples that likely did not experience dissolution (e.g. the Anand et al. (2003) equation was used to calculate CT (a). All other samples used (Eqn. 1) to calculate CT. (b) 18 O c record. (c) G. inflata test weight. Dashed horizontal gray line denotes cutoff for samples that have experienced dissolution (weights below modern sediment trap weights) and samples that have not experienced dissolution (weights heavier than modern sediment trap weights). 20
21 Supplementary Figure S1 21
22 Supplementary Figure S2 22
23 Supplementary Figure S3 23
24 Supplementary Figure S4 24
Supporting Online Material for
 www.sciencemag.org/cgi/content/full/316/5829/1303/dc1 Supporting Online Material for 155,000 Years of West African Monsoon and Ocean Thermal Evolution Syee Weldeab,* David W. Lea, Ralph R. Schneider, Nils
Middle Eocene western north Atlantic biostratigraphy and environmental conditions
 Shari Hilding-Kronforst Shari Hilding-Kronforst is currently a Ph.D. candidate at Texas A&M University. Born in Illinois, she received a microscope at age 8 and dinosaur models at age 9. She completed
Holocene Evolution of the Indonesian Throughflow and the Western Pacific Warm Pool
 SUPPLEMENTARY INFORMATION Holocene Evolution of the Indonesian Throughflow and the Western Pacific Warm Pool by Braddock K. Linsley, Yair Rosenthal and Delia W. Oppo Supplementary Discussion: Salinity
Gulf Stream Temperature, Salinity, and Transport during the Last Millennium
 Gulf Stream Temperature, Salinity, and Transport during the Last Millennium David Lund - University of Michigan Part I - Geostrophic estimation of Gulf Stream flow - Gulf Stream strength varied by ~10%
Supplementary Figure 1. New downcore data from this study. Triangles represent the depth of radiocarbon dates. Error bars represent 2 standard error
 Supplementary Figure 1. New downcore data from this study. Triangles represent the depth of radiocarbon dates. Error bars represent 2 standard error of measurement (s.e.m.). 1 Supplementary Figure 2. Particle
GSA DATA REPOSITORY Hoffmann et al. Methods
 GSA DAA REPOSIORY 2014203 Hoffmann et al. Methods he planktonic stable isotope data were obtained from core M78/1-235-1 off the coast of rinidad (Schönfeld et al., 2011). Samples were collected in intervals
Supporting Online Material
 Supporting Online Material Materials and Methods Planktonic foraminiferal δ 18 O and Mg/Ca Core MD97-2120 was sampled at 2 cm intervals for stable oxygen isotope analyses on Globigerina bulloides (250-355
A multi-proxy study of planktonic foraminifera to identify past millennialscale. climate variability in the East Asian Monsoon and the Western Pacific
 This pdf file consists of all pages containing figures within: A multi-proxy study of planktonic foraminifera to identify past millennialscale climate variability in the East Asian Monsoon and the Western
45 mm VARIABILITY OF THE BRAZIL-MALVINAS CONFLUENCE SINCE THE LAST GLACIAL MAXIMUM
 VARIABILITY OF THE BRAZIL-MALVINAS CONFLUENCE SINCE THE LAST GLACIAL MAXIMUM Cristiano M. Chiessi 1 ; Jeroen Groeneveld 2 ; Stefan Mulitza 3 ; Debora C. Redivo 1 ; Luiz F.C. Sabanay 1 chiessi@usp.br 1
SUPPLEMENTARY INFORMATION
 SUPPLEMENTARY INFORMATION DOI: 1.138/NGEO168 "Strength and geometry of the glacial Atlantic Meridional Overturning Circulation" S2 Map of core locations Core locations of the Holocene and LGM 231 / 23
Does the Mg/Ca in Foraminifera Tests Provide a Reliable Temperature Proxy?
 Grand Valley State University ScholarWorks@GVSU Student Summer Scholars Undergraduate Research and Creative Practice 2009 Does the Mg/Ca in Foraminifera Tests Provide a Reliable Temperature Proxy? Sarah
PMIP Ocean Workshop 2013 Program Outline
 PMIP Ocean Workshop 2013 Program Outline We, Dec. 4 8:30-9:15 Introductory Discussion 9:15-10:15 Model-Data Comparison 10:30-12:00 Quantifying Uncertainties 1:00-2:30 LGM and Deglacial Changes in the Tropics
Rapid Climate Change: Heinrich/Bolling- Allerod Events and the Thermohaline Circulation. By: Andy Lesage April 13, 2010 Atmos.
 Rapid Climate Change: Heinrich/Bolling- Allerod Events and the Thermohaline Circulation By: Andy Lesage April 13, 2010 Atmos. 6030 Outline Background Heinrich Event I/Bolling-Allerod Transition (Liu et
Tracers. 1. Conservative tracers. 2. Non-conservative tracers. Temperature, salinity, SiO 2, Nd, 18 O. dissolved oxygen, phosphate, nitrate
 Tracers 1. Conservative tracers Temperature, salinity, SiO 2, Nd, 18 O 2. Non-conservative tracers dissolved oxygen, phosphate, nitrate Temperature itself is a tracer but other tracers (like oxygen isotopes)
PALEOCEANOGRAPHY, VOL. 26, PA2225, doi: /2010pa002035, 2011
 PALEOCEANOGRAPHY, VOL. 26,, doi:10.1029/2010pa002035, 2011 Western equatorial Pacific deep water carbonate chemistry during the Last Glacial Maximum and deglaciation: Using planktic foraminiferal Mg/Ca
Radiocarbon and stable isotope constraints on Last Glacial Maximum and Younger Dryas ventilation in the western North Atlantic
 PALEOCEANOGRAPHY, VOL. 19,, doi:10.1029/2004pa001029, 2004 Radiocarbon and stable isotope constraints on Last Glacial Maximum and Younger Dryas ventilation in the western North Atlantic Lloyd D. Keigwin
SUPPLEMENTARY INFORMATION
 SUPPLEMENTARY INFORMATION Site Information: Table S1: Sites Modern Location Modern SST ( C) PO4(µM)-0m PO4(µM)-75m 130-806 0.5N, 159.5E 29.2 0.24 0.34 *(6) 154-925 4.5N, 43.5W 27.4 0.24 0.35 *(S35) 198-1208
GSA DATA REPOSITORY Table DR1 displays the station locations and number of specimens employed in each
 GSA DATA REPOSITORY 2010022 Beer et al. Station Locations and Number of Specimens Table DR1 displays the station locations and number of specimens employed in each aliquot. A mean of 24 specimens were
Calibration of Mg/Ca thermometry in planktonic foraminifera from a sediment trap time series
 1 Calibration of Mg/Ca thermometry in planktonic foraminifera from a sediment trap time series Pallavi Jha and Henry Elderfield Department of Earth Sciences, University of Cambridge, Cambridge, UK Maureen
Muted change in Atlantic overturning circulation over some glacial-aged Heinrich events
 SUPPLEMENTARY INFORMATION DOI: 10.1038/NGEO2045 Muted change in Atlantic overturning circulation over some glacial-aged Heinrich events Jean Lynch-Stieglitz 1, Matthew W. Schmidt 2, L. Gene Henry 1,7,
G 3. AN ELECTRONIC JOURNAL OF THE EARTH SCIENCES Published by AGU and the Geochemical Society
 Geosystems G 3 AN ELECTRONIC JOURNAL OF THE EARTH SCIENCES Published by AGU and the Geochemical Society Mg/Ca ratios in the planktonic foraminifer Neogloboquadrina pachyderma (sinistral) in the northern
A comparison of Mg/Ca ratios in Globigerinoides ruber (white): sensu stricto versus a mixture of genotypes
: sensu stricto versus a mixture of genotypes") Author Version: J. Geol. Soc. India, vol.87(3); 2016; 323-326 A comparison of Mg/Ca ratios in Globigerinoides ruber (white): sensu stricto versus a mixture of genotypes SUSHANT S. NAIK* CSIR-National Institute
Author Version: J. Geol. Soc. India, vol.87(3); 2016; 323-326 A comparison of Mg/Ca ratios in Globigerinoides ruber (white): sensu stricto versus a mixture of genotypes SUSHANT S. NAIK* CSIR-National Institute
Geoffrey (Jake) Gebbie Research Associate, Harvard University Visiting Scientist, MIT
 Gebbie Research Associate, Harvard University Visiting Scientist, MIT") Our basic understanding of past ocean circulation Geoffrey (Jake) Gebbie Research Associate, Harvard University Visiting Scientist, MIT ACDC Summer School, 5 June 2009 The view down a borehole (Helen Freeman,
Our basic understanding of past ocean circulation Geoffrey (Jake) Gebbie Research Associate, Harvard University Visiting Scientist, MIT ACDC Summer School, 5 June 2009 The view down a borehole (Helen Freeman,
SUPPLEMENTARY INFORMATION
 doi:.38/nature777 Carbonate dissolution in TNO57-21 There are several possible ways to reconstruct the history of carbonate dissolution in marine sediments although each has potential pitfalls, such as
Glacial water mass geometry and the distribution of D 13 Cof2CO 2 in the western Atlantic Ocean
 PALEOCEANOGRAPHY, VOL. 20,, doi:10.1029/2004pa001021, 2005 Glacial water mass geometry and the distribution of D 13 Cof2CO 2 in the western Atlantic Ocean W. B. Curry and D. W. Oppo Department of Geology
Calibration of the planktonic foraminiferal Mg/Ca paleothermometer: Sediment trap results from the Guaymas Basin, Gulf of California
 PALEOCEANOGRAPHY, VOL. 20,, doi:10.1029/2004pa001077, 2005 Calibration of the planktonic foraminiferal Mg/Ca paleothermometer: Sediment trap results from the Guaymas Basin, Gulf of California Martha C.
Ruddiman CHAPTER 13. Earth during the LGM ca. 20 ka BP
 Ruddiman CHAPTER 13 Earth during the LGM ca. 20 ka BP The Last Glacial Maximum When? How much more ice than today? How much colder was it than today (global average)? How much lower were snowlines? Did
M. Ballarotta 1, L. Brodeau 1, J. Brandefelt 2, P. Lundberg 1, and K. Döös 1. This supplementary part includes the Figures S1 to S16 and Table S1.
 Supplementary Information: Last Glacial Maximum World-Ocean simulations at eddy-permitting and coarse resolutions: Do eddies contribute to a better consistency between models and paleo-proxies? M. Ballarotta
M. Wary et al. Correspondence to: M. Wary
 Supplement of Clim. Past, 11, 1507 1525, 2015 http://www.clim-past.net/11/1507/2015/ doi:10.5194/cp-11-1507-2015-supplement Author(s) 2015. CC Attribution 3.0 License. Supplement of Stratification of surface
Deep Ocean Circulation & implications for Earth s climate
 Deep Ocean Circulation & implications for Earth s climate I. Ocean Layers and circulation types 1) Ocean Layers Ocean is strongly Stratified Consists of distinct LAYERS controlled by density takes huge
Uncertainties in seawater thermometry deriving from intratest and intertest Mg/Ca variability in Globigerinoides ruber
 Click Here for Full Article PALEOCEANOGRAPHY, VOL. 23,, doi:10.1029/2007pa001452, 2008 Uncertainties in seawater thermometry deriving from intratest and intertest Mg/Ca variability in Globigerinoides ruber
Tropical Ocean Temperatures Over the Past 3.5 Million Years
 www.sciencemag.org/cgi/content/full/328/5985/1530/dc1 Supporting Online Material for Tropical Ocean Temperatures Over the Past 3.5 Million Years Timothy D. Herbert, Laura Cleaveland Peterson, Kira T. Lawrence,
Planktonic foraminiferal Mg/Ca as a proxy for past oceanic temperatures: a methodological overview and data compilation for
 ARTICLE IN PRESS Quaternary Science Reviews 24 (2005) 821 84 Planktonic foraminiferal Mg/Ca as a proxy for past oceanic temperatures: a methodological overview and data compilation for the Last Glacial
Supplemental Information for. Persistent intermediate water warming during cold stadials in the SE Nordic seas. during the last 65 kyr
 GSA DATA REPOSITORY2014248 Supplemental Information for Persistent intermediate water warming during cold stadials in the SE Nordic seas during the last 65 kyr By Mohamed M. Ezat, Tine L. Rasmussen, Jeroen
Late Holocene changes in Atlantic Surface and Deep Water Circulation
 Late Holocene changes in Atlantic Surface and Deep Water Circulation Peter B. demenocal Lamont-Doherty Earth Observatory of Columbia University Gerard C. Bond Lamont-Doherty Earth Obs. Tom Marchitto Univ.
Air sea temperature decoupling in western Europe during the last interglacial glacial transition
 María Fernanda Sánchez Goñi, Edouard Bard, Amaelle Landais, Linda Rossignol, Francesco d Errico SUPPLEMENTARY INFORMATION DOI: 10.1038/NGEO1924 Air sea temperature decoupling in western Europe during the
lecture 12 Paleoclimate
 lecture 12 Paleoclimate OVERVIEW OF EARTH S CLIMATIC HISTORY Geologic time scales http://www.snowballearth.org/index.html Features of the climate during the Cretaceous period the land-sea distribution
ATOC OUR CHANGING ENVIRONMENT
 ATOC 1060-002 OUR CHANGING ENVIRONMENT Class 22 (Chp 15, Chp 14 Pages 288-290) Objectives of Today s Class Chp 15 Global Warming, Part 1: Recent and Future Climate: Recent climate: The Holocene Climate
TROPICAL NORTH ATLANTIC SEA SURFACE TEMPERATURE RECONSTRUCTION FOR THE LAST 800 YEARS USING MG/CA RATIOS IN PLANKTIC FORAMINIFERA.
 TROPICAL NORTH ATLANTIC SEA SURFACE TEMPERATURE RECONSTRUCTION FOR THE LAST 800 YEARS USING MG/CA RATIOS IN PLANKTIC FORAMINIFERA A Thesis Presented to The Graduate Faculty of The University of Akron In
Radiocarbon LATE QUATERNARY PTEROPOD PRESERVATION IN EASTERN NORTH ATLANTIC SEDIMENTS IN RELATION TO CHANGING CLIMATE
 [RADJOCARBON, VOL. 33, NO. 3, 1991, P. 277-282] Radiocarbon 1991 LATE QUATERNARY PTEROPOD PRESERVATION IN EASTERN NORTH ATLANTIC SEDIMENTS IN RELATION TO CHANGING CLIMATE G. M. GANSSEN, S. R. TROELSTRA
isopycnal outcrop w < 0 (downwelling), v < 0 L.I. V. P.
, v < 0 L.I. V. P.") Ocean 423 Vertical circulation 1 When we are thinking about how the density, temperature and salinity structure is set in the ocean, there are different processes at work depending on where in the water
Ocean 423 Vertical circulation 1 When we are thinking about how the density, temperature and salinity structure is set in the ocean, there are different processes at work depending on where in the water
G 3. AN ELECTRONIC JOURNAL OF THE EARTH SCIENCES Published by AGU and the Geochemical Society
 Geosystems G 3 AN ELECTRONIC JOURNAL OF THE EARTH SCIENCES Published by AGU and the Geochemical Society Article Volume 9, Number 10 4 October 2008 Q10001, doi:10.1029/2007gc001931 ISSN: 1525-2027 A 5 million
We re living in the Ice Age!
 Chapter 18. Coping with the Weather: Causes and Consequences of Naturally Induce Climate Change 지구시스템의이해 We re living in the Ice Age! 1 Phanerozoic Climate 서늘해지고 더웠고 따뜻했고 3 Climate Rollercoaster 4 2 Time
STABLE ISOTOPE/TEST SIZE RELATIONSHIP IN Cibicidoides wuellerstorfi
 NOTE BRAZILIAN JOURNAL OF OCEANOGRAPHY, 59(3):287-291, 2011 STABLE ISOTOPE/TEST SIZE RELATIONSHIP IN Cibicidoides wuellerstorfi Paula Franco-Fraguas*, Karen Badaraco Costa and Felipe Antonio de Lima Toledo
Ocean & climate: an introduction and paleoceanographic perspective
 Ocean & climate: an introduction and paleoceanographic perspective Edouard BARD Chaire de l évolution du climat et de l'océan du Collège de France CEREGE, UMR CNRS, AMU, IRD, CdF Aix-en-Provence The ocean
6.16 Tracers of Past Ocean Circulation
 6.16 J. Lynch-Stieglitz Columbia University, Palisades, NY, USA 6.16.1 INTRODUCTION 433 6.16.2 NUTRIENT WATER MASS TRACERS 434 6.16.2.1 Carbon Isotopes 434 6.16.2.1.1 Controls on d 13 C of oceanic carbon
Volume 37 Number 1 March
 GEOSCIENCE CANADA Volume 37 Number 1 March 21 1 SERIES The Geoscience of Climate and Energy 7. The Oceanic Climate Capacitor Lowell Stott Department of Earth Science University of Southern California Los
SUPPLEMENTARY INFORMATION
 SI #1 Sample preparation and analyses New planktonic and benthic foraminiferal radiocarbon ages were generated for late glacial and deglacial intervals from two shallow cores (Table S1). Core RR53 JPC
SUPPLEMENTARY INFORMATION
 GSA Data Repository 2016346 Breathing more deeply: Deep ocean carbon storage during the mid-pleistocene climate transition Caroline H. Lear et al. 1 2 3 4 5 6 7 8 9 10 11 12 13 14 15 16 17 18 19 20 21
Lecture 1. Amplitude of the seasonal cycle in temperature
 Lecture 6 Lecture 1 Ocean circulation Forcing and large-scale features Amplitude of the seasonal cycle in temperature 1 Atmosphere and ocean heat transport Trenberth and Caron (2001) False-colour satellite
Abyssal Atlantic circulation during the Last Glacial Maximum: Constraining the ratio between transport and vertical mixing
 PALEOCEANOGRAPHY, VOL. 26,, doi:10.1029/2010pa001938, 2011 Abyssal Atlantic circulation during the Last Glacial Maximum: Constraining the ratio between transport and vertical mixing D. C. Lund, 1 J. F.
A Broecker Brief Origin of the Atlantic s glacial age lower deep water
 A Broecker Brief Origin of the Atlantic s glacial age lower deep water Today s deep Atlantic shows no hint of nutrient stratification (see Figure 1). By contrast, during the last glacial maximum (LGM),
Welcome to ATMS 111 Global Warming.
 Welcome to ATMS 111 Global Warming http://www.atmos.washington.edu/2010q1/111 Isotopic Evidence 16 O isotopes "light 18 O isotopes "heavy" Evaporation favors light Rain favors heavy Cloud above ice is
/ Past and Present Climate
 MIT OpenCourseWare http://ocw.mit.edu 12.842 / 12.301 Past and Present Climate Fall 2008 For information about citing these materials or our Terms of Use, visit: http://ocw.mit.edu/terms. Ice Sheet Paleoclimatology
Potential Impact of climate change and variability on the Intra-Americas Sea (IAS)
") Potential Impact of climate change and variability on the Intra-Americas Sea (IAS) Sang-Ki Lee 1, Yanyun Liu 1 and Barbara Muhling 2 1 CIMAS-University of Miami and AOML-NOAA 2 Princeton University and
Potential Impact of climate change and variability on the Intra-Americas Sea (IAS) Sang-Ki Lee 1, Yanyun Liu 1 and Barbara Muhling 2 1 CIMAS-University of Miami and AOML-NOAA 2 Princeton University and
Upper Ocean Circulation
 Upper Ocean Circulation C. Chen General Physical Oceanography MAR 555 School for Marine Sciences and Technology Umass-Dartmouth 1 MAR555 Lecture 4: The Upper Oceanic Circulation The Oceanic Circulation
Stable Isotope Tracers
 Stable Isotope Tracers OCN 623 Chemical Oceanography 5 March 2015 Reading: Emerson and Hedges, Chapter 5, p.134-153 (c) 2015 David Ho and Frank Sansone Outline Stable Isotopes - Introduction & Notation
Biogeochemical changes over long time scales
 Biogeochemical changes over long time scales Eric Galbraith McGill University, Montreal, Canada Overview What is a long time? Long timescale observations from marine sediments Very quick look at biogeochemical
Solar Forcing of Florida Straits Surface Salinity During the Early Holocene
 Old Dominion University ODU Digital Commons OEAS Faculty Publications Ocean, Earth & Atmospheric Sciences 2012 Solar Forcing of Florida Straits Surface Salinity During the Early Holocene Matthew W. Schmidt
AMOC Impacts on Climate
 AMOC Impacts on Climate Rong Zhang GFDL/NOAA, Princeton, NJ, USA Paleo-AMOC Workshop, Boulder, CO, USA May 24, 2016 Atlantic Meridional Overturning Circulation (AMOC) Kuklbrodt et al. 2007 McManus et al.,
Continental Hydrology, Rapid Climate Change, and the Intensity of the Atlantic MOC: Insights from Paleoclimatology
 Continental Hydrology, Rapid Climate Change, and the Intensity of the Atlantic MOC: Insights from Paleoclimatology W.R. Peltier Department of Physics University of Toronto WOCE derived N-S salinity section
Atlantic overturning in decline?
 Atlantic overturning in decline? Article Accepted Version Robson, J., Hodson, D., Hawkins, E. and Sutton, R. (2014) Atlantic overturning in decline? Nature Geoscience, 7 (1). pp. 2 3. ISSN 1752 0894 doi:
Lecture 18 Paleoceanography 2
 Lecture 18 Paleoceanography 2 May 26, 2010 Trend and Events Climatic evolution in Tertiary Overall drop of sea level General cooling (Figure 9-11) High latitude (deep-water) feature Two major step Middle
Ratio of coccolith CaCO 3 to foraminifera CaCO 3 in late Holocene deep sea sediments
 PALEOCEANOGRAPHY, VOL. 24,, doi:10.1029/2009pa001731, 2009 Ratio of coccolith CaCO 3 to foraminifera CaCO 3 in late Holocene deep sea sediments Wallace Broecker 1 and Elizabeth Clark 1 Received 30 December
Announcements. First problem set due next Tuesday. Review for first exam next Thursday. Quiz on Booth (1994) after break today.
 after break today.") Announcements First problem set due next Tuesday. Review for first exam next Thursday. Quiz on Booth (1994) after break today. Intertidal, Lowes Cove, ME Marine Sediments: Clues to the ocean s past There
Announcements First problem set due next Tuesday. Review for first exam next Thursday. Quiz on Booth (1994) after break today. Intertidal, Lowes Cove, ME Marine Sediments: Clues to the ocean s past There
1. Introduction 2. Ocean circulation a) Temperature, salinity, density b) Thermohaline circulation c) Wind-driven surface currents d) Circulation and
 Temperature, salinity, density b) Thermohaline circulation c) Wind-driven surface currents d) Circulation and") 1. Introduction 2. Ocean circulation a) Temperature, salinity, density b) Thermohaline circulation c) Wind-driven surface currents d) Circulation and climate change e) Oceanic water residence times 3.
1. Introduction 2. Ocean circulation a) Temperature, salinity, density b) Thermohaline circulation c) Wind-driven surface currents d) Circulation and climate change e) Oceanic water residence times 3.
Climate Changes due to Natural Processes
 Climate Changes due to Natural Processes 2.6.2a Summarize natural processes that can and have affected global climate (particularly El Niño/La Niña, volcanic eruptions, sunspots, shifts in Earth's orbit,
Modulation and daily banding of Mg/Ca in Orbulina universa tests by symbiont photosynthesis and respiration: a complication for seawater thermometry?
 Earth and Planetary Science Letters 225 (2004) 411 419 www.elsevier.com/locate/epsl Modulation and daily banding of Mg/Ca in Orbulina universa tests by symbiont photosynthesis and respiration: a complication
LETTERS. Influence of the Thermohaline Circulation on Projected Sea Level Rise
 VOLUME 13 JOURNAL OF CLIMATE 15 JUNE 2000 LETTERS Influence of the Thermohaline Circulation on Projected Sea Level Rise RETO KNUTTI AND THOMAS F. STOCKER Climate and Environmental Physics, Physics Institute,
The deglacial evolution of North Atlantic deep convection
 The deglacial evolution of North Atlantic deep convection Radiocarbon evidence from the Northeast Atlantic provides new insights into the timing and nature of North Atlantic deep convection changes during
TROPICAL NORTH ATLANTIC HYDROLOGIC CYCLE VARIABILITY IN THE FLORIDA STRAITS DURING THE LAST ICE AGE. A Thesis THEODORE ROLAND THEM, II
 TROPICAL NORTH ATLANTIC HYDROLOGIC CYCLE VARIABILITY IN THE FLORIDA STRAITS DURING THE LAST ICE AGE A Thesis by THEODORE ROLAND THEM, II Submitted to the Office of Graduate Studies of Texas A&M University
Quarternary Climate Variations
 Quarternary Climate Variations EAS 303 Lecture 34 Background and History Louis Agassiz (1840): recognition of Ice Ages Harold Urey (1947): The Thermodynamic Properties of Isotopic Substances calculated
SUPPLEMENTARY INFORMATION
 SUPPLEMENTARY INFORMATION Extreme deepening of the Atlantic overturning circulation during deglaciation Stephen Barker, Gregor Knorr, Maryline Vautravers, Paula Diz and Luke Skinner Supplementary Information
Radiocarbon dating of planktonic foraminifer shells: A cautionary tale
 PALEOCEANOGRAPHY, VOL. 29, 13 29, doi:10.1002/2013pa002532, 2014 Radiocarbon dating of planktonic foraminifer shells: A cautionary tale Figen Mekik 1 Received 26 June 2013; revised 26 November 2013; accepted
Paired benthic foraminiferal Cd/Ca and Zn/Ca evidence for a greatly increased presence of Southern Ocean Water in the glacial North Atlantic
 PALEOCEANOGRAPHY, VOL. 17, NO. 3, 1038, 10.1029/2000PA000598, 2002 Paired benthic foraminiferal Cd/Ca and Zn/Ca evidence for a greatly increased presence of Southern Ocean Water in the glacial North Atlantic
Chapter 15 Millennial Oscillations in Climate
 Chapter 15 Millennial Oscillations in Climate This chapter includes millennial oscillations during glaciations, millennial oscillations during the last 8000 years, causes of millennial-scale oscillations,
The Tswaing Impact Crater, South Africa: derivation of a long terrestrial rainfall record for the southern mid-latitudes
 The Tswaing Impact Crater, South Africa: derivation of a long terrestrial rainfall record for the southern mid-latitudes T.C. PARTRIDGE Climatology Research Group, University of the Witwatersrand, Johannesburg,
Increased hurricane frequency near Florida during Younger Dryas AMOC slowdown by
 GSA Data Repository 2017358 1 Supplementary Material Accompanying: 2 3 4 Increased hurricane frequency near Florida during Younger Dryas AMOC slowdown by Toomey, Korty, Donnelly, van Hengstum and Curry.
THE IMPACT OF BIOTURBATION ON AMS 14C DATES ON HANDPICKED FORAMINIFERA: A STATISTICAL MODEL MICHAEL ANDREE
 [RADIOCARBON, VOL 29, No. 2, 1987, P 169-175] THE IMPACT OF BIOTURBATION ON AMS 14C DATES ON HANDPICKED FORAMINIFERA: A STATISTICAL MODEL MICHAEL ANDREE Physics Institute, ljniversity of Berne, Switzerland
KRISTINA L. FAUL 1,A.CHRISTINA RAVELO 2, AND M. L. DELANEY 2
 Journal of Foraminiferal Research, v. 30, no. 2, p. 110 125, April 2000 RECONSTRUCTIONS OF UPWELLING, PRODUCTIVITY, AND PHOTIC ZONE DEPTH IN THE EASTERN EQUATORIAL PACIFIC OCEAN USING PLANKTONIC FORAMINIFERAL
Supplementary Figure S1: Separated benthic 18 O data over 5 Myr. (a) Benthic LR04 benthic 18 O stack 16 ( ) in black with seawater 18 O ( w ) in blue
 Benthic LR04 benthic 18 O stack 16 ( ) in black with seawater 18 O ( w ) in blue") Supplementary Figure S1: Separated benthic 18 O data over 5 Myr. (a) Benthic LR04 benthic 18 O stack 16 ( ) in black with seawater 18 O ( w ) in blue and temperature contribution ( T ) in green. (b) Surface-air
Supplementary Figure S1: Separated benthic 18 O data over 5 Myr. (a) Benthic LR04 benthic 18 O stack 16 ( ) in black with seawater 18 O ( w ) in blue and temperature contribution ( T ) in green. (b) Surface-air
Effect of varying frontal systems on stable oxygen and carbon isotopic compositions of modern planktic foraminifera of Southern Ocean
 Effect of varying frontal systems on stable oxygen and carbon isotopic compositions of modern planktic foraminifera of Southern Ocean Manish Tiwari 1, *, Rahul Mohan 1, Thamban Meloth 1, Sushant S. Naik
A bit of background on carbonates. CaCO 3 (solid)
") A bit of background on carbonates CaCO 3 (solid) Organisms need both carbon dioxide and carbonate Kleypas et al 2005 The two pumps put CO 2 into the deep ocean The long term record of climate change Or:
A bit of background on carbonates CaCO 3 (solid) Organisms need both carbon dioxide and carbonate Kleypas et al 2005 The two pumps put CO 2 into the deep ocean The long term record of climate change Or:
Deciphering the Modern Calcification Depth of Globigerina Bulloides in the Southwestern Indian Ocean from its Oxygen Isotopic Composition
 Author version: J. Foraminifer. Res.: 40(3); 2010; 220-230 Deciphering the Modern Calcification Depth of Globigerina Bulloides in the Southwestern Indian Ocean from its Oxygen Isotopic Composition R. SARASWAT
Supplementary Figure 1 Trends of annual mean maximum ocean mixed layer depth. Trends from uninitialized simulations (a) and assimilation simulation
 and assimilation simulation") Supplementary Figure 1 Trends of annual mean maximum ocean mixed layer depth. Trends from uninitialized simulations (a) and assimilation simulation (b) from 1970-1995 (units: m yr -1 ). The dots show grids
Supplementary Figure 1 Trends of annual mean maximum ocean mixed layer depth. Trends from uninitialized simulations (a) and assimilation simulation (b) from 1970-1995 (units: m yr -1 ). The dots show grids
ANOMALOUS AMS RADIOCARBON AGES FOR FORAMINIFERA FROM HIGH-DEPOSITION-RATE OCEAN SEDIMENTS
 [RADIOCARBON, VOL 31, No., 1989, P 157-16] ANOMALOUS AMS RADIOCARBON AGES FOR FORAMINIFERA FROM HIGH-DEPOSITION-RATE OCEAN SEDIMENTS WALLACE S BROECKER*, SUSAN TRUMBORE***, GEORGES BONANI**, WILLY WOLFLI**
G 3. AN ELECTRONIC JOURNAL OF THE EARTH SCIENCES Published by AGU and the Geochemical Society
 Geosystems G 3 AN ELECTRONIC JOURNAL OF THE EARTH SCIENCES Published by AGU and the Geochemical Society Article Volume 9, Number 4 10 April 2008 Q04016, doi:10.1029/2007gc001660 ISSN: 1525-2027 In situ
Lecture 21: Glaciers and Paleoclimate Read: Chapter 15 Homework due Thursday Nov. 12. What we ll learn today:! Learning Objectives (LO)
") Learning Objectives (LO) Lecture 21: Glaciers and Paleoclimate Read: Chapter 15 Homework due Thursday Nov. 12 What we ll learn today:! 1. 1. Glaciers and where they occur! 2. 2. Compare depositional and
Learning Objectives (LO) Lecture 21: Glaciers and Paleoclimate Read: Chapter 15 Homework due Thursday Nov. 12 What we ll learn today:! 1. 1. Glaciers and where they occur! 2. 2. Compare depositional and
Paleoclimate: What can the past tell us about the present and future? Global Warming Science February 14, 2012 David McGee
 Paleoclimate: What can the past tell us about the present and future? 12.340 Global Warming Science February 14, 2012 David McGee 1 Recent observed trends: Greenhouse gases Image courtesy of NOAA. 2 Recent
OCN/ATM/ESS 587. Ocean circulation, dynamics and thermodynamics.
 OCN/ATM/ESS 587 Ocean circulation, dynamics and thermodynamics. Equation of state for seawater General T/S properties of the upper ocean Heat balance of the upper ocean Upper ocean circulation Deep circulation
M. Gutjahr a,, M. Frank a,1, C.H. Stirling a,2, L.D. Keigwin b, A.N. Halliday c. Available online at
 Available online at www.sciencedirect.com Earth and Planetary Science Letters 266 (2008) 61 77 www.elsevier.com/locate/epsl Tracing the Nd isotope evolution of North Atlantic Deep and Intermediate Waters
Project Retrograde imagine Earth rotated in the opposite direction
 Project Retrograde imagine Earth rotated in the opposite direction The rotation of Earth shapes our climate system in various ways: It controls the major wind directions, lets the weather systems swirl,
Mg/Ca variation in planktonic foraminifera tests: implications for reconstructing palaeo-seawater temperature and habitat migration
 R Available online at www.sciencedirect.com Earth and Planetary Science Letters 212 (2003) 291^306 www.elsevier.com/locate/epsl Mg/Ca variation in planktonic foraminifera tests: implications for reconstructing
Rapid climate change in ice cores
 Rapid climate change in ice cores Liz Thomas British Antarctic Survey Overview Introduction to ice cores Evidence of rapid climate change in the Greenland ice cores DO events Younger Dryas 8.2 kyr cold
Reconstructing the upper water column thermal structure in the Atlantic Ocean
 PALEOCEANOGRAPHY, VOL. 28, 1 14, doi:10.1002/palo.20050, 2013 Reconstructing the upper water column thermal structure in the Atlantic Ocean Caroline Cléroux, 1,2 Peter demenocal, 1 Jennifer Arbuszewski,
JEAN-CLAUDE DUPLESSY, MAURICE ARNOLD, EDOUARD BARD, ANNE JUILLET-LECLERC, NEJIB KALLEL
 [RADIOCARBON, VOL 31, No. 3, 1989, P 493-521 AMS 14C STUDY OF TRANSIENT EVENTS AND OF THE VENTILATION RATE OF THE PACIFIC INTERMEDIATE WATER DURING THE LAST DEGLACIATION JEAN-CLAUDE DUPLESSY, MAURICE ARNOLD,
MAR 110 LECTURE #10 The Oceanic Conveyor Belt Oceanic Thermohaline Circulation
 1 MAR 110 LECTURE #10 The Oceanic Conveyor Belt Oceanic Thermohaline Circulation Ocean Climate Temperature Zones The pattern of approximately parallel oceanic surface isotherms (lines of constant temperature)
Development of the Global Environment
 Development of the Global Environment G302: Spring 2004 A course focused on exploration of changes in the Earth system through geological history Simon C. Brassell Geological Sciences simon@indiana.edu
Supplementary Figure 1: Modern burial of organic carbon in deep sea sediment (gc m -2 a -1 ) 1.
 1.") Supplementary Figure 1: Modern burial of organic carbon in deep sea sediment (gc m -2 a -1 ) 1. Supplementary Figure 2: The 7 province maps used in this study. Each color corresponds to a single province:
Supplementary Figure 1: Modern burial of organic carbon in deep sea sediment (gc m -2 a -1 ) 1. Supplementary Figure 2: The 7 province maps used in this study. Each color corresponds to a single province:
G 3. Meridional overturning circulation in the South Atlantic at the last glacial maximum
 Geosystems G 3 AN ELECTRONIC JOURNAL OF THE EARTH SCIENCES Published by AGU and the Geochemical Society Article Volume 7, Number 10 3 October 2006 Q10N03, doi:10.1029/2005gc001226 ISSN: 1525-2027 Click