Ocean & climate: an introduction and paleoceanographic perspective
|
|
|
- Sharyl Gray
- 5 years ago
- Views:
Transcription


1 Ocean & climate: an introduction and paleoceanographic perspective Edouard BARD Chaire de l évolution du climat et de l'océan du Collège de France CEREGE, UMR CNRS, AMU, IRD, CdF Aix-en-Provence

2 The ocean belongs to the climate system
 Source:")
3 Heat transport is linked to water mass advection Radiative budget as a function of latitudes Heat transport (max 6 PW around 40 N) Source: Ruddiman 2002


4 Surface ocean currents are organized in large gyres linked to wind stress and Coriolis force Source: American Meteorological Society


5 Deep and bottom circulations connecting ocean basins at global scale Marshall & Speer 2012 Nat. Geo.
 Total O+A Dry air")

6 Oceans participate to the meridional heat transport W Northward Latent Heat (L) Total O+A Dry air (S) Atmosphere S+L Ocean Total Atlantic Pacific Indian Southward after Fasullo & Trenberth 2008 J. Clim.
 20.10 6 m 3 /s at 4 C S Latitude N dv Fheat = c!$!! N S!")
7 First order approximation of meridional heat transport in the Atlantic Ocean m 3 /s at 20 C Temperature C Depth (m) m 3 /s at 4 C S Latitude N dv Fheat = c!$!! N S! dt ( ) 15 T # T " W Courtesy from Thomas Stocker

8 In the North Atlantic, salty surface water from the subtropics progressively cools and sinks to depth W South North after Tomczak & Godfrey 2003

9 The salinity distribution allows the identification of water masses such as North Atlantic Deep Water NADW South Source: WOCE North

10 Dissolved oxygen is consumed by biological respiration during transport NADW South Source: WOCE North

11 The propagation of transient tracers allows to follow the sinking and advection of NADW ex. Tritium and 14 C produced during nuclear bomb tests in the atmosphere during the early 60s South North Source: WHOI
 Sud Nord Source:")
12 Diffusion and advection of anthropogenic freons (evolution from 1988 to 1993) Sud Nord Source: NOAA


13 The Atlantic Meridional Overturning Circulation plays a major role in the sequestration of anthropogenic CO 2 in the deep Ocean (1/3 since the 19 th century) Concentration in µmol/kg in 1994 Sabine et al Science
14 Looking at the past to illustrate large changes of ocean & climate
 Laurentide Ice sheet Major changes in climate, sea-level, sea ice, temperatures &")
15 The Earth during the last glacial maximum 21,000 years B.P. (21 kyr BP) Laurentide Ice sheet Major changes in climate, sea-level, sea ice, temperatures & currents Fennoscandian ice sheet CLIMAP 1981


16 Attempt to reconstruct sea ice during the LGM based on the distribution of planktonic dinocysts Greenland Quebec De Vernal & Hillaire-Marcel 2000 QSR


17 The distribution of fossil diatoms and radiolaria is also used to map the LGM sea ice around Antarctica : doubling of sea ice extent Gersonde et al QSR


 Source: NOC,")
18 South of Africa, a zone of confrontation between the Agulhas Current, the Benguela Current et the Antarctic Circumpolar Current: retroflexion & Indian-Atlantic exchanges Chlorophyll (CZCS) Dynamic topography variability (cm) Source: NOC, Southampton


19 Variations of the Agulhas current and of Indian-Atlantic exchanges Sea surface temperatures authigenic uranium Planktonic organic matter Overturning strength Atlantic-Pacific benthic 13 C/ 12 C gradient Age in thousands of years before present (B.P.) Bard & Rickaby 2009 Nature


20 Agulhas leakage glacial-interglacial modulation Age in thousands of years before present (B.P.) Peeters et al Nature

 Laurentide")

21 Hydrological perturbations linked to transient collapses of the Laurentide ice sheet (Heinrich events) Laurentide ice sheet icebergs forams freshwater ice rafted debris I.R.D.
 Johnsen et al. 2001 JQS, Bard et al. 2000 Science, 2002 Phys.")
22 Many instabilities of the deep circulation over the last 100,000 years affecting air and ocean temperatures Air temperature ( C) 18 O/ 16 O de la glace North Atlantic surface temperature ( C) Alkenones Intensity of the deep Atlantic circulation YD 13 C/ 12 C in benthic foraminifera Age in years before present (B.P.) Johnsen et al JQS, Bard et al Science, 2002 Phys. Today, Shackleton et al Paleoceanography
 Pichevin et al.")
23 Marine biological productivity favored by upwelling and surface mixing due to monsoon winds in the Arabian Sea Based on chlorophyl content measured by satellites (SeaWIFS) Pichevin et al. GBC 2007

24 The Arabian Sea is particularly sensitive to changes of the Asian monsoon and ocean ventilation low ph Denitrification North South
 of the Arabian Sea MD04-2876 MD04-2873 Arabian")
25 Study of sediment cores recovered within and below the oxygen minimum zone (OMZ) of the Arabian Sea MD MD Arabian Sea

26 Probable contribution of the Arabian Sea in the atmospheric variations of nitrous oxide (N 2 O) Greenland temperature Sowers et al Science Flueckiger et al GBC Atmospheric N 2 O Arabian Sea Denitrification Pichevin et al. GBC 2007 Age in years before present (B.P.)
 Shakun et al.")
27 Compiling 80 well-dated temperature records over the last deglaciation (21-6 kyr B.P.) Shakun et al Nature

28 How well do the proxy sites represent the globe? Shakun et al Nature

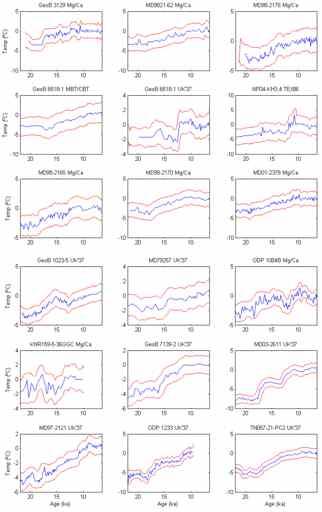
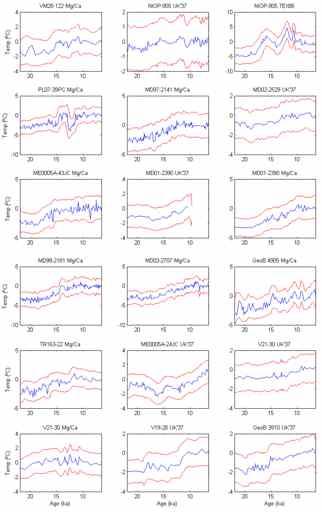
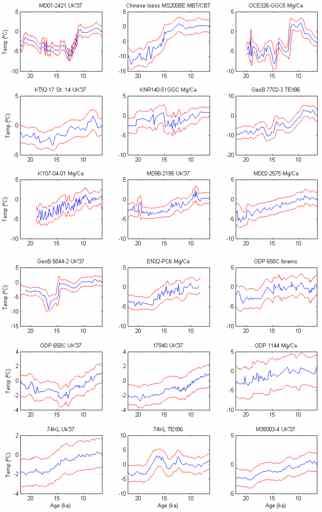
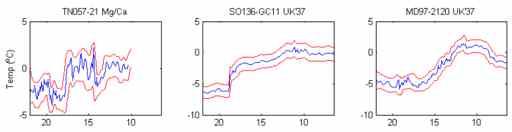
29 Shakun et al Nature
30 The global deglacial warming lags the CO 2 rise Atmospheric CO 2 Antarctica T C Global T C Age in thousands of years before present Shakun et al Nature

31 The deglacial warming is delayed in the Northern Hemisphere Age in thousands of years before present Shakun et al Nature


32 Most deglacial warming follows the CO 2 rise SH T C Atmospheric CO 2 NH T C Shakun et al Nature N-S Atl.!T N-S!T The North-South gradient is correlated to the AMOC intensity McManus et al Nature Heinrich #1 YD AMOC intensity (Pa/Th) Age in thousands of years before present
33 Paleoceanography tells us that the Ocean is a key player in the climate system, which moderates (smoothes and delays) but can also amplify or curb large climatic changes (i.e. positive or negative feedbacks)

34 Thank you for your patience and attention
Air sea temperature decoupling in western Europe during the last interglacial glacial transition
 María Fernanda Sánchez Goñi, Edouard Bard, Amaelle Landais, Linda Rossignol, Francesco d Errico SUPPLEMENTARY INFORMATION DOI: 10.1038/NGEO1924 Air sea temperature decoupling in western Europe during the
Jacob Schewe Potsdam Institute for Climate Impact Research. Ocean circulation under climate change: Examples of qualitative changes
 Jacob Schewe Potsdam Institute for Climate Impact Research Ocean circulation under climate change: Examples of qualitative changes Acknowledgments Anders Levermann Potsdam Institute for Climate Impact
Rapid climate change in ice cores
 Rapid climate change in ice cores Liz Thomas British Antarctic Survey Overview Introduction to ice cores Evidence of rapid climate change in the Greenland ice cores DO events Younger Dryas 8.2 kyr cold
Project Retrograde imagine Earth rotated in the opposite direction
 Project Retrograde imagine Earth rotated in the opposite direction The rotation of Earth shapes our climate system in various ways: It controls the major wind directions, lets the weather systems swirl,
Actual bathymetry (with vertical exaggeration) Geometry of the ocean 1/17/2018. Patterns and observations? Patterns and observations?
 Geometry of the ocean 1/17/2018. Patterns and observations? Patterns and observations?") Patterns and observations? Patterns and observations? Observations? Patterns? Observations? Patterns? Geometry of the ocean Actual bathymetry (with vertical exaggeration) Continental Continental Basin
Patterns and observations? Patterns and observations? Observations? Patterns? Observations? Patterns? Geometry of the ocean Actual bathymetry (with vertical exaggeration) Continental Continental Basin
SIO 210 Final examination Answer Key for all questions except Daisyworld. Wednesday, December 10, PM Name:
 SIO 210 Final examination Answer Key for all questions except Daisyworld. Wednesday, December 10, 2008 3-6 PM Name: This is a closed book exam. You may use a calculator. There are two parts: Talley (weighted
The Tswaing Impact Crater, South Africa: derivation of a long terrestrial rainfall record for the southern mid-latitudes
 The Tswaing Impact Crater, South Africa: derivation of a long terrestrial rainfall record for the southern mid-latitudes T.C. PARTRIDGE Climatology Research Group, University of the Witwatersrand, Johannesburg,
We re living in the Ice Age!
 Chapter 18. Coping with the Weather: Causes and Consequences of Naturally Induce Climate Change 지구시스템의이해 We re living in the Ice Age! 1 Phanerozoic Climate 서늘해지고 더웠고 따뜻했고 3 Climate Rollercoaster 4 2 Time
Chp Spectral analysis a. Requires that the climate record must be at least 4 times longer than the cycled analyzed
 Chp 7 1. Earth s seasons are caused by a. The movement of the Sun from North to South of the equator and back again over a year s time b. The distance between Earth and the Sun c. The rate of Earth s movement
Ruddiman CHAPTER 13. Earth during the LGM ca. 20 ka BP
 Ruddiman CHAPTER 13 Earth during the LGM ca. 20 ka BP The Last Glacial Maximum When? How much more ice than today? How much colder was it than today (global average)? How much lower were snowlines? Did
Supplementary Figure 1. New downcore data from this study. Triangles represent the depth of radiocarbon dates. Error bars represent 2 standard error
 Supplementary Figure 1. New downcore data from this study. Triangles represent the depth of radiocarbon dates. Error bars represent 2 standard error of measurement (s.e.m.). 1 Supplementary Figure 2. Particle
How is abrupt (paleo) climate change transmitted to the mid latitude Southern Hemisphere? Connecting the tropics to polar regions
 climate change transmitted to the mid latitude Southern Hemisphere? Connecting the tropics to polar regions") How is abrupt (paleo) climate change transmitted to the mid latitude Southern Hemisphere? -or - In defense of the wind hypothesis Connecting the tropics to polar regions LDEO, 2-3 June 2014 Bob Anderson
How is abrupt (paleo) climate change transmitted to the mid latitude Southern Hemisphere? -or - In defense of the wind hypothesis Connecting the tropics to polar regions LDEO, 2-3 June 2014 Bob Anderson
Atlantic Meridional Overturning Circulation (AMOC) = thermohaline circulation in N Atlantic. Wikipedia
 = thermohaline circulation in N Atlantic. Wikipedia") Last time. Atlantic Meridional Overturning Circulation (AMOC) = thermohaline circulation in N Atlantic Wikipedia Dansgaard-Oeschger events HOLOCENE ice record smeared out here Last interglacial Dansgaard-Oeschger
Last time. Atlantic Meridional Overturning Circulation (AMOC) = thermohaline circulation in N Atlantic Wikipedia Dansgaard-Oeschger events HOLOCENE ice record smeared out here Last interglacial Dansgaard-Oeschger
PMIP Ocean Workshop 2013 Program Outline
 PMIP Ocean Workshop 2013 Program Outline We, Dec. 4 8:30-9:15 Introductory Discussion 9:15-10:15 Model-Data Comparison 10:30-12:00 Quantifying Uncertainties 1:00-2:30 LGM and Deglacial Changes in the Tropics
CHAPTER 7 Ocean Circulation Pearson Education, Inc.
 CHAPTER 7 Ocean Circulation 2011 Pearson Education, Inc. Types of Ocean Currents Surface currents Deep currents 2011 Pearson Education, Inc. Measuring Surface Currents Direct methods Floating device tracked
Oceans and Climate. Caroline Katsman. KNMI Global Climate Division
 Oceans and Climate Caroline Katsman KNMI Global Climate Division Aimée Slangen, Roderik van de Wal (IMAU, Utrecht University) Sybren Drijfhout, Wilco Hazeleger (KNMI, Global Climate) Bert Vermeersen (NIOZ/Delft
MERIDIONAL OVERTURNING CIRCULATION: SOME BASICS AND ITS MULTI-DECADAL VARIABILITY
 MERIDIONAL OVERTURNING CIRCULATION: SOME BASICS AND ITS MULTI-DECADAL VARIABILITY Gokhan Danabasoglu National Center for Atmospheric Research OUTLINE: - Describe thermohaline and meridional overturning
MAR 110 LECTURE #10 The Oceanic Conveyor Belt Oceanic Thermohaline Circulation
 1 MAR 110 LECTURE #10 The Oceanic Conveyor Belt Oceanic Thermohaline Circulation Ocean Climate Temperature Zones The pattern of approximately parallel oceanic surface isotherms (lines of constant temperature)
Tracers. 1. Conservative tracers. 2. Non-conservative tracers. Temperature, salinity, SiO 2, Nd, 18 O. dissolved oxygen, phosphate, nitrate
 Tracers 1. Conservative tracers Temperature, salinity, SiO 2, Nd, 18 O 2. Non-conservative tracers dissolved oxygen, phosphate, nitrate Temperature itself is a tracer but other tracers (like oxygen isotopes)
Geochemical fingerprints of the ice-age (Southern) Ocean
 Ocean") Geochemical fingerprints of the ice-age (Southern) Ocean THE SOUTHERN OCEAN, ITS DYNAMICS, BIOGEOCHEMISTRY AND ROLE IN THE CLIMATE SYSTEM NCAR, Boulder, CO 10-13 April 2017 Bob Anderson Motivation: Ice
Geochemical fingerprints of the ice-age (Southern) Ocean THE SOUTHERN OCEAN, ITS DYNAMICS, BIOGEOCHEMISTRY AND ROLE IN THE CLIMATE SYSTEM NCAR, Boulder, CO 10-13 April 2017 Bob Anderson Motivation: Ice
SIO 210 Final Exam Dec Name:
 SIO 210 Final Exam Dec 8 2006 Name: Turn off all phones, pagers, etc... You may use a calculator. This exam is 9 pages with 19 questions. Please mark initials or name on each page. Check which you prefer
Welcome to ATMS 111 Global Warming.
 Welcome to ATMS 111 Global Warming http://www.atmos.washington.edu/2010q1/111 Isotopic Evidence 16 O isotopes "light 18 O isotopes "heavy" Evaporation favors light Rain favors heavy Cloud above ice is
Rapid Climate Change: Heinrich/Bolling- Allerod Events and the Thermohaline Circulation. By: Andy Lesage April 13, 2010 Atmos.
 Rapid Climate Change: Heinrich/Bolling- Allerod Events and the Thermohaline Circulation By: Andy Lesage April 13, 2010 Atmos. 6030 Outline Background Heinrich Event I/Bolling-Allerod Transition (Liu et
Surface Circulation Ocean current Surface Currents:
 All Write Round Robin G1. What makes up the ocean water? G2. What is the source of the salt found in ocean water? G3. How does the water temperature affect the density of ocean water? G4. How does the
2/15/2012. Earth System Science II EES 717 Spring 2012
 Earth System Science II EES 717 Spring 2012 1. The Earth Interior Mantle Convection & Plate Tectonics 2. The Atmosphere - Climate Models, Climate Change and Feedback Processes 3. The Oceans Circulation;
Abyssal Ocean Circulation. Raffaele Ferrari Earth, Atmospheric and Planetary Sciences, MIT Les Houches, August 2017
 Abyssal Ocean Circulation Raffaele Ferrari Earth, Atmospheric and Planetary Sciences, MIT Les Houches, August 2017 Outline The deep ocean The deep circulation The sinking branch: deep convection The upwelling
M. Wary et al. Correspondence to: M. Wary
 Supplement of Clim. Past, 11, 1507 1525, 2015 http://www.clim-past.net/11/1507/2015/ doi:10.5194/cp-11-1507-2015-supplement Author(s) 2015. CC Attribution 3.0 License. Supplement of Stratification of surface
Orbital-Scale Interactions in the Climate System. Speaker:
 Orbital-Scale Interactions in the Climate System Speaker: Introduction First, many orbital-scale response are examined.then return to the problem of interactions between atmospheric CO 2 and the ice sheets
Father of Glacial theory. First investigations of glaciers and mountain geology,
 First investigations of glaciers and mountain geology, 1750-1800 Glaciation happens! -- Historical perspective It happens in cycles -- How do we know this? What are Milankovitch cycles? Sub-Milankovitch
Biogeochemical changes over long time scales
 Biogeochemical changes over long time scales Eric Galbraith McGill University, Montreal, Canada Overview What is a long time? Long timescale observations from marine sediments Very quick look at biogeochemical
LETTERS. Influence of the Thermohaline Circulation on Projected Sea Level Rise
 VOLUME 13 JOURNAL OF CLIMATE 15 JUNE 2000 LETTERS Influence of the Thermohaline Circulation on Projected Sea Level Rise RETO KNUTTI AND THOMAS F. STOCKER Climate and Environmental Physics, Physics Institute,
1. Introduction 2. Ocean circulation a) Temperature, salinity, density b) Thermohaline circulation c) Wind-driven surface currents d) Circulation and
 Temperature, salinity, density b) Thermohaline circulation c) Wind-driven surface currents d) Circulation and") 1. Introduction 2. Ocean circulation a) Temperature, salinity, density b) Thermohaline circulation c) Wind-driven surface currents d) Circulation and climate change e) Oceanic water residence times 3.
1. Introduction 2. Ocean circulation a) Temperature, salinity, density b) Thermohaline circulation c) Wind-driven surface currents d) Circulation and climate change e) Oceanic water residence times 3.
Thermohaline and wind-driven circulation
 Thermohaline and wind-driven circulation Annalisa Bracco Georgia Institute of Technology School of Earth and Atmospheric Sciences NCAR ASP Colloquium: Carbon climate connections in the Earth System Tracer
Chapter 15 Millennial Oscillations in Climate
 Chapter 15 Millennial Oscillations in Climate This chapter includes millennial oscillations during glaciations, millennial oscillations during the last 8000 years, causes of millennial-scale oscillations,
Size matters: another reason why the Atlantic is saltier than the Pacific C.S. Jones and Paola Cessi
 Size matters: another reason why the Atlantic is saltier than the Pacific C.S. Jones and Paola Cessi Scripps Institution of Oceanography University of California, San Diego Proposed reasons for Atlantic
Atmosphere, Ocean, Climate Dynamics: the Ocean Circulation EESS 146B/246B
 Atmosphere, Ocean, Climate Dynamics: the Ocean Circulation EESS 146B/246B Instructor: Leif Thomas TA: Gonçalo Zo Zo Gil http://pangea.stanford.edu/courses/eess146bweb/ Course Objectives Identify and characterize
1 Carbon - Motivation
 1 Carbon - Motivation Figure 1: Atmospheric pco 2 over the past 400 thousand years as recorded in the ice core from Vostok, Antarctica (Petit et al., 1999). Figure 2: Air-sea flux of CO 2 (mol m 2 yr 1
Interhemispheric climate connections: What can the atmosphere do?
 Interhemispheric climate connections: What can the atmosphere do? Raymond T. Pierrehumbert The University of Chicago 1 Uncertain feedbacks plague estimates of climate sensitivity 2 Water Vapor Models agree
Midterm 2: Nov. 20 (Monday)
") Introduction to Oceanography Lecture 18, Current 2 Surface Ocean Currents. Video by Chris Henze, NASA Ames, Public Domain Midterm 2: Nov. 20 (Monday) Review Session & Video Screenings TBA Image from Sverdrup,
Introduction to Oceanography Lecture 18, Current 2 Surface Ocean Currents. Video by Chris Henze, NASA Ames, Public Domain Midterm 2: Nov. 20 (Monday) Review Session & Video Screenings TBA Image from Sverdrup,
Upper Ocean Circulation
 Upper Ocean Circulation C. Chen General Physical Oceanography MAR 555 School for Marine Sciences and Technology Umass-Dartmouth 1 MAR555 Lecture 4: The Upper Oceanic Circulation The Oceanic Circulation
Ocean Mixing and Climate Change
 Ocean Mixing and Climate Change Factors inducing seawater mixing Different densities Wind stirring Internal waves breaking Tidal Bottom topography Biogenic Mixing (??) In general, any motion favoring turbulent
Ice Ages and Changes in Earth s Orbit. Topic Outline
 Ice Ages and Changes in Earth s Orbit Topic Outline Introduction to the Quaternary Oxygen isotopes as an indicator of ice volume Temporal variations in ice volume Periodic changes in Earth s orbit Relationship
/ Past and Present Climate
 MIT OpenCourseWare http://ocw.mit.edu 12.842 / 12.301 Past and Present Climate Fall 2008 For information about citing these materials or our Terms of Use, visit: http://ocw.mit.edu/terms. Ice Sheet Paleoclimatology
SIO 210 Final Exam December 10, :30 2:30 NTV 330 No books, no notes. Calculators can be used.
 SIO 210 Final Exam December 10, 2003 11:30 2:30 NTV 330 No books, no notes. Calculators can be used. There are three sections to the exam: multiple choice, short answer, and long problems. Points are given
Water in the Climate System Lorenz Center Workshop February, 2014
 Water in the Climate System Lorenz Center Workshop February, 2014 Role of the ocean in the coupled hydrological cycle John Marshall Massachusetts Institute of Technology In steady state, atmospheric moisture
Weather & Ocean Currents
 Weather & Ocean Currents Earth is heated unevenly Causes: Earth is round Earth is tilted on an axis Earth s orbit is eliptical Effects: Convection = vertical circular currents caused by temperature differences
Ocean and Climate I.
 Ocean and Climate I http://www.gerhardriessbeck.de/ Physical Characteristics of the Ocean Surface area: 3.61 10 14 m 2 Mean depth: 3.7 km Ocean volume: 3.2 10 17 m 3 Mean density: 1.035 10 3 kg/m 3 Ocean
JEAN-CLAUDE DUPLESSY, MAURICE ARNOLD, EDOUARD BARD, ANNE JUILLET-LECLERC, NEJIB KALLEL
 [RADIOCARBON, VOL 31, No. 3, 1989, P 493-521 AMS 14C STUDY OF TRANSIENT EVENTS AND OF THE VENTILATION RATE OF THE PACIFIC INTERMEDIATE WATER DURING THE LAST DEGLACIATION JEAN-CLAUDE DUPLESSY, MAURICE ARNOLD,
M. Ballarotta 1, L. Brodeau 1, J. Brandefelt 2, P. Lundberg 1, and K. Döös 1. This supplementary part includes the Figures S1 to S16 and Table S1.
 Supplementary Information: Last Glacial Maximum World-Ocean simulations at eddy-permitting and coarse resolutions: Do eddies contribute to a better consistency between models and paleo-proxies? M. Ballarotta
6. What has been the most effective erosive agent in the climate system? a. Water b. Ice c. Wind
 Multiple Choice. 1. Heinrich Events a. Show increased abundance of warm-water species of planktic foraminifera b. Show greater intensity since the last deglaciation c. Show increased accumulation of ice-rafted
The ocean s overall role in climate
 The ocean s overall role in climate - moderates climate in time (diurnally, annually) - redistributes heat spatially in the largescale ocean circulation - lower albedo (sea ice higher albedo) - dry atmosphere
Directed Reading. Section: Ocean Currents. a(n). FACTORS THAT AFFECT SURFACE CURRENTS
. FACTORS THAT AFFECT SURFACE CURRENTS") Skills Worksheet Directed Reading Section: Ocean Currents 1 A horizontal movement of water in a well-defined pattern is called a(n) 2 What are two ways that oceanographers identify ocean currents? 3 What
Skills Worksheet Directed Reading Section: Ocean Currents 1 A horizontal movement of water in a well-defined pattern is called a(n) 2 What are two ways that oceanographers identify ocean currents? 3 What
Sensitivity of the thermohaline circulation to tropical and high latitude freshwater forcing during the last glacial-interglacial cycle
 PALEOCEANOGRAPHY, VOL. 17, NO. 2, 1017, 10.1029/2000PA000591, 2002 Sensitivity of the thermohaline circulation to tropical and high latitude freshwater forcing during the last glacial-interglacial cycle
Natural and anthropogenic climate change Lessons from ice cores
 Natural and anthropogenic climate change Lessons from ice cores Eric Wolff British Antarctic Survey, Cambridge ewwo@bas.ac.uk ASE Annual Conference 2011; ESTA/ESEU lecture Outline What is British Antarctic
S11. Indian Ocean: Supplementary Materials
 C H A P T E R S11 Indian Ocean: Supplementary Materials FIGURE S11.1 Indian Ocean surface circulation (Tables S11.1, S11.2 and Figure 11.1). Surface height (cm). Data from Niiler, Maximenko, and McWilliams
1. Deglacial climate changes
 Review 3 Major Topics Deglacial climate changes (last 21,000 years) Millennial oscillations (thousands of years) Historical Climate Change (last 1000 years) Climate Changes Since the 1800s Climate Change
Mechanisms for an 7-kyr Climate and Sea-Level Oscillation During Marine Isotope Stage 3
 GM01073_CH15.qxd 9/8/07 8:25 AM Page 209 Mechanisms for an 7-kyr Climate and Sea-Level Oscillation During Marine Isotope Stage 3 Peter U. Clark 1, Steven W. Hostetler 2, Nicklas G. Pisias 3, Andreas Schmittner
Today s Climate in Perspective: Hendrick Avercamp ( ) ~1608; Rijksmuseum, Amsterdam
 ~1608; Rijksmuseum, Amsterdam") Today s Climate in Perspective: Paleoclimate Evidence Hendrick Avercamp (1585-1634) ~1608; Rijksmuseum, Amsterdam Observations Instrumental surface temperature records? (Le Treut et al., 2007 IPCC AR4
Today s Climate in Perspective: Paleoclimate Evidence Hendrick Avercamp (1585-1634) ~1608; Rijksmuseum, Amsterdam Observations Instrumental surface temperature records? (Le Treut et al., 2007 IPCC AR4
A bit of background on carbonates. CaCO 3 (solid)
") A bit of background on carbonates CaCO 3 (solid) Organisms need both carbon dioxide and carbonate Kleypas et al 2005 The two pumps put CO 2 into the deep ocean The long term record of climate change Or:
A bit of background on carbonates CaCO 3 (solid) Organisms need both carbon dioxide and carbonate Kleypas et al 2005 The two pumps put CO 2 into the deep ocean The long term record of climate change Or:
Part 1. Ocean Composition & Circulation
 OCN 401 Biogeochemical Systems (10.19.17) (Schlesinger: Chapter 9) Part 1. Ocean Composition & Circulation 1. Introduction Lecture Outline 2. Ocean Circulation a) Global Patterns in T, S, ρ b) Thermohaline
Deep Ocean Circulation & implications for Earth s climate
 Deep Ocean Circulation & implications for Earth s climate I. Ocean Layers and circulation types 1) Ocean Layers Ocean is strongly Stratified Consists of distinct LAYERS controlled by density takes huge
Lecture 18 Paleoceanography 2
 Lecture 18 Paleoceanography 2 May 26, 2010 Trend and Events Climatic evolution in Tertiary Overall drop of sea level General cooling (Figure 9-11) High latitude (deep-water) feature Two major step Middle
Speleothems and Climate Models
 Earth and Life Institute Georges Lemaître Centre for Earth and Climate Research Université catholique de Louvain, Belgium Speleothems and Climate Models Qiuzhen YIN Summer School on Speleothem Science,
Lecture 4:the observed mean circulation. Atmosphere, Ocean, Climate Dynamics EESS 146B/246B
 Lecture 4:the observed mean circulation Atmosphere, Ocean, Climate Dynamics EESS 146B/246B The observed mean circulation Lateral structure of the surface circulation Vertical structure of the circulation
Where is all the water?
 Where is all the water? The distribution of water at the Earth's surface % of total Oceans 97.25 Ice caps and glaciers 2.05 Groundwater 0.68 Lakes 0.01 Soils 0.005 Atmosphere (as vapour) 0.001 Rivers 0.0001
Modeling Low-Oxygen Regions
 Modeling Low-Oxygen Regions Andreas Schmittner College of Oceanic and Atmospheric Sciences Oregon State University 1.How well can global models simulate low- oxygen regions? 2.Long-term projections 3.Variability
Basic Ocean Current Systems. Basic Ocean Structures. The State of Oceans. Lecture 6: The Ocean General Circulation and Climate. Temperature.
 Lecture 6: The Ocean General Circulation and Climate Basic Ocean Current Systems Upper Ocean surface circulation Basic Structures Mixed Layer Wind-Driven Circulation Theories Thermohaline Circulation Ocean
Lecture 1. Amplitude of the seasonal cycle in temperature
 Lecture 6 Lecture 1 Ocean circulation Forcing and large-scale features Amplitude of the seasonal cycle in temperature 1 Atmosphere and ocean heat transport Trenberth and Caron (2001) False-colour satellite
The Ocean Floor THE VAST WORLD OCEAN
 OCEANOGRAPHY Name Color all water LIGHT BLUE. Color all land LIGHT GREEN. Label the 5 Oceans: Pacific, Atlantic, Indian, Arctic, Antarctic. Label the 7 Continents: N.America, S.America, Europe, Asia, Africa,
OCN/ATM/ESS 587. Ocean circulation, dynamics and thermodynamics.
 OCN/ATM/ESS 587 Ocean circulation, dynamics and thermodynamics. Equation of state for seawater General T/S properties of the upper ocean Heat balance of the upper ocean Upper ocean circulation Deep circulation
Understanding the Polar Regions in Climate Change
 AWG Glenwood Sprs, Oct 2007 Understanding the Polar Regions in Climate Change STEM Polar Connections Outline -- What are the Polar Regions Important to Everyone? Geography of the Poles Oceans, land, sea
8. Climate changes Short-term regional variations
 8. Climate changes 8.1. Short-term regional variations By short-term climate changes, we refer here to changes occurring over years to decades. Over this timescale, climate is influenced by interactions
Ocean dynamics: the wind-driven circulation
 Ocean dynamics: the wind-driven circulation Weston Anderson March 13, 2017 Contents 1 Introduction 1 2 The wind driven circulation (Ekman Transport) 3 3 Sverdrup flow 5 4 Western boundary currents (western
What can we learn from the paleo record about past changes in ocean productivity and controls of atmospheric CO 2?
 What can we learn from the paleo record about past changes in ocean productivity and controls of atmospheric CO 2? QuickTime and a TIFF (Uncompressed) decompressor are needed to see this picture. Bob Anderson,
AMOC Impacts on Climate
 AMOC Impacts on Climate Rong Zhang GFDL/NOAA, Princeton, NJ, USA Paleo-AMOC Workshop, Boulder, CO, USA May 24, 2016 Atlantic Meridional Overturning Circulation (AMOC) Kuklbrodt et al. 2007 McManus et al.,
SIO 210 Introduction to Physical Oceanography Mid-term examination November 3, 2014; 1 hour 20 minutes
 NAME: SIO 210 Introduction to Physical Oceanography Mid-term examination November 3, 2014; 1 hour 20 minutes Closed book; one sheet of your own notes is allowed. A calculator is allowed. (100 total points.)
Chemical Oceanography Spring 2000 Final Exam (Use the back of the pages if necessary)(more than one answer may be correct.)
(more than one answer may be correct.)") Ocean 421 Your Name Chemical Oceanography Spring 2000 Final Exam (Use the back of the pages if necessary)(more than one answer may be correct.) 1. Due to the water molecule's (H 2 O) great abundance in
Ocean 421 Your Name Chemical Oceanography Spring 2000 Final Exam (Use the back of the pages if necessary)(more than one answer may be correct.) 1. Due to the water molecule's (H 2 O) great abundance in
This article appeared in a journal published by Elsevier. The attached copy is furnished to the author for internal non-commercial research and
 This article appeared in a journal published by Elsevier. The attached copy is furnished to the author for internal non-commercial research and education use, including for instruction at the authors institution
The World Ocean. Pacific Ocean 181 x 10 6 km 2. Indian Ocean 74 x 10 6 km 2. Atlantic Ocean 106 x 10 6 km 2
 The World Ocean The ocean and adjacent seas cover 70.8% of the surface of Earth, an area of 361,254,000 km 2 Pacific Ocean 181 x 10 6 km 2 Indian Ocean 74 x 10 6 km 2 Atlantic Ocean 106 x 10 6 km 2 Oceanic
THE EFFECT OF A SUCCESSION OF OCEAN VENTILATION CHANGES ON 14C
 THE EFFECT OF A SUCCESSON OF OCEAN VENTLATON CHANGES ON 14C THOMAS F. STOCKER Climate and Environmental Physics, Physics nstitute, University of Bern, Sidlerstrasse 5 CH-3012 Bern, Switzerland and DANEL
Introduction to Quaternary Geology (MA-Modul 3223) Prof. C. Breitkreuz, SS2012, TU Freiberg
 Prof. C. Breitkreuz, SS2012, TU Freiberg") Introduction to Quaternary Geology (MA-Modul 3223) Prof. C. Breitkreuz, SS2012, TU Freiberg 1. Introduction: - Relevance, and relations to other fields of geoscience - Lower stratigraphic boundary and
Introduction to Quaternary Geology (MA-Modul 3223) Prof. C. Breitkreuz, SS2012, TU Freiberg 1. Introduction: - Relevance, and relations to other fields of geoscience - Lower stratigraphic boundary and
Arne Biastoch Helmholtz Centre for Ocean Research Kiel. Modelling the Agulhas Current and its Coupling with the Atlantic Circulation
 Arne Biastoch Helmholtz Centre for Ocean Research Kiel Modelling the Agulhas Current and its Coupling with the Atlantic Circulation The Agulhas System as a Key Region of the Global Oceanic Circulation
When Did the Anthropocene Begin? Observations and Climate Model Simulations
 When Did the Anthropocene Begin? Observations and Climate Model Simulations by John Kutzbach University of Wisconsin-Madison March 31, 2011 Colleagues: W. Ruddiman, S. Vavrus, G. Philippon-Berrthier Main
Agulhas Leakage in the CCSM4. Wilbert Weijer (LANL, Los Alamos) Erik van Sebille (UNSW, Sydney)
 Erik van Sebille (UNSW, Sydney)") Agulhas Leakage in the CCSM4 Wilbert Weijer (LANL, Los Alamos) Erik van Sebille (UNSW, Sydney) Slide 1 Agulhas Leakage Exchange of water between South Indian and Atlantic Oceans Takes part in Supergyre
Agulhas Leakage in the CCSM4 Wilbert Weijer (LANL, Los Alamos) Erik van Sebille (UNSW, Sydney) Slide 1 Agulhas Leakage Exchange of water between South Indian and Atlantic Oceans Takes part in Supergyre
ATOC OUR CHANGING ENVIRONMENT
 ATOC 1060-002 OUR CHANGING ENVIRONMENT Class 22 (Chp 15, Chp 14 Pages 288-290) Objectives of Today s Class Chp 15 Global Warming, Part 1: Recent and Future Climate: Recent climate: The Holocene Climate
SUPPLEMENTARY INFORMATION
 SUPPLEMENTARY INFORMATION DOI: 1.138/NGEO168 "Strength and geometry of the glacial Atlantic Meridional Overturning Circulation" S2 Map of core locations Core locations of the Holocene and LGM 231 / 23
SUPPLEMENTARY INFORMATION
 SUPPLEMENTARY INFORMATION DOI: 10.1038/NGEO1189 Different magnitudes of projected subsurface ocean warming around Greenland and Antarctica Jianjun Yin 1*, Jonathan T. Overpeck 1, Stephen M. Griffies 2,
Stalagmite records of abrupt climate change in the tropical Pacific
 Stalagmite records of abrupt climate change in the tropical Pacific Kim Cobb Georgia Inst. of Technology Jud Partin UT-Austin Jess Adkins California Inst. of Technology Brian Clark Gunung Mulu National
GEOPHYSICAL RESEARCH LETTERS, VOL. 33, L15706, doi: /2006gl026923, 2006
 Click Here for Full Article GEOPHYSICAL RESEARCH LETTERS, VOL. 33, L15706, doi:10.1029/2006gl026923, 2006 Modeling the oxygen-isotopic composition of the North American Ice Sheet and its effect on the
Pathways in the ocean
 Pathways Pathways in the in the ocean by Sybren Drijfhout Introduction The properties of water masses in the ocean are set by air-sea interactions at the surface and convective overturning. As direct transfer
Ocean Circulation- PART- I: In Class. Must be done inclass, and turned in before you leave for credit.
 Name: Section/ TA: Ocean Circulation- PART- I: In Class. Must be done inclass, and turned in before you leave for credit. Activity 1: The Sverdrup In our homes, we are used to calculating water volumes
Ice on Earth: An overview and examples on physical properties
 Ice on Earth: An overview and examples on physical properties - Ice on Earth during the Pleistocene - Present-day polar and temperate ice masses - Transformation of snow to ice - Mass balance, ice deformation,
CLIMATE SHOCK: ABRUPT CHANGES OVER MILLENNIAL TIME SCALES
 CLIMATE SHOCK: ABRUPT CHANGES OVER MILLENNIAL TIME SCALES What is the natural variability of our climate? This simple question is, in fact, very hard to answer, from either the theoretical or observational
Early warning of climate tipping points Tim Lenton
 Early warning of climate tipping points Tim Lenton With thanks to John Schellnhuber, Valerie Livina, Vasilis Dakos, Marten Scheffer Outline Tipping elements Early warning methods Tests and application
isopycnal outcrop w < 0 (downwelling), v < 0 L.I. V. P.
, v < 0 L.I. V. P.") Ocean 423 Vertical circulation 1 When we are thinking about how the density, temperature and salinity structure is set in the ocean, there are different processes at work depending on where in the water
Ocean 423 Vertical circulation 1 When we are thinking about how the density, temperature and salinity structure is set in the ocean, there are different processes at work depending on where in the water
Marine Oxygen Isotopes and Changes in Global Ice Volume
 Marine Oxygen Isotopes and Changes in Global Ice Volume Name: You have learned about the value of marine oxygen-isotope records for understanding changes in ocean-water temperature and global ice volume
Understanding past climate change
 Steven J. Phipps ARC Centre of Excellence for Climate System Science Climate Change Research Centre University of New South Wales CLIM1001 Introduction to Climate Change 3 September 2013 1 Why past climates
2. Meridional atmospheric structure; heat and water transport. Recall that the most primitive equilibrium climate model can be written
 2. Meridional atmospheric structure; heat and water transport The equator-to-pole temperature difference DT was stronger during the last glacial maximum, with polar temperatures down by at least twice
Muted change in Atlantic overturning circulation over some glacial-aged Heinrich events
 SUPPLEMENTARY INFORMATION DOI: 10.1038/NGEO2045 Muted change in Atlantic overturning circulation over some glacial-aged Heinrich events Jean Lynch-Stieglitz 1, Matthew W. Schmidt 2, L. Gene Henry 1,7,
Thermohaline Circulation
 OCEAN CIRCULATION / Thermohaline Circulation 1549 distinctly nonsteady character of the ocean circulation. Ocean currents are remarkably variable. Variability on much shorter time scales of weeks and months,