[1]The surface melt-area time-series ( ) of the Greenland Ice Sheet (GrIS) shows large
|
|
|
- Amberly Walters
- 6 years ago
- Views:
Transcription
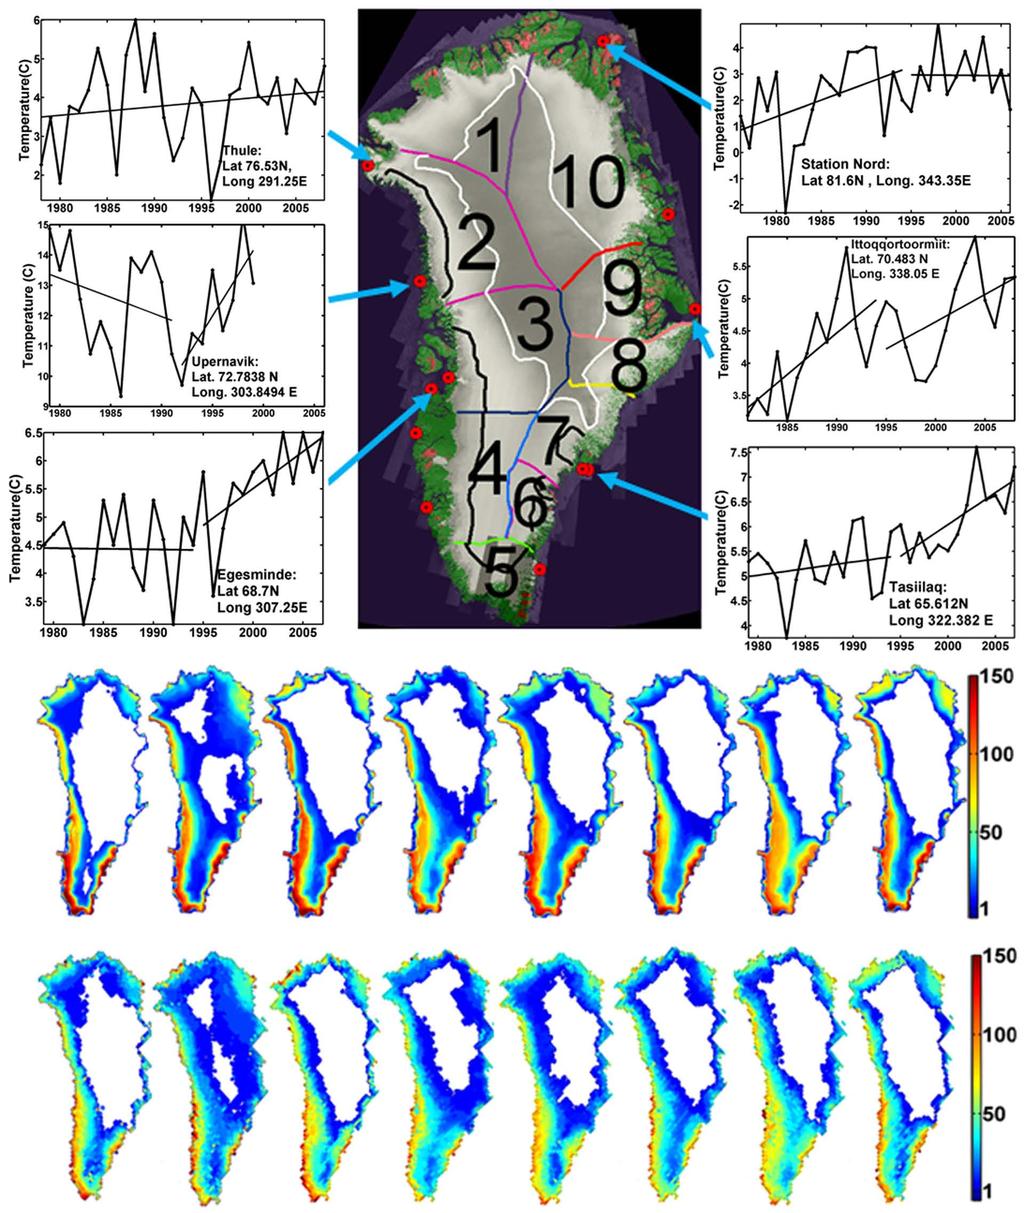
1 Surface melt area variability of the Greenland Ice Sheet: Indrajit Bhattacharya, Kenneth C. Jezek Byrd Polar Research Center, Ohio State University, Columbus, OH, USA Lei Wang Department of Geography and Anthropology, Louisiana State University, Baton Rouge, LA, USA Hongxing Liu Department of Geography, Texas A&M University, College Station, TX, USA [1]The surface melt-area time-series ( ) of the Greenland Ice Sheet (GrIS) shows large spatio-temporal variability. The overall melt-area time-series is characterized by a step-like increase in The melt-area trend for the entire ice-sheet between is 7.64x10 3 ±4.79x10 3 km 2 /year, which is 8-times higher than the period between (9.64x10 2 ±1.10x10 4 km 2 /year). This step-like increase of melt area in 1995 coincides well with mean summer air temperature patterns at 8 coastal sites. We find that the melt area and temperature change in 1995, both coincide to a general sign-reversal in the North Atlantic Oscillation (NAO) index in We also find that the northerly sectors of the ice sheet do not clearly coincide with changes in the NAO suggesting the influence of NAO is being felt predominantly on the central-eastern and central-western sectors of the ice sheet. 1. Introduction [2] Surface melting on the GrIS is an important indicator of Arctic terrestrial climate change much as the observations of dwindling Arctic sea-ice document climate change over the polar ocean [Stroeve et al. 2008]. Space-borne passive microwave (PM) measurements show that the melt-area of the GrIS has increased since the start of observations in the 1970 s to the present. Although reported estimates of absolute melt-area vary depending on parameters such as selected land-mask, algorithm and data sets, most investigators conclude that melt area is increasing at a
2 linear rate somewhere between 0.6 to 1.8x10 4 km 2 /year [Abdalati and Steffen, 1997; Joshi et al., 2001;Tedesco, 2007; Mote, 2007] based on PM measurements. [3] In this paper we adapt a recently developed PM algorithm [Liu et al., 2005] to investigate both the spatial and temporal melt patterns across the GrIS. The Liu algorithm was successfully applied to measure surface melt across the Antarctic Ice Sheet [Liu et al., 2006]. Their statistical method provides a more objective and precise melt onset-date, melt end-date and melt duration. After validating our estimates by comparison with an independent threshold based melt estimation technique [Ashcraft and Long, 2006] applied to the shorter time-series Quick Scatterometer (QuikSCAT), we show that the GrIS melt record includes important spatial and temporal patterns. In particular, we observe a persistent step-like increase in total melt area since The event appears to coincide with coastal summer temperature change and a general signreversal of the NAO index in Data [4] Primarily, we use three data sets: Tb from Scanning Multichannel Microwave Radiometer (SMMR, ), daily Tb data from Special Sensor Microwave Imager (SSM/I, ) and daily backscatter (σ 0 ) data from QuikSCAT ( ). For SMMR we used averaged, every alternate-day, polar-stereographic, Tb data gridded at 25km. The NSIDC SMMR polar stereographic product was selected because unlike the SMMR EASE grid product, it provides complete spatial coverage over the GrIS. However, a pixel in polar stereographic projection has an areal distortion of 4% at 81 N and -6% at 61 N latitude respectively, but these distortions are small in the context of our analysis. For SSM/I we use the EASE grid equal area projection data gridded at 25km. We chose ascending orbit data from F-11 and F-13 satellites for the period
3 and descending orbit data from F-8 satellite for the period as these periods corresponds to the time of maximum daily melt. For a large number of days in 1994, ascending swath data over Greenland are missing, hence we substitute descending orbit data for Following Liu et al. [2006], we used 18GHz for SMMR and 19GHz for SSM/I (H-polarization for both) for our melt calculation. [5] For QuikSCAT, we used 13GHz, V-polarized, polar stereographic data gridded at 4.45km. We use descending swath Version 1 Enhanced Resolution (QuikSCAT L1B) egg data (rather than slice data which has a higher noise level) for the period For Version 2 products from , we use evening σ 0 data for our melt calculation. The Greenland land mask for QuikSCAT was provided by D. Long at Brigham Young University. [6]The Greenland land masks for EASE and polar stereographic grids are provided by NSIDC. We refined these three masks based on the snow classification map of Greenland (courtesy of Kort and Matrikelstyrelsen at National Survey and Cadastre, Denmark) and the RADARSAT-1 SAR mosaic of Greenland (courtesy of Ian Joughin). We also used NAO data (courtesy of NOAA) and air temperature records from 12 coastal weather stations that were available courtesy of NOAA, NASA, Royal Netherlands Meteorological Institute and Norwegian Meteorological Institute. 3. Method 3.1 Melt Detection from PM [7] Melt is detectable in the PM time-series because of sharp changes in Tb associated with the presence of small amounts of water in the snowpack [England, 1976]. Joshi et al. [2001] applied an edge detection algorithm to the Tb time-series for surface melt detection over GrIS which was
4 improved by Liu et al. [2005] by using a multi-scale wavelet transform technique. Melt detection is based on the observation that strong edges correspond to snow melting and refreezing events. Liu s statistical method used globally computed parameters, which proved acceptable for Antarctica where melting is generally limited to near coastal regions. Because there are stronger melt facies gradients across the smaller GrIS, we adapted the Liu method to include locally computed parameters. [8] We divide GrIS into 10 sectors roughly corresponding to glacier drainages and based on surface slope and ice flow pattern (Bea Csatho, personal communication) and further subdivide each sector into wet, percolation and dry snow facies (Figure 1a). The snow facies were delineated based on the relative change of σ 0 in the SAR mosaic; the wet facies can be observed very clearly towards the margin of the ice-sheet based on the presence of melt lakes; very low backscatter corresponds to darkest shades which correspond to dry snow facies in the central part of the ice-sheet and the region in-between the wet and the dry snow is the percolation facies. Because C-band radar penetrates several meters into the firn (which is equivalent of several years), the delineated facies boundary from the SAR image is ambiguous because of temporal smearing. Hence our dry snow facies boundary is conservative. [8] Following the sector-wise division of the PM coverage of the ice-sheet, the annual Tb timeseries of each pixel is decomposed using a multi-scale wavelet transform. We divide the annual Tb time-series into summer and winter and calculate a critical value for the edge strengths during summer and winter periods for each year and for each pixel covering the ice-sheet. The critical value of a pixel is the edge strength which partitions the edges into two groups representing melt and non-melt events [Liu et al. 2005]. Then for each pixel we compute the 10- year average of the critical values between separately for summer and winter.
5 Subsequently, we generate histograms of averaged summer-winter critical values for all pixels within each facies of each sector. We select a local optimal-threshold for edges to identify melt events from these histograms. This local optimal threshold incorporates both the temporal and spatial variability of the edges strengths corresponding to melt events of a facies. [9] To identify spurious edges caused by abrupt but sub-freezing changes in physical temperature during the early spring, we apply an extra criterion. We check if the Tb for a pixel during any day is greater than half of the mean maximum Tb during the summer months. This Tb value is referred to as the outlier-threshold. If the edge strength and the Tb value exceed both optimalthreshold and outlier-threshold, we consider the detected edge to be a valid melt event. Our algorithm depends on the relative change of Tb so we did not, in general inter-calibrate SMMR and SSM/I data. Because the operational lifespan of SMMR ended in mid August 1987 shortly after the start of SSM/I, we did calibrate the 1987 SSM/I data using the calibration coefficient from Jezek et al. [1993] so as to create a continuous time-series for Melt Detection from QuikSCAT [10] Nghiem et al. [2001], Steffen et al. [2004] and Wang et al. [2007] used QuikSCAT data to estimate surface melt and melt intensity from decrease in σ 0 associated with melt onset. Based on a snow backscatter model, Ashcraft and Long [2006] suggested that a wet snow layer of 3.8 cm thickness and 1% of liquid moisture content results in a -2.7 db decrease in σ 0. Careful observation of σ 0 time-series for melt pixels shows that the decrease in σ 0 due to the presence of water can be gradual and only reaches a minimum after more than 2-3 days. So, our melt start criterion is: if within 3 consecutive days σ 0 decreases by 3 db, then we designate this decrease as a signal for melt onset. Detection of end-of-melt is tricky because refreeze can result in a sudden
6 increase in σ 0 by over 10 db. Zabel et al. [1995] reported that development of ice pipes and ice lenses can increase the total equivalent surface σ 0 by ~12 db. So we define the day when the σ 0 value returns to within 3 db of the mean winter backscatter as the end-of-melt event. We specify January-March and November-December as the winter season and calculate the mean winter σ 0 during these months. 4. Results [11] Figure 1b and 1c show melt extents and durations calculated from threshold based analysis of QuikSCAT σ 0 data and wavelet analysis of SSM/I Tb data for the overlap period. Because QuikSCAT has a higher spatial resolution compared to SSM/I, the QuikSCAT melt duration maps vary more smoothly. The correlation coefficient of melt-extent time-series between the SSM/I estimates and the QuikSCAT estimates is 0.98 for the period Unlike the EASE grid PM data, the high spatial resolution QuikSCAT data is an averaged σ 0 data measured over the period of a day. Hence there is a difference in observation time which results in a small difference in the melt-area observed by the two sensors. We also observe that QuikSCAT melt duration is slightly higher than PM estimates (Figure 1b). This is because our mean winter backscatter value is most likely conservative and hence we estimate a longer melt duration for QuikSCAT. [12] We compare our results with PM derived melt estimates of Joshi et al. [2001] for and with Wang et al. s [2007] QuikSCAT results (Figure 2a). Joshi used a larger land mask and a different data projection for SSM/I and hence her estimates of annual surface melt-area are slightly biased compared to ours although the inter-annul variations are
7 very similar. Our melt estimates from QuikSCAT for the period overlap those of Wang (Figure 2a) and the correlation coefficient is Discussion [13] Our surface melt-area time-series (Figure 2b) shows a persistent increase in melt-area after So rather than estimating a linear rate of increase for the entire record, we fit separate least square regression lines to the periods before and after We find that the surface melt-area increase at 7.64x10 3 ±4.79x10 3 km 2 /year between where as the increase is only 9.64x10 2 ±1.10x10 4 km 2 /year between The error for the melt-area trend from is particularly large because of weighting by the anomalously high melt-area in 2002 and larger inter-annual variability after The 2002 melt event was probably caused by warm air advection steered by strong southerly flow associated with a high pressure ridge extending over the GrIS from the North Atlantic Ocean [Wang et al. 2007]. [14] The sector-wise melt-area percentage time-series of the GrIS show large inter-sector variability (Figure 3: a, b, c). Three out of four southerly sectors (4, 5, 6 in figure 1a) have been melting completely since early 1990 s and have little influence on the ice-sheet wide surface melt-area trend. Sector 7 shows a large inter-annual variability and also experiences maximum melt for nine years since the early 1990 s. Sector 1 and 10 which constitutes the northerly part of the ice sheet, show large inter-annular variability and a general increase of 4.74x10 3 ±1.37x10 3 km 2 /year in melt-area from For sector 2, 3, 8 and 9 which constitutes the mid-section of the ice-sheet, the melt-area increases by 3.14x10 3 ±2.54x10 3 km 2 /year till 1994 and from the trend is statistically not different from zero. The melt area records for the central sectors of the ice sheet indicate a step-like
8 increase starting in 1995 but any such record is obscured in the south by melt area saturation. The record is more gradually varying for the northernmost sectors. [15] To investigate correlation between the melt record and other climate data, we analyzed the mean summer temperature for 12 coastal weather stations (Figure 1a). We find two periods in the temperature records for 8 of the sites, similar to the observed trends in the sector-wise surface melt-area time-series. The mean summer temperature plots of 6 representative weather stations are shown in Figure 1a. In the northwest the temperature trend is slightly increasing at Thule which is situated near the boundary of sector 1 and 2. The available shorter time-series ( ) of mean summer temperature at Upernavik (located in sector 2) reveals a warmer period between 1986 to 1992 that correlates well with elevated melt extent for sectors 2, 3, 8 and 9 (Figure 3c) although the strong early 1980 s warming period at Upernavik seems only weekly reflected in the same melt records. [16] At Station-Nord (sector 10), temperature increases till 1995 after which there is no discernable trend. The melt-area percentage time-series for sector 10 also shows similar behavior however the strong melt event in 2002 is not particularly observable as a warming in the coastal air temperature. The mean summer air temperature at Ittoqqortoormiit (in sector 9) is partitionable into two trends before and after 1995 but the temperature record does not clearly show the step-like change so evident in the surface melt record (Figure 3c). More to the south, temperature records at Tasiilaq (in sector 7) and Godthåb (in sector 4, temperature plot not shown) show a clear break at about However the melt records for the associated sectors are near saturation so any correlation with air temperature is masked. The temperatures at Ilulissat (in sector 3, temperature plot not shown) and Edgesminde (in sector 3) show a break in 1995 (Figure 1a) which correlates with the step-like increase in melt-area since 1995 (Figure 3b).
9 [17] Based on Mote s [1998] observation of a relationship between Greenland surface melt and mid-tropospheric circulation, we investigated regional factors affecting the spatial variability of sector-wise melt-trend change in In particular we looked at NAO and its influence on the GrIS. NAO describes the variation of Arctic and sub-tropical Atlantic atmospheric masses and is quantified by the difference of surface pressure anomalies between Iceland and the Azores [Thompson et al., 2005]. NAO variability has been linked with storm tracks, cyclones, sea-ice extent, precipitation patterns and temperature trends on the GrIS [Calder et al. 2008]. [18]Studies of NAO and coastal air temperature of Greenland show that air temperature is inversely correlated with NAO index [Box et al., 2002, Hanna et al., 2003]. Hanna et al. [2008] later reported that the negative correlation of annual NAO and air temperature over GrIS has become weaker since the mid-1990 s when the NAO index became more negative. Holland et al. [2008] reported a substantial increase in the subsurface ocean temperatures around the western coast of Greenland in 1997 and they related the warming with a sign-reversal of the NAO index during winter of Figure 3d shows the comparison of normalized annual melt-area percentage (difference between annual melt-area and average melt-area for 30 years, divided by the average) and the monthly NAO index (smoothed by 6 months running average) from ( We observe that the NAO index swiches from predominantly positive to predominantly negative values in This event coincides with the step-like increase of melt area in 1995 and is consistent with the inverse relationship between air temperature and NAO index. [19]The NAO does not affect the entire GrIS in a uniform manner. Results from Thompson et al. [2005] and Calder et al. [2008] show that the NAO modulation of snow accumulation over GrIS is most persistent along the northwest and west-central side and to a lesser extent in the
10 southeast. Indeed, sectors 2 and 3, which show the step-like increase of melt-area since 1995 (Figure 3c), comprise most of the north-western and west-central area of the GrIS (Figure 1a). The mean summer temperature at coastal sites in these two sectors also shows an increase since But we also find a correlation between the step-like air temperature trend and the melt-area trend for sectors 8 and 9 which comprise the east-central part of the GrIS. This suggests a possible influence of NAO on the east central temperature of the ice sheet too. We interpret the absence of a step change in melt-area for northerly sectors as evidence that the influence of changing NAO signal is not yet being felt at those latitudes. The influence of NAO on melt areas of our southerly sectors is masked by saturated melt signatures. 6.0 Conclusion [19] We find a large spatial variability in the melt-area record of the GrIS. The melt-area time series of the ice-sheet is separable into a period before 1995 and a period after Before 1995 the melt area increase rate is greater than the rate after 1995 although there is larger inter-annual variability since The lower rate since 1995 can be partly explained by the fact that the southerly melt area record is essentially saturated and no longer contributes to the trends. The northerly melt area records are gradually increasing at a rate of 4.74x10 3 ±1.37x10 3 km 2 /year (almost 1.05% per year of the total area of sector 1 and 10). At this rate the melt record in the north will become saturated in approximately 116 years. The mid-section of the ice-sheet, which constitutes approximately 22% of the entire GrIS, shows a brief increase in melt from followed by a steep and persistent increase in melt-area starting in This 1995 event coincides with changes in summer temperature and a change of NAO index from positive to
11 negative in the mid-1990 s. Our melt analysis further suggests that a changing NAO affects both the central western and central eastern sides of the ice-sheet but not yet the northerly sectors. [20] Acknowledgements. This work was funded by NASA s polar oceans and ice-sheet program and NSF s CRESIS project. We thank NSIDC in Boulder, Colorado, for providing the brightness temperature data. QuikSCAT data were provided by Brigham Young University Scatterometer Climate Record Pathfinder project. We thank David Long for his help. Finally we thank the editor and the anonymous reviewers for their constructive suggestions. References Abdalati, W., K. Steffen (1997), Snowmelt on the Greenland ice sheet as derived from passive microwave satellite data, J. Clim., 10, Ashcraft, I. S., and D.G. Long (2006), Comparison of methods for melt detection over Greenland using active and passive microwave measurements, Int. J. Remote Sens., 27(12-14), July 2006, Box, Jason E. (2002), Survey of Greenland Instrumental Temperature Records: , Int. J. Climatol., 22, Calder, C. A., P. F. Craigmile, and E. M. Thompson (2008), Spatial variation in the influence of the North Atlantic Oscillation on precipitation across Greenland, J. Geophys. Res., 113, D06112, doi: /2007jd England, A.W. (1976), Relative influence upon microwave emissivity of fine scale stratigraphy, internal scattering and dielectric properties, Pageoph., 114,
12 Hanna, E., and J. Cappelen (2003), Recent cooling in coastal southern Greenland and relation with the North Atlantic Oscillation, Geophys. Res. Lett., 30, 1132, doi: /2002gl Hanna, E., and others (2008), Increased runoff from melt from the Greenland Ice Sheet: A response to global warming, J. Clim.,21(2) doi: /2007jcl Holland, M.D., R. H. Thomas, B. D. Young and M. H. Ribergaard (2008), Acceleration of Jakobshavn Isbræ triggered by warm subsurface ocean waters, Nature,1, Jezek, K. C., C. J. Merry and D. J. Cavalieri (1993), Comparison of SMMR and SSM/I passive microwave data collected over Antarctica, Ann. Glacio., 17, Joshi, M., C. J. Merry, K.C. Jezek and John F. Bolzan (2001), An edge detection technique to estimate melt duration season and melt extent on the Greenland ice sheet using passive microwave data, Geophys. Res. Lett., 28(15), Pages Liu, H., L. Wang and K.C. Jezek (2005), Wavelet transform based edge detection approach to derivation of snowmelt onset, end and duration from satellite passive microwave measurements, Int. J. Remote Sens., 26 (21), Liu, H., L. Wang and K.C. Jezek (2006), Spatiotemporal variations of snowmelt in Antarctica derived from satellite scanning multichannel microwave radiometer and special sensor microwave imager data ( ), J. Geophys. Res., 111, F01003, doi: /2005jf Mote, T.L. (1998), Mid-Tropospheric circulation and surface melt on the Greenland Ice Sheet. Part II: Synoptic Climatology, Int. J. Clim., 18, Mote, T.L. (2007), Greenland surface melt trends : Evidence of a large increase in 2007, Geophys. Res. Lett., 34, L22507, doi: /2007gl
13 Nghiem, S.V., K. Steffen, R. Kwak, and W.Y. Tsai (2001), Detection of snowmelt regions on Greenland ice sheet using diurnal backscatter change, J. Glaciol., 47(159), Steffen, K., S.V. Ngheim, R. Huff, and G. Neumann (2004), The melt anomaly of 2002 on the Greenland ice sheet from active and passive microwave satellite observations, Geophys. Res. Lett., 31, L20402, doi: /2004gl Stroeve, J., and others (2008), Arctic Sea Ice Extent Plummets in 2007, Eos Trans. AGU, 89(2), doi: /2008eo Tedesco, M. (2007), Snowmelt detection over the Greenland ice sheet from SSM/I brightness temperature daily variations, Geophys. Res. Lett., 34, L02504, doi: /2006gl Wang, L., M. Sharp, B. Rivard, and Konrad Steffen (2007), Melt season duration and ice layer formation on the Greenland ice-sheet, , J. Geophys. Res., 112, F04013, doi: /2007jf Thompson, E. M., C.R. Readinger, P. Craigmile, L.G. Thompson, and C.A. Calder (2005), Regional sensitivity of Greenland precipitation to NAO variability, Geophys. Res. Lett., 32, L24707, doi: /2005gl Zabel I.H.H., K.C. Jezek, P.A. Baggeroer, and S.P. Gogineni (1995), Ground-based radar observations of snow stratigraphy and melt processes in the percolation facies of the Greenland ice sheet, Ann. Glaciol., 21,
14 Figure Captions Figure 1: (a) Greenland Ice Sheet divided into 10 sectors and each sector further sub-divided into snow facies. The white line delineates the dry snow facies. The region between the black lines and the ice-sheet margin corresponds to wet facies, while regions in-between black and white lines correspond to percolation facies. The red dots corresponds to 12 coastal weather stations (b) Melt extent and duration for GrIS for from QuikSCAT and (c) from SSM/I. Figure 2: (a) Surface melt area comparison between QuikSCAT and PM from the present work and results of Joshi and Wang (b) PM surface melt area and trends from as calculated using the wavelet algorithm. Figure 3: (a) The percentage change in melt-area time-series for three southerly sectors showing saturation in melt-area since 1990 s and a fourth sector with large variability.(b) The percentage change in melt-area time-series for two northerly sectors with large variability and a linear increasing trend. (c) The percentage change in melt-area time-series for the four sectors with a prominent step-like increase in (d) Monthly NAO Index (smoothed by 6 months running average) and normalized annual melt-area percentage from
15
16

17
Surface melt area variability of the Greenland ice sheet:
 Click Here for Full Article GEOPHYSICAL RESEARCH LETTERS, VOL. 36, L20502, doi:10.1029/2009gl039798, 2009 Surface melt area variability of the Greenland ice sheet: 1979 2008 Indrajit Bhattacharya, 1 Kenneth
Melt season duration and ice layer formation on the Greenland ice sheet,
 JOURNAL OF GEOPHYSICAL RESEARCH, VOL. 112,, doi:10.1029/2007jf000760, 2007 Melt season duration and ice layer formation on the Greenland ice sheet, 2000 2004 Libo Wang, 1,2 Martin Sharp, 1 Benoit Rivard,
+SOI Neutral SOI -SOI. Melt+ Melt- Melt+ Melt- Melt+ Melt- +SAM 1 (0.76) 6 (3.02) 1 (1.13) 5 (4.92) 1 (2.27) 0 (1.89) 14
 6 (3.02) 1 (1.13) 5 (4.92) 1 (2.27) 0 (1.89) 14") Supplementary Table 1. Contingency table tallying the respective counts of positive and negative surface melt index anomalies in the Ross sector as a function of the signs of the Southern Annular Mode
Supplementary Table 1. Contingency table tallying the respective counts of positive and negative surface melt index anomalies in the Ross sector as a function of the signs of the Southern Annular Mode
Unquiea Wade 2 Department of Math and Computer Science Elizabeth City State University Elizabeth City NC, 27909
 A Comparison of Passive Microwave Derive Melt Extent to Melt Intensity Estimated From Combined Optical and Thermal Satellite Signatures over the Greenland Ice Sheet For 22 Derrick Lampkin 1 Department
Pan arctic terrestrial snowmelt trends ( ) from spaceborne passive microwave data and correlation with the Arctic Oscillation
 from spaceborne passive microwave data and correlation with the Arctic Oscillation") GEOPHYSICAL RESEARCH LETTERS, VOL. 36, L21402, doi:10.1029/2009gl039672, 2009 Pan arctic terrestrial snowmelt trends (1979 2008) from spaceborne passive microwave data and correlation with the Arctic Oscillation
GEOPHYSICAL RESEARCH LETTERS, VOL. 36, L21402, doi:10.1029/2009gl039672, 2009 Pan arctic terrestrial snowmelt trends (1979 2008) from spaceborne passive microwave data and correlation with the Arctic Oscillation
We greatly appreciate the thoughtful comments from the reviewers. According to the reviewer s comments, we revised the original manuscript.
 Response to the reviews of TC-2018-108 The potential of sea ice leads as a predictor for seasonal Arctic sea ice extent prediction by Yuanyuan Zhang, Xiao Cheng, Jiping Liu, and Fengming Hui We greatly
JOURNAL OF GEOPHYSICAL RESEARCH, VOL. 111, F01003, doi: /2005jf000318, 2006
 JOURNAL OF GEOPHYSICAL RESEARCH, VOL. 111,, doi:10.1029/2005jf000318, 2006 Spatiotemporal variations of snowmelt in Antarctica derived from satellite scanning multichannel microwave radiometer and Special
Passive Microwave Sea Ice Concentration Climate Data Record
 Passive Microwave Sea Ice Concentration Climate Data Record 1. Intent of This Document and POC 1a) This document is intended for users who wish to compare satellite derived observations with climate model
Differentiation between melt and freeze stages of the melt cycle using SSM/I channel ratios
 Brigham Young University BYU ScholarsArchive All Faculty Publications 2005-06-01 Differentiation between melt and freeze stages of the melt cycle using SSM/I channel ratios David G. Long david_long@byu.edu
The North Atlantic Oscillation: Climatic Significance and Environmental Impact
 1 The North Atlantic Oscillation: Climatic Significance and Environmental Impact James W. Hurrell National Center for Atmospheric Research Climate and Global Dynamics Division, Climate Analysis Section
Sep May Ppt Anomaly (N = 60)
") balance (annual net balance and its summer/winter components) measures how climate affects the health of Arctic glaciers. As most 2007 08 measurements are not yet available, we report results for the 2006
balance (annual net balance and its summer/winter components) measures how climate affects the health of Arctic glaciers. As most 2007 08 measurements are not yet available, we report results for the 2006
Studying snow cover in European Russia with the use of remote sensing methods
 40 Remote Sensing and GIS for Hydrology and Water Resources (IAHS Publ. 368, 2015) (Proceedings RSHS14 and ICGRHWE14, Guangzhou, China, August 2014). Studying snow cover in European Russia with the use
APPENDIX B PHYSICAL BASELINE STUDY: NORTHEAST BAFFIN BAY 1
 APPENDIX B PHYSICAL BASELINE STUDY: NORTHEAST BAFFIN BAY 1 1 By David B. Fissel, Mar Martínez de Saavedra Álvarez, and Randy C. Kerr, ASL Environmental Sciences Inc. (Feb. 2012) West Greenland Seismic
Global Atmospheric Circulation
 Global Atmospheric Circulation Polar Climatology & Climate Variability Lecture 11 Nov. 22, 2010 Global Atmospheric Circulation Global Atmospheric Circulation Global Atmospheric Circulation The Polar Vortex
Chapter outline. Reference 12/13/2016
 Chapter 2. observation CC EST 5103 Climate Change Science Rezaul Karim Environmental Science & Technology Jessore University of science & Technology Chapter outline Temperature in the instrumental record
Discritnination of a wet snow cover using passive tnicrowa ve satellite data
 Annals of Glaciology 17 1993 International Glaciological Society Discritnination of a wet snow cover using passive tnicrowa ve satellite data A. E. WALKER AND B. E. GOODISON Canadian Climate Centre, 4905
Climate Regimes of the Arctic
 Climate Regimes of the Arctic The climate of Greenland, recent changes and the ice sheet mass balance Map of Greenland, showing elevation and the location of GC- Net automatic weather stations (+), expedition
Observed Climate Variability and Change: Evidence and Issues Related to Uncertainty
 Observed Climate Variability and Change: Evidence and Issues Related to Uncertainty David R. Easterling National Climatic Data Center Asheville, North Carolina Overview Some examples of observed climate
Investigations of the Dry Snow Zone of the Greenland Ice Sheet Using QuikSCAT. Kevin R. Moon
 Investigations of the Dry Snow Zone of the Greenland Ice Sheet Using QuikSCAT Kevin R. Moon A thesis submitted to the faculty of Brigham Young University in partial fulfillment of the requirements for
Accelerated decline in the Arctic sea ice cover
 Click Here for Full Article GEOPHYSICAL RESEARCH LETTERS, VOL. 35, L01703, doi:10.1029/2007gl031972, 2008 Accelerated decline in the Arctic sea ice cover Josefino C. Comiso, 1 Claire L. Parkinson, 1 Robert
SATELLITE-borne scatterometers are microwave radars designed
 1344 IEEE GEOSCIENCE AND REMOTE SENSING LETTERS, VOL. 10, NO. 6, NOVEMBER 2013 Considerations for Ku-Band Scatterometer Calibration Using the Dry-Snow Zone of the Greenland Ice Sheet Kevin R. Moon and
Analysis of Antarctic Sea Ice Extent based on NIC and AMSR-E data Burcu Cicek and Penelope Wagner
 Analysis of Antarctic Sea Ice Extent based on NIC and AMSR-E data Burcu Cicek and Penelope Wagner 1. Abstract The extent of the Antarctica sea ice is not accurately defined only using low resolution microwave
Contributions to The State of Climate 2004 Recent Greenland climate variability and consequences to ice sheet mass balance
 Contributions to The State of Climate 2004 Recent Greenland climate variability and consequences to ice sheet mass balance Jason E. Box AMS Committee on Polar Meteorology Byrd Polar Research Center, The
2013 ATLANTIC HURRICANE SEASON OUTLOOK. June RMS Cat Response
 2013 ATLANTIC HURRICANE SEASON OUTLOOK June 2013 - RMS Cat Response Season Outlook At the start of the 2013 Atlantic hurricane season, which officially runs from June 1 to November 30, seasonal forecasts
Climate Regimes of the Arctic
 Climate Regimes of the Arctic The climate of Greenland Map of Greenland, showing elevation and the location of GC- Net automatic weather stations (+), expedition stations (x), and coastal settlements (o)
Polar Meteorology Group, Byrd Polar Research Center, The Ohio State University, Columbus, Ohio
 JP2.14 ON ADAPTING A NEXT-GENERATION MESOSCALE MODEL FOR THE POLAR REGIONS* Keith M. Hines 1 and David H. Bromwich 1,2 1 Polar Meteorology Group, Byrd Polar Research Center, The Ohio State University,
Variability in the surface temperature and melt extent of the Greenland ice sheet from MODIS
 GEOPHYSICAL RESEARCH LETTERS, VOL. 40, 2114 2120, doi:10.1002/grl.50240, 2013 Variability in the surface temperature and melt extent of the Greenland ice sheet from MODIS Dorothy K. Hall, 1 Josefino C.
ARCTIC SEA ICE ALBEDO VARIABILITY AND TRENDS,
 ARCTIC SEA ICE ALBEDO VARIABILITY AND TRENDS, 1982-1998 Vesa Laine Finnish Meteorological Institute (FMI), Helsinki, Finland Abstract Whole-summer and monthly sea ice regional albedo averages, variations
Sarah B. Das * and Richard B. Alley Penn State University, University Park, PA
 12.4 RECENT SURFACE MELTING IN WEST ANTARCTICA: COMPARISON OF REMOTE AND IN-SITU OBSERVATION Sarah B. Das * and Richard B. Alley Penn State University, University Park, PA ABSTRACT A study of Ross Embayment
PRMS WHITE PAPER 2014 NORTH ATLANTIC HURRICANE SEASON OUTLOOK. June RMS Event Response
 PRMS WHITE PAPER 2014 NORTH ATLANTIC HURRICANE SEASON OUTLOOK June 2014 - RMS Event Response 2014 SEASON OUTLOOK The 2013 North Atlantic hurricane season saw the fewest hurricanes in the Atlantic Basin
The Atmospheric Circulation
 The Atmospheric Circulation Vertical structure of the Atmosphere http://www.uwsp.edu/geo/faculty/ritter/geog101/textbook/atmosphere/atmospheric_structure.html The global heat engine [courtesy Kevin Trenberth,
Outline: 1) Extremes were triggered by anomalous synoptic patterns 2) Cloud-Radiation-PWV positive feedback on 2007 low SIE
 Extremes were triggered by anomalous synoptic patterns 2) Cloud-Radiation-PWV positive feedback on 2007 low SIE") Identifying Dynamical Forcing and Cloud-Radiative Feedbacks Critical to the Formation of Extreme Arctic Sea-Ice Extent in the Summers of 2007 and 1996 Xiquan Dong University of North Dakota Outline: 1)
Identifying Dynamical Forcing and Cloud-Radiative Feedbacks Critical to the Formation of Extreme Arctic Sea-Ice Extent in the Summers of 2007 and 1996 Xiquan Dong University of North Dakota Outline: 1)
Mozambique. General Climate. UNDP Climate Change Country Profiles. C. McSweeney 1, M. New 1,2 and G. Lizcano 1
 UNDP Climate Change Country Profiles Mozambique C. McSweeney 1, M. New 1,2 and G. Lizcano 1 1. School of Geography and Environment, University of Oxford. 2.Tyndall Centre for Climate Change Research http://country-profiles.geog.ox.ac.uk
Sea ice concentration off Dronning Maud Land, Antarctica
 Rapportserie nr. 117 Olga Pavlova and Jan-Gunnar Winther Sea ice concentration off Dronning Maud Land, Antarctica The Norwegian Polar Institute is Norway s main institution for research, monitoring and
Lecture 19: Operational Remote Sensing in Visible, IR, and Microwave Channels
 MET 4994 Remote Sensing: Radar and Satellite Meteorology MET 5994 Remote Sensing in Meteorology Lecture 19: Operational Remote Sensing in Visible, IR, and Microwave Channels Before you use data from any
A. Windnagel M. Savoie NSIDC
 National Snow and Ice Data Center ADVANCING KNOWLEDGE OF EARTH'S FROZEN REGIONS Special Report #18 06 July 2016 A. Windnagel M. Savoie NSIDC W. Meier NASA GSFC i 2 Contents List of Figures... 4 List of
Ice Mass & Sea Level Change Unit 3: GROUP A Snowmelt Group
 Ice Mass & Sea Level Change Unit 3: GROUP A Snowmelt Group Becca Walker and Leigh Stearns You have been provided with two Greenland air temperature maps. Satellites equipped with radiometers (instruments
Investigations into the Spatial Pattern of Annual and Interannual Snow Coverage of Brøgger Peninsula, Svalbard,
 Investigations into the Spatial Pattern of Annual and Interannual Snow Coverage of Brøgger Peninsula, Svalbard, 2000-2007 Manfred F. Buchroithner Nadja Thieme Jack Kohler 6th ICA Mountain Cartography Workshop
Radar mapping of snow melt over mountain glaciers in High Mountain Asia Mentor: Tarendra Lakhankar Collaborators: Nir Krakauer, Kyle MacDonald and
 Radar mapping of snow melt over mountain glaciers in High Mountain Asia Mentor: Tarendra Lakhankar Collaborators: Nir Krakauer, Kyle MacDonald and Nick Steiner How are Glaciers Formed? Glaciers are formed
Polar Portal Season Report 2013
 Polar Portal Season Report 2013 All in all, 2013 has been a year with large melting from both the Greenland Ice Sheet and the Arctic sea ice but not nearly as large as the record-setting year of 2012.
Monitoring the frozen duration of Qinghai Lake using satellite passive microwave remote sensing low frequency data
 Chinese Science Bulletin 009 SCIENCE IN CHINA PRESS ARTICLES Springer Monitoring the frozen duration of Qinghai Lake using satellite passive microwave remote sensing low frequency data CHE Tao, LI Xin
Polar Portal Season Report 2016
 Polar Portal Season Report 2016 Less ice both on land and at sea This year s report is the fourth since the Polar Portal was launched, and as an introduction, we have chosen to take a look at the trends
North Pacific Climate Overview N. Bond (UW/JISAO), J. Overland (NOAA/PMEL) Contact: Last updated: September 2008
, J. Overland (NOAA/PMEL) Contact: Last updated: September 2008") North Pacific Climate Overview N. Bond (UW/JISAO), J. Overland (NOAA/PMEL) Contact: Nicholas.Bond@noaa.gov Last updated: September 2008 Summary. The North Pacific atmosphere-ocean system from fall 2007
North Pacific Climate Overview N. Bond (UW/JISAO), J. Overland (NOAA/PMEL) Contact: Nicholas.Bond@noaa.gov Last updated: September 2008 Summary. The North Pacific atmosphere-ocean system from fall 2007
Spectral Albedos. a: dry snow. b: wet new snow. c: melting old snow. a: cold MY ice. b: melting MY ice. d: frozen pond. c: melting FY white ice
 Spectral Albedos a: dry snow b: wet new snow a: cold MY ice c: melting old snow b: melting MY ice d: frozen pond c: melting FY white ice d: melting FY blue ice e: early MY pond e: ageing ponds Extinction
J8.4 TRENDS OF U.S. SNOWFALL AND SNOW COVER IN A WARMING WORLD,
 J8.4 TRENDS OF U.S. SNOWFALL AND SNOW COVER IN A WARMING WORLD, 1948-2008 Richard R. Heim Jr. * NOAA National Climatic Data Center, Asheville, North Carolina 1. Introduction The Intergovernmental Panel
Earth Science and Climate Change
 Earth Science and Climate Change Dr. Mary L. Cleave February 7, 2007 YOU ARE HERE 3 Land Use Changes Over Time Lingering Doubts on Temperature Trends Have Been Resolved 1st CCSP Synthesis & Assessment
SEA ICE MICROWAVE EMISSION MODELLING APPLICATIONS
 SEA ICE MICROWAVE EMISSION MODELLING APPLICATIONS R. T. Tonboe, S. Andersen, R. S. Gill Danish Meteorological Institute, Lyngbyvej 100, DK-2100 Copenhagen Ø, Denmark Tel.:+45 39 15 73 49, e-mail: rtt@dmi.dk
Calibrating SeaWinds and QuikSCAT scatterometers using natural land targets
 Brigham Young University BYU ScholarsArchive All Faculty Publications 2005-04-01 Calibrating SeaWinds and QuikSCAT scatterometers using natural land targets David G. Long david_long@byu.edu Lucas B. Kunz
Investigating snow accumulation variability on the Antarctic Peninsula using Ground Penetrating Radar. - A tool for interpreting ice core records
 Investigating snow accumulation variability on the Antarctic Peninsula using Ground - A tool for interpreting ice core records Elizabeth R. Thomas June 2008 Scientific Report in support of Loan 824 Identifying
Arctic sea ice falls below 4 million square kilometers
 SOURCE : http://nsidc.org/arcticseaicenews/ Arctic sea ice falls below 4 million square kilometers September 5, 2012 The National Snow and Ice Data Center : Advancing knowledge of Earth's frozen regions
Microwave observations of daily Antarctic sea-ice edge expansion and contraction rates
 Brigham Young University BYU ScholarsArchive All Faculty Publications 2006-01-01 Microwave observations of daily Antarctic sea-ice edge expansion and contraction rates David G. Long david_long@byu.edu
TROPICAL-EXTRATROPICAL INTERACTIONS
 Notes of the tutorial lectures for the Natural Sciences part by Alice Grimm Fourth lecture TROPICAL-EXTRATROPICAL INTERACTIONS Anomalous tropical SST Anomalous convection Anomalous latent heat source Anomalous
Extreme Weather and Climate Change: the big picture Alan K. Betts Atmospheric Research Pittsford, VT NESC, Saratoga, NY
 Extreme Weather and Climate Change: the big picture Alan K. Betts Atmospheric Research Pittsford, VT http://alanbetts.com NESC, Saratoga, NY March 10, 2018 Increases in Extreme Weather Last decade: lack
The Hydrologic Cycle
 The Hydrologic Cycle Monthly precipitation for the central Arctic Ocean based on data from the Russian North Pole manned camps with daily bias adjustments. Raw precipitation totals are shown along with
D. J. Lampkin a & U. Wade b a Institute of Arctic and Alpine Research, University of Colorado,
 This article was downloaded by: [University Of Maryland] On: 6 March 1, At: :7 Publisher: Taylor & Francis Informa Ltd Registered in England and Wales Registered Number: 179 Registered office: Mortimer
High Resolution Vector Wind Retrieval from SeaWinds Scatterometer Data
 High Resolution Vector Wind Retrieval from SeaWinds Scatterometer Data David G. Long Brigham Young University, 459 Clyde Building, Provo, UT 84602 long@ee.byu.edu http://www.scp.byu.edu Abstract The SeaWinds
Validation of passive microwave snow algorithms
 Remote Sensing and Hydrology 2000 (Proceedings of a symposium held at Santa Fe, New Mexico, USA, April 2000). IAHS Publ. no. 267, 2001. 87 Validation of passive microwave snow algorithms RICHARD L. ARMSTRONG
Daniel J. Cecil 1 Mariana O. Felix 1 Clay B. Blankenship 2. University of Alabama - Huntsville. University Space Research Alliance
 12A.4 SEVERE STORM ENVIRONMENTS ON DIFFERENT CONTINENTS Daniel J. Cecil 1 Mariana O. Felix 1 Clay B. Blankenship 2 1 University of Alabama - Huntsville 2 University Space Research Alliance 1. INTRODUCTION
THE ATMOSPHERE IN MOTION
 Funding provided by NOAA Sectoral Applications Research Project THE ATMOSPHERE IN MOTION Basic Climatology Oklahoma Climatological Survey Factor 1: Our Energy Source Hi, I m the Sun! I provide 99.9999+
Weather and Climate Summary and Forecast January 2018 Report
 Weather and Climate Summary and Forecast January 2018 Report Gregory V. Jones Linfield College January 5, 2018 Summary: A persistent ridge of high pressure over the west in December produced strong inversions
Ice Surface temperatures, status and utility. Jacob Høyer, Gorm Dybkjær, Rasmus Tonboe and Eva Howe Center for Ocean and Ice, DMI
 Ice Surface temperatures, status and utility Jacob Høyer, Gorm Dybkjær, Rasmus Tonboe and Eva Howe Center for Ocean and Ice, DMI Outline Motivation for IST data production IST from satellite Infrared Passive
Winter Storm of 15 December 2005 By Richard H. Grumm National Weather Service Office State College, PA 16803
 Winter Storm of 15 December 2005 By Richard H. Grumm National Weather Service Office State College, PA 16803 1. INTRODUCTION A complex winter storm brought snow, sleet, and freezing rain to central Pennsylvania.
Remote sensing of sea ice
 Remote sensing of sea ice Ice concentration/extent Age/type Drift Melting Thickness Christian Haas Remote Sensing Methods Passive: senses shortwave (visible), thermal (infrared) or microwave radiation
MICROWAVE REMOTE SENSING OF THE GREENLAND ICE SHEET: MODELS AND APPLICATIONS. Ivan S. Ashcraft. A dissertation submitted to the faculty of
 MICROWAVE REMOTE SENSING OF THE GREENLAND ICE SHEET: MODELS AND APPLICATIONS by Ivan S. Ashcraft A dissertation submitted to the faculty of Brigham Young University in partial fulfillment of the requirements
Surface WAter Microwave Product Series [SWAMPS]
![Surface WAter Microwave Product Series [SWAMPS]](/thumbs/87/97403550.jpg "Surface WAter Microwave Product Series [SWAMPS]") Surface WAter Microwave Product Series [SWAMPS] Version 3.2 Release Date: May 01 2018 Contact Information: Kyle McDonald, Principal Investigator: kmcdonald2@ccny.cuny.edu Kat Jensen: kjensen@ccny.cuny.edu
Surface WAter Microwave Product Series [SWAMPS] Version 3.2 Release Date: May 01 2018 Contact Information: Kyle McDonald, Principal Investigator: kmcdonald2@ccny.cuny.edu Kat Jensen: kjensen@ccny.cuny.edu
Northern Hemisphere Snow and Ice Data Records
 Northern Hemisphere Snow and Ice Data Records Making Earth Science Data Records for Use in Research Environments (MEaSUREs) PoDAG XXX Oct 12-13 th, NSIDC MEaSUREs Snow Team David A. Robinson Gina Henderson
Condensing Massive Satellite Datasets For Rapid Interactive Analysis
 Condensing Massive Satellite Datasets For Rapid Interactive Analysis Glenn Grant University of Colorado, Boulder With: David Gallaher 1,2, Qin Lv 1, G. Campbell 2, Cathy Fowler 2, Qi Liu 1, Chao Chen 1,
Impacts of Climate Change on Autumn North Atlantic Wave Climate
 Impacts of Climate Change on Autumn North Atlantic Wave Climate Will Perrie, Lanli Guo, Zhenxia Long, Bash Toulany Fisheries and Oceans Canada, Bedford Institute of Oceanography, Dartmouth, NS Abstract
North Pacific Climate Overview N. Bond (UW/JISAO), J. Overland (NOAA/PMEL) Contact: Last updated: August 2009
, J. Overland (NOAA/PMEL) Contact: Last updated: August 2009") North Pacific Climate Overview N. Bond (UW/JISAO), J. Overland (NOAA/PMEL) Contact: Nicholas.Bond@noaa.gov Last updated: August 2009 Summary. The North Pacific atmosphere-ocean system from fall 2008 through
North Pacific Climate Overview N. Bond (UW/JISAO), J. Overland (NOAA/PMEL) Contact: Nicholas.Bond@noaa.gov Last updated: August 2009 Summary. The North Pacific atmosphere-ocean system from fall 2008 through
Trends in Climate Teleconnections and Effects on the Midwest
 Trends in Climate Teleconnections and Effects on the Midwest Don Wuebbles Zachary Zobel Department of Atmospheric Sciences University of Illinois, Urbana November 11, 2015 Date Name of Meeting 1 Arctic
Weather and Climate Summary and Forecast Fall/Winter 2016
 Weather and Climate Summary and Forecast Fall/Winter 2016 Gregory V. Jones Southern Oregon University November 5, 2016 After a year where we were seemingly off by a month in terms of temperatures (March
Monitoring and Prediction of Climate Extremes
 Monitoring and Prediction of Climate Extremes Stephen Baxter Meteorologist, Climate Prediction Center NOAA/NWS/NCEP Deicing and Stormwater Management Conference ACI-NA/A4A Arlington, VA May 19, 2017 What
Pacific Decadal Oscillation ( PDO ):
:") Time again for my annual Winter Weather Outlook. Here's just a small part of the items I considered this year and how I think they will play out with our winter of 2015-2016. El Nino / La Nina: When looking
Time again for my annual Winter Weather Outlook. Here's just a small part of the items I considered this year and how I think they will play out with our winter of 2015-2016. El Nino / La Nina: When looking
Bugs in JRA-55 snow depth analysis
 14 December 2015 Climate Prediction Division, Japan Meteorological Agency Bugs in JRA-55 snow depth analysis Bugs were recently found in the snow depth analysis (i.e., the snow depth data generation process)
Richard W. Reynolds * NOAA National Climatic Data Center, Asheville, North Carolina
 8.1 A DAILY BLENDED ANALYSIS FOR SEA SURFACE TEMPERATURE Richard W. Reynolds * NOAA National Climatic Data Center, Asheville, North Carolina Kenneth S. Casey NOAA National Oceanographic Data Center, Silver
Modeling the Arctic Climate System
 Modeling the Arctic Climate System General model types Single-column models: Processes in a single column Land Surface Models (LSMs): Interactions between the land surface, atmosphere and underlying surface
New Zealand Climate Update No 222, November 2017 Current climate November 2017
 New Zealand Climate Update No 222, November 2017 Current climate November 2017 November 2017 was characterised by higher than normal sea level pressure over New Zealand and the surrounding seas, particularly
CLIMATE CHANGE AND REGIONAL HYDROLOGY ACROSS THE NORTHEAST US: Evidence of Changes, Model Projections, and Remote Sensing Approaches
 CLIMATE CHANGE AND REGIONAL HYDROLOGY ACROSS THE NORTHEAST US: Evidence of Changes, Model Projections, and Remote Sensing Approaches Michael A. Rawlins Dept of Geosciences University of Massachusetts OUTLINE
Why There Is Weather?
 Lecture 6: Weather, Music Of Our Sphere Weather and Climate WEATHER The daily fluctuations in atmospheric conditions. The atmosphere on its own can produce weather. (From Understanding Weather & Climate)
INVISIBLE WATER COSTS
 Every Drop Every Counts... Drop Counts... INVISIBLE WATER COSTS Corn - 108.1 gallons per pound How much water it takes to produce... Apple - 18.5 gallons to grow Beef - 1,581 gallons per pound Oats - 122.7
Don t like the weather? Wait ten minutes. has been a phrase used by many in the Great
 Climate Change in the Great Lakes Michael John Michalek Don t like the weather? Wait ten minutes. has been a phrase used by many in the Great Lakes region. With weather and temperature extremes being pushed
Predictability and prediction of the North Atlantic Oscillation
 Predictability and prediction of the North Atlantic Oscillation Hai Lin Meteorological Research Division, Environment Canada Acknowledgements: Gilbert Brunet, Jacques Derome ECMWF Seminar 2010 September
NSIDC/Univ. of Colorado Sea Ice Motion and Age Products
 NSIDC/Univ. of Colorado Sea Ice Motion and Age Products Polar Pathfinder Daily 25 km EASE-Grid Sea Ice Motion Vectors, http://nsidc.org/data/nsidc-0116.html Passive microwave, AVHRR, and buoy motions Individual
Development and Validation of Polar WRF
 Polar Meteorology Group, Byrd Polar Research Center, The Ohio State University, Columbus, Ohio Development and Validation of Polar WRF David H. Bromwich 1,2, Keith M. Hines 1, and Le-Sheng Bai 1 1 Polar
Melt Detection in Antarctic Ice Shelves Using Scatterometers and Microwave Radiometers
 Brigham Young University BYU ScholarsArchive All Faculty Publications 2006-09-01 Melt Detection in Antarctic Ice Shelves Using Scatterometers and Microwave Radiometers David G. Long david_long@byu.edu
Influence of changes in sea ice concentration and cloud cover on recent Arctic surface temperature trends
 Click Here for Full Article GEOPHYSICAL RESEARCH LETTERS, VOL. 36, L20710, doi:10.1029/2009gl040708, 2009 Influence of changes in sea ice concentration and cloud cover on recent Arctic surface temperature
Cape Verde. General Climate. Recent Climate. UNDP Climate Change Country Profiles. Temperature. Precipitation
 UNDP Climate Change Country Profiles C. McSweeney 1, M. New 1,2 and G. Lizcano 1 1. School of Geography and Environment, University of Oxford. 2. Tyndall Centre for Climate Change Research http://country-profiles.geog.ox.ac.uk
Special blog on winter 2016/2017 retrospective can be found here -
 March 4, 2019 Special blog on winter 2016/2017 retrospective can be found here - http://www.aer.com/winter2017 Special blog on winter 2015/2016 retrospective can be found here - http://www.aer.com/winter2016
13.10 RECENT ARCTIC CLIMATE TRENDS OBSERVED FROM SPACE AND THE CLOUD-RADIATION FEEDBACK
 13.10 RECENT ARCTIC CLIMATE TRENDS OBSERVED FROM SPACE AND THE CLOUD-RADIATION FEEDBACK Xuanji Wang 1 * and Jeffrey R. Key 2 1 Cooperative Institute for Meteorological Satellite Studies University of Wisconsin-Madison
Changes in ice front position on Greenland s outlet glaciers from 1992 to 2007
 JOURNAL OF GEOPHYSICAL RESEARCH, VOL. 113,, doi:10.1029/2007jf000927, 2008 Changes in ice front position on Greenland s outlet glaciers from 1992 to 2007 Twila Moon 1 and Ian Joughin 2 Received 24 October
ATOC OUR CHANGING ENVIRONMENT Class 19 (Chp 6) Objectives of Today s Class: The Cryosphere [1] Components, time scales; [2] Seasonal snow
![ATOC OUR CHANGING ENVIRONMENT Class 19 (Chp 6) Objectives of Today s Class: The Cryosphere [1] Components, time scales; [2] Seasonal snow](/thumbs/95/126309683.jpg "ATOC OUR CHANGING ENVIRONMENT Class 19 (Chp 6) Objectives of Today s Class: The Cryosphere [1] Components, time scales; [2] Seasonal snow") ATOC 1060-002 OUR CHANGING ENVIRONMENT Class 19 (Chp 6) Objectives of Today s Class: The Cryosphere [1] Components, time scales; [2] Seasonal snow cover, permafrost, river and lake ice, ; [3]Glaciers and
ATOC 1060-002 OUR CHANGING ENVIRONMENT Class 19 (Chp 6) Objectives of Today s Class: The Cryosphere [1] Components, time scales; [2] Seasonal snow cover, permafrost, river and lake ice, ; [3]Glaciers and
Name the surface winds that blow between 0 and 30. GEO 101, February 25, 2014 Monsoon Global circulation aloft El Niño Atmospheric water
 GEO 101, February 25, 2014 Monsoon Global circulation aloft El Niño Atmospheric water Name the surface winds that blow between 0 and 30 What is the atmospheric pressure at 0? What is the atmospheric pressure
Will a warmer world change Queensland s rainfall?
 Will a warmer world change Queensland s rainfall? Nicholas P. Klingaman National Centre for Atmospheric Science-Climate Walker Institute for Climate System Research University of Reading The Walker-QCCCE
PREDICTION AND MONITORING OF OCEANIC DISASTERS USING MICROWAVE REMOTE SENSING TECHNIQUES
 PREDICTION AND MONITORING OF OCEANIC DISASTERS USING MICROWAVE REMOTE SENSING TECHNIQUES O P N Calla International Centre for Radio Science, OM NIWAS A-23, Shastri Nagar, Jodhpur-342 003 Abstract The disasters
Deke Arndt, Chief, Climate Monitoring Branch, NOAA s National Climatic Data Center
 Thomas R. Karl, L.H.D., Director, NOAA s National Climatic Data Center, and Chair of the Subcommittee on Global Change Research Peter Thorne, PhD, Senior Scientist, Cooperative Institute for Climate and
Climate Change 2007: The Physical Science Basis
 Climate Change 2007: The Physical Science Basis Working Group I Contribution to the IPCC Fourth Assessment Report Presented by R.K. Pachauri, IPCC Chair and Bubu Jallow, WG 1 Vice Chair Nairobi, 6 February
The weather in Iceland 2012
 The Icelandic Meteorological Office Climate summary 2012 published 9.1.2013 The weather in Iceland 2012 Climate summary Sunset in Reykjavík 24th April 2012 at 21:42. View towards west from the balcony
FOR DECADES, microwave radiometry has proven to be
 2622 IEEE TRANSACTIONS ON GEOSCIENCE AND REMOTE SENSING, VOL. 46, NO. 9, SEPTEMBER 2008 WindSat Passive Microwave Polarimetric Signatures of the Greenland Ice Sheet Li Li, Senior Member, IEEE, Peter Gaiser,
Thomas P. Phillips CIRES Prof K. Steffen, L. Colgan PhD ABD, D. McGrath MA
 Thomas P. Phillips CIRES Prof K. Steffen, L. Colgan PhD ABD, D. McGrath MA Problem: we know very little about the processes happening within the Greenland Ice Sheet. What is the velocity at the base? What
DLR s TerraSAR-X contributes to international fleet of radar satellites to map the Arctic and Antarctica
 DLR s TerraSAR-X contributes to international fleet of radar satellites to map the Arctic and Antarctica The polar regions play an important role in the Earth system. The snow and ice covered ocean and