CHAPTER I INTRODUCTION
|
|
|
- Myra Holmes
- 6 years ago
- Views:
Transcription

1 A. Purpose of the Manual CHAPTER I INTRODUCTION This Stream Bank Stabilization Manual has been prepared to assist those involved in analyzing, planning, designing, and constructing bank stabilization measures or related activities in erosion hazard zones. The manual focuses on the North Central Texas area, specifically the communities of Plano, Garland, Allen and McKinney. It reviews available literature on bank erosion, describes existing bank erosion control programs and projects, defines the mechanics of the bank erosion process, presents methods to quantify bank erosion potential, and identifies design guidelines and typical construction details for bank stabilization. The manual is intended to define a systematic approach to understand and effectively address stream bank erosion problems with the goal of preventing or avoiding severe problems and their potential for damage to public improvements, private property and the environment. WEST FORK- ROWLETT CREEK UPSTREAM OF ALMA ROAD IN ALLEN, TEXAS I-1

2 The measures described in the manual are intended to be permanent. The procedures can be applied to problems related to existing development or incorporated into the planning process in developing watersheds. Ideally, the procedures presented here will be refined and applied city-wide in the form of watershed-based studies. This will enable a better understanding of bank stability and other stream features with the goal of developing permanent, economical solutions. This manual is not intended to replace or supplement existing guidelines or regulations for construction site erosion control in any of the four communities. DEVELOPMENT ADJACENT TO SMALL TRIBUTARY OF ROWLETT CREEK IN ALLEN, TEXAS B. Features of North Central Texas Affecting Streams Natural channels are formed by the concentration of storm water runoff. The flowing water has the energy to scour the earth, which continues throughout the life of the stream. Sediment is deposited in the channel bottom at the same time that the channel is eroding. The channel bottoms and banks will gradually erode, naturally forming a larger channel. Initially the volume of erosion from a particular reach will be far greater than the volume of deposition. As the stream matures, the rate of deposition approaches the rate of erosion. When the stream becomes stable, the rate of disposition equals the rate of erosion. This stable condition continues as long as there is not an alteration of the flow pattern. If the activities of man or nature alter the watershed or channel, the balance is broken and a period of restabilization follows. Urbanization of a watershed is a common activity which disturbs this balance. Developing watersheds with expanding impervious areas, reduced infiltration rates, increased runoff, increased flood peaks and increased flood frequencies often suffer severe erosion problems. The higher discharges and velocities increase channel erosion, thus creating a larger channel. Structures near the channel are often imperiled and, in some cases, damaged by the eroding banks. The stream environment itself is I-2
3 often degraded by the excessive deposition of the sediment laden runoff. The ultimate consequence of this process is shown graphically in Figure I Climate A region s climate can influence the need for stream bank stabilization and dictate which methods might be most successful in mitigating erosion damage. The study area for this Stream Bank Stabilization Manual lies in a region of temperate mean climatological conditions and experiences occasional, short duration extremes of temperature and rainfall. The climate is generally mild, with moderate winters and hot summers. The area has an average of 94 days with temperatures above 90 o F and 37 days with temperatures below 32 o F. The record temperature extremes range from a maximum of 113 degrees Fahrenheit in June, 1980 to a minimum of -8 degrees Fahrenheit in February, The maximum monthly and 24 hour rainfalls are inches in April, 1922 and 9.57 inches in September, 1932, respectively. Mean annual rainfall is 33.3 inches with the heaviest precipitation usually occurring in April, May, and June. The study area lies approximately 250 miles inland from the Gulf of Mexico. Remnants of tropical storms generally occurring from August to October sometimes reach the study area and cause significant flooding. Intense thunderstorms usually occur in the spring and summer and are the most common cause of flooding on the small streams in the study area. Prevailing surface winds are southerly. Average wind velocity is 10.9 miles per hour (NWS, 1997). Natural variations in landform and topography alter the climatic environment characteristics of localized areas, often dampening the effects of regional climatic extremes. When areas in close proximity to each other experience measurable climatic differences, the localized conditions constitute microclimates. North Central Texas creeks and their major tributaries create natural microclimates that differ somewhat from the region's overall climate. These areas typically experience lower temperatures, wind speeds, and solar-radiation intensities, and a higher relative humidity. The primary factors that affect creek microclimates are trees, stream side slopes, and water. The orientation of a channel side slope, that is, the direction in which the slope faces has a significant effect on the microclimate. South facing slopes which receive more sunlight experience faster evaporation rates. This results in a noticeably hotter and drier microclimate than a north facing slope which is cooler and maintains a higher relative humidity. These distinct microclimates on the north and south channel slopes may support different types of vegetation, which may, in return, influence stream bank stability (Halff, 1989). I-3
4

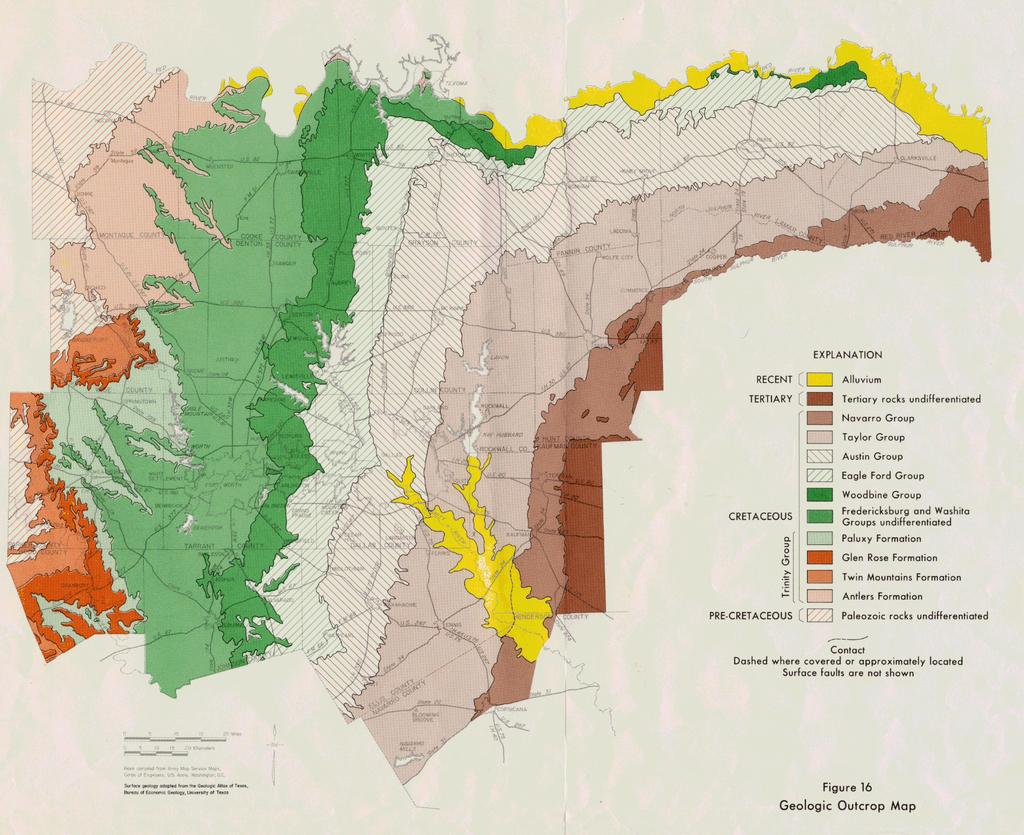
5 2. Geology River forms are a function of stream hydrology and geology. The geology of an area determines stream bed and bank materials and influences basin and valley relief. These hydrologic and geologic processes cause a stream to evolve to a natural state of stability as regards it s ability to convey flood waters and sediments from the watershed. Activities such as urban development and deforestation often upset this equilibrium and cause the stream to seek a new equilibrium, often at the expense of manmade features. Therefore, it is important to understand a stream s geology as a part of developing ways to correct or avoid damage due to stream bank erosion (Rosgen, 1996). Dallas and Collin Counties are situated in the western part of the Gulf Coastal Plain in the Blackland Prairie Physiographic Province, a province characterized by little relief and dark, thick plastic clay soils. Three outcropping units are present through the area; the Eagle Ford Shale, the Austin Chalk and Ozan (lower Taylor Marl) formations. The Austin Chalk Formation is the surface bedrock of the White Rock Creek basin. This resistant formation provides much of the topographic relief throughout the area. The Eagle Ford Shale Formation surfaces to the west and the Ozan (Taylor Marl) Formation surfaces to the east of the watershed. The general limits of the outcrop of these formations in the study area is shown on Figure I-2 (Nordstrom, 1982). SMALL, URBAN TRIBUTARY OF ROWLETT CREEK IN GARLAND, TEXAS I-5
6
7 3. Soils Residual soils weathered from the underlying formations produce the clay soils that are characteristic of the project area, as well as the Blackland Prairie Physiographic province. These soils have been classified and mapped in detailed soil surveys for Dallas and Collin Counties prepared by the U.S. Department of Agriculture Soil Conservation Service in cooperation with the Texas Agriculture Experiment Station. The Natural Resource Conservation Service classifies soils by their profile or sequence of natural layers. Soils that have profiles which are almost identical make up a soil series. The soil series are then further classified into phases on the basis of differences in slope, stoniness, salinity, wetness, degree of erosion, and other characteristics that affect their use. Areas of two or more soil series which cannot be shown separately on the soil map are classified into phases called soil complexes. Soils within a watershed are often grouped into three broad locational categories of bottomland, transitional and upland soils. Bottomland soils are found within "the normal flood plain of a stream, subject to flooding." Bottomland soils in the study area are comprised mainly of the Frio, Houston Black, and Trinity soil series. These are relatively deep sedimentary soils, laid down by repeated flood events over long periods. The Frio soil series is made up of friable, loamy soils with slopes of less than one percent. The Houston Black and Trinity soil series are comprised of deep, calcareous, clayey soils, with slopes that are nearly level to moderate. The Houston Black soil series also occurs on uplands and on old alluvial terraces along major streams. The Trinity soils are found mainly in the bottomland areas and are formed in recent alluvium on flood plains. Upland is defined as "land at a higher elevation, in general, than the alluvial plain or stream terrace; land above the lowlands along streams." The transitional soils can be found between the bottomland and the upland soils on stream terraces. These soils often have greater inclines than the upland soils and tend to be eroded and gullied. The transitional and upland regions found within these communities are comprised of nine soil series, common to both areas. These are the Austin, Dalco, Eddy, Ferris, Heiden, Houston, Houston Black, Lewisville, Stephen and Trinity soils (Halff, 1989). Figure I-2 is a general soil map for the area showing the location of major soil associations and a list of the soils found within the project limits with a brief description of flood plain soil types and general erosion potential. 4. Vegetation The project area lies in the Blackland Prairie vegetative zone of the Texas biotic province. A biotic province is defined as a continuous regional geographic area characterized by the occurrence of one or more ecological associations that differ significantly from the ecological associations of adjacent provinces. In general, the Texas biotic province is characterized by peculiarities of vegetation type, ecological I-7
8 climax, climate, geology and soils, which distinguish it from the moist forest of East Texas and the dry grasslands of West Texas. The Blackland Prairie vegetative zone within this province is characterized by gently rolling to nearly level topography, with dark-colored calcareous clay soils that support prairie grass-forb vegetation. The vegetative zone is further divided into three community classes distinguished by physiographic features: 1) the deep soil prairie, 2) the thin soil prairie, and 3) the limestone ravine. Within these categories, a complex combination of habitats exist: the upland and transitional region grasslands, the mature forest lands, the flood plain wetlands, and the water bodies. The deep soil prairie is composed of heavy calcerous clay, which originally supported tall and mid-height grasses. This area comprises the majority of the upland soil grasslands, which historically was prime farm land and has largely been developed. The thin soil prairie is underlain by Austin chalk or the Taylor Marl. The dominant vegetation of the thin soil prairie includes the mid-height and short grasses and a variety of dry site herbs. This category comprises the transitional soil grasslands. The limestone ravine category provides the best environment for trees in the Blackland Prairie zone. The shade, the concentration of runoff water, and a proximity to ground water are the major factors contributing to the growth of small hardwood forests in the limestone ravines (Halff, 1989).Vegetation is important to the bank stability of a stream because of the root systems which help to bind and protect the soil surface from the erosive forces of flowing water. This reinforces the need for involving a qualified landscape architect, environmental scientist and/or biologist as a part of the team analyzing stream bank stability problems. 5. Population Growth A strong economy in North Central Texas has been responsible for sustained population growth throughout the region. New housing starts are at a ten year high. This growth is very evident in the four communities sponsoring the Stream Bank Stabilization Manual. These cities represent four of the eleven cities responsible for 50% of the area s growth in 1996, with Plano leading all North Central communities. Growth rates in Allen, McKinney, Plano and Garland were 8.3, 7.2, 6.2 and 1.4 percent, respectively. These cities have a combined estimated 1997 population of over 450,000. This growth translates to intense urbanization pressures on streams within the four cities. C. The Nature Of Streams Streamflow and channel variables interact over long periods of time to form the morphology of river systems. Induced changes in any of the physical processes create rapid and significant changes to the system. Often, channel morphology is influenced by streamflow and sediment regime, valley morphology, basin relief and the nature of stream bed and bank material (Rosgen, 1996). I-8
9 1. General Stream Classifications Streams have been classified many different ways. A simple system might define streams as either youthful, mature or old, depending on its stage of adjustment. Reasons why a stream classification system is important include: the ability to predict behavior from appearance the ability to relate specific hydraulic and sediment transport characteristics to a stream type provides a means of transferring site specific information to stream reaches of similar characteristics provides a consistent frame of reference(rosgen, 1996) Rosgen has developed a comprehensive stream classification that begins with very general geomorphic characteristics and progresses to very specific assessments and descriptions. Level I describes the geomorphic characteristics resulting from basin relief, land form and valley morphology. This includes such features as channel slope, channel shape and channel patterns. Level II assessments involve more specific descriptions of morphological features such as width/depth ratios, sinuosity and channel materials. Level III describes the stream condition in terms of vegetation, sediment transport, debris, bank erosion potential and alterations. A fourth level would consist of field measurements of sediment, streamflow, erosion and hydraulic characteristics. The descriptions of the many components of the classification system are complex and beyond the scope of this manual. The interested user is referred to Applied River Morphology (Rosgen, 1996) for a complete description of a stream classification program. 2. North Central Texas Streams Generally speaking, the streams for which this manual is intended are those with a drainage area larger than 0.2 square miles that are tributary to White Rock Creek, Rowlett Creek, Wilson Creek or the East Fork of the Trinity River. Smaller streams generally tend to be replaced by manmade storm drainage systems. Channels are formed in either chalk or shale bedrock formations. Channels in the chalk are rectangular to trapezoid in shape, with bank slopes ranging from vertical to 2:1. Bank materials are composed of silty clay. Chalk streams generally have a greater drainage density (more channels per unit area) and are relatively steep. Shale based channels are trapezoidal in shape with 2.5 to 3:1 bank slopes, composed of weathered shale and clay alluvium. Shale channels are more sinuous but less steep than chalk channels (Allen, 1985). In general, these streams are relatively stable and resistant to erosion until disturbed by activities such as urbanization and channel alteration. I-9
10 D. Stream Bank Erosion And Failure Streams are dynamic systems which are continuously evolving, reacting to the various natural and man-induced influences placed on them. When a balance exists among the hydraulic and sediment transport characteristics of a stream reach and the hydrology and sediment delivery of its drainage area, it is said to be in equilibrium. Natural or man-induced influences can upset this equilibrium, causing a system response that commonly involves adjustments in flow hydraulics (velocity and depth), channel geometry (width, depth, and slope), and channel topography (sediment bars and meanders). Although the causes of stream bank erosion are varied and complex, stream bank erosion can be classified into two types: 1) surface erosion of individual soil particles due to the action of water, and 2) mass wasting. Mass wasting can be characterized as a general structural failure of the bank and usually involves a relatively large section of the bank. Often, mass wasting results from surface erosion, such as when the toe of a bank is scoured away. A cycle of scour from surface erosion followed by mass failure may result in migration of the bank line. In the following sections, basic definitions and methods of evaluating factors influencing bank stability will be presented. Important factors include channel velocity, tractive force (boundary shear stress), channel bends and land use changes. 1. Surface Erosion of Stream Banks Individual soil particles are eroded from a bank by the tractive force of flowing water. Particle erosion occurs when the tractive force exerted by the water exceeds the particle s ability to resist movement. The strength of the tractive force increases proportionally to the velocity and depth of flow. Erosion is therefore more likely to occur during a flood event. The ability of a soil particle to resist the tractive force is dependent on the particle s size and cohesive properties. Larger particles that weigh more are harder to move. Thus, gravel-sized materials resist erosion better than sand-sized materials. Cohesive particles, such as found in the clays found throughout the four communities covered by this manual, are more erosion resistant than non-cohesive silt-sized particles. In general, vegetative cover reduces flow velocity and the tractive force on soil particles, thereby increasing the stability of soil particles compared to bare soil conditions. I-10

11 SPRING CREEK DOWNSTREAM OF JUPITER ROAD IN GARLAND, TEXAS Major causes of the surface erosion of stream banks include: Flow Hydraulics Rainfall Groundwater Seepage Overbank drainage Wave attack Freeze-thaw and wet-dry cycles Land use A discussion of the mechanics of surface erosion on stream banks is presented in the following sections. a) Flow Hydraulics Fundamentally, the erosion of individual soil particles on a bank is controlled by the physical characteristics of the particle, bank slope, and the hydraulics of flow (velocity and depth). The hydraulics of open channel flow can be classified as: I-11
12 Uniform, gradually varying, or rapidly varying flow Steady or unsteady flow Subcritical or supercritical flow Descriptions of these flow states, and procedures for identifying them are presented in the hydraulic engineering literature. Design procedures for erosion control are usually based on the assumption of uniform, steady, subcritical flow, which is more or less typical of streams in the study area. They are generally also applicable to gradually varying flow conditions. Rapidly varying, unsteady flow conditions are common in areas of flow expansion, flow contraction, and reverse flow, and are often associated with flow obstructions. Fully developed supercritical flow is rarely observed in natural channels, although flow in the transitional range between subcritical and supercritical often occurs in steep channels and through constrictions. Bank erosion can be affected by both man-made or natural flow obstructions. Obstructions can cause complex hydraulic conditions such as flow impingement, increased turbulence and eddy action, and local flow acceleration. These hydraulic conditions may result in localized increases in shear stresses on the channel boundary. Common flow obstructions include bridges, woody debris, gravel bars, and revetments. (1) Tractive Force For cohesive soils, the boundary shear stress (tractive force) of the water against the soil particles measures the most important factor governing soil erosion. At a critical level, the water begins tearing loose the soil particles from the channel walls. Partheniades and Paaswell in "Erodibility of Channels with Cohesive Boundary" explain the process: "At any given instant in time, if there are no external forces acting on the surface of the clay, nor net forces acting on the clay mass, the system is in a state of temporary equilibrium for the given environmental conditions. Imposing an external force system, such as boundary shear, would create some deformation at the boundary, under the assumption that the clay particle system is not infinitely rigid. This deformation can be slight, and can occur as small translations or small rotations of individual particles, or particle groups. Movement of the particles then causes a readjustment in the force systems, which if no longer stressed, will come to some new position of equilibrium, but if still stressed will continue to undergo deviations in the force system. If the inter-particle bond is physically broke, and the particle is then entrained in the fluid, erosion has been initiated."(partheniades, 1970) I-12
13 Boundary shear stress, or tractive force, on a channel is the force exerted at the boundary between the soil and water by the force of the water. When the force is large enough, the particles of soil will move and erosion begins. The concept can be illustrated using a uniform flow, the flow depth and velocity remain unchanged from one section to another, as shown in Figure I-3. Theoretically, the situation is one of zero acceleration. Combining this theory with Newton's second law of motion ( F=ma), then: F i = 0 The sum of all forces in any one direction acting on the body of water must equal zero. Summing forces in the direction of the sloping channel bottom, as seen in Figure I-3, the hydrostatic forces, a 1 and a 2, at either end of the water element, are equal and opposite, and cancel. This suggests that the component of gravity force in the direction parallel to the channel bottom must be equal and opposite to the total boundary shear "force," b. The component of gravity force, W s, parallel to the channel bottom is wal sin Ø. For small slopes typical of streams in North Central Texas: W s = wals where: w = unit weight of water, pounds per cubic foot; A = wetted area, square feet; L = length of channel reach, feet; and S = slope of channel bottom, feet per foot. Thus, wals gives the total boundary shear "force" exerted between Section 1 and Section 2. For boundary shear "stress", T 0, the shear "force," must be divided by the total wetted area, PL, assuming the shear stress distribution is uniform across the section; hence, T 0 = wals/pl = wrs where: T 0 = boundary shear stress or tractive force; P = wetted perimeter; and R = hydraulic radius. For relatively wide, open channels, the hydraulic radius, R, is equal to the depth of flow, y; therefore,t 0 = wys, where y = depth of water in feet. I-13
14
15 Chow limits this derivation by stating that boundary shear stress is not uniformly distributed along the wetted perimeter. However, he concludes that the maximum shear stress on the bottom is close to wys (Chow, 1959). Generally, S equals the slope of the energy gradient rather than the slope of the channel bottom. For uniform flow, the energy slope, or hydraulic gradient, and the channel bottom slope are equal. For nonuniform flow, the channel bottom is not smooth, but complicated with obstructions, such as weirs and dams. The slope of the energy gradient, or in this case hydraulic gradient, adjusts for obstructions and reflects the overall slope of the channel bottom. A dam would reduce the slope of the hydraulic gradient in relation to the slope of the channel bottom and thus decrease the boundary shear stress in the regions of decreased energy slope. This concept uses the critical boundary shear criterion as the significant parameter affecting the onset of erosion. When the critical boundary shear stress is exceeded, erosion occurs. Values for area streams can range from 0.11 pounds per square foot (silt loam) to over 1.0 pounds per square foot (shale or limestone). The maximum permissible tractive force, or boundary shear stress, for stiff clays is 0.46 pounds per square foot, based on a straight channel of small slope according to Chow. For moderately sinuous channels, Chow recommends a twenty-five percent reduction, as shown in Table I-1. For very sinuous channels, Chow recommends a forty percent reduction of the maximum permissible tractive force (Halff, 1985). The boundary shear stress at a point on the bottom of a channel can be calculated using the equations derived by Chow or hydraulic computer models such as HEC-2 and HEC-RAS (USACE, 1997). Example tractive force calculations for area streams are shown in Table I-2. Public works projects such as bridge replacement can accelerate stream bank erosion. The improvements to the bridge typically increase the capacity and lower the upstream flood levels especially for the shorter return period floods which are most critical to erosion control. The change in water surface elevation upstream of the crossing is often greater than before the new bridge was constructed. As a result, the slope of the hydraulic gradient is greater, increasing the boundary shear stress which contributes to increased erosion. An example of this can be seen in Figure I-4. Stresses on the channel boundary associated with non-uniform, unsteady, and near supercritical flow conditions can have significantly different channel boundary stresses compared to uniform, steady, subcritical flow conditions. These stresses are difficult to assess quantitatively. Generally, increased factors of safety are utilized with uniform, steady flow design procedures to account for uncertainties associated with the more complex unsteady or supercritical flow conditions. I-15
16 Table I-1 Maximum Permissible Velocities Recommended by Fortier and Scobey and the Corresponding Unit-Tractive-Force Values (Chow, 1959) 1 MATERIALS WATER TRANSPORTING COLLOIDAL SILTS 25% Reduction 40% Reduction V, 2 T 0 Sinuous Very Sinuous fps lb/ft 2 lb/ft 2 lb/ft 2 Find sand, colloidal Sandy loam, noncolloidal Silt loam, noncolloidal Alluvial silts, noncolloidal Ordinary firm loam Volcanic ash Stiff clay, very colloidal Alluvial silts, colloidal Shales and hardpans Fine gravel Graded loam to cobbles Graded silts to cobbles Coarse gravel, noncolloidal Cobbles and shingles Well Established Channels, Mild Small Slopes and Flow Depths Less than 3 Feet 2 -Corresponding Unit-Tractive-Force Values Table I-2 Tractive Force at Various Locations in Study Area Location & Flood Depth Velocity Tractive Force feet ft/sec lb/ft 2 Stream IC-1A in Arbor Hills Nature Preserve, Plano 10 year 100 year Prairie Creek d/s of 15th St., Plano 10 year 100 year Spring Creek d/s of Jupiter Rd., Garland 10 year 100 year West Fork of Rowlett Creek d/s SH 121, Allen 10 year 100 year Wilson Creek d/s SPRR, McKinney 2 year 100 year I-16
17
18 (2) Bend Hydraulics As stream flow moves through a channel bend, centrifugal acceleration causes: 1) spiral motion in the flow, and 2) superelevation of the water surface. The velocity of flow increases toward the outside of the bend thereby increasing the tractive force to as much as twice that in a straight reach of the channel upstream or downstream from the bend. Figure I-5 shows the relationship between the ratio of shear on the outside of the bend to the mean channel shear stress versus the ratio of the bend radius of curvature to the channel width (Rc/W). The increase in shear stress along the outside of the bend often results in erosion in that area. The erosion often extends a distance downstream from the end of the bend. On the inside of the bend the flow velocity decreases, allowing sediments to deposit and build a point bar. Sharp channel bends are more likely to experience erosion along the outside bank than gradually curved bends. However, it has been shown for channels with Rc/W ratios less than 2 that erosion rates on the outside of the bend are reduced sharply due to energy losses. During flood flows the path of maximum channel velocity generally moves across the channel against the point bar, often removing material deposited during normal flow conditions. The superelevation of flow through a channel bend can be important for the identification of the bank area potentially affected by flow. It should be considered in establishing freeboard limits for bank protection on sharp channel bends. There are many methods for determining superelevation. For subcritical flow, superelevation at a channel bend may be estimated by (FHWA, 1989): Z = C [(Va 2 T) / (g Ro)] where: Z = superelevation of the water surface (ft) C = coefficient that relates free vortex motion to velocity streamlines for unequal radius of curvature Va = mean channel velocity (ft/s) T = water-surface width at section (ft) g = gravitational acceleration (ft/s 2 ) Ro = the mean radius of the channel centerline at the bend (ft) The coefficient C has been found to range between 0.5 and 3.0, with an average value of 1.5. A 20 foot bottom width channel with 2 to 1(v) side slopes flowing at 10 feet per second around a 100 foot radius bend will experience 0.7 feet of superelevation. Given the elevated tractive force through bends, Figure I-6 provides guidance as to where protection should begin and end. I-18
19
20
21 b) Rainfall Rain can accumulate as overland flow or infiltrate into the soil. Raindrop impact on a stream bank can loosen soil particles and reduce infiltration capacity. The action of splashing rain drops and surface runoff removes soil particles in thin layers as sheet erosion. Runoff on the bank may form small channels as rill erosion. If the runoff is of sufficient magnitude, gullies will form on the bank. Sheet, rill, and gully erosion removes mineral nutrients and organic matter from soil. This action can leave stream banks coarse and less fertile, making the re-establishment of riparian vegetation difficult. c) Groundwater Seepage A portion of precipitation may infiltrate into the ground and become groundwater. Seepage along the face of a stream bank is an exposure of the groundwater table. The groundwater is forced to the face of the stream bank by piezometric pressure. Soil may be loosened and eroded by the seepage as it flows from the bank leading to rill and gully erosion similar to the effects of rainfall. d) Overbank Drainage Uncontrolled overbank drainage on the face of a stream bank can cause significant erosion. Left unchecked, large gullies can form within a bank due to overbank drainage. Overbank drainage problems are frequently associated with land clearing activities or developments adjacent to the stream channel, and a lack of adequate drainage outlets (ill-advised outfall location and/or elevation) and energy dissipation devices. e) Wave Attack Water craft or wind can set up waves that can erode a stream bank. Waves tend to dislodge bank materials. Commercial or recreational boat traffic may be a significant source of waves. Large areas of open water can present conditions for set-up of wind generated waves. f) Freeze-Thaw and Wet-Dry Cycles Occasionally in North Texas during winter months, stream banks may be subject to freeze-thaw cycles. The formation of ice within the soil matrix can heave and loosen bank materials, making them more erodible. Drying of saturated clay deposits on a stream bank can cause shrinkage and cracking of the surface, forming a layer of loose soil that is easily eroded. Successive periods of wet and dry conditions may repeat the process. I-21
22 g) Land Use Land use changes that influence the sediment supply to or sediment transport capacity of a watercourse can result in stream bank erosion. Urbanization or land clearing can dramatically change stream hydrology, sediment supply, and sediment transport capacity of a water course. Reduced sediment supply or increased sediment transport capacity can result in channel incision (down cutting) and cause bank instability. Conversely, increased sediment supply or decreased sediment transport capacity can result in aggradation of the channel or the formation of bars which may cause flow impingement on channel banks and increased frequency of overbank flooding. 2. Stream Bank Failure The general failure mechanisms associated with the mass wasting of banks are related to the characteristics of bank materials. Typical failure surfaces for various bank material types are shown in Figure I-7. Generally, a stream bank will remain stable for as long as the shear strength of the bank soil is greater than the shear stress placed on the bank. A decrease in the shear strength of the bank soil or an increase in the shear stress on the bank can individually or in combination lead to bank failure. a) Decrease in Shear Strength The major causes for a decrease in soil shear strength in banks are: Swelling clays Groundwater pressure Soil creep Generally, neither swelling clays nor groundwater pressure in a bank can be directly observed. In certain cases, evidence of soil creep can be observed by the development of bank cracks that form parallel to the stream. b) Increase in Shear Stress Shear stress in a bank can increase by several means, but is most commonly associated with changes in channel bed elevation, undermining of the bank toe by surface erosion, increased loads on the bank, and rapid drawdown of stream flow. 3. Erodibility Of all these factors contributing to stream bank erosion in the project area, urbanization probably has the most impact. Studies have shown that urbanization of the drainage basin tends to roughly double the channel area as the stream attempts to reach a new state of relative stability (Allen, 1985). This phenomena is shown I-22
23 graphically in Figure I-1. This adjustment process occurs over time, and many geomorphologists now think that it may take as long as 50 to 100 years for a stream to reach this new state of stability. Therefore, it is important to establish some sort of erodibility factor for newly developing areas so controls and/or correction of future problems can be achieved before homeowners and/or public facilities incur damage from stream bank failures due to erosion. Chapter III, Part D of this manual presents a procedure for establishing an erodibility index for stream reaches and locations as part of a stream bank stabilization program. I-23
24
Aquifer an underground zone or layer of sand, gravel, or porous rock that is saturated with water.
 Aggradation raising of the streambed by deposition that occurs when the energy of the water flowing through a stream reach is insufficient to transport sediment conveyed from upstream. Alluvium a general
Stream Geomorphology. Leslie A. Morrissey UVM July 25, 2012
 Stream Geomorphology Leslie A. Morrissey UVM July 25, 2012 What Functions do Healthy Streams Provide? Flood mitigation Water supply Water quality Sediment storage and transport Habitat Recreation Transportation
Weathering, Erosion, Deposition, and Landscape Development
 Weathering, Erosion, Deposition, and Landscape Development I. Weathering - the breakdown of rocks into smaller particles, also called sediments, by natural processes. Weathering is further divided into
Overview of fluvial and geotechnical processes for TMDL assessment
 Overview of fluvial and geotechnical processes for TMDL assessment Christian F Lenhart, Assistant Prof, MSU Research Assoc., U of M Biosystems Engineering Fluvial processes in a glaciated landscape Martin
STABILIZATION OF THE H&CT RAILWAY STONE DAM WALTER E. SKIPWITH, PE, JOYCE CRUM, AIA AND JOHN BAUMGARTNER, PE. Introduction.
 STABILIZATION OF THE H&CT RAILWAY STONE DAM WALTER E. SKIPWITH, PE, JOYCE CRUM, AIA AND JOHN BAUMGARTNER, PE I. A. Introduction General The Old Stone Dam is located in the upper reach of Cottonwood Creek
Erosion Surface Water. moving, transporting, and depositing sediment.
 + Erosion Surface Water moving, transporting, and depositing sediment. + Surface Water 2 Water from rainfall can hit Earth s surface and do a number of things: Slowly soak into the ground: Infiltration
Rivers T. Perron
 1 Rivers T. Perron 12.001 After our discussions of large-scale topography, how we represent topography in maps, and how topography interacts with geologic structures, you should be frothing at the mouth
Surface Water and Stream Development
 Surface Water and Stream Development Surface Water The moment a raindrop falls to earth it begins its return to the sea. Once water reaches Earth s surface it may evaporate back into the atmosphere, soak
Open Channel Flow Part 2. Ch 10 Young, notes, handouts
 Open Channel Flow Part 2 Ch 10 Young, notes, handouts Uniform Channel Flow Many situations have a good approximation d(v,y,q)/dx=0 Uniform flow Look at extended Bernoulli equation Friction slope exactly
Ecoregions Glossary. 7.8B: Changes To Texas Land Earth and Space
 Ecoregions Glossary Ecoregions The term ecoregions was developed by combining the terms ecology and region. Ecology is the study of the interrelationship of organisms and their environments. The term,
Do you think sediment transport is a concern?
 STREAM RESTORATION FRAMEWORK AND SEDIMENT TRANSPORT BASICS Pete Klingeman 1 What is Your Restoration Project Like? k? Do you think sediment transport is a concern? East Fork Lewis River, WA Tidal creek,
Riparian Assessment. Steps in the right direction... Drainage Basin/Watershed: Start by Thinking Big. Riparian Assessment vs.
 Riparian Assessment vs. Monitoring Riparian Assessment What is a healthy stream? Determine stream/riparian health Determine change or trend, especially in response to mgmt Classification = designation
5. ROADSIDE AND MEDIAN CHANNELS
 5. ROADSIDE AND MEDIAN CHANNELS Roadside and median channels are open-channel systems which collect and convey stormwater from the pavement surface, roadside, and median areas. These channels may outlet
Gully Erosion Part 1 GULLY EROSION AND ITS CAUSES. Introduction. The mechanics of gully erosion
 Gully Erosion Part 1 GULLY EROSION AND ITS CAUSES Gully erosion A complex of processes whereby the removal of soil is characterised by incised channels in the landscape. NSW Soil Conservation Service,
Each basin is surrounded & defined by a drainage divide (high point from which water flows away) Channel initiation
 Channel initiation") DRAINAGE BASINS A drainage basin or watershed is defined from a downstream point, working upstream, to include all of the hillslope & channel areas which drain to that point Each basin is surrounded &
DRAINAGE BASINS A drainage basin or watershed is defined from a downstream point, working upstream, to include all of the hillslope & channel areas which drain to that point Each basin is surrounded &
Why Geomorphology for Fish Passage
 Channel Morphology - Stream Crossing Interactions An Overview Michael Love Michael Love & Associates mlove@h2odesigns.com (707) 476-8938 Why Geomorphology for Fish Passage 1. Understand the Scale of the
Running Water Earth - Chapter 16 Stan Hatfield Southwestern Illinois College
 Running Water Earth - Chapter 16 Stan Hatfield Southwestern Illinois College Hydrologic Cycle The hydrologic cycle is a summary of the circulation of Earth s water supply. Processes involved in the hydrologic
3/3/2013. The hydro cycle water returns from the sea. All "toilet to tap." Introduction to Environmental Geology, 5e
 Introduction to Environmental Geology, 5e Running Water: summary in haiku form Edward A. Keller Chapter 9 Rivers and Flooding Lecture Presentation prepared by X. Mara Chen, Salisbury University The hydro
11/12/2014. Running Water. Introduction. Water on Earth. The Hydrologic Cycle. Fluid Flow
 Introduction Mercury, Venus, Earth and Mars share a similar history, but Earth is the only terrestrial planet with abundant water! Mercury is too small and hot Venus has a runaway green house effect so
Which map shows the stream drainage pattern that most likely formed on the surface of this volcano? A) B)
 B)") 1. When snow cover on the land melts, the water will most likely become surface runoff if the land surface is A) frozen B) porous C) grass covered D) unconsolidated gravel Base your answers to questions
1. When snow cover on the land melts, the water will most likely become surface runoff if the land surface is A) frozen B) porous C) grass covered D) unconsolidated gravel Base your answers to questions
ADDRESSING GEOMORPHIC AND HYDRAULIC CONTROLS IN OFF-CHANNEL HABITAT DESIGN
 ADDRESSING GEOMORPHIC AND HYDRAULIC CONTROLS IN OFF-CHANNEL HABITAT DESIGN Conor Shea - Hydrologist U.S. Fish and Wildlife Service Conservation Partnerships Program Arcata, CA Learning Objectives Examine
NATURAL RIVER. Karima Attia Nile Research Institute
 NATURAL RIVER CHARACTERISTICS Karima Attia Nile Research Institute NATURAL RIVER DEFINITION NATURAL RIVER DEFINITION Is natural stream of water that flows in channels with ih more or less defined banks.
Avoiding Geohazards in the Mid-Atlantic Highlands by Using Natural Stream Principles
 Avoiding Geohazards in the Mid-Atlantic Highlands by Using Natural Stream Principles J. Steven Kite, WVU Neal Carte, WVDOT Will Harman, Michael Baker Corp. Donald D. Gray, WVU Photo: W. Gillespie North
Rapid Geomorphic Assessments: RGA s
 Establishing Current Reference Conditions Rates and concentrations of suspended-sediment transport vary over time and space due to factors such as precipitation characteristics and discharge, geology,
SCOPE OF PRESENTATION STREAM DYNAMICS, CHANNEL RESTORATION PLANS, & SEDIMENT TRANSPORT ANALYSES IN RELATION TO RESTORATION PLANS
 DESIGN METHODS B: SEDIMENT TRANSPORT PROCESSES FOR STREAM RESTORATION DESIGN PETER KLINGEMAN OREGON STATE UNIVERSITY CIVIL ENGINEERING DEPT., CORVALLIS 2 ND ANNUAL NORTHWEST STREAM RESTORATION DESIGN SYMPOSIUM
STUDY GUIDE FOR CONTENT MASTERY. Surface Water Movement
 Surface Water SECTION 9.1 Surface Water Movement In your textbook, read about surface water and the way in which it moves sediment. Complete each statement. 1. An excessive amount of water flowing downslope
OBJECTIVES. Fluvial Geomorphology? STREAM CLASSIFICATION & RIVER ASSESSMENT
 STREAM CLASSIFICATION & RIVER ASSESSMENT Greg Babbit Graduate Research Assistant Dept. Forestry, Wildlife & Fisheries Seneca Creek, Monongahela National Forest, West Virginia OBJECTIVES Introduce basic
CASE STUDIES. Introduction
 Introduction The City of Winston-Salem faces the challenge of maintaining public infrastructure (e.g., water and sewer lines, storm drains, roads, culverts and bridges) while minimizing the potential impacts
Streams. Stream Water Flow
 CHAPTER 14 OUTLINE Streams: Transport to the Oceans Does not contain complete lecture notes. To be used to help organize lecture notes and home/test studies. Streams Streams are the major geological agents
PENNSYLVANIA DEPARTMENT OF TRANSPORTATION ENGINEERING DISTRICT 3-0
 PENNSYLVANIA DEPARTMENT OF TRANSPORTATION ENGINEERING DISTRICT 3-0 LYCOMING COUNTY S.R.15, SECTION C41 FINAL HYDROLOGIC AND HYDRAULIC REPORT STEAM VALLEY RUN STREAM RELOCATION DATE: June, 2006 REVISED:
CR AAO Bridge. Dead River Flood & Natural Channel Design. Mitch Koetje Water Resources Division UP District
 CR AAO Bridge Dead River Flood & Natural Channel Design Mitch Koetje Water Resources Division UP District Old County Road AAO Bridge Map courtesy of Marquette County Silver Lake Basin McClure Basin
Laboratory Exercise #4 Geologic Surface Processes in Dry Lands
 Page - 1 Laboratory Exercise #4 Geologic Surface Processes in Dry Lands Section A Overview of Lands with Dry Climates The definition of a dry climate is tied to an understanding of the hydrologic cycle
Why Stabilizing the Stream As-Is is Not Enough
 Why Stabilizing the Stream As-Is is Not Enough Several examples of alternatives to the County s design approach have been suggested. A common theme of these proposals is a less comprehensive effort focusing
Chapter 2. Regional Landscapes and the Hydrologic Cycle
 Chapter 2. Regional Landscapes and the Hydrologic Cycle W. Lee Daniels Department of Crop and Soil Environmental Sciences, Virginia Tech Table of Contents Introduction... 23 Soils and landscapes of the
PHYSICAL GEOGRAPHY. By Brett Lucas
 PHYSICAL GEOGRAPHY By Brett Lucas FLUVIAL PROCESSES Fluvial Processes The Impact of Fluvial Processes on the Landscape Streams and Stream Systems Stream Channels Structural Relationships The Shaping and
WATER ON AND UNDER GROUND. Objectives. The Hydrologic Cycle
 WATER ON AND UNDER GROUND Objectives Define and describe the hydrologic cycle. Identify the basic characteristics of streams. Define drainage basin. Describe how floods occur and what factors may make
Step 5: Channel Bed and Planform Changes
 Step 5: Channel Bed and Planform Changes When disturbed, streams go through a series of adjustments to regain equilibrium with the flow and sediment supply of their watersheds. These adjustments often
Laboratory Exercise #3 The Hydrologic Cycle and Running Water Processes
 Laboratory Exercise #3 The Hydrologic Cycle and Running Water Processes page - 1 Section A - The Hydrologic Cycle Figure 1 illustrates the hydrologic cycle which quantifies how water is cycled throughout
3.3 CLIMATE, GEOLOGY, TOPOGRAPHY, AND SOILS CLIMATE GEOLOGY TOPOGRAPHY
 3.3 CLIMATE, GEOLOGY, TOPOGRAPHY, AND SOILS This section describes the climate, geology, topography, and soil resource characteristics of the Yolo Bypass Wildlife Area (Wildlife Area). Agricultural soil
Ways To Identify Background Verses Accelerated Erosion
 Ways To Identify Background Verses Accelerated Erosion Establish Background Condition From Old Ground Photos, Aerial Photos, and Maps Compare Rate Over Time At the Same Location, or for Reaches Channel
Changes in Texas Ecoregions
 Comment On Lesson Changes in Texas Ecoregions The state of Texas can be divided into 10 distinct areas based on unique combinations of vegetation, topography, landforms, wildlife, soil, rock, climate,
Weathering and Soil Formation. Chapter 10
 Weathering and Soil Formation Chapter 10 Old and New Mountains The Appalachian Mountains appear very different from the Sierra Mountains. The Appalachians are smaller, rounded, gently sloping, and covered
B-1. Attachment B-1. Evaluation of AdH Model Simplifications in Conowingo Reservoir Sediment Transport Modeling
 Attachment B-1 Evaluation of AdH Model Simplifications in Conowingo Reservoir Sediment Transport Modeling 1 October 2012 Lower Susquehanna River Watershed Assessment Evaluation of AdH Model Simplifications
Soil Formation. Lesson Plan: NRES B2-4
 Soil Formation Lesson Plan: NRES B2-4 1 Anticipated Problems 1. What are five different factors that affect soil formation? 2. What are some different types of parent material that affect soils? 3. What
APPENDIX E. GEOMORPHOLOGICAL MONTORING REPORT Prepared by Steve Vrooman, Keystone Restoration Ecology September 2013
 APPENDIX E GEOMORPHOLOGICAL MONTORING REPORT Prepared by Steve Vrooman, Keystone Restoration Ecology September 2 Introduction Keystone Restoration Ecology (KRE) conducted geomorphological monitoring in
1. The map below shows a meandering river. A A' is the location of a cross section. The arrows show the direction of the river flow.
 1. The map below shows a meandering river. A A' is the location of a cross section. The arrows show the direction of the river flow. Which cross section best represents the shape of the river bottom at
mountain rivers fixed channel boundaries (bedrock banks and bed) high transport capacity low storage input output
 high transport capacity low storage input output") mountain rivers fixed channel boundaries (bedrock banks and bed) high transport capacity low storage input output strong interaction between streams & hillslopes Sediment Budgets for Mountain Rivers Little
mountain rivers fixed channel boundaries (bedrock banks and bed) high transport capacity low storage input output strong interaction between streams & hillslopes Sediment Budgets for Mountain Rivers Little
Summary of Hydraulic and Sediment-transport. Analysis of Residual Sediment: Alternatives for the San Clemente Dam Removal/Retrofit Project,
 Appendix N SUMMARY OF HYDRAULIC AND SEDIMENT-TRANSPORT ANALYSIS OF RESIDUAL SEDIMENT: ALTERNATIVES FOR THE SAN CLEMENTE DAM REMOVAL/RETROFIT PROJECT, CALIFORNIA the San Clemente Dam Removal/Retrofit Project,
The last three sections of the main body of this report consist of:
 Threatened and Endangered Species Geological Hazards Floodplains Cultural Resources Hazardous Materials A Cost Analysis section that provides comparative conceptual-level costs follows the Environmental
Appendix E Guidance for Shallow Flooding Analyses and Mapping
 Appendix E Guidance for Shallow Flooding Analyses and Mapping E.1 Introduction Different types of shallow flooding commonly occur throughout the United States. Types of flows that result in shallow flooding
Working with Natural Stream Systems
 Working with Natural Stream Systems Graydon Dutcher Delaware County Soil & Water Conservation District Stream Corridor Management Program Tropical Storm Sandy October 29,2012 What is a Watershed?
Soil Mechanics. Chapter # 1. Prepared By Mr. Ashok Kumar Lecturer in Civil Engineering Gpes Meham Rohtak INTRODUCTION TO SOIL MECHANICS AND ITS TYPES
 Soil Mechanics Chapter # 1 INTRODUCTION TO SOIL MECHANICS AND ITS TYPES Prepared By Mr. Ashok Kumar Lecturer in Civil Engineering Gpes Meham Rohtak Chapter Outlines Introduction to Soil Mechanics, Soil
STREAM SYSTEMS and FLOODS
 STREAM SYSTEMS and FLOODS The Hydrologic Cycle Precipitation Evaporation Infiltration Runoff Transpiration Earth s Water and the Hydrologic Cycle The Hydrologic Cycle The Hydrologic Cycle Oceans not filling
Precipitation Evaporation Infiltration Earth s Water and the Hydrologic Cycle. Runoff Transpiration
 STREAM SYSTEMS and FLOODS The Hydrologic Cycle Precipitation Evaporation Infiltration Earth s Water and the Hydrologic Cycle Runoff Transpiration The Hydrologic Cycle The Hydrologic Cycle Oceans not filling
Landscape Development
 Landscape Development Slopes Dominate Natural Landscapes Created by the interplay of tectonic and igneous activity and gradation Deformation and uplift Volcanic activity Agents of gradation Mass wasting
Module 4: Overview of the Fundamentals of Runoff and Erosion
 Module 4: Overview of the Fundamentals of Runoff and Erosion Module 4a Goal Once we can better understand the forces which cause erosion and runoff, only then can we begin to minimize the negative results.
PolyMet NorthMet Project
 RS 26 Draft-01 December 8, 2005 RS26 Partridge River Level 1 Rosgen Geomorphic Survey Rosgen Classification Partridge River from Headwaters to Colby Lake Prepared for PolyMet NorthMet Project December
Mass Wasting. Revisit: Erosion, Transportation, and Deposition
 Mass Wasting Revisit: Erosion, Transportation, and Deposition While landslides are a normal part of erosion and surface processes, they can be very destructive to life and property! - Mass wasting: downslope
What Is Water Erosion? Aren t they the same thing? What Is Sediment? What Is Sedimentation? How can Sediment Yields be Minimized?
 Jerald S. Fifield, Ph.D. CISEC HydroDynamics Incorporated Parker, CO 303-841-0377 Aren t they the same thing? What Is Sediment? Soil particles deposited or suspended in water or air The process of depositing
Technical Memorandum. To: From: Copies: Date: 10/19/2017. Subject: Project No.: Greg Laird, Courtney Moore. Kevin Pilgrim and Travis Stroth
 Technical Memorandum To: From: Greg Laird, Courtney Moore Kevin Pilgrim and Travis Stroth 5777 Central Avenue Suite 228 Boulder, CO 80301 www.otak.com Copies: [Electronic submittal] Date: 10/19/2017 Subject:
Description DESCRIPTION
 DESCRIPTION The location of the Upper James Watershed is located in northeastern South Dakota as well as southeastern North Dakota. It includes the following counties located in North Dakota Barnes, Dickey,
What factors affect the angle of a slope?
 Climate Rock type and Structure What factors affect the angle of a slope? Aspect Fast mass movements Slides: Slides are movements along the SLIP PLANE, i.e. a line of weakness in the rock or soil structure.
ES 105 Surface Processes I. Hydrologic cycle A. Distribution % in oceans 2. >3% surface water a. +99% surface water in glaciers b.
 ES 105 Surface Processes I. Hydrologic cycle A. Distribution 1. +97% in oceans 2. >3% surface water a. +99% surface water in glaciers b. >1/3% liquid, fresh water in streams and lakes~1/10,000 of water
Changes in Texas Ecoregions Copy the questions and answers
 Changes in Texas Ecoregions Copy the questions and answers 1. What are some kinds of damage that hurricanes cause? Roads and bridges might be washed away. Trees and power lines can be knocked down. Area
Bank Erosion and Morphology of the Kaskaskia River
 Bank Erosion and Morphology of the Kaskaskia River US Army Corps Of Engineers St. Louis District Fayette County Soil and Water Conservation District Team Partners : Carlyle Lake Ecosystem Partnership Vicinity
PREDICTING SOIL SUCTION PROFILES USING PREVAILING WEATHER
 PREDICTING SOIL SUCTION PROFILES USING PREVAILING WEATHER Ronald F. Reed, P.E. Member, ASCE rreed@reed-engineering.com Reed Engineering Group, Ltd. 2424 Stutz, Suite 4 Dallas, Texas 723 214-3-6 Abstract
Fish Passage at Road Crossings
 Fish Passage at Road Crossings 1 Crossing Design Workshop Outline 1:00 to 2:00 Intro, Design Overview, Channel Width 2:00 to 2:15 Break 2:15 to 3:15 No-Slope, Stream Simulation Design 3:15 to 3:30 Break
GEOL 1121 Earth Processes and Environments
 GEOL 1121 Earth Processes and Environments Wondwosen Seyoum Department of Geology University of Georgia e-mail: seyoum@uga.edu G/G Bldg., Rm. No. 122 Seyoum, 2015 Chapter 6 Streams and Flooding Seyoum,
GEOL 652. Poudre River Fieldtrip
 GEOL 652. Poudre River Fieldtrip One of the more difficult variables to measure and/or estimate when studying flow in natural channels is that of roughness. Roughness, usually approximated with Manning
Rosgen Classification Unnamed Creek South of Dunka Road
 Rosgen Classification Unnamed Creek South of Dunka Road Prepared for Poly Met Mining Inc. September 2013 Rosgen Classification Unnamed Creek South of Dunka Road Prepared for Poly Met Mining Inc. September
Dam Removal Analysis Guidelines for Sediment
 A review of: Dam Removal Analysis Guidelines for Sediment Joe Rathbun (Retired) rathbunj@sbcglobal.net Some Potential Sediment Issues Reservoir restoration Downstream water quality Downstream deposition
Essential Questions. What is erosion? What is mass wasting?
 Erosion Essential Questions What is erosion? What is mass wasting? What is Erosion? Erosion The transportation of sediment from one area to another Caused mainly by running water but also caused by glaciers,
Name: Mid-Year Review #2 SAR
 Name: Mid-Year Review #2 SAR Base your answers to questions 1 through 3 on on the diagram below, which shows laboratory materials used for an investigation of the effects of sediment size on permeability,
Chapter 7 Mudflow Analysis
 Chapter 7 Mudflow Analysis 7.0 Introduction This chapter provides information on the potential and magnitude of mud floods and mudflows that may develop in Aspen due to rainfall events, snowmelt, or rain
Environmental Geology Chapter 9 Rivers and Flooding
 Environmental Geology Chapter 9 Rivers and Flooding Flooding in Pakistan 2010-1600 killed/20000 affected The hydrologic cycle is powered by the Sun The cycle includes evaporation, precipitation, infiltration,
J. Paul Guyer, P.E., R.A.
 J. Paul Guyer, P.E., R.A. Paul Guyer is a registered mechanical engineer, civil engineer, fire protection engineer and architect with over 35 years experience in the design of buildings and related infrastructure.
MATHEMATICAL MODELING OF FLUVIAL SEDIMENT DELIVERY, NEKA RIVER, IRAN. S.E. Kermani H. Golmaee M.Z. Ahmadi
 JOURNAL OF ENVIRONMENTAL HYDROLOGY The Electronic Journal of the International Association for Environmental Hydrology On the World Wide Web at http://www.hydroweb.com VOLUME 16 2008 MATHEMATICAL MODELING
How Do Human Impacts and Geomorphological Responses Vary with Spatial Scale in the Streams and Rivers of the Illinois Basin?
 How Do Human Impacts and Geomorphological Responses Vary with Spatial Scale in the Streams and Rivers of the Illinois Basin? Bruce Rhoads Department of Geography University of Illinois at Urbana-Champaign
RIVERS, GROUNDWATER, AND GLACIERS
 RIVERS, GROUNDWATER, AND GLACIERS Delta A fan-shaped deposit that forms when a river flows into a quiet or large body of water, such as a lake, an ocean, or an inland sea. Alluvial Fan A sloping triangle
Topic 6: Weathering, Erosion and Erosional-Deposition Systems (workbook p ) Workbook Chapter 4, 5 WEATHERING
 Workbook Chapter 4, 5 WEATHERING") Topic 6: Weathering, Erosion and Erosional-Deposition Systems (workbook p. 95-125) Workbook Chapter 4, 5 THE BIG PICTURE: Weathering, erosion and deposition are processes that cause changes to rock material
Topic 6: Weathering, Erosion and Erosional-Deposition Systems (workbook p. 95-125) Workbook Chapter 4, 5 THE BIG PICTURE: Weathering, erosion and deposition are processes that cause changes to rock material
Impact : Changes to Existing Topography (Less than Significant)
") 4.2 Land Resources 4.2.1 Alternative A Proposed Action Impact 4.2.1-1: Changes to Existing Topography (Less than Significant) Development of the project site would involve grading and other earthwork as
4.2 Land Resources 4.2.1 Alternative A Proposed Action Impact 4.2.1-1: Changes to Existing Topography (Less than Significant) Development of the project site would involve grading and other earthwork as
Black Gore Creek 2013 Sediment Source Monitoring and TMDL Sediment Budget
 Black Gore Creek 2013 Sediment Source Monitoring and TMDL Sediment Budget Prepared for: Prepared By: - I. Introduction The Black Gore Creek Total Maximum Daily Load (TMDL) was developed in collaboration
UGRC 144 Science and Technology in Our Lives/Geohazards
 UGRC 144 Science and Technology in Our Lives/Geohazards Flood and Flood Hazards Dr. Patrick Asamoah Sakyi Department of Earth Science, UG, Legon College of Education School of Continuing and Distance Education
Rock Sizing for Batter Chutes
 Rock Sizing for Batter Chutes STORMWATER MANAGEMENT PRACTICES Photo 1 Rock-lined batter chute Photo 2 Rock-lined batter chute 1. Introduction In the stormwater industry a chute is a steep drainage channel,
Unit E: Basic Principles of Soil Science. Lesson 2: Understanding Soil Formation
 Unit E: Basic Principles of Soil Science Lesson 2: Understanding Soil Formation Important Terms Alluvium Bedrock Chemical weathering Climate Glacial till Loess Native vegetation Organic matter Outwash
Streams. Water. Hydrologic Cycle. Geol 104: Streams
 Streams Why study streams? Running water is the most important geologic agent in erosion, transportation and deposition of sediments. Water The unique physical and chemical properties of water make it
Solutions to Flooding on Pescadero Creek Road
 Hydrology Hydraulics Geomorphology Design Field Services Photo courtesy Half Moon Bay Review Solutions to Flooding on Pescadero Creek Road Prepared for: San Mateo County Resource Conservation District
Figure 1 The map shows the top view of a meandering stream as it enters a lake. At which points along the stream are erosion and deposition dominant?
 1. In which type of climate does chemical weathering usually occur most rapidly? 1. hot and dry 3. cold and dry 2. hot and wet 4. cold and wet 2. Figure 1 The map shows the top view of a meandering stream
Fukien Secondary School Monthly Vocabulary/Expression List for EMI Subjects Secondary Two. Subject: Geography
 Focus: General Specific : Section Two : Unit One 1 Landslide 2 Downslope movement 3 Rock 4 Soil 5 Gravity 6 Natural hazard 7 Rainwater 8 Friction 9 Hilly relief 10 Unstable 11 Season 12 Saturated 13 Construction
What do you need for a Marathon?
 What do you need for a Marathon? Water and a snack? What about just a normal day? 1 flush = 3.5 gallons 1 flush = 3.5 gallons 10 minute shower = 20 gal 1 flush = 3.5 gallons 10 minute shower = 20 gal Jeans
Environmental Science Institute The University of Texas - Austin
 Environmental Science Institute The University of Texas - Austin Geologic Wonders of Central Texas Dr. Leon Long This file contains suggestions for how to incorporate the material from this CDROM into
Chapter 7 Mudflow Analysis
 Chapter 7 Mudflow Analysis 7.0 Introduction This chapter provides information on the potential and magnitude of mud floods and mudflows that may develop in Aspen due to rainfall events, snowmelt, or rain
Mass Wasting: The Work of Gravity
 Chapter 15 Lecture Earth: An Introduction to Physical Geology Twelfth Edition Mass Wasting: The Work of Gravity Tarbuck and Lutgens Chapter 15 Mass Wasting The Importance of Mass Wasting Slopes are the
HW #2 Landscape Travel from A to B 12,
 HW #2 Landscape 2016 Section: Name: ate: 1. ase your answer(s) to the following question(s) on the map below, which represents two bridges that cross the Green River. Letters,, and represent locations
Hydrogeological Assessment for Part of Lots 2 and 3, Concession 5, Township of Thurlow, County of Hastings 1.0 INTRODUCTION. 1.
 February 10,2017 25506400 Ontario Ltd. Foxboro, ON Attention: Brad Newbatt Re: Hydrogeological Assessment for Part of Lots 2 and 3, Concession 5, Township of Thurlow, County of Hastings 1.0 INTRODUCTION
Limitation to qualitative stability indicators. the real world is a continuum, not a dichotomy ~ 100 % 30 % ~ 100 % ~ 40 %
 Stream Stability Assessment & BEHI Surveys Joe Rathbun MDEQ Water Resources Division rathbunj@michigan.gov 517--373 517 373--8868 Stability Stream can transport its water and sediment inputs without changing
Name: Which rock layers appear to be most resistant to weathering? A) A, C, and E B) B and D
 A, C, and E B) B and D") Name: 1) The formation of soil is primarily the result of A) stream deposition and runoff B) precipitation and wind erosion C) stream erosion and mass movement D) weathering and biological activity 2)
Name: 1) The formation of soil is primarily the result of A) stream deposition and runoff B) precipitation and wind erosion C) stream erosion and mass movement D) weathering and biological activity 2)
Kaskaskia Morphology Study Headwaters to Lake Shelbyville
 Kaskaskia Morphology Study Headwaters to Lake Shelbyville KWA Mini Summit 5 March 2012 1 Kaskaskia Morphology Study Headwaters to Lake Shelbyville Conducted by U.S. Army Corps of Engineers, St. Louis District
MEANDER MIGRATION MODEL ASSESSMENT FOR THE JANUARY 2005 STORM, WHITMAN PROPERTY, SAN ANTONIO CREEK, VENTURA COUNTY, CALIFORNIA
 MEANDER MIGRATION MODEL ASSESSMENT FOR THE JANUARY 2005 STORM, WHITMAN PROPERTY, SAN ANTONIO CREEK, VENTURA COUNTY, CALIFORNIA Prepared by Eric Larsen, Ph.D. Mark Rains, Ph.D. October 2006 INTRODUCTION
Erosion Rate is a Function of Erodibility and Excess Shear Stress = k ( o - c ) From Relation between Shear Stress and Erosion We Calculate c and
 From Relation between Shear Stress and Erosion We Calculate c and") Equilibrium, Shear Stress, Stream Power and Trends of Vertical Adjustment Andrew Simon USDA-ARS, Oxford, MS asimon@msa-oxford.ars.usda.gov Non-Cohesive versus Cohesive Materials Non-cohesive: sands and
Equilibrium, Shear Stress, Stream Power and Trends of Vertical Adjustment Andrew Simon USDA-ARS, Oxford, MS asimon@msa-oxford.ars.usda.gov Non-Cohesive versus Cohesive Materials Non-cohesive: sands and