Global warming Summary evidence
|
|
|
- Brenda Lewis
- 6 years ago
- Views:
Transcription
1 Global warming Summary evidence
2 Learning goals Observations of global temperature change How/why we can be confident in the results Difference between forcing and response Notion of an interaction The concept of feedbacks Be able to recognize positive and negative feedback loops
. Anomalies are relative to the mean of 1961 1990.")
3 (Full report to be released 30 January 2014) Observed global mean combined land and ocean surface temperature anomalies, from 1850 to 2012 from three data sets. Top panel: annual mean values. Bottom panel: decadal mean values including the estimate of uncertainty for one dataset (black). Anomalies are relative to the mean of IPCC, 2013: Summary for Policymakers. In: Climate Change 2013: The Physical Science Basis. Contribution of Working Group I to the Fifth Assessment Report of the Intergovernmental Panel on Climate Change [Stocker, T.F., D. Qin, G.-K. Plattner, M. Tignor, S.K. Allen, J. Boschung, A. Nauels, Y. Xia, V. Bex and P.M. Midgley (eds.)]. Cambridge University Press, Cambridge, United Kingdom and New York, NY, USA, in press


4 Could this be wrong!? Try googling: global temperature warming false. Apparently some people have strong opinions. What about the facts?
5
6 Same result from multiple datasets Proxy temperature records are independent of thermometers
7 Clickers questions Test question: The most awesome class so far this semester is: A. ATOC 1060
8 Is warming the same everywhere? A. Warming is the same everywhere B. Warming is largest near the equator C. Warming is largest over land D. Warming is largest over the ocean E. Warming is largest in Antarctica
.")
9 Map of the observed surface temperature change from 1901 to 2012 derived from temperature trends determined by linear regression from one dataset (orange line in panel a). Trends have been calculated where data availability permits a robust estimate (i.e., only for grid boxes with greater than 70% complete records and more than 20% data availability in the first and last 10% of the time period). Other areas are white. Grid boxes where the trend is significant at the 10% level are indicated by a + sign.
10 Is warming the same everywhere? A. Warming is the same everywhere B. Warming is largest near the equator C. Warming is largest over land D. Warming is largest over the ocean E. Warming is largest in Antarctica

11 Maps of observed precipitation change from 1901 to 2010 and from 1951 to 2010 (trends in annual accumulation calculated using the same criteria as in Figure SPM.1) from one data set.
12 Precipitation changes... A. Are more well known than temperature changes B. Are known to be larger over land C. Are generally increasing in the eastern US D. Are definitely decreasing in Colorado E. Are irrelevant for climate change

 Keeling Me at Mauna Loa")
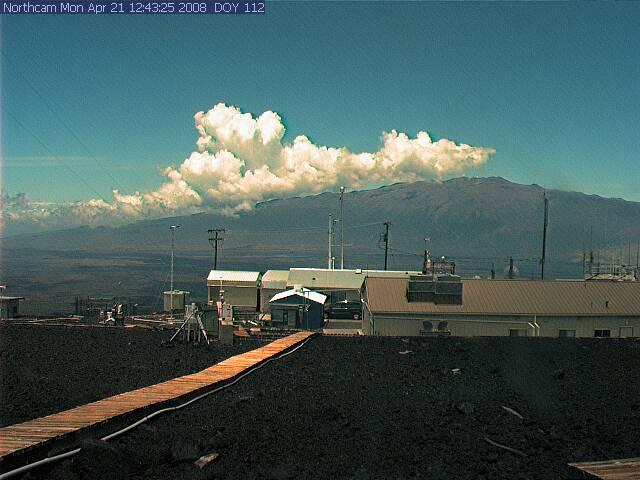
13 Now measured by NOAA-Global Monitoring Division in Boulder and INSTAAR at CU Over 400 ppm last year. Charles (Dave) Keeling Me at Mauna Loa with Keeling's instrument.
14
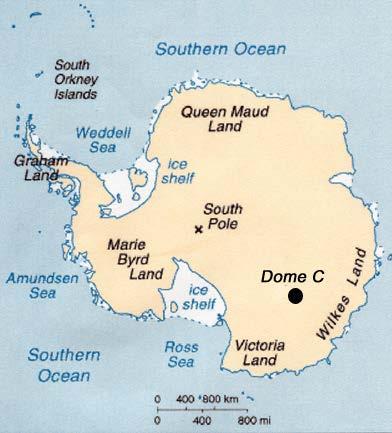
15 Multiple observed indicators of a changing global carbon cycle: (a) atmospheric concentrations of carbon dioxide (CO2) from Mauna Loa (19 32 N, W red) and South Pole (89 59 S, W black) since 1958; (b) partial pressure of dissolved CO2 at the ocean surface (blue curves) and in situ ph (green curves), a measure of the acidity of ocean water. Measurements are from three stations from the Atlantic (29 10 N, W dark blue/dark green; N, W blue/green) and the Pacific Oceans (22 45 N, W light blue/light green).


16 Drilling ice cores Chemical composition of ice related to temperature Also, air bubbles trap CO 2 Ice core samples analyzed at CU-INSTAAR, cores stored at the National Ice-core Lab. in Denver recent 100,000 years 0.5 million years old

17 Data from ice cores Temperature Article by Gavin Schmidt: realclimate.org Figure by T. Stocker.
 heat content aligned to 2006 2010, and relative to the mean of all datasets for 1970; (d) global mean sea level relative to the 1900 1905 mean of the longest running")
18 Other indicators of global warming (a) Extent of Northern Hemisphere March-April (spring) average snow cover; (b) extent of Arctic July-August-September (summer) average sea ice; (c) change in global mean upper ocean (0 700 m) heat content aligned to , and relative to the mean of all datasets for 1970; (d) global mean sea level relative to the mean of the longest running dataset, and with all datasets aligned to have the same value in 1993, the first year of satellite altimetry data.
19 Reading Chapter 2: The Greenhouse effect Rough Guide pages: (also catch up on 1-22 if not read yet) Next week: Homework assignment 1
20 Help! David Noone: office hours: Tuesday 2-5pm Ariel Morrison (TA): office hours TBD LAs: Drop in study sessions (Monday 2-3, Tuesday 11-12:, Thursday 10-11, 11-12, 6-7pm) Genziana Pando Kelly Gjestvang Mark.Leonard Excellent for homework and formulating discussion questions.
Trend of Annual One-Day Maximum Rainfall Series over South India
 Trend of Annual One-Day Maximum Rainfall Series over South India Dr. Ashoke Basistha Hydrologist Dam Rehabilitation & Improvement Project 1 st National Dam Safety Conference, Chennai 2 Organization Introduction
GEOL 437 Global Climate Change 5/1/18: Climate sensitivity
 GEOL 437 Global Climate Change 5/1/18: Climate sensitivity How sensitive is the climate to external radiative forcing? FAQ 12.3 Fig 1 in: Collins, M., R. Knutti, J. Arblaster, J.- L. Dufresne, T. Fichefet,
Twenty-five winters of unexpected Eurasian cooling unlikely due to Arctic sea-ice loss
 SUPPLEMENTARY INFORMATION DOI: 10.1038/NGEO2820 Twenty-five winters of unexpected Eurasian cooling unlikely due to Arctic sea-ice loss Kelly E. McCusker 1,2, John C. Fyfe 2 & Michael Sigmond 2 1 School
Ryan P. Shadbolt * Central Michigan University, Mt. Pleasant, Michigan
 14A.1 RECENT CLIMATE CHANGE IN THE HIGH ELEVATIONS OF THE SOUTHERN APPALACHIANS Ryan P. Shadbolt * Central Michigan University, Mt. Pleasant, Michigan 1. INTRODUCTION Island species are often vulnerable
3.1. The Climatological Relation Between Extreme Precipitable Water Vapor (PWV) and Precipitation for the September 2013 Colorado Flooding Event
 and Precipitation for the September 2013 Colorado Flooding Event") The Climatological Relation Between Extreme Precipitable Water Vapor (PWV) and Precipitation for the September 213 Colorado Flooding Event Jacola Roman 1, Robert Knuteson 2, Steve Ackerman 3, and Hank
The Climatological Relation Between Extreme Precipitable Water Vapor (PWV) and Precipitation for the September 213 Colorado Flooding Event Jacola Roman 1, Robert Knuteson 2, Steve Ackerman 3, and Hank
IMPACTS OF A WARMING ARCTIC
 The Earth s Greenhouse Effect Most of the heat energy emitted from the surface is absorbed by greenhouse gases which radiate heat back down to warm the lower atmosphere and the surface. Increasing the
causes Associate Professor Department of Meteorology The Pennsylvania State University
 Recent climate change and its causes Raymond Najjar Associate Professor Department of Meteorology The Pennsylvania State University Presentation for: Erie County Climate Adaptation Workshop September 1,
Observed Climate Variability and Change: Evidence and Issues Related to Uncertainty
 Observed Climate Variability and Change: Evidence and Issues Related to Uncertainty David R. Easterling National Climatic Data Center Asheville, North Carolina Overview Some examples of observed climate
Climate change: How do we know?
 Climate change: How do we know? This graph, based on the comparison of atmospheric samples contained in ice cores and more recent direct measurements, provides evidence that atmospheric CO2 has increased
J8.4 TRENDS OF U.S. SNOWFALL AND SNOW COVER IN A WARMING WORLD,
 J8.4 TRENDS OF U.S. SNOWFALL AND SNOW COVER IN A WARMING WORLD, 1948-2008 Richard R. Heim Jr. * NOAA National Climatic Data Center, Asheville, North Carolina 1. Introduction The Intergovernmental Panel
Deke Arndt, Chief, Climate Monitoring Branch, NOAA s National Climatic Data Center
 Thomas R. Karl, L.H.D., Director, NOAA s National Climatic Data Center, and Chair of the Subcommittee on Global Change Research Peter Thorne, PhD, Senior Scientist, Cooperative Institute for Climate and
Climate Change: Global Warming Claims
 Climate Change: Global Warming Claims Background information (from Intergovernmental Panel on Climate Change): The climate system is a complex, interactive system consisting of the atmosphere, land surface,
Annex I to Target Area Assessments
 Baltic Challenges and Chances for local and regional development generated by Climate Change Annex I to Target Area Assessments Climate Change Support Material (Climate Change Scenarios) SWEDEN September
Composition and optical properties of secondary organic aerosol particles
 Concordia University - Portland From the SelectedWorks of Matthew E. Wise November, 2014 Composition and optical properties of secondary organic aerosol particles Felisha Imholt, Concordia University -
Understanding and attributing climate variations: The role of energy. Kevin E Trenberth NCAR
 Understanding and attributing climate variations: The role of energy Kevin E Trenberth NCAR NCAR: attribution A way to organize a lot of research Makes it relevant to societal concerns Has some implications
OFF THE CHARTS: 2013 WAS AUSTRALIA S HOTTEST YEAR
 OFF THE CHARTS: 2013 WAS AUSTRALIA S HOTTEST YEAR The Climate Council is an independent, crowd-funded organisation providing quality information on climate change to the Australian public. 2013 was a remarkable
WHAT DO WE KNOW ABOUT FUTURE CLIMATE IN COASTAL SOUTH CAROLINA?
 WHAT DO WE KNOW ABOUT FUTURE CLIMATE IN COASTAL SOUTH CAROLINA? Amanda Brennan & Kirsten Lackstrom Carolinas Integrated Sciences & Assessments November 13, 2013 Content Development Support: Greg Carbone
Forum on Climate Change Noosa, July 2015 Exposing the myths of climate change
 Forum on Climate Change Noosa, July 2015 Exposing the myths of climate change Des Moore My thesis today is that there is minimal risk that temperatures will become dangerously high if there is continued
Transformational Climate Science. The future of climate change research following the IPCC Fifth Assessment Report
 Transformational Climate Science The future of climate change research following the IPCC Fifth Assessment Report www.exeter.ac.uk/climate2014 Working Group I The challenge of climate change #climate2014
Global warming is unequivocal: The 2007 IPCC Assessment
 Global warming is unequivocal: The 2007 IPCC Assessment Kevin E. Trenberth * March 2, 2007 * Any opinions, findings, conclusions, or recommendations expressed in this publication are those of the author
What is the IPCC? Intergovernmental Panel on Climate Change
 IPCC WG1 FAQ What is the IPCC? Intergovernmental Panel on Climate Change The IPCC is a scientific intergovernmental body set up by the World Meteorological Organization (WMO) and by the United Nations
A Warming Arctic: Regional Drama with Global Consequences
 A Warming Arctic: Regional Drama with Global Consequences Norway: Temperature in March was 3,8 C above the normal, 4th highest since 1900 Monthly precipitation for Norway was 120 % above the normal Temperaturein
Outline 24: The Holocene Record
 Outline 24: The Holocene Record Climate Change in the Late Cenozoic New York Harbor in an ice-free world (= Eocene sea level) Kenneth Miller, Rutgers University An Ice-Free World: eastern U.S. shoreline
Today s Lecture: Land, biosphere, cryosphere (All that stuff we don t have equations for... )
") Today s Lecture: Land, biosphere, cryosphere (All that stuff we don t have equations for... ) 4 Land, biosphere, cryosphere 1. Introduction 2. Atmosphere 3. Ocean 4. Land, biosphere, cryosphere 4.1 Land
Today s Lecture: Land, biosphere, cryosphere (All that stuff we don t have equations for... ) 4 Land, biosphere, cryosphere 1. Introduction 2. Atmosphere 3. Ocean 4. Land, biosphere, cryosphere 4.1 Land
Prof. Dr. Anders Levermann Junior Professor for climate modelling on long timescales, Potsdam Institute for Climate Impact Research, Potsdam, Germany
 Prof. Dr. Anders Levermann Junior Professor for climate modelling on long timescales, Potsdam Institute for Climate Impact Research, Potsdam, Germany Points for discussion: The state of global climate;
Activity 2.2: Recognizing Change (Observation vs. Inference)
") Activity 2.2: Recognizing Change (Observation vs. Inference) Teacher Notes: Evidence for Climate Change PowerPoint Slide 1 Slide 2 Introduction Image 1 (Namib Desert, Namibia) The sun is on the horizon
Activity 2.2: Recognizing Change (Observation vs. Inference) Teacher Notes: Evidence for Climate Change PowerPoint Slide 1 Slide 2 Introduction Image 1 (Namib Desert, Namibia) The sun is on the horizon
1. The frequency of an electromagnetic wave is proportional to its wavelength. a. directly *b. inversely
 CHAPTER 3 SOLAR AND TERRESTRIAL RADIATION MULTIPLE CHOICE QUESTIONS 1. The frequency of an electromagnetic wave is proportional to its wavelength. a. directly *b. inversely 2. is the distance between successive
Activity 2.2: Expert Group B Worksheet
 Name Teacher Date Activity 2.2: Expert Group B Worksheet In your expert group, complete each task answer the questions related to each task. In the next activity, you will explain your phenomenon to your
HUMAN FINGERPRINTS (1): OBSERVATIONS
: OBSERVATIONS") HUMAN FINGERPRINTS (1): OBSERVATIONS 1. Introduction: the story so far. 2. Global warming: the last 150 years 3. Is it really warming? 4. Fingerprints: the stratosphere, the hockey sticks Radiance (mw.m
HUMAN FINGERPRINTS (1): OBSERVATIONS 1. Introduction: the story so far. 2. Global warming: the last 150 years 3. Is it really warming? 4. Fingerprints: the stratosphere, the hockey sticks Radiance (mw.m
Evidence of Current Climate Change in the Polar Regions
 Evidence of Current Climate Change in the Polar Regions Dr. Mary Albert Cold Regions Research and Engineering Laboratory Thayer School of Engineering, Dartmouth College Hanover, NH Overview How do we detect
Projected Change in Climate Under A2 Scenario in Dal Lake Catchment Area of Srinagar City in Jammu and Kashmir
 Current World Environment Vol. 11(2), 429-438 (2016) Projected Change in Climate Under A2 Scenario in Dal Lake Catchment Area of Srinagar City in Jammu and Kashmir Saqib Parvaze 1, Sabah Parvaze 2, Sheeza
Chapter outline. Reference 12/13/2016
 Chapter 2. observation CC EST 5103 Climate Change Science Rezaul Karim Environmental Science & Technology Jessore University of science & Technology Chapter outline Temperature in the instrumental record
Extremes of Weather and the Latest Climate Change Science. Prof. Richard Allan, Department of Meteorology University of Reading
 Extremes of Weather and the Latest Climate Change Science Prof. Richard Allan, Department of Meteorology University of Reading Extreme weather climate change Recent extreme weather focusses debate on climate
Introduction to Global Warming
 Introduction to Global Warming Cryosphere (including sea level) and its modelling Ralf GREVE Institute of Low Temperature Science Hokkaido University Sapporo, 2010.09.14 http://wwwice.lowtem.hokudai.ac.jp/~greve/
In the spring of 2016, the American Philosophical Society s
 Introduction to the Symposium on Observed Climate Change 1 WARREN M. WASHINGTON Senior Scientist, Climate Change Research Section National Center for Atmospheric Research In the spring of 2016, the American
Global Climate Change
 Why? Global Climate Change What evidence have scientists collected to support global climate change? Global climate change is a topic that is frequently discussed but often misunderstood due to the complexities
Climate Science, Projections and BoM Capability
 Climate Science, Projections and BoM Capability Climate Information Program: David Jones (Manager of Climate Monitoring and Prediction) & Leading in Climate Data, Monitoring, Prediction and Advice Perry
Why build a climate model
 Climate Modeling Why build a climate model Atmosphere H2O vapor and Clouds Absorbing gases CO2 Aerosol Land/Biota Surface vegetation Ice Sea ice Ice sheets (glaciers) Ocean Box Model (0 D) E IN = E OUT
Changing Marine Access in the Arctic Ocean: The Arctic Climate Impact Assessment Panama Canal Authority 11 January 2005
 Changing Marine Access in the Arctic Ocean: The Arctic Climate Impact Assessment Panama Canal Authority 11 January 2005 Lawson Brigham Deputy Director, U.S. Arctic Research Commission ACIA Contributing
3. Climate Change. 3.1 Observations 3.2 Theory of Climate Change 3.3 Climate Change Prediction 3.4 The IPCC Process
 3. Climate Change 3.1 Observations 3.2 Theory of Climate Change 3.3 Climate Change Prediction 3.4 The IPCC Process 3.1 Observations Need to consider: Instrumental climate record of the last century or
Figure 1. Carbon dioxide time series in the North Pacific Ocean (
 Evidence #1: Since 1950, Earth s atmosphere and oceans have changed. The amount of carbon released to the atmosphere has risen. Dissolved carbon in the ocean has also risen. More carbon has increased ocean
The science behind southeast Australia s wet, cool summer.
 XXXX The science behind southeast Australia s wet, cool summer. Key facts: 1. For many years scientists have painted a clear picture: that the Earth s surface is warming rapidly and the climate is changing.
Intergovernmental Panel on Climate Change Founded Provides science assessments. Policy-relevant, not policy-prescriptive. Major reports: 1990,
 Intergovernmental Panel on Climate Change Founded 1988. Provides science assessments. Policy-relevant, not policy-prescriptive. Major reports: 1990, 1995, 2001, 2007. Highly regarded, endorsed by many
Observed State of the Global Climate
 WMO Observed State of the Global Climate Jerry Lengoasa WMO June 2013 WMO Observations of Changes of the physical state of the climate ESSENTIAL CLIMATE VARIABLES OCEANIC ATMOSPHERIC TERRESTRIAL Surface
THIN ICE AREA EXTRACTION IN THE SEASONAL SEA ICE ZONES OF THE NORTHERN HEMISPHERE USING MODIS DATA
 THIN ICE AREA EXTRACTION IN THE SEASONAL SEA ICE ZONES OF THE NORTHERN HEMISPHERE USING MODIS DATA K. Hayashi 1, K. Naoki 1, K. Cho 1 *, 1 Tokai University, 2-28-4, Tomigaya, Shibuya-ku, Tokyo, Japan,
Global Warming: The known, the unknown, and the unknowable
 Global Warming: The known, the unknown, and the unknowable Barry A. Klinger Jagadish Shukla George Mason University (GMU) Institute of Global Environment and Society (IGES) January, 2008, George Mason
What is Climate? Climate Change Evidence & Causes. Is the Climate Changing? Is the Climate Changing? Is the Climate Changing? Is the Climate Changing?
 What is Climate? 1 Climate Change Evidence & Causes Refers to the average environmental conditions (i.e. temperature, precipitation, extreme events) in a given location over many years Climate is what
PRMS WHITE PAPER 2014 NORTH ATLANTIC HURRICANE SEASON OUTLOOK. June RMS Event Response
 PRMS WHITE PAPER 2014 NORTH ATLANTIC HURRICANE SEASON OUTLOOK June 2014 - RMS Event Response 2014 SEASON OUTLOOK The 2013 North Atlantic hurricane season saw the fewest hurricanes in the Atlantic Basin
Lab Activity: Climate Variables
 Name: Date: Period: Water and Climate The Physical Setting: Earth Science Lab Activity: Climate Variables INTRODUCTION:! The state of the atmosphere continually changes over time in response to the uneven
An Arctic Perspective on Climate Change
 An Arctic Perspective on Climate Change 23 Oct 2012 Gifford Miller (and many others) University of Colorado Boulder The Earth is warming How do we know? Temperature Anomaly ( C) It s a fact Global Land
Climate Change 2007: The Physical Science Basis
 Climate Change 2007: The Physical Science Basis Working Group I Contribution to the IPCC Fourth Assessment Report Presented by R.K. Pachauri, IPCC Chair and Bubu Jallow, WG 1 Vice Chair Nairobi, 6 February
Interannual Variations of Arctic Cloud Types:
 Interannual Variations of Arctic Cloud Types: Relationships with Sea Ice and Surface Temperature Ryan Eastman Stephen Warren University of Washington Department of Atmospheric Sciences Changes in Arctic
A Skeptical View of Anthropogenic Global Warming
 A Skeptical View of Anthropogenic Global Warming Having the courage to do Nothing For the Cambridge Society April 6, 2009 Friends of Science Society Ken Gregory Presented by: Peter Burns Runaway greenhouse
Current and future climate of the Cook Islands. Pacific-Australia Climate Change Science and Adaptation Planning Program
 Pacific-Australia Climate Change Science and Adaptation Planning Program Penrhyn Pukapuka Nassau Suwarrow Rakahanga Manihiki N o r t h e r n C o o k I s l a nds S o u t h e Palmerston r n C o o k I s l
Major climate change triggers
 Major climate change triggers Variations in solar output Milankovitch cycles Elevation & distribution of continents Ocean interactions Atmospheric composition change (CO 2 and other volcanic gasses) Biological
Climate change and its human impact on the Hudson Valley Region: past, present, and future
 Climate change and its human impact on the Hudson Valley Region: past, present, and future Introduction to Climate Change Dr. Roger Schmidt Retired IBM Fellow Manager, Advanced Thermal Energy Efficiency
Annual and seasonal air temperature and precipitation trends in the North of the Apuseni Mountains
 Annual and seasonal air temperature and precipitation trends in the North of the Apuseni Mountains Viorel Arghiuş, Liviu Muntean, Corina Arghiuş, Gheorghe Roşian, Radu Mihăiescu, Nicolae Baciu, Cristian
Hudson River Estuary Climate Change Lesson Project. Grades 5-8 Teacher s Packet. Lesson 9. New York Explores Sea Level Rise: A Field Based Activity
 Grades 5-8 Teacher s Packet Lesson 9 New York Explores Sea Level Rise: A Field Based Activity Teacher s Packet 2 New York Explores Sea Level Rise New York State Intermediate Level Science Standard 1: Analysis,
Benjamin P. Flower 1. Search and Discovery Article # (2009) Posted September 8, Abstract
 Posted September 8, Abstract") AV Relationships between CO 2 and Temperature in Glacial-Interglacial Transitions of the Past 800,000 Years* Benjamin P. Flower 1 Search and Discovery Article #110116 (2009) Posted September 8, 2009 *Adapted
AV Relationships between CO 2 and Temperature in Glacial-Interglacial Transitions of the Past 800,000 Years* Benjamin P. Flower 1 Search and Discovery Article #110116 (2009) Posted September 8, 2009 *Adapted
SHAPING OUR FUTURE: THE CLIMATE CHALLENGE KS3 LESSON 1 TEACHER GUIDE HOW IS OUR CLIMATE CHANGING?
 SHAPING OUR FUTURE: THE CLIMATE CHALLENGE KS3 LESSON 1 TEACHER GUIDE HOW IS OUR CLIMATE CHANGING? KS3 LESSON 1 TEACHER GUIDE HOW IS OUR CLIMATE CHANGING? Learning objective: To understand, through the
Ensemble mean of CMIP5 Sea Surface Temperature projections under climate change and their reference climatology
 Ensemble mean of CMIP5 Sea Surface Temperature projections under climate change and their reference climatology Bruno COMBAL 1, Albert FISCHER 2 1, 2 Intergovernmental Oceanographic Commission (IOC) of
Background. The Influence of Climate Change on Hurricanes. Further information on climate change and storms
 Background Already, this Atlantic hurricane season has seen devastation with Hurricane Harvey bringing extremely intense and prolonged rainfall and flooding to Texas and Louisiana. Analysis by MetStat
Training: Climate Change Scenarios for PEI. Training Session April Neil Comer Research Climatologist
 Training: Climate Change Scenarios for PEI Training Session April 16 2012 Neil Comer Research Climatologist Considerations: Which Models? Which Scenarios?? How do I get information for my location? Uncertainty
Will a warmer world change Queensland s rainfall?
 Will a warmer world change Queensland s rainfall? Nicholas P. Klingaman National Centre for Atmospheric Science-Climate Walker Institute for Climate System Research University of Reading The Walker-QCCCE
Global Climate Change - What evidence have scientists collected to support global climate change? Why? Model 1 Earth s Surface Temperatures.
 Name Blk Global Climate Change - What evidence have scientists collected to support global climate change? Obj/Module 63. Evidence of Global Warming Why? Global climate change is a topic that is frequently
Lower Stratospheric Cooling. and. Abrupt Change in Arctic Sea Ice
 Lower Stratospheric Cooling and Abrupt Change in Arctic Sea Ice Carl Drews March 16, 2007 ATOC 7500-002 Human Influences on Weather and Climate University of Colorado at Boulder Dr. Roger Pielke Sr, Instructor
The Projection of Temperature and Precipitation over Bangladesh under RCP Scenarios using CMIP5 Multi-Model Ensemble
 Paper ID: WRE-37 International Conference on Recent Innovation in Civil Engineering for Sustainable Development (IICSD-5) Department of Civil Engineering DUET - Gazipur, Bangladesh The Projection of Temperature
Graphing Sea Ice Extent in the Arctic and Antarctic
 Graphing Sea Ice Extent in the Arctic and Antarctic 1. Large amounts of ice form in some seasons in the oceans near the North Pole and the South Pole (the Arctic Ocean and the Southern Ocean). This ice,
Arctic Climate Change. Glen Lesins Department of Physics and Atmospheric Science Dalhousie University Create Summer School, Alliston, July 2013
 Arctic Climate Change Glen Lesins Department of Physics and Atmospheric Science Dalhousie University Create Summer School, Alliston, July 2013 When was this published? Observational Evidence for Arctic
Historical and Projected Future Climatic Trends in the Great Lakes Region
 Historical and Projected Future Climatic Trends in the Great Lakes Region Jeffrey A. Andresen Dept. of Geography, Environment, and Spatial Sciences Michigan State University Flooding along I-696 Warren,
Extreme Rainfall in the Southeast U.S.
 Extreme Rainfall in the Southeast U.S. David F. Zierden Florida State Climatologist Center for Ocean Atmospheric Prediction Studies The Florida State University March 7, 2016 Causes of Extreme Rainfall
STATE OF THE CLIMATE IN 2017
 STATE OF THE CLIMATE IN 2017 Today s Presenters Jeff Rosenfeld Editor-In-Chief, Bulletin of the American Meteorological Society Boston, MA Deke Arndt Chief, Monitoring Branch, NOAA s National Centers for
Chapter 14: The Changing Climate
 Chapter 14: The Changing Climate Detecting Climate Change Natural Causes of Climate Change Anthropogenic Causes of Climate Change Possible Consequences of Global Warming Climate Change? -Paleo studies
Agronomy 406 World Climates
 Agronomy 406 World Climates April 3, 2018 Causes of natural climate changes (finish). Schedule is being adjusted. No change to due dates. Bring IPCC Fifth Assessment Report Summary for Policymakers to
Outline: 1) Extremes were triggered by anomalous synoptic patterns 2) Cloud-Radiation-PWV positive feedback on 2007 low SIE
 Extremes were triggered by anomalous synoptic patterns 2) Cloud-Radiation-PWV positive feedback on 2007 low SIE") Identifying Dynamical Forcing and Cloud-Radiative Feedbacks Critical to the Formation of Extreme Arctic Sea-Ice Extent in the Summers of 2007 and 1996 Xiquan Dong University of North Dakota Outline: 1)
Identifying Dynamical Forcing and Cloud-Radiative Feedbacks Critical to the Formation of Extreme Arctic Sea-Ice Extent in the Summers of 2007 and 1996 Xiquan Dong University of North Dakota Outline: 1)
First-Order Draft Chapter 3 IPCC WG1 Fourth Assessment Report
 0 Figure... Estimates of linear trends in significant wave height (cm decade - ) for the regions along the major ship routes for the global ocean for the period 0 00. Trends are shown only for the locations
CLIMATE CHANGE IN ARCTIC AND ALPINE AREAS
 CLIMATE CHANGE IN ARCTIC AND ALPINE AREAS 1. Introduction 2. Data sources: glaciers 3. Data sources: ice cores 4. Patterns and mechanisms 5. Feedbacks and surprises Striations (evidence of glacial erosion)
3. Carbon Dioxide (CO 2 )
") 3. Carbon Dioxide (CO 2 ) Basic information on CO 2 with regard to environmental issues Carbon dioxide (CO 2 ) is a significant greenhouse gas that has strong absorption bands in the infrared region and
3. Carbon Dioxide (CO 2 ) Basic information on CO 2 with regard to environmental issues Carbon dioxide (CO 2 ) is a significant greenhouse gas that has strong absorption bands in the infrared region and
SPECIAL PROJECT FINAL REPORT
 SPECIAL PROJECT FINAL REPORT All the following mandatory information needs to be provided. Project Title: Modelling Interglacial Climate Computer Project Account: Spdklang Start Year - End Year : 2014
2013 ATLANTIC HURRICANE SEASON OUTLOOK. June RMS Cat Response
 2013 ATLANTIC HURRICANE SEASON OUTLOOK June 2013 - RMS Cat Response Season Outlook At the start of the 2013 Atlantic hurricane season, which officially runs from June 1 to November 30, seasonal forecasts
Projections of future climate change
 Projections of future climate change Matthew Collins 1,2 and Catherine A. Senior 2 1 Centre for Global Atmospheric Modelling, Department of Meteorology, University of Reading 2 Met Office Hadley Centre,
1.6 Correlation maps CHAPTER 1. DATA ANALYSIS 47
 CHAPTER 1. DATA ANALYSIS 47 1.6 Correlation maps Correlation analysis can be a very powerful tool to establish a statistical relationship between the two variables. Section 1.4 showed that a correlation
Brita Horlings
 Knut Christianson Brita Horlings brita2@uw.edu https://courses.washington.edu/ess431/ Natural Occurrences of Ice: Distribution and environmental factors of seasonal snow, sea ice, glaciers and permafrost
Watch for Week 8/9 Review Assessment
 Wednesday, October 25, 2017 Exam 2 results, key is posted on the main course website. Please check to make sure there are no errors in the scoring of the Scantron portion of the exam (note the scantron
RR#5 - Free Response
 Base your answers to questions 1 through 3 on the data table below and on your knowledge of Earth Science. The table shows the area, in million square kilometers, of the Arctic Ocean covered by ice from
Update on Climate Science. Professor Richard Betts, Met Office
 Update on Climate Science Professor Richard Betts, Met Office The science of climate change Crown copyright Met Office Prof Richard Betts Head of Climate Impacts Research Crown copyright Met Office Observing
Why Has the Land Memory Changed?
 3236 JOURNAL OF CLIMATE VOLUME 17 Why Has the Land Memory Changed? QI HU ANDSONG FENG Climate and Bio-Atmospheric Sciences Group, School of Natural Resource Sciences, University of Nebraska at Lincoln,
Paleoclimate: What can the past tell us about the present and future? Global Warming Science February 14, 2012 David McGee
 Paleoclimate: What can the past tell us about the present and future? 12.340 Global Warming Science February 14, 2012 David McGee 1 Recent observed trends: Greenhouse gases Image courtesy of NOAA. 2 Recent
The ocean s overall role in climate
 The ocean s overall role in climate - moderates climate in time (diurnally, annually) - redistributes heat spatially in the largescale ocean circulation - lower albedo (sea ice higher albedo) - dry atmosphere
2015: A YEAR IN REVIEW F.S. ANSLOW
 2015: A YEAR IN REVIEW F.S. ANSLOW 1 INTRODUCTION Recently, three of the major centres for global climate monitoring determined with high confidence that 2015 was the warmest year on record, globally.
Lecture 21: Glaciers and Paleoclimate Read: Chapter 15 Homework due Thursday Nov. 12. What we ll learn today:! Learning Objectives (LO)
") Learning Objectives (LO) Lecture 21: Glaciers and Paleoclimate Read: Chapter 15 Homework due Thursday Nov. 12 What we ll learn today:! 1. 1. Glaciers and where they occur! 2. 2. Compare depositional and
Learning Objectives (LO) Lecture 21: Glaciers and Paleoclimate Read: Chapter 15 Homework due Thursday Nov. 12 What we ll learn today:! 1. 1. Glaciers and where they occur! 2. 2. Compare depositional and
What Measures Can Be Taken To Improve The Understanding Of Observed Changes?
 What Measures Can Be Taken To Improve The Understanding Of Observed Changes? Convening Lead Author: Roger Pielke Sr. (Colorado State University) Lead Author: David Parker (U.K. Met Office) Lead Author:
Errata. Version 11/07/2014 1
 Version 11/7/214 1 Climate Change 213: The Physical Science Basis The Working Group I Contribution to the IPCC Fifth Assessment Report Page Item Correction ii Frontmatter Insert the following text: The
ATOC OUR CHANGING ENVIRONMENT Class 19 (Chp 6) Objectives of Today s Class: The Cryosphere [1] Components, time scales; [2] Seasonal snow
![ATOC OUR CHANGING ENVIRONMENT Class 19 (Chp 6) Objectives of Today s Class: The Cryosphere [1] Components, time scales; [2] Seasonal snow](/thumbs/95/126309683.jpg "ATOC OUR CHANGING ENVIRONMENT Class 19 (Chp 6) Objectives of Today s Class: The Cryosphere [1] Components, time scales; [2] Seasonal snow") ATOC 1060-002 OUR CHANGING ENVIRONMENT Class 19 (Chp 6) Objectives of Today s Class: The Cryosphere [1] Components, time scales; [2] Seasonal snow cover, permafrost, river and lake ice, ; [3]Glaciers and
ATOC 1060-002 OUR CHANGING ENVIRONMENT Class 19 (Chp 6) Objectives of Today s Class: The Cryosphere [1] Components, time scales; [2] Seasonal snow cover, permafrost, river and lake ice, ; [3]Glaciers and
A Survey of Climate Change since IPCC 4
 A Survey of Climate Change since IPCC 4 1. Introduction The 4 th IPCC (Intergovernmental Panel on Climate Change) Report was issued in 2007 and preparations are now in progress for the 5 th Report, which
CLIMATE SIMULATIONS AND PROJECTIONS OVER RUSSIA AND THE ADJACENT SEAS: а CMIP5 Update
 CLIMATE SIMULATIONS AND PROJECTIONS OVER RUSSIA AND THE ADJACENT SEAS: а CMIP5 Update Tatiana Pavlova and Vladimir Kattsov Voeikov Main Geophysical Observatory, St. Petersburg, Russia Workshop on Global
Climatic and Ecological Conditions in the Klamath Basin of Southern Oregon and Northern California: Projections for the Future
 Climatic and Ecological Conditions in the Klamath Basin of Southern Oregon and Northern California: Projections for the Future A Collaborative Effort by: CLIMATE LEADERSHIP INITIATIVE INSTITUTE FOR A SUSTAINABLE
Trends in Climate Teleconnections and Effects on the Midwest
 Trends in Climate Teleconnections and Effects on the Midwest Don Wuebbles Zachary Zobel Department of Atmospheric Sciences University of Illinois, Urbana November 11, 2015 Date Name of Meeting 1 Arctic
NOAA 2015 Updated Atlantic Hurricane Season Outlook
 NOAA 2015 Updated Atlantic Hurricane Season Outlook Dr. Gerry Bell Lead Seasonal Forecaster Climate Prediction Center/ NOAA/ NWS Collaboration With National Hurricane Center/ NOAA/ NWS Hurricane Research
An Analysis of the Evolution of Physical Processes Producing Daily Widespread Precipitation Extremes in Alaska using six CMIP5 GCMs
 Meteorology Senior Theses Undergraduate Theses and Capstone Projects 12-2016 An Analysis of the Evolution of Physical Processes Producing Daily Widespread Precipitation Extremes in Alaska using six CMIP5