Originally published as:
|
|
|
- Eustace King
- 6 years ago
- Views:
Transcription
1 Originally published as: Moreno, M. S., Bolte, J., Klotz, J., Melnick, D. (2009): Impact of megathrust geometry on inversion of coseismic slip from geodetic data: Application to the 1960 Chile earthquake. - Geophysical Research Letters, 36, L16310 DOI: /2009GL039276
2 Impact of megathrust geometry on inversion of coseismic slip from geodetic data: Application to the 1960 Chile earthquake M. S. Moreno, 1 J.Bolte, 2 J. Klotz, 1 and D. Melnick 3 1 Department of Geodesy and Remote Sensing, Helmholtz-Zentrum Potsdam, Germany 2 Zentrum für Astronomie und Astrophysik, Technische Universität Berlin, Germany 3 Institut für Geowissenschaften, Universität Potsdam, Germany 1
3 We analyze the role of megathrust geometry on slip estimation using the 1960 Chile earthquake (M W =9.5) as an example. A variable slip distribution for this earthquake has been derived by Barrientos and Ward [1990] applying an elastic dislocation model with a planar fault geometry. Their model shows slip patches at km depth, isolated from the seimogenic zone, interpreted as aseismic slip. We invert the same geodetic data set using a finite element model (FEM) with precise geometry derived from geophysical data. Isoparametric FEM is implemented to constrain the slip distribution of curve-shaped elements. Slip resolved by our precise geometry model is limited to the shallow region of the plate interface suggesting that the deep patches of moment were most likely an artifact of the planar geometry. Our study emphasizes the importance of fault geometry on slip estimation of large earthquakes. 2
4 1. Introduction Spatial and temporal distribution of slip along subduction zones provides primary information for understanding the earthquake process, and consequently to forecast the possible locus of future earthquakes. Inversions of geodetic data have been broadly used to infer coseismic slip on faults. It has been well recognized that inversion procedures may affect the slip distribution solution [Beresnev, 2003]. Incorrect assumptions about fault geometries [Lee et al., 2006], crustal structure [Savage, 1987; Masterlark, 2003], and smoothing constraints [Du et al., 1992] may significantly affect the predicted slip distribution. Moreover, the spatial heterogeneity of the model resolution may lead to artifacts in poorly resolved areas of the fault plane [Page et al., 2009]. Slip artifacts may appear as robust features and thus may be wrongly interpreted as seismic asperities. The great Chile earthquake of 22 May 1960 (M W =9.5) constitutes the largest recorded seismic event [Engdahl and Villaseñor, 2002]. The earthquake ruptured about 1000 km of the interface between the subducting Nazca plate and the South American continent (Figure 1). Coseismic data determined from relative sea-level changes, leveling lines, and triangulations [Plafker and Savage, 1970] indicated maximum uplift of 5 m in the outer shelf and subsidence of up to 2.7 m in the mainland. Barrientos and Ward [1990] used a dislocation model with planar slab geometry to invert the available geodetic data into a variable slip planar distribution (VSP model). Their results show a main body of slip along the shallow part of the megathrust with up to 41 m of displacement (Figure 2a). In addition, three patches appear isolated from the main body at km depth below 3
5 the volcanic arc. These deep patches were interpreted as aseismic slip at a depth of more than 40 km beneath the down-dip limits of the rupture. In recent years, the crustal structure of the south-central Chile margin has been derived from local seismological networks [Bohm et al., 2002; Haberland et al., 2006; Lange et al., 2007], deep seismic reflection and refraction profiles [Lüth et al., 2003; Groß et al., 2007], and forward modeling of the gravity field [Tassara et al., 2006; Tašárová, 2007]. The precise geometry of the slab obtained from combining these geophysical data sets differs notably from Barrientos and Ward s assumption of a planar slab; in the present image the dip angle has significant changes along the strike of the margin (Figure S1). In order to understand the deformation processes related to this event, we attempt to prove if these deep slip zones are needed to explain the data or if this feature may be an artifact of the inversion. We invert the geodetic data employed by Barrientos and Ward [1990] using a 3D finite element model (FEM) with precise fault geometry. The complex geometry leads to non-uniform distance of the nodes and non-rectangular elements on the fault. This requires the application of isoparametric finite elements with quadratic shape functions. 2. FEM inversion We constructed a 3D FEM that incorporates the precise geometry of the slab and continental Moho, as well as topography and bathymetry (Figure S2). To test the possible occurrence of deep slip, we used in our inversion the fault nodes localized above a depth of 240 km. This selection consisted of 773 pair of nodes. Only thrust slip components were considered based on seismological [Cifuentes and Silver, 1989; Kanamori and Cipar, 4
6 1974] and geodetic [Plafker and Savage, 1970] studies, which have suggested that the earthquake mechanism was almost entirely dip-slip. Details of the model design can be found in the Auxiliary Material. The relation between surface deformation and slip along the fault is expressed by the linear system: Gx = d, (1) where G is the synthetic Green s function matrix, x is the unknown slip vector and d is the surface observation vector. The matrix G integrates geometry, material properties and meshing of the FEM model, constructed following the technique of Masterlark [2003]. In doing so, a forward model runs as many times as the number of nodes on the fault. In each run a unity dislocation is applied to a pair of nodes and null dislocation for all other nodes on the fault. Constraints that minimize the differences between neighboring nodes and weight the observations [Wald and Heaton, 1994] are added to the system of equations: ( w 1 G λs ) ( ) x w 1 d =. (2) 0 Here, S is the matrix of smoothing constraints, λ is the linear smoothing coefficient and w is the diagonal matrix, which normalizes and weights the data. We applied isoparametric finite elements with quadratic shape functions to construct the matrix S. The constraint matrix is the stiffness matrix for the 2D Laplace problem, which forms the linear system of equations in a finite element analysis (See Auxiliary Material for details). 5
7 The MATLAB routine lsqlin, a subspace trust-region method based on the interiorreflective Newton method described in Coleman and Li [1996], was used to solve the inversion. Minimum and maximum slip constraints were applied to avoid models with unreasonable slip patterns and to improve the model resolution [Du et al., 1992; Harris and Segall, 1987]. No additional constraints were imposed at the upper, lower, and lateral fault borders. The smoothing parameter was estimated from the trade-off curve between misfit and slip roughness. The selected value is obtained in the inflection of the curve and gives an optimal balance between data fit and model roughness [Du et al., 1992; Bürgmann et al., 2005]. To calculate a geodetic moment, we introduced the effective shear modulus [Wu and Chen, 2003]. Error propagation from the data to the model is described in the Auxiliary Material. We inverted the geodetic data compiled by Plafker and Savage [1970], which were used by Barrientos and Ward [1990] (Figure 1). The data consist of: 1) Vertical displacements of 166 sites along the coast, observed in These observations may include postseismic effects, although Plafker and Savage reported that their data are consistent with about 20 measurements obtained shortly after the earthquake. 2) Inland elevation differences obtained from a leveling line surveyed in and Unfortunately, the original data are not available, therefore we digitalized the leveling line from Plafker and Savage [1970] in the form of 150 points. 3) Surface shear strain of eight sites calculated from the angle changes along a triangulation arc, observed in and
8 In order to gain insight into the influence of megathrust geometry on slip inversion, we constructed a second FEM using a planar fault that replicates the parameters of the VSP model (Figure S2b). 3. Results Inversion of synthetically generated data indicates that our curved fault model successfully recover slip above 150 km depth (Figure S3). Inversions over a wide range of λ values were performed to obtain a trade-off curve (Figure S4a). The optimal value for the smoothing coefficient was found at the inflection point of the curve, λ = This inflection was also observed in the curve of λ versus earthquake magnitude (Figure S4b). The preferred slip distribution produced a geodetic moment of 9.64 ± N m, equivalent to a moment magnitude of 9.26 ± The model fits the vertical data with a root mean square (RMS) of 0.63 m. Independent of the degree of smoothing chosen, the resolved slip consists of a compact but heterogeneous slip body located exclusively under the continental slope, shelf, and Coastal Range (Figure S5). The earthquake moment of the preferred slip model (Figure 2b) is mainly released along the northern segment of the fault (38-42 S). In this region, the rupture propagated to the trench and its down-dip limit reached to a depth of 55 km. Contrastingly, in the southern segment of the rupture (42-46 S) slip propagation stopped before the trench and its down-dip limit progressively shallowed to a depth of 30 km. The slip magnitude increased from 20 m in the hypocentral area to a peak of 44 m at 40.5 S. Farther south the dislocation gradually decreased to 10 m at S 7
9 exhibiting a southernmost peak of 32 m at 44.7 S. No slip appears deeper than 55 km along the entire rupture zone. The slip distribution resulted from the FEM with a planar fault (Figure 2c) generates a geodetic moment of 9.72 ± N m, equivalent to an earthquake magnitude of 9.26 ± Vertical observations are simulated with a RMS of 0.78 m, which is 24% higher than the RMS obtained from the precise geometry model. The spatial distribution of the slip shows a main body parallel to the coast and three patches of deep slip isolated from the main body at km depth below the volcanic arc. The main slip body is similar in magnitude and shape to the VSP model (Figure 2a). The deep patches of slip are comparable in magnitude to the isolated patches of the VSP model, but not equally distributed. These differences may arise from the inversion methodologies; Barrientos and Ward [1990] have solved an ill-posed inverse problem using an iterative gradient technique. Conversely, we have introduced constraints to restore the well-posed character of the solution. Surface vertical displacements and horizontal strains predicted by the model with precise geometry are shown in Figure 3 together with the geodetic data. The synthetic vertical changes are well correlated in magnitude with most of the observations except for a few isolated points located east of the main rupture in the southernmost region (Figure S7 and S8). These sites show anomalous uplift, not reproduced by the coseismic simulation. On average, the entire continental shelf was uplifted over 2 m. The largest predicted vertical deformation is located at the northern segment of the rupture, with maximum uplift and subsidence of 8.3 m and 2.5 m, respectively. 8
10 4. Discussion Our FEM modeling has shown that patterns of coseismic slip differ significantly between models with precise and simplified geometries (Figure 2). The precise 3D FEM model shows slip exclusively along the seismogenic zone, as expected by the thermal control on the seismic behavior of the megathrust [Hyndman and Wang, 1995]. In turn, isolated patches of slip at km depth, below the volcanic arc, result only from the planar models. Coseismic frictional slip in this deep and hot sector of the plate interface is not expected to be triggered by a shallow megathrust earthquake, as continuous viscous flow is expected to dominate [Bürgmann and Dresen, 2008]. Thus, we suggest that the patches of deep slip are artifacts of the inversion arising from the simplified, planar slab geometry. The slip distribution of the precise 3D FEM model is similar to the main body of slip derived from the VSP model, but provides detailed information about the rupture distribution. The fault dislocation is spatially distributed into adjacent asperities, releasing most of the earthquake moment along the northern part and southern edge of the fault (Figure 2b). A slip patch of over 20 m in the hypocentral area and an asperity with slip of more than 25 m at 41.5 S are observed in our results, but not predicted by the VSP model. These patches of higher slip may represent long-term asperities controlled by the inherited geological structure of the margin and heterogeneous density distribution [Wells et al., 2003; Song and Simons, 2003]. Our proposed slip distribution of the 1960 Chile earthquake indicates that the rupture zone narrowed southward. This is likely a result of the gradual variation in age of the 9
11 incoming plate along the trench. The slab age decreases southward resulting in an increase in heat-flow, and consequently a narrower seismogenic zone [Hyndman and Wang, 1995]. Stress perturbation on the continental mantle induced by this earthquake has produced a prolonged postseismic viscoelastic deformation distributed over a broad region [Khazaradze et al., 2002; Hu et al., 2004]. The anomalous uplift localized on the south-eastern sector of the rupture may result from this postseimic deformation and/or from afterslip. Alternatively, shallow faults in the overriding plate may have been triggered by the megathrust earthquake producing localized uplift [Moreno et al., 2008; Melnick et al., 2009]. Most inversion studies have adopted simple planar faults or several planar segments to simulate a complex curved fault. Two main reasons may justify this assumption: (1) to avoid the problems of the bending of the fault, e.g. singular buildup of stress, curve-shaped elements, and non-orthogonal array of nodes, and (2) to reduce the computational costs needed for a high-resolution fault geometry. Oglesby and Archuleta [2003] investigated the dynamics of a non-planar fault (two planar segments). They affirmed that dip changes at depth do not affect the predicted fault slip. Konca et al. [2008] suggested that the derived slip is not affected by introducing a curved fault. In contrast, Lee et al. [2006] and [Maerten et al., 2005] introduced a 3D curved fault surface and showed that inversions with simple fault models may lead to inconsistencies and artificial slip distributions. Our study reveals that the slip inversion is very sensitive to the fault geometry, especially in zones outside the observation network. Errors in the fault geometry assumption are nonlinear and may change the slip distribution significantly. By incorporating precise fault 10
12 geometry, the Green s function better represents the fault system, resulting in a more robust and thus realistic slip distribution. 5. Conclusions Our slip distribution of the 1960 Chile earthquake indicates that most if not all of the moment was released exclusively along the shallow part of the plate interface. We suggest that the patches of deep slip found by Barrientos and Ward [1990] interpreted as aseismic slip are likely an artifact of their simplified, planar fault geometry. The calculated geodetic moment is 9.64 ± N m, which is about 1/5 of the seismic moment obtained for this earthquake [Engdahl and Villaseñor, 2002]. This finding confirms a deficit of the geodetic moment originally reported by Barrientos and Ward [1990]. A stable solution that fits geodetic data to a high degree does not necessarily represent the correct earthquake slip distribution. Our isoparametric FEM confines the slip distribution on complex fault geometries removing artifacts in poorly resolved areas. The flexibility of our method permits the extension to interseismic and postseismic surface deformation scenarios, and to different tectonic settings. Acknowledgments. Our special thanks go to: Jessica Papke, Klaus Bataille, Matt Miller and Dietrich Lange for fruitful comments and discussions. We also appreciate the valuable comments and suggestions of two anonymous reviewers. Marcos Moreno gratefully acknowledges a scholarship granted by the German Academic Exchange Service (DAAD). 11
13 References Barrientos, S., and S. Ward (1990), The 1960 Chile earthquake: inversion for slip distribution from surface deformation, Geophys. J. Int., 103 (3), Beresnev, I. (2003), Uncertainties in finite-fault slip inversions: To what extent to believe? (A critical review), Bull. Seism. Soc. Am., 93 (6), , doi: / Bohm, M., S. Lüth, H. Echtler, G. Asch, K. Bataille, C. Bruhn, A. Rietbrock, and P. Wigger (2002), The Southern Andes between 36 S and 40 S latitude: seismicity and average velocities, Tectonophysics, 356, Bürgmann, R., and G. Dresen (2008), Rheology of the lower crust and upper mantle: Evidence from rock mechanics, geodesy, and field observations, Annual Review Earth Planet. Sci., 36 (1), , doi: /annurev.earth Bürgmann, R., M. Kogan, G. Steblov, G. Hilley, V. Levin, and E. Apel (2005), Interseismic coupling and asperity distribution along the Kamchatka subduction zone, J. Geophys. Res., 110 (B07405), 1 17, doi: /2005jb Cifuentes, I. L., and P. G. Silver (1989), Low-frequency source characteristics of the great 1960 Chilean earthquake, J. Geophys. Res., 94 (B1), Coleman, T., and Y. Li (1996), A reflective newton method for minimizing a quadratic function subject to bounds on some of the variables, SIAM J. Optim., 6 (4), Du, Y., A. Aydin, and P. Segall (1992), Comparison of various inversion techniques as applied to the determination of a geophysical deformation model for the 1983 Borah Peak earthquake, Bull. Seism. Soc. Am., 82 (4),
14 Engdahl, E., and A. Villaseñor (2002), Global Seismicity: , in Int. Handb. Earthquake Eng. Seismol., edited by W. L. et al., pp , Academic Press, Amsterdam. Groß, K., U. Micksch, and T. R. Group (2007), The reflection seismic survey of project TIPTEQ-the inventory of the Chilean subduction zone at 38.2 S, Geophys. J. Int., 172 (2), , doi: /j x x. Haberland, C., A. Rietbrock, D. Lange, K. Bataille, and S. Hofmann (2006), Interaction between forearc and oceanic plate at the south-central Chilean margin as seen in local seismic data, Geophys. Res. Lett., 33, L23302, doi: /2006gl Harris, R., and P. Segall (1987), Detection of a locked zone at depth on the Parkfield, California, segment of the San Andreas Fault, J. Geophys. Res., 92, Hu, Y., K. Wang, J. He, J. Klotz, and G. Khazaradze (2004), Three-dimensional viscoelastic finite element model for postseismic deformation of the great 1960 Chile earthquake, Geophys. Res. Lett., 109 (12), Hyndman, R., and K. Wang (1995), The rupture zone of Cascadia great earthquakes from current deformation and the thermal regime, J. Geophys. Res., 100, 22,133 22,154. Kanamori, H., and J. Cipar (1974), Focal process of the great Chilean earthquake May 22, 1960, Phys. Earth Planet. Inter., 9, Khazaradze, G., K. Wang, J. Klotz, Y. Hu, and J. He (2002), Prolonged post-seismic deformation of the 1960 great Chile earthquake and implications for mantle rheology, Geophys. Res. Lett., 29 (22), 7 1. Konca, A., J. Avouac, A. Sladen, A. Meltzner, K. Sieh, P. Fang, Z. Li, J. Galetzka, J. Genrich, M. Chlieh, D. Natawidjaja, Y. Bock, E. Fielding, C. Ji, and D. Helmberger 13
15 (2008), Partial rupture of a locked patch of the Sumatra megathrust during the 2007 earthquake sequence, Nature, 456 (7222), Lange, D., A. Rietbrock, C. Haberland, K. Bataille, T. Dahm, F. Tilmann, and E. R. Flueh (2007), Seismicity and geometry of the south Chilean subduction zone (41.5 S S): Implications for controlling parameters, Geophys. Res. Lett., 34, L06311, doi: /2006GL Lee, S.-H., K.-F. Ma, and H.-W. Chen (2006), Effects of fault geometry and slip style on near-fault static displacements caused by the 1999 Chi-Chi, Taiwan earthquake, Earth Planet. Sci. Lett., 241 (1-2), , doi: /j.epsl Lüth, S., P. Wigger, M. Araneda, G. Asch, K. Bataille, M. Bohm, C. Bruhn, P. Giese, S. Lüth, J. Quezada, A. Rietbrock, and P. Wigger (2003), A crustal model along 39 S from a seismic refraction profile-issa 2000, Rev. Geol. Chile, 30 (1), Maerten, F., P. Resor, D. Pollard, and L. Maerten (2005), Inverting for Slip on Three- Dimensional Fault Surfaces Using Angular Dislocations, Bull. Seism. Soc. Am., 95 (5), , doi: / Masterlark, T. (2003), Finite element model predictions of static deformation from dislocation sources in a subduction zone: Sensitivities to homogeneous, isotropic, Poisson-solid, and half-space assumptions, J. Geophys. Res., 108 (B11), doi: /2002jb Melnick, D., B. Bookhagen, M. Strecker, and H. Echtler (2009), Segmentation of subduction earthquake rupture zones from forearc deformation patterns over hundreds to millions of years, Arauco Peninsula, Chile, J. Geophys. Res., 114, doi: /2008JB
16 Moreno, M. S., J. Klotz, D. Melnick, H. Echtler, and K. Bataille (2008), Active faulting and heterogeneous deformation across a megathrust segment boundary from GPS data, south central chile (36-39 S), Geochem. Geophys. Geosyst., 9, doi: /2008GC Oglesby, D., and R. Archuleta (2003), The Three-Dimensional Dynamics of a Nonplanar Thrust Fault, Bull. Seism. Soc. Am., 93 (5), , doi: / Page, M., S. Custódio, R. Archuleta, and J. Carlson (2009), Constraining earthquake source inversions with GPS data: 1. Resolution-based removal of artifacts, J. Geophys. Res., 114 (B01314), doi: /2007jb Plafker, G., and J. Savage (1970), Mechanism of the Chilean earthquake of May 21 and 22, 1960, Geol. Soc. Am. Bull., 81, Savage, J. C. (1987), Effect of crustal layering upon dislocation modeling, J. Geophys. Res., 92 (B10), 10,595 10,600. Song, T. R. A., and M. Simons (2003), Large trench-parallel gravity variations predict seismogenic behavior in subduction zones, Science, 301 (5633), Tassara, A., H. Götze, S. Schmidt, and R. Hackney (2006), Three-dimensional density model of the Nazca plate and the Andean continental margin, J. Geophys. Res., 111, B09404, doi: /2005jb Tašárová, Z. (2007), Towards understanding the lithospheric structure of the southern Chilean subduction zone (36 S-42 S) and its role in the gravity field, Geophys. J. Int., doi: /j x x. 15
17 Wald, D., and T. Heaton (1994), Spatial and temporal distribution of slip for the 1992 Landers, California, earthquake, Bull. Seism. Soc. Am., 84 (3), Wells, R., R. Blakely, Y. Sugiyama, D. Scholl, and P. Dinterman (2003), Basin-centered asperities in great subduction zone earthquakes: A link between slip, subsidence, and subduction erosion?, J. Geophys. Res., 108 (B10), 1 16, doi: /2002jb Wu, Z., and Y. Chen (2003), Definition of sesimic moment at a discontinuity interface, Bull. Seism. Soc. Am., 93 (4),


18 -38 Coastal Range Nazca Plate 66 mm/yr Continental shelf South American Plate Chile Rise 100 km Earthquake Hypocenter Uplift Stable Subsidence Leveling line Shear strain 30 µstrain Volcano Figure 1. Tectonic setting of the south-central Chile margin. Red dotted line indicates approximately the rupture zone of the 1960 Chile earthquake. Geodetic data used in the slip inversion are shown [Plafker and Savage, 1970].

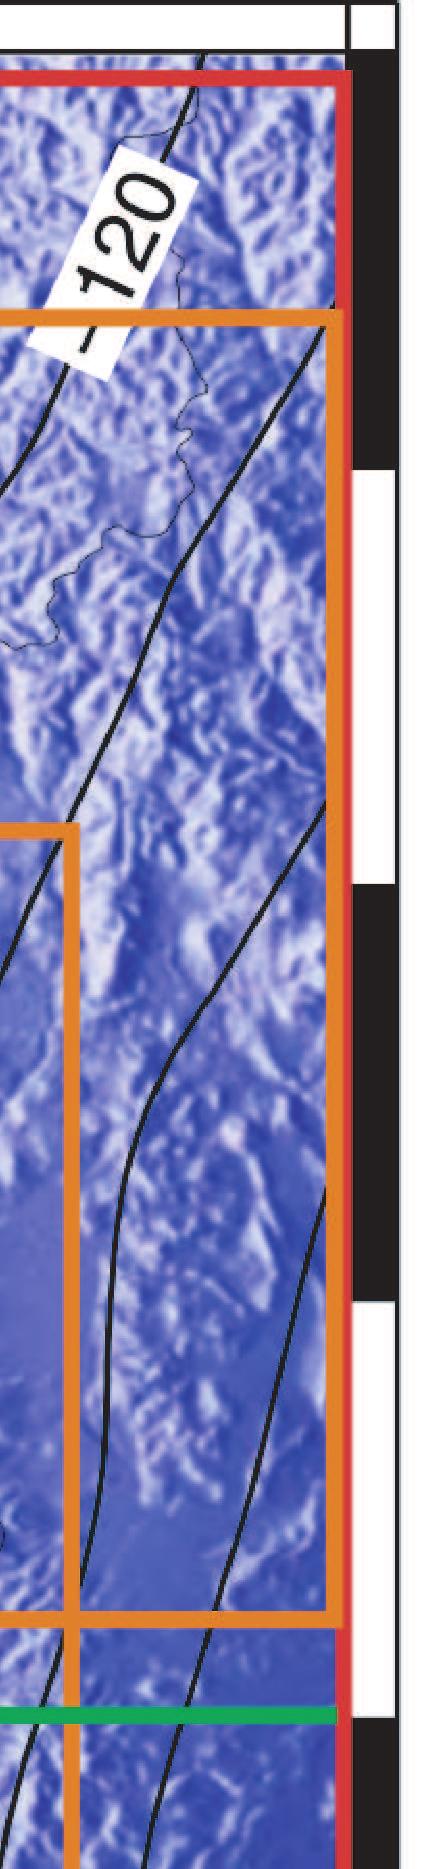
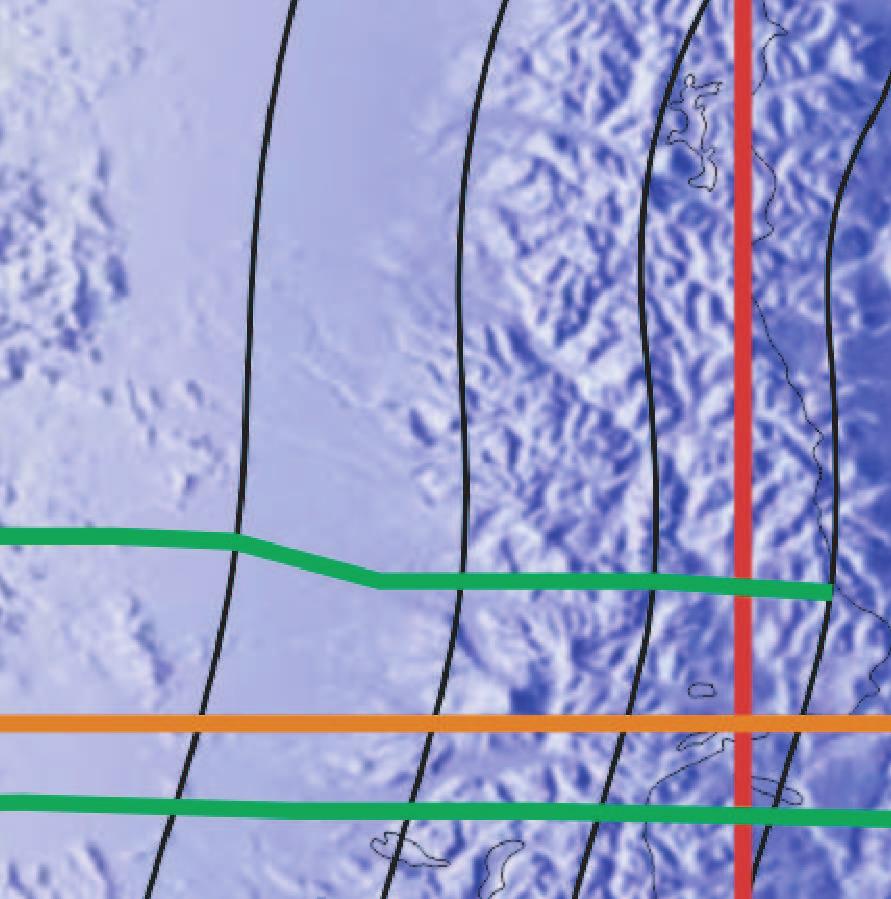
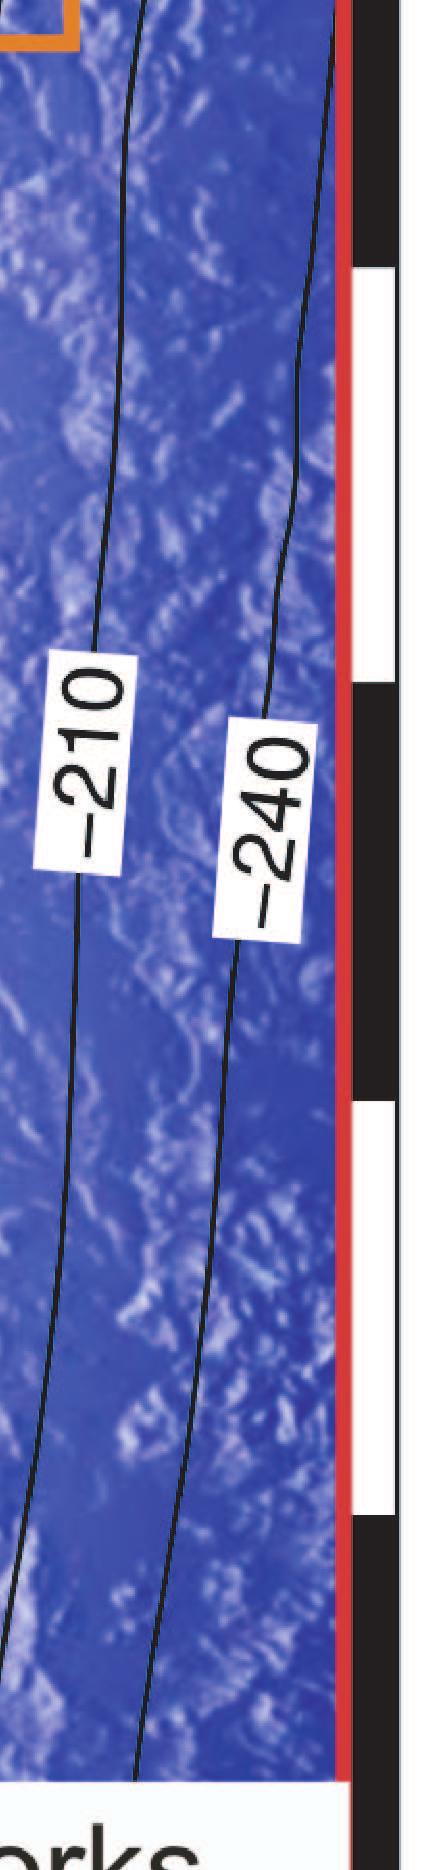
![a) Slip predicted by the VSP model of Barrientos and Ward [1990].](/docs-images/73/68392442/images/19-1.jpg "b) Slip predicted by the precise 3D FEM model.")
19 a) Fault slip (m) b) Fault slip (m) c) Fault slip (m) 2 2 Figure 2. Slip distributions of the 1960 event depicted by contour lines every 5 m. a) Slip predicted by the VSP model of Barrientos and Ward [1990]. b) Slip predicted by the precise 3D FEM model. c) Slip predicted by the FEM model with a planar fault.


20 Vertical displacement (m) A B C D F E G H Uplift Stable Subsidence Leveling line Shear strain Observed Synthetic 30 µstrain Figure 3. Coseismic surface deformation predicted by the precise 3D FEM model and geodetic observations are colored by the vertical displacements.
21 Impact of megathrust geometry on inversion of coseismic slip from geodetic data: Application to the 1960 Chile earthquake M. S. Moreno 1 J.Bolte, 2 J. Klotz, 1 and D. Melnick, 3 Auxiliary Material Introduction Supplementary material for this article contains a model set up description, a model resolution test, description of the smoothing constraints, Gaussian error propagation from the data to the model, and Figures S1-S8. 1 Helmholtz-Zentrum Potsdam, Germany 2 Zentrum für Astronomie und Astrophysik, Technische Universität Berlin, Germany 3 Institut für Geowissenschaften, Universität Potsdam, Germany 1
22 1. Model set up All the FEM calculations were done using the ANSYS R Academic Research, v software. The surface deformation was predicted kinematically from fault-slip regardless of the loading mechanism and friction properties. Fault-slip was implemented using the split-node technique [Melosh and Raefsky, 1981] applying linear constraint equations. This method allows to introduce fault displacements into FEM simulating the double-couple acting on the fault. After applying the constraint equation, nodes at both sides of the fault are equally displaced but in opposite directions. Nodes are forced to remain on the fault and consequently can only slide along the interface. The upper surface of the model was assumed to be stress-free allowing freely deformation, whereas lateral and base boundaries were fixed from orthogonal displacements. A 3D-spherical FEM incorporated topography and bathymetry [Smith and Sandwell, 1997], as well a precise geometry of the slab and continental Moho, which were derived from combining local seismological networks[bohm et al., 2002; Haberland et al., 2006; Lange et al., 2007], seismic reflection and refraction profiles [Lüth et al., 2003; Groß et al., 2007], and forward models of the gravity field [Tassara et al., 2006; Tašárová, 2007] (Figure S1). Our model structure extents from W to S and to a depth of 500 km. The deformation in our study area varies insignificantly by expanding the lateral and bottom boundaries of the mesh. Therefore, the study area is most likely far enough from the boundary constraint effects. The fault plane is a deformable contact surface consisting of eight-node elements, whereas the rest of the mesh is composed of 10-node tetrahedral- 2
23 shaped elements. These are quadratic elements with mid-side nodes that follow curved geometric boundaries, well suited to model irregular meshes. The element size is between 10 and 20 km near the fault zone, and 25 km in the rest of the upper crust, whereas in the oceanic crust and mantle it is 30 and 50 km, respectively. The node spacing is 5 km in the upper surface. Our FEM consists of an elastic upper plate, an elastic subducting plate, a viscoelastic continental mantle, and a viscoelastic oceanic mantle (Figure S2). Though coseismic static slip is independent of viscoelasticity, we have designed a model that can be used to model different phases of the seismic cycle. The thickness of the elastic oceanic plate was set to 30 km [Watt and Zhong, 2000], while the bottom limit of the elastic upper plate was defined by the continental Moho (Figure S2). The modeled continental crust is on average km thick, with local extremes of km (maximum), and 25 km (minimum). We specified a Young s modulus of 100, 120 and 160 GPa, for the continental, oceanic, and mantle layers, respectively, following Hu et al. [2004] and Moreno et al. [2008]. The Poisson s ratio was set to and 0.30 for continental, and oceanic crust, respectively [Christensen, 1996]. The viscosity was set to and Pa s for the continental and oceanic mantle, respectively [Hu et al., 2004]. Density values of 2700 and 3300 kg/m 3 were used for the continental and oceanic layers, respectively. 2. Model resolution We tested the resolving power of the geodetic network and our inversion method by attempting to recover an assumed slip distribution between km depth. Synthetically generated fault-slip patterns that mimic the deep slip zones obtained by Barrientos and Ward [1990] (Figure S3a) were used to calculate vertical and horizontal displacements at 3
24 the geodetic sites. Observation uncertainties were added to the surface displacements to make a set of synthetic data. Subsequently, we inverted for the distribution of slip using separately both vertical and horizontal displacements. The test results indicate that the corresponding best-fitting models (Figure S3 b-c ) closely recover the location, geometry, magnitude and gradient amplitude of the synthetic slip patches. The models based on vertical and horizontal data fit the synthetic displacements with a RMS of 1.61 and 1.50 m, respectively. Dislocation resolution is poorest in both models at depths greater that 150 km and improves directly beneath the geodetic network. We conclude that our curved fault model is able to recover slip above 150 km depth. Furthermore, lower amount of horizontal than vertical data may not affect the distribution of slip at depth. 3. Smoothing Constraints The complex geometry leads to non-uniform distance of the nodes and non-rectangular elements on the fault. This requires the application of isoparametric finite elements with quadratic shape functions to construct the matrix of smoothing constraints, S. This method makes use of curved quadrilaterals with parabolic boundaries. This approach allows for a quadratic displacement field in every curved quadrilateral with inter-element continuity. The matrix S is the stiffness matrix for the 2D Laplace problem which forms the linear system of equations in a finite element analysis. With T the domain of the fault, T T the finite element domains with curved boundaries, and N the set of the nodes on the fault, the matrix S of the smoothing constraints is given by Bartels et al. [2006] as: ( ) S = (S z,z ) z,z N = N z N z dx Ω 4 z,z N. (1)
25 Where N z T = { ϕ j Φ 1 T if z T, 0 if s T (2) is the isoparametric quadratic shape function for the node z and ϕ 1 (ξ, η) = (1 ξ) (1 η)/4, ϕ 2 (ξ, η) = (1 + ξ) (1 η)/4, ϕ 3 (ξ, η) = (1 + ξ) (1 + η)/4, ϕ 4 (ξ, η) = (1 ξ) (1 + η)/4, if z one of the four corner nodes or ϕ 5 (ξ, η) = (1 ξ 2 ) (1 η)/2, ϕ 6 (ξ, η) = (1 + ξ) (1 η 2 )/2, ϕ 7 (ξ, η) = (1 ξ 2 ) (1 + η)/2, ϕ 8 (ξ, η) = (1 ξ) (1 η 2 )/2 if z one of the four midpoints of the line segments connecting the corner nodes. The diffeomorphismus Φ T maps the curved quadrilateral T into the reference quadrilateral Q ref = [ 1, 1] Gaussian error propagation To calculate the uncertainties of the slip and earthquake magnitude, we compute the propagation of errors as follows: For j = 1,..., m we calculate ɛ (j) as the lsqlin (MATLAB function) solution of ( ) w 1 G ɛ λs (j) = where e (j) is the canonical unit vector with e (j) i ( w 1 e (j) 0 ), (3) = δ i,j and δ i,j the Kronecker delta. 5
26 Let us now define (ɛ (j) 1 ) 2 y (j) = ( d j ) 2 (ɛ (j) 2 ) 2.. (4) (ɛ (j) n ) 2 For the uncertainties of the slip x k, k = 1,..., n; we have x k = y (1) k + y (2) k + + y (m) k. (5) If we call u l, l = 1,..., L the average slip in the element l, i.e. ( )/ u l = x k (no. of nodes in element l), (6) k node in element l then there holds for the uncertainty of the average slip / u l = ( x k ) 2 (no. of nodes in element l), (7) k node in element l and for the uncertainty of the magnitude M = µ L (A l ) 2 ( u l ) 2, (8) where µ is the effective shear modulus [Wu and Chen, 2003]. The resulting fault-slip errors mapped on the fault plane are shown in Figure S6. l=1 References Barrientos, S., and S. Ward (1990), The 1960 Chile earthquake: inversion for slip distribution from surface deformation, Geophys. J. Int., 103 (3), Bartels, S., C. Carstensen, and A. Hecht (2006), P2Q2Iso2D=2D Isoparametric FEM in Matlab, J. Comput. Appl. Math., 192 (2),
27 Bohm, M., S. Lüth, H. Echtler, G. Asch, K. Bataille, C. Bruhn, A. Rietbrock, and P. Wigger (2002), The Southern Andes between 36 S and 40 S latitude: seismicity and average velocities, Tectonophysics, 356, Christensen, N. (1996), Poisson s ratio and crustal seismology, J. Geophys. Res., 101, Groß, K., U. Micksch, and T. R. Group (2007), The reflection seismic survey of project TIPTEQ-the inventory of the Chilean subduction zone at 38.2 S, Geophys. J. Int., 172 (2), , doi: /j x x. Haberland, C., A. Rietbrock, D. Lange, K. Bataille, and S. Hofmann (2006), Interaction between forearc and oceanic plate at the south-central Chilean margin as seen in local seismic data, Geophys. Res. Lett., 33, L23302, doi: /2006gl Hu, Y., K. Wang, J. He, J. Klotz, and G. Khazaradze (2004), Three-dimensional viscoelastic finite element model for postseismic deformation of the great 1960 Chile earthquake, Geophys. Res. Lett., 109 (12), Lange, D., A. Rietbrock, C. Haberland, K. Bataille, T. Dahm, F. Tilmann, and E. R. Flueh (2007), Seismicity and geometry of the south Chilean subduction zone (41.5 S S): Implications for controlling parameters, Geophys. Res. Lett., 34, L06311, doi: /2006GL Lüth, S., P. Wigger, M. Araneda, G. Asch, K. Bataille, M. Bohm, C. Bruhn, P. Giese, S. Lüth, J. Quezada, A. Rietbrock, and P. Wigger (2003), A crustal model along 39 S from a seismic refraction profile-issa 2000, Rev. Geol. Chile, 30 (1),
28 Melosh, H. J., and A. Raefsky (1981), A simple and efficient method for introducing faults into finite element computations, Bull. Seismol. Soc. Am., 71 (5), Moreno, M. S., J. Klotz, D. Melnick, H. Echtler, and K. Bataille (2008), Active faulting and heterogeneous deformation across a megathrust segment boundary from GPS data, south central chile (36-39 S), Geochem. Geophys. Geosyst., 9, doi: /2008GC Smith, W. H. F., and D. Sandwell (1997), Global Sea Floor Topography from Satellite Altimetry and Ship Depth Soundings, Science, 277 (5334), , doi: /science Tassara, A., H. Götze, S. Schmidt, and R. Hackney (2006), Three-dimensional density model of the Nazca plate and the Andean continental margin, J. Geophys. Res., 111, B09404, doi: /2005jb Tašárová, Z. (2007), Towards understanding the lithospheric structure of the southern Chilean subduction zone (36 S-42 S) and its role in the gravity field, Geophys. J. Int., doi: /j x x. Watt, A., and S. Zhong (2000), Observations of flexure and the rheology of oceanic lithosphere, Geophys. J. Int., (142), Wu, Z., and Y. Chen (2003), Definition of sesimic moment at a discontinuity interface, Bull. Seism. Soc. Am., 93 (4),
29 Figure captions Figure S1. Geophysical data used to construct the 3D geometry of the south-central Chile margin. Contour lines indicate the depth of the upper surface of the slab. Figure S2. a) Geometry of the south-central Chile margin incorporated in our precise 3D FEM model. b) Planar fault geometry that replicated fault parameters of the VSP model and incorporated in our planar fault model. c) 3-D finite element model configuration. Figure S3. Resolution ability of the network and inversion method to recover synthetically introduced slip patches at km depth. a) Initial synthetic fault-slip patterns that mimic the deep slip patches found bybarrientos and Ward [1990]. b) Result from inverting the network vertical velocities due to the synthetic fault-slip pattern. c) Result from inverting the network horizontal velocities due to the synthetic fault-slip pattern. d-e) Tradeoff curves between the roughness and misfit of the slip distribution for the models that use vertical (d) and horizontal (e) data. Figure S4. a) Tradeoff curve between model roughness and misfit of the slip distribution for a broad range of smoothing coefficient (λ). The misfit is expressed by the residual norm ( d (d Gx) 2 ). The optimal value for λ is located on the center of the bend of the curve. b) Residual norm as a function of λ (green curve) and earthquake magnitude as a function of λ (blue curve). Figure S5. Distributed slip model using alternative smoothing coefficients, λ, ranging from oversmoothed (a-b) to undersmoothed (d-f). Optimal model found from a tradeoff curve (Figure S4) is shown in c. 9
30 Figure S6. Fault-slip errors mapped on the fault plane. Black contour lines indicate the slip distribution error every 1 m. Estimated coseismic slip is depicted by orange contour lines every 20 m. Figure S7. Margin normal profiles showing observed (blue dots) and synthetic (red lines) vertical displacements. Below is plotted the slab geometry from the curved (red lines), and planar models (green lines). Figure S8. Margin parallel profile showing the vertical displacements of the leveling line (blue line) and the synthetic vertical displacements (red line). 10


31 Figure S1 11

 Oceanic Mantle η= 1 10 20 E=160 GPa v=0.")
32 Trench a) Topography b) Slab-Moho Interception 1800 km Trench 120 km Continental Moho Slab E=120 GPa v= km Upper Slab surface Continental crust E=100 GPa v=0.265 c) Oceanic Mantle η= E=160 GPa v=0.25 Continental Mantle η= E=160 GPa v=0.25 Figure S2 12

33 a) b) c) Fault slip (m) Slip (m) Slip (m) e-3 1e-3 d) e) 1000 Residual norm λ=0.75e-4 Residual norm 600 λ=1e e-6 5e Roughness Roughness Initial model Vertical data Horizontal data Fault node Observation site Fault node Observation site Fault node Observation site Figure S3 13
34 a) λ=7.5e-06 b) Roughness of estimated slip λ=7.5e-06 Magnitude Smoothing coefficient λ Figure S4 14
 e) f) Fault slip (m) Fault slip (m) Fault slip (m) λ=5e-6 Fault node λ=3e-6 Fault node λ=1e-6")
35 a) b) c) Fault slip (m) Fault slip (m) Fault slip (m) λ=2.5e-5 Fault node λ=1e-5 Fault node λ=7.5e-6 Fault node d) e) f) Fault slip (m) Fault slip (m) Fault slip (m) λ=5e-6 Fault node λ=3e-6 Fault node λ=1e-6 Fault node Figure S5 15

36 Slip error (m) Fault node Figure S6 16
37 Profile 40 S Syn. Up (m) Obs. Depth (km) Planar slab Curve slab Depth (km) Up (m) Depth (km) Up (m) Planar slab Curve slab Planar slab Curve slab Profile 42 S Profile 43 S Syn. Obs. Syn. Obs. Profile 45 S Syn. Up (m) Obs. Depth (km) Planar slab Curve slab Distance from the Trench (km) Figure S7 17
38 Figure S8 18
Impact of megathrust geometry on inversion of coseismic slip from geodetic data: Application to the 1960 Chile earthquake
 GEOPHYSICAL RESEARCH LETTERS, VOL. 36, L16310, doi:10.1029/2009gl039276, 2009 Impact of megathrust geometry on inversion of coseismic slip from geodetic data: Application to the 1960 Chile earthquake M.
SUPPLEMENTARY INFORMATION
 SUPPLEMENTARY INFORMATION doi: 10.1038/ngeo739 Supplementary Information to variability and distributed deformation in the Marmara Sea fault system Tobias Hergert 1 and Oliver Heidbach 1,* 1 Geophysical
Ground displacement in a fault zone in the presence of asperities
 BOLLETTINO DI GEOFISICA TEORICA ED APPLICATA VOL. 40, N. 2, pp. 95-110; JUNE 2000 Ground displacement in a fault zone in the presence of asperities S. SANTINI (1),A.PIOMBO (2) and M. DRAGONI (2) (1) Istituto
SUPPLEMENTARY INFORMATION
 doi: 1.138/nature962 Data processing A network of 5 continuously recording GPS stations (LAGU, CHIN, ENAP, GUAD and JUAN) was installed after the earthquake (Figure 1, main text). The data considered in
Three-dimensional viscoelastic finite element model for postseismic deformation of the great 1960 Chile earthquake
 JOURNAL OF GEOPHYSICAL RESEARCH, VOL. 109,, doi:10.1029/2004jb003163, 2004 Three-dimensional viscoelastic finite element model for postseismic deformation of the great 1960 Chile earthquake Y. Hu, 1 K.
Effect of an outer-rise earthquake on seismic cycle of large interplate earthquakes estimated from an instability model based on friction mechanics
 Effect of an outer-rise earthquake on seismic cycle of large interplate earthquakes estimated from an instability model based on friction mechanics Naoyuki Kato (1) and Tomowo Hirasawa (2) (1) Geological
Surface changes caused by erosion and sedimentation were treated by solving: (2)
") GSA DATA REPOSITORY 214279 GUY SIMPSON Model with dynamic faulting and surface processes The model used for the simulations reported in Figures 1-3 of the main text is based on two dimensional (plane strain)
GSA DATA REPOSITORY 214279 GUY SIMPSON Model with dynamic faulting and surface processes The model used for the simulations reported in Figures 1-3 of the main text is based on two dimensional (plane strain)
Supplementary Material
 1 Supplementary Material 2 3 4 Interseismic, megathrust earthquakes and seismic swarms along the Chilean subduction zone (38-18 S) 5 6 7 8 9 11 12 13 14 1 GPS data set We combined in a single data set
Originally published as:
 Originally published as: Lorenzo Martín, F., Wang, R., Roth, F. (2002): The effect of input parameters on visco-elastic models of crustal deformation. - Física de la Tierra, 14, 33-54 The effect of input
Deformation cycles of great subduction earthquakes in a viscoelastic Earth
 Deformation cycles of great subduction earthquakes in a viscoelastic Earth Kelin Wang Pacific Geoscience Centre, Geological Survey of Canada School of Earth and Ocean Science, University of Victoria????
Kinematics of the Southern California Fault System Constrained by GPS Measurements
 Title Page Kinematics of the Southern California Fault System Constrained by GPS Measurements Brendan Meade and Bradford Hager Three basic questions Large historical earthquakes One basic question How
Seismic-afterslip characterization of the 2010 M W 8.8 Maule, Chile, earthquake based on moment tensor inversion
 GEOPHYSICAL RESEARCH LETTERS, VOL. 39,, doi:10.1029/2012gl053434, 2012 Seismic-afterslip characterization of the 2010 M W 8.8 Maule, Chile, earthquake based on moment tensor inversion Hans Agurto, 1 Andreas
Secondary Project Proposal
 Secondary Project Proposal Post-seismic deformation of Chi-chi earthquake Yunyue (Elita) Li 11:, Wednesday, June 2, 21 Li 2 Secondary project proposal Personal prospective MOTIVATION My interests for earthquake
Predicted reversal and recovery of surface creep on the Hayward fault following the 1906 San Francisco earthquake
 GEOPHYSICAL RESEARCH LETTERS, VOL. 35, L19305, doi:10.1029/2008gl035270, 2008 Predicted reversal and recovery of surface creep on the Hayward fault following the 1906 San Francisco earthquake D. A. Schmidt
Study megathrust creep to understand megathrust earthquakes
 1 Study megathrust creep to understand megathrust earthquakes Kelin Wang Pacific Geoscience Centre, Geological Survey of Canada, kelin.wang@canada.ca Introduction Once upon a time, there was a belief that
Far-reaching transient motions after Mojave earthquakes require broad mantle flow beneath a strong crust
 Click Here for Full Article GEOPHYSICAL RESEARCH LETTERS, VOL. 34, L19302, doi:10.1029/2007gl030959, 2007 Far-reaching transient motions after Mojave earthquakes require broad mantle flow beneath a strong
Homogeneous vs. realistic heterogeneous material-properties in subduction zone models: Coseismic and postseismic deformation
 Homogeneous vs. realistic heterogeneous material-properties in subduction zone models: Coseismic and postseismic deformation T. Masterlark 1, C. DeMets 2, H.F. Wang 2, O. S nchez 3, and J. Stock 4 1 US
Seismic Activity near the Sunda and Andaman Trenches in the Sumatra Subduction Zone
 IJMS 2017 vol. 4 (2): 49-54 International Journal of Multidisciplinary Studies (IJMS) Volume 4, Issue 2, 2017 DOI: http://doi.org/10.4038/ijms.v4i2.22 Seismic Activity near the Sunda and Andaman Trenches
Regional Geodesy. Shimon Wdowinski. MARGINS-RCL Workshop Lithospheric Rupture in the Gulf of California Salton Trough Region. University of Miami
 MARGINS-RCL Workshop Lithospheric Rupture in the Gulf of California Salton Trough Region Regional Geodesy Shimon Wdowinski University of Miami Rowena Lohman, Kim Outerbridge, Tom Rockwell, and Gina Schmalze
Earthquake and Volcano Deformation
 Earthquake and Volcano Deformation Paul Segall Stanford University Draft Copy September, 2005 Last Updated Sept, 2008 COPYRIGHT NOTICE: To be published by Princeton University Press and copyrighted, c
Sendai Earthquake NE Japan March 11, Some explanatory slides Bob Stern, Dave Scholl, others updated March
 Sendai Earthquake NE Japan March 11, 2011 Some explanatory slides Bob Stern, Dave Scholl, others updated March 14 2011 Earth has 11 large plates and many more smaller ones. Plates are 100-200 km thick
Scaling relations of seismic moment, rupture area, average slip, and asperity size for M~9 subduction-zone earthquakes
 GEOPHYSICAL RESEARCH LETTERS, VOL. 4, 7 74, doi:1.12/grl.976, 213 Scaling relations of seismic moment, rupture area, average slip, and asperity size for M~9 subduction-zone earthquakes Satoko Murotani,
Basics of the modelling of the ground deformations produced by an earthquake. EO Summer School 2014 Frascati August 13 Pierre Briole
 Basics of the modelling of the ground deformations produced by an earthquake EO Summer School 2014 Frascati August 13 Pierre Briole Content Earthquakes and faults Examples of SAR interferograms of earthquakes
Geodesy (InSAR, GPS, Gravity) and Big Earthquakes
 and Big Earthquakes") Geodesy (InSAR, GPS, Gravity) and Big Earthquakes Mathew Pritchard Teh-Ru A. Song Yuri Fialko Luis Rivera Mark Simons UJNR Earthquake Research Panel, Morioka, Japan - Nov 6, 2002 Goals Accurate and high
Geodesy (InSAR, GPS, Gravity) and Big Earthquakes Mathew Pritchard Teh-Ru A. Song Yuri Fialko Luis Rivera Mark Simons UJNR Earthquake Research Panel, Morioka, Japan - Nov 6, 2002 Goals Accurate and high
overlie the seismogenic zone offshore Costa Rica, making the margin particularly well suited for combined land and ocean geophysical studies (Figure
 Chapter 1 Introduction Historically, highly destructive large magnitude (M w >7.0) underthrusting earthquakes nucleate along the shallow segment of subduction zone megathrust fault, and this region of
Why short-term crustal shortening leads to mountain building in the Andes, but not in Cascadia?
 Click Here for Full Article GEOPHYSICAL RESEARCH LETTERS, VOL. 36, L08301, doi:10.1029/2009gl037347, 2009 Why short-term crustal shortening leads to mountain building in the Andes, but not in Cascadia?
to: Interseismic strain accumulation and the earthquake potential on the southern San
 Supplementary material to: Interseismic strain accumulation and the earthquake potential on the southern San Andreas fault system by Yuri Fialko Methods The San Bernardino-Coachella Valley segment of the
Materials and Methods The deformation within the process zone of a propagating fault can be modeled using an elastic approximation.
 Materials and Methods The deformation within the process zone of a propagating fault can be modeled using an elastic approximation. In the process zone, stress amplitudes are poorly determined and much
Long-term Crustal Deformation in and around Japan, Simulated by a 3-D Plate Subduction Model
 Long-term Crustal Deformation in and around Japan, Simulated by a 3-D Plate Subduction Model Chihiro Hashimoto (1) and Mitsuhiro Matsu ura (2) (1) Institute of Frontier Research for Earth Evolution, Japan
Elizabeth H. Hearn modified from W. Behr
 Reconciling postseismic and interseismic surface deformation around strike-slip faults: Earthquake-cycle models with finite ruptures and viscous shear zones Elizabeth H. Hearn hearn.liz@gmail.com modified
3D MODELING OF EARTHQUAKE CYCLES OF THE XIANSHUIHE FAULT, SOUTHWESTERN CHINA
 3D MODELING OF EARTHQUAKE CYCLES OF THE XIANSHUIHE FAULT, SOUTHWESTERN CHINA Li Xiaofan MEE09177 Supervisor: Bunichiro Shibazaki ABSTRACT We perform 3D modeling of earthquake generation of the Xianshuihe
Aftershocks are well aligned with the background stress field, contradicting the hypothesis of highly heterogeneous crustal stress
 JOURNAL OF GEOPHYSICAL RESEARCH, VOL. 115,, doi:10.1029/2010jb007586, 2010 Aftershocks are well aligned with the background stress field, contradicting the hypothesis of highly heterogeneous crustal stress
Seismic and aseismic processes in elastodynamic simulations of spontaneous fault slip
 Seismic and aseismic processes in elastodynamic simulations of spontaneous fault slip Most earthquake simulations study either one large seismic event with full inertial effects or long-term slip history
Synthetic Seismicity Models of Multiple Interacting Faults
 Synthetic Seismicity Models of Multiple Interacting Faults Russell Robinson and Rafael Benites Institute of Geological & Nuclear Sciences, Box 30368, Lower Hutt, New Zealand (email: r.robinson@gns.cri.nz).
G 3. AN ELECTRONIC JOURNAL OF THE EARTH SCIENCES Published by AGU and the Geochemical Society
 Geosystems G 3 AN ELECTRONIC JOURNAL OF THE EARTH SCIENCES Published by AGU and the Geochemical Society Article Volume 9, Number 12 23 December 2008 Q12024, doi:10.1029/2008gc002198 ISSN: 1525-2027 Click
Megathrust Earthquakes
 Megathrust Earthquakes Susan Schwartz University of California Santa Cruz CIDER 2017 UC Berkeley July 5, 2017 The largest megathrust events are not uniformally distributed at all subduction zones. M>8
Coseismic slip distribution of the 1946 Nankai earthquake and aseismic slips caused by the earthquake
 Earth Planets Space, 53, 235 241, 2001 Coseismic slip distribution of the 1946 Nankai earthquake and aseismic slips caused by the earthquake Yuichiro Tanioka 1 and Kenji Satake 2 1 Meteorological Research
High-Harmonic Geoid Signatures due to Glacial Isostatic Adjustment, Subduction and Seismic Deformation
 High-Harmonic Geoid Signatures due to Glacial Isostatic Adjustment, Subduction and Seismic Deformation L.L.A. Vermeersen (1), H. Schotman (1), M.-W. Jansen (1), R. Riva (1) and R. Sabadini (2) (1) DEOS,
Seismic and flexure constraints on lithospheric rheology and their dynamic implications
 Seismic and flexure constraints on lithospheric rheology and their dynamic implications Shijie Zhong Dept. of Physics, University of Colorado Boulder, Colorado, USA Acknowledgement: A. B. Watts Dept. of
The influence of short wavelength variations in viscosity on subduction dynamics
 1 Introduction Deformation within the earth, driven by mantle convection due primarily to cooling and subduction of oceanic lithosphere, is expressed at every length scale in various geophysical observations.
Co-seismic Gravity Changes Computed for a Spherical Earth Model Applicable to GRACE Data
 Chapter 2 Co-seismic Gravity Changes Computed for a Spherical Earth Model Applicable to GRACE Data W.Sun,G.Fu,andSh.Okubo Abstract Dislocation theories were developed conventionally for a deformed earth
by George E. Hilley, J Ramón Arrowsmith, and Elizabeth Stone Introduction
 Bulletin of the Seismological Society of America, 91, 3, pp. 427 440, June 2001 Inferring Segment Strength Contrasts and Boundaries along Low-Friction Faults Using Surface Offset Data, with an Example
Three dimensional FEM derived elastic Green s functions for the coseismic deformation of the 2005 M w 8.7 Nias Simeulue, Sumatra earthquake
 Article Volume 12, Number 7 20 July 2011 Q07013, doi:10.1029/2011gc003553 ISSN: 1525 2027 Three dimensional FM derived elastic Green s functions for the coseismic deformation of the 2005 M w 8.7 Nias Simeulue,
Earth and Planetary Science Letters
 Earth and Planetary Science Letters 305 (2011) 413 424 Contents lists available at ScienceDirect Earth and Planetary Science Letters journal homepage: www.elsevier.com/locate/epsl Heterogeneous plate locking
Lab 1: Plate Tectonics April 2, 2009
 Name: Lab 1: Plate Tectonics April 2, 2009 Objective: Students will be introduced to the theory of plate tectonics and different styles of plate margins and interactions. Introduction The planet can be
2008 Monitoring Research Review: Ground-Based Nuclear Explosion Monitoring Technologies
 STRUCTURE OF THE KOREAN PENINSULA FROM WAVEFORM TRAVEL-TIME ANALYSIS Roland Gritto 1, Jacob E. Siegel 1, and Winston W. Chan 2 Array Information Technology 1 and Harris Corporation 2 Sponsored by Air Force
D DAVID PUBLISHING. Deformation of Mild Steel Plate with Linear Cracks due to Horizontal Compression. 1. Introduction
 Journal of Control Science and Engineering 1 (2015) 40-47 doi: 10.17265/2328-2231/2015.01.005 D DAVID PUBLISHING Deformation of Mild Steel Plate with Linear Cracks due to Horizontal Compression Mitsuru
Hitoshi Hirose (1), and Kazuro Hirahara (2) Abstract. Introduction
, and Kazuro Hirahara (2) Abstract. Introduction") Three dimensional simulation for the earthquake cycle at a subduction zone based on a rate- and state-dependent friction law: Insight into a finiteness and a variety of dip-slip earthquakes Hitoshi Hirose
Three dimensional simulation for the earthquake cycle at a subduction zone based on a rate- and state-dependent friction law: Insight into a finiteness and a variety of dip-slip earthquakes Hitoshi Hirose
M 7.0 earthquake recurrence on the San Andreas fault from a stress renewal model
 Click Here for Full Article JOURNAL OF GEOPHYSICAL RESEARCH, VOL. 111,, doi:10.1029/2006jb004415, 2006 M 7.0 earthquake recurrence on the San Andreas fault from a stress renewal model Tom Parsons 1 Received
The Earthquake Cycle Chapter :: n/a
 The Earthquake Cycle Chapter :: n/a A German seismogram of the 1906 SF EQ Image courtesy of San Francisco Public Library Stages of the Earthquake Cycle The Earthquake cycle is split into several distinct
Plate Tectonics. entirely rock both and rock
 Plate Tectonics I. Tectonics A. Tectonic Forces are forces generated from within Earth causing rock to become. B. 1. The study of the origin and arrangement of Earth surface including mountain belts, continents,
Slip distributions of the 1944 Tonankai and 1946 Nankai earthquakes including the horizontal movement effect on tsunami generation
 Slip distributions of the 1944 Tonankai and 1946 Nankai earthquakes including the horizontal movement effect on tsunami generation Toshitaka Baba Research Program for Plate Dynamics, Institute for Frontier
Global Tectonics. Kearey, Philip. Table of Contents ISBN-13: Historical perspective. 2. The interior of the Earth.
 Global Tectonics Kearey, Philip ISBN-13: 9781405107778 Table of Contents Preface. Acknowledgments. 1. Historical perspective. 1.1 Continental drift. 1.2 Sea floor spreading and the birth of plate tectonics.
MECHANICAL MODELS FOR INTERSEISMIC DEFORMATION IN SUBDUCTION ZONES. Thesis by. Ravi V. S. Kanda. In Partial Fulfillment of the Requirements for the
 MECHANICAL MODELS FOR INTERSEISMIC DEFORMATION IN SUBDUCTION ZONES Thesis by Ravi V. S. Kanda In Partial Fulfillment of the Requirements for the degree of Doctor of Philosophy CALIFORNIA INSTITUTE OF TECHNOLOGY
Numerical simulation of seismic cycles at a subduction zone with a laboratory-derived friction law
 Numerical simulation of seismic cycles at a subduction zone with a laboratory-derived friction law Naoyuki Kato (1), Kazuro Hirahara (2) and Mikio Iizuka (3) (1) Earthquake Research Institute, University
Geophysical Journal International
 Geophysical Journal International Geophys. J. Int. (2016) 205, 1455 1472 Advance Access publication 2016 March 7 GJI Geodynamics and tectonics doi: 10.1093/gji/ggw086 Afterslip and viscoelastic relaxation
MAR110 Lecture #5 Plate Tectonics-Earthquakes
 1 MAR110 Lecture #5 Plate Tectonics-Earthquakes Figure 5.0 Plate Formation & Subduction Destruction The formation of the ocean crust from magma that is upwelled into a pair of spreading centers. Pairs
Journal of Geophysical Research (Solid Earth) Supporting Information for
 Supporting Information for") Journal of Geophysical Research (Solid Earth) Supporting Information for Postseismic Relocking of the Subduction Megathrust Following the 2007 Pisco, Peru earthquake D.Remy (a), H.Perfettini (b), N.Cotte
Journal of Geophysical Research (Solid Earth) Supporting Information for Postseismic Relocking of the Subduction Megathrust Following the 2007 Pisco, Peru earthquake D.Remy (a), H.Perfettini (b), N.Cotte
Di#erences in Earthquake Source and Ground Motion Characteristics between Surface and Buried Crustal Earthquakes
 Bull. Earthq. Res. Inst. Univ. Tokyo Vol. 2+,**0 pp.,/3,00 Di#erences in Earthquake Source and Ground Motion Characteristics between Surface and Buried Crustal Earthquakes Paul Somerville* and Arben Pitarka
Development of a Predictive Simulation System for Crustal Activities in and around Japan - II
 Development of a Predictive Simulation System for Crustal Activities in and around Japan - II Project Representative Mitsuhiro Matsu'ura Graduate School of Science, The University of Tokyo Authors Mitsuhiro
Occurrence of quasi-periodic slow-slip off the east coast of the Boso peninsula, Central Japan
 LETTER Earth Planets Space, 9, 11 1, Occurrence of quasi-periodic slow-slip off the east coast of the Boso peninsula, Central Japan Shinzaburo Ozawa, Hisashi Suito, and Mikio Tobita Geographical Survey
A) B) C) D) 4. Which diagram below best represents the pattern of magnetic orientation in the seafloor on the west (left) side of the ocean ridge?
 B) C) D) 4. Which diagram below best represents the pattern of magnetic orientation in the seafloor on the west (left) side of the ocean ridge?") 1. Crustal formation, which may cause the widening of an ocean, is most likely occurring at the boundary between the A) African Plate and the Eurasian Plate B) Pacific Plate and the Philippine Plate C)
1. Crustal formation, which may cause the widening of an ocean, is most likely occurring at the boundary between the A) African Plate and the Eurasian Plate B) Pacific Plate and the Philippine Plate C)
ON NEAR-FIELD GROUND MOTIONS OF NORMAL AND REVERSE FAULTS FROM VIEWPOINT OF DYNAMIC RUPTURE MODEL
 1 Best Practices in Physics-based Fault Rupture Models for Seismic Hazard Assessment of Nuclear ON NEAR-FIELD GROUND MOTIONS OF NORMAL AND REVERSE FAULTS FROM VIEWPOINT OF DYNAMIC RUPTURE MODEL Hideo AOCHI
Fault Specific, Dynamic Rupture Scenarios for Strong Ground Motion Prediction
 Fault Specific, Dynamic Rupture Scenarios for Strong Ground Motion Prediction H. Sekiguchi Disaster Prevention Research Institute, Kyoto University, Japan Blank Line 9 pt Y. Kase Active Fault and Earthquake
This document is downloaded from DR-NTU, Nanyang Technological University Library, Singapore.
 This document is downloaded from DR-NTU, Nanyang Technological University Library, Singapore. Title Author(s) Citation Frictional afterslip following the 2005 Nias-Simeulue earthquake, Sumatra Hsu, Ya-Ju;
Slab pull, slab weakening, and their relation to deep intra-slab seismicity
 GEOPHYSICAL RESEARCH LETTERS, VOL. 32, L14305, doi:10.1029/2005gl022922, 2005 Slab pull, slab weakening, and their relation to deep intra-slab seismicity Susan L. Bilek Earth and Environmental Science
Rotation of the Principal Stress Directions Due to Earthquake Faulting and Its Seismological Implications
 Bulletin of the Seismological Society of America, Vol. 85, No. 5, pp. 1513-1517, October 1995 Rotation of the Principal Stress Directions Due to Earthquake Faulting and Its Seismological Implications by
The Effect of Elastic Layering on Inversions of GPS Data for Coseismic Slip and Resulting Stress Changes: Strike-Slip Earthquakes
 Bulletin of the Seismological Society of America, Vol. 95, No. 5, pp. 1637 1653, October 2005, doi: 10.1785/0120040158 The Effect of Elastic Layering on Inversions of GPS Data for Coseismic Slip and Resulting
Estimating fault slip rates, locking distribution, elastic/viscous properites of lithosphere/asthenosphere. Kaj M. Johnson Indiana University
 3D Viscoelastic Earthquake Cycle Models Estimating fault slip rates, locking distribution, elastic/viscous properites of lithosphere/asthenosphere Kaj M. Johnson Indiana University In collaboration with:
ANOTHER MEXICAN EARTHQUAKE! Magnitude 7.1, Tuesday Sept. 19, 2017
 ANOTHER MEXICAN EARTHQUAKE! Magnitude 7.1, Tuesday Sept. 19, 2017 Why is there no oceanic crust older than 200 million years? SUBDUCTION If new oceanic crust is being continuously created along the earth
Lecture 20: Slow Slip Events and Stress Transfer. GEOS 655 Tectonic Geodesy Jeff Freymueller
 Lecture 20: Slow Slip Events and Stress Transfer GEOS 655 Tectonic Geodesy Jeff Freymueller Slow Slip Events From Kristine Larson What is a Slow Slip Event? Slip on a fault, like in an earthquake, BUT
What is the LAB Dynamically: Lithosphere and Asthenosphere Rheology from Post-loading Deformation
 What is the LAB Dynamically: Lithosphere and Asthenosphere Rheology from Post-loading Deformation Roland Bürgmann, UC Berkeley With contributions by Pascal Audet, Daula Chandrasekhar, Georg Dresen, Andy
Using deformation rates in Northern Cascadia to constrain time-dependent stress- and slip-rate on the megathrust
 Using deformation rates in Northern Cascadia to constrain time-dependent stress- and slip-rate on the megathrust Lucile Bruhat Paul Segall Stanford University 1 50 Interseismic period for the Cascadia
Megathrust earthquakes: How large? How destructive? How often? Jean-Philippe Avouac California Institute of Technology
 Megathrust earthquakes: How large? How destructive? How often? Jean-Philippe Avouac California Institute of Technology World seismicity (data source: USGS) and velocities relative to ITRF1997 (Sella et
The Size and Duration of the Sumatra-Andaman Earthquake from Far-Field Static Offsets
 The Size and Duration of the Sumatra-Andaman Earthquake from Far-Field Static Offsets P. Banerjee, 1 F. F. Pollitz, 2 R. Bürgmann 3 * 1 Wadia Institute of Himalayan Geology, Dehra Dun, 248001, India. 2
by west-dipping subduction of the North American Plate
 GSA Data Repository 2019133 Supplementary information for Kimberlite magmatism induced by west-dipping subduction of the North American Plate Wenbo Zhang 1*, Stephen T. Johnston 1, and Claire A. Currie
Chapter 3 A SENSITIVITY ANALYSIS OF ELASTIC DISLOCATION MODELS FOR INTERSEISMIC DEFORMATION IN SUBDUCTION ZONES
 3-1 Chapter 3 A SENSITIVITY ANALYSIS OF ELASTIC DISLOCATION MODELS FOR INTERSEISMIC DEFORMATION IN SUBDUCTION ZONES 3.1 Introduction At subduction plate boundaries, geodetic data from the interseismic
Scientific Research on the Cascadia Subduction Zone that Will Help Improve Seismic Hazard Maps, Building Codes, and Other Risk-Mitigation Measures
 Scientific Research on the Cascadia Subduction Zone that Will Help Improve Seismic Hazard Maps, Building Codes, and Other Risk-Mitigation Measures Art Frankel U.S. Geological Survey Seattle, WA GeoPrisms-Earthscope
Plate Tectonics. Structure of the Earth
 Plate Tectonics Structure of the Earth The Earth can be considered as being made up of a series of concentric spheres, each made up of materials that differ in terms of composition and mechanical properties.
Journal of Geophysical Research Letters Supporting Information for
 Journal of Geophysical Research Letters Supporting Information for InSAR observations of strain accumulation and fault creep along the Chaman Fault system, Pakistan and Afghanistan H. Fattahi 1, F. Amelung
Splay fault and megathrust earthquake slip in the Nankai Trough
 Earth Planets Space, 53, 243 248, 2001 Splay fault and megathrust earthquake slip in the Nankai Trough Phil R. Cummins, Takane Hori, and Yoshiyuki Kaneda Frontier Research Program for Subduction Dynamics,
3D Finite Element Modeling of fault-slip triggering caused by porepressure
 3D Finite Element Modeling of fault-slip triggering caused by porepressure changes Arsalan Sattari and David W. Eaton Department of Geoscience, University of Calgary Suary We present a 3D model using a
The Structure of the Earth and Plate Tectonics
 The Structure of the Earth and Plate Tectonics Agree or Disagree? 1. The Earth if made up of 4 different layers. 2. The crust (where we live) can be made of either less dense continental crust or the more
Constraints on Mantle Structure from Surface Observables
 MYRES I: Heat, Helium & Whole Mantle Convection Constraints on Mantle Structure from Surface Observables Magali Billen University of California, Davis Department of Geology The Goal Use observations of
TSUNAMI HAZARD ASSESSMENT FOR THE CENTRAL COAST OF PERU USING NUMERICAL SIMULATIONS FOR THE 1974, 1966 AND 1746 EARTHQUAKES
 TSUNAMI HAZARD ASSESSMENT FOR THE CENTRAL COAST OF PERU USING NUMERICAL SIMULATIONS FOR THE 1974, 1966 AND 1746 EARTHQUAKES Sheila Yauri Supervisor: Yushiro FUJII MEE10521 Bunichiro SHIBAZAKI ABSTRACT
Depth (Km) + u ( ξ,t) u = v pl. η= Pa s. Distance from Nankai Trough (Km) u(ξ,τ) dξdτ. w(x,t) = G L (x,t τ;ξ,0) t + u(ξ,t) u(ξ,t) = v pl
 + u ( ξ,t) u = v pl. η= Pa s. Distance from Nankai Trough (Km) u(ξ,τ) dξdτ. w(x,t) = G L (x,t τ;ξ,0) t + u(ξ,t) u(ξ,t) = v pl") Slip history during one earthquake cycle at the Nankai subduction zone, inferred from the inversion analysis of levelling data with a viscoelastic slip response function Mitsuhiro Matsu'ura, Akira Nishitani
Slip history during one earthquake cycle at the Nankai subduction zone, inferred from the inversion analysis of levelling data with a viscoelastic slip response function Mitsuhiro Matsu'ura, Akira Nishitani
Earth and Planetary Science Letters
 Earth and Planetary Science Letters 321-322 (2012) 152 165 Contents lists available at SciVerse ScienceDirect Earth and Planetary Science Letters journal homepage: www.elsevier.com/locate/epsl Toward understanding
Marine Science and Oceanography
 Marine Science and Oceanography Marine geology- study of the ocean floor Physical oceanography- study of waves, currents, and tides Marine biology study of nature and distribution of marine organisms Chemical
PLATE TECTONIC PROCESSES
 Lab 9 Name Sec PLATE TECTONIC PROCESSES 1. Fill in the blank spaces on the chart with the correct answers. Refer to figures 2.3, 2.4 p.33 (2.2 and 2.3 on p. 23) as needed. 2. With your knowledge of different
Plate Tectonics - Demonstration
 Name: Reference: Prof. Larry Braile - Educational Resources Copyright 2000. L. Braile. Permission granted for reproduction for non-commercial uses. http://web.ics.purdue.edu/~braile/indexlinks/educ.htm
Today: Basic regional framework. Western U.S. setting Eastern California Shear Zone (ECSZ) 1992 Landers EQ 1999 Hector Mine EQ Fault structure
 1992 Landers EQ 1999 Hector Mine EQ Fault structure") Today: Basic regional framework Western U.S. setting Eastern California Shear Zone (ECSZ) 1992 Landers EQ 1999 Hector Mine EQ Fault structure 1 2 Mojave and Southern Basin and Range - distribution of strike-slip
Today: Basic regional framework Western U.S. setting Eastern California Shear Zone (ECSZ) 1992 Landers EQ 1999 Hector Mine EQ Fault structure 1 2 Mojave and Southern Basin and Range - distribution of strike-slip
Introduction to Subduction Zones
 PAGEOPH, Vol. 128, Nos. 3/4 (1988) 0033~4553/88/040449-0551.50 + 0.20/0 9 1988 Birkh/iuser Verlag, Basel Introduction to Subduction Zones LARRY J. RUFF j and HIROO KANAMORI 2 Subduction zones present many
A mechanical model of the San Andreas fault and SAFOD Pilot Hole stress measurements
 GEOPHYSICAL RESEARCH LETTERS, VOL. 31, L15S13, doi:10.1029/2004gl019521, 2004 A mechanical model of the San Andreas fault and SAFOD Pilot Hole stress measurements Jean Chéry Laboratoire Dynamique de la
Characterizing Earthquake Rupture Models for the Prediction of Strong Ground Motion
 Characterizing Earthquake Rupture Models for the Prediction of Strong Ground Motion Paul Somerville URS Corporation, 566 El Dorado Street, Pasadena, CA, 91101, USA Summary The uncertainty in estimates
Differentiating earthquake tsunamis from other sources; how do we tell the difference?
 Differentiating earthquake tsunamis from other sources; how do we tell the difference? David Tappin (1), Stephan Grilli (2), Jeffrey Harris (2), Timothy Masterlark (3), James Kirby (4), Fengyan Shi Shi
Dynamic Subsidence and Uplift of the Colorado Plateau. Supplementary Material
 GSA DATA REPOSITORY 2010177 Liu and Gurnis Dynamic Subsidence and Uplift of the Colorado Plateau Supplementary Material Lijun Liu and Michael Gurnis Seismological Laboratory California Institute of Technology
Auxiliary Material. Subduction of oceanic asthenosphere: evidence from sub-slab seismic anisotropy. Teh-Ru Alex Song, Hitoshi Kawakatsu
 Auxiliary Material Subduction of oceanic asthenosphere: evidence from sub-slab seismic anisotropy Teh-Ru Alex Song, Hitoshi Kawakatsu correspondence to: tehrusong@gmail.com 1 1. The effect of anisotropy
Originally published as:
 Originally published as: Lange, D., Bedford, J., Moreno, M., Tilmann, F., Baez, J. C., Bevis, M., Kruger, F. (2014): Comparison of postseismic afterslip models with aftershock seismicity for three subduction-zone
SOURCE MODELING OF RECENT LARGE INLAND CRUSTAL EARTHQUAKES IN JAPAN AND SOURCE CHARACTERIZATION FOR STRONG MOTION PREDICTION
 SOURCE MODELING OF RECENT LARGE INLAND CRUSTAL EARTHQUAKES IN JAPAN AND SOURCE CHARACTERIZATION FOR STRONG MOTION PREDICTION Kimiyuki Asano 1 and Tomotaka Iwata 2 1 Assistant Professor, Disaster Prevention
Evidence for postseismic deformation of the lower crust following the 2004 Mw6.0 Parkfield earthquake
 JOURNAL OF GEOPHYSICAL RESEARCH, VOL. 116,, doi:10.1029/2010jb008073, 2011 Evidence for postseismic deformation of the lower crust following the 2004 Mw6.0 Parkfield earthquake Lucile Bruhat, 1,2 Sylvain