A wetland is not fully protected til it s safely in a geo-database MassDEP 1 Winter Street Boston, MA
|
|
|
- Emmeline Campbell
- 5 years ago
- Views:
Transcription
1 Massachusetts Wetlands Mapping and Monitoring Program A wetland is not fully protected til it s safely in a geo-database
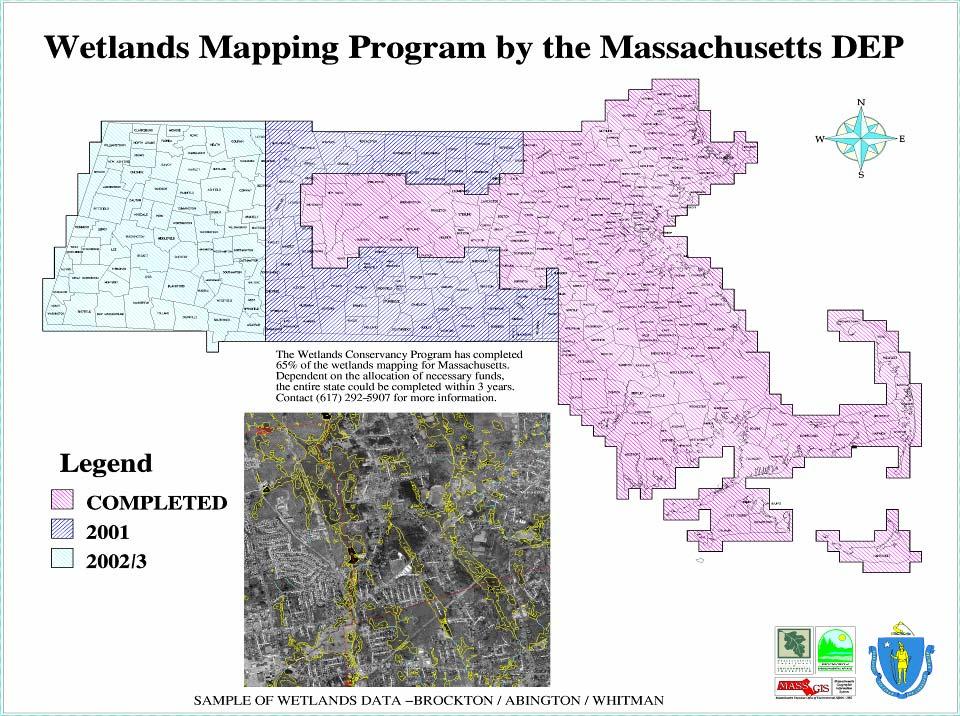
2 Massachusetts Long History of Wetlands Protection Regulations Densely developed eastern portion Rapidly developing in central and western portions
3 Tools for Wetlands Protection in Massachusetts State Regulations are implemented at local level Coastal regulations Inland regulations Rivers Act Restrictions Program Wetland Mapping Program Wetland Change Program
4 Wetlands: Unique Places in the Landscape Provide vital functions at no cost Oftentimes, functions can t be replaced by other habitat type Restoration doesn t equal Protection

5 Wetlands Under Pressure Transportation Residential Development Commercial Development
6

7 Resource Restoration? Maine lost its native Atlantic salmon runs to dams, forestry and blueberry spraying Spent over $20 million No Success

8 Wetland Values Unappreciated

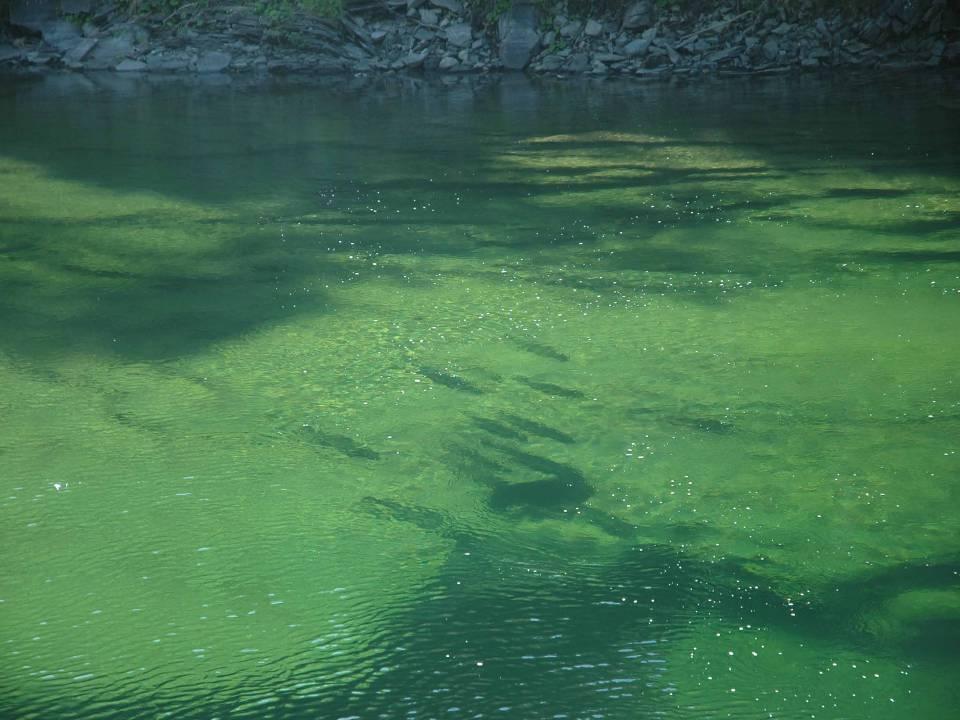
9 If a wetland isn t mapped..it can disappear without a trace.
10
11 List of Mapping Data Specs Wetlands Data, Stereo-scopic images. Minimum Mapping Unit: 0.25 ac Digital Orthophotoquad Base Map 1:5000 scale, 0.50m resolution Mapping interval: 3-4 years
12 Different Types of Wetlands Mapping Least Accurate USGS Topo Maps Smaller Scale, Older Photography National Wetlands Inventory Small Scale, Older Photography,Limited Site Verification DEP Wetlands Mapping Large Scale Recent Photos, Site Verification, As Needed Onsite Mapping Onsite: Plant Communities, Soil Characteristics and Hydrology Most Accurate

13 Color Infrared Aerial Photograph Flown in early April leaves-off conditions Film consistently codes wet areas with a dark coloration

14 Photointerpretation Process 1:12,000 CIR Film positives 10X Magnification Stereo Viewing Comprehensive Manual of Photointerpretative Conventions Fieldwork for difficult sites

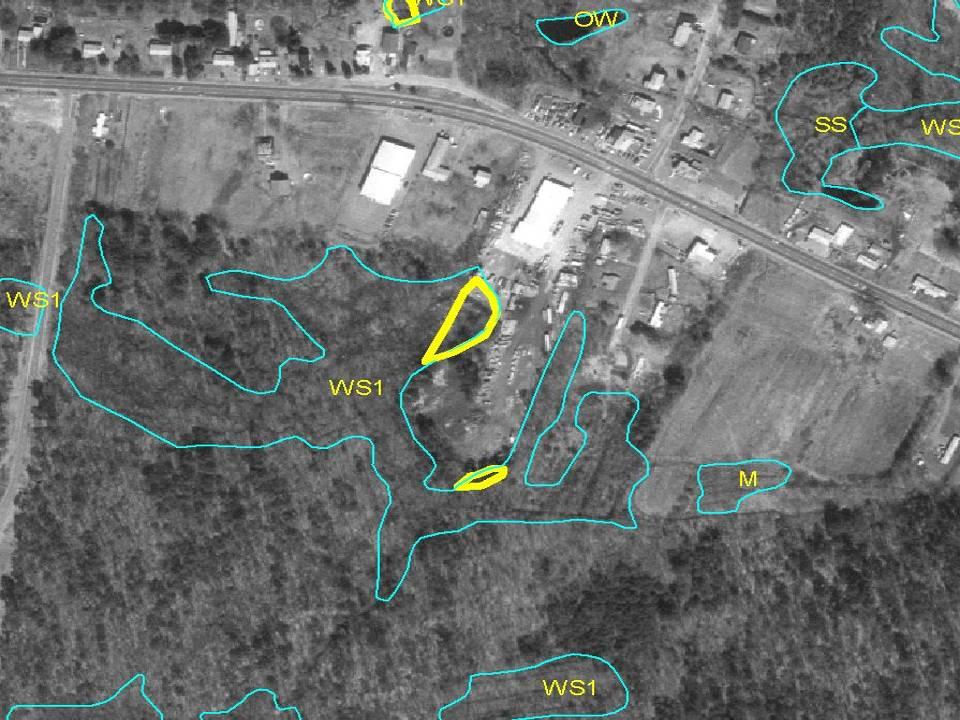
15 Analogue Interpreted Wetlands Overlay The wetlands areas are drafted onto an acetate overlay and registered to digital state base map. Questionable areas are flagged for site visit.
16 DEP Base Wetlands Map Comprehensive wetlands blue polygons Located on digital base map Also showing hydrological connections green lines Wetlands have added protection once they are in the state s GIS
17 Minimum Mapping Unit Notes MA statewide wetlands data base has a MMU of 0.25 acre If you select out polygons between 0.25 and 0.49 acres: # of polygons reduced by 29% resulting in reduction of 2.9% total acreage
 Total Cost - $ 3,159.000 Cost/sq.")
18 Costs to Produce MA Digital Wetlands Data From Analogue CIR Photography (Including Staff Costs) Total Cost - $ 3, Cost/sq. mi - $399 Duration 12 years
19 Costs to Produce MASS Wetlands Data from Digital Imagery (Estimated) Total Cost - $ 1,180,000 Cost/sq. mi - $147 Mapping Interval: 3-4 years

20 Costs to Acquire Statewide Digital Imagery with enhanced DEM Digital Color Orthophotomap -- Cost $ 850, m pixel resolution Per Sq. Mile - $ 106 -individual stereo color geotiffs

21 2 nd Statewide Orthophoto Acquisition Served as change map Same geometry as earlier DOQ Date: April 2001 Costs shared with Transportation and Public Utilities

22 Change Detection Technique

23 Change Detection Technique
24

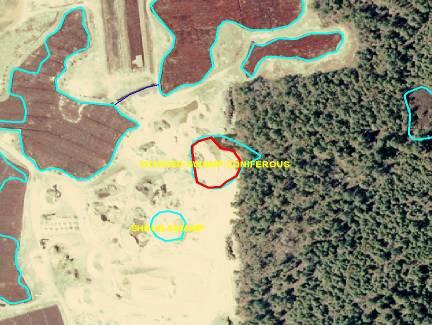
25 Wetlands Change Project Process Parking Area expanded into Wooded Swamp
26 Change Technique Requirements Digital Wetlands Dataset More recent digital imagery Image Processing Software to Detect Pixel Changes

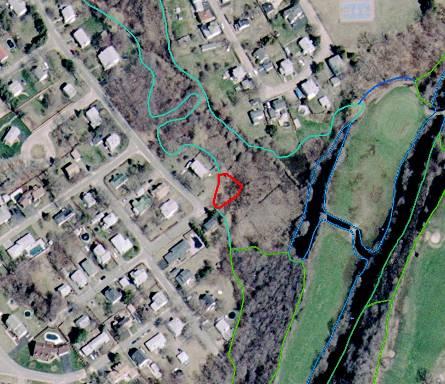
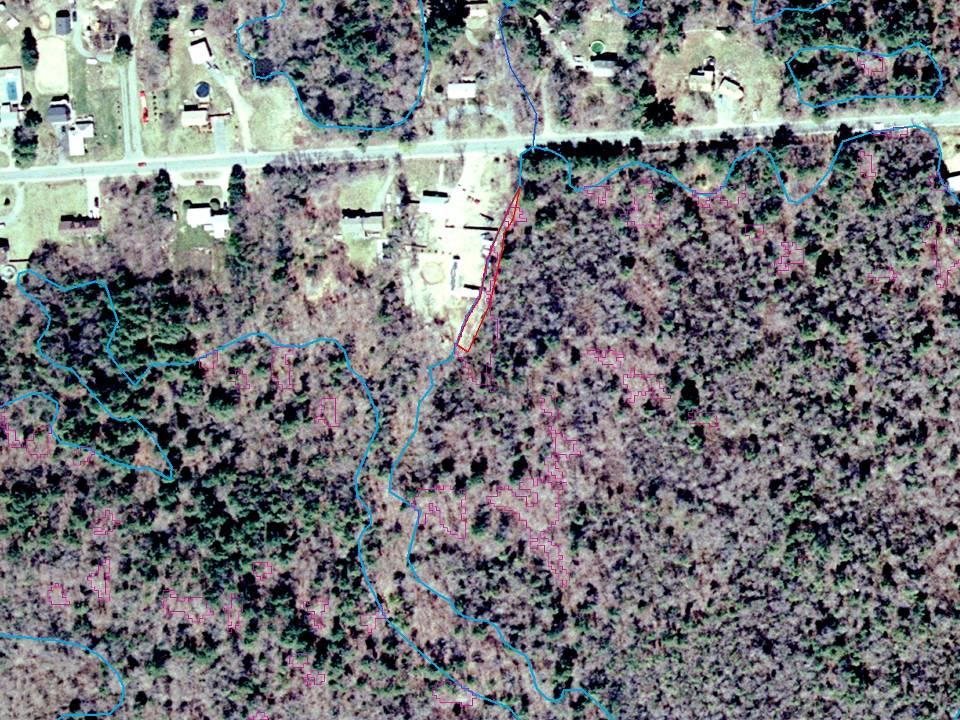
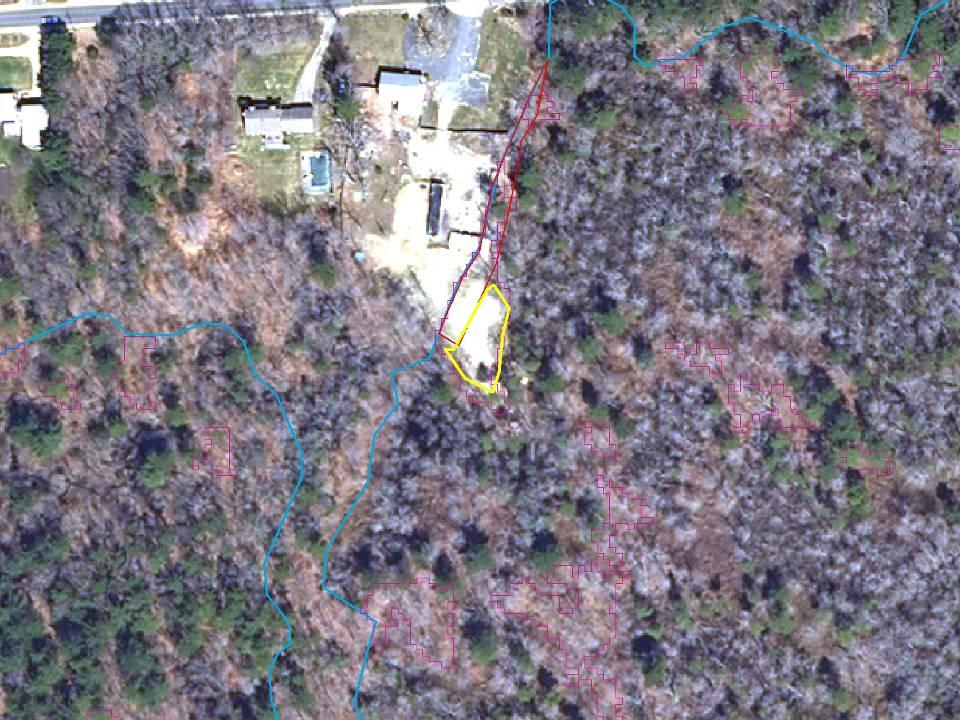
27 Wetlands Change Project Test Prototype Before Computer Change Detection Shows Pixels of Change in Red

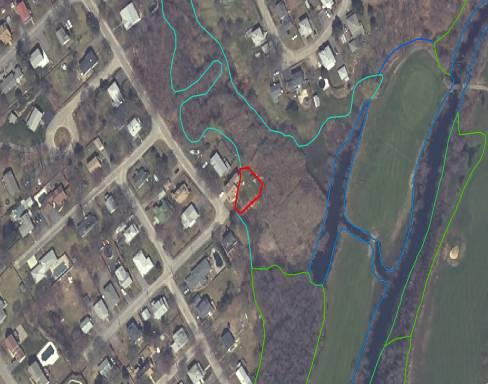
28 Wetlands Change Project Test Prototype After Computer Change Detection Shows Pixels of Change in yellow

29 Wetlands Change Project Onsite Conditions Fill 3-4 ft. up trunks of trees


30 A picture is worth a 1,000 words April 1996 April 2001

31 April 1996 April 2001
32 What We Have With Our Statewide Imagery Analysis Acres of wetlands altered, by type Project types and acres alteration attributed to them Estimates of permitted/unpermitted for sample communities
33 What are we finding? Over 900 acres of loss in 7-10 year period Principal activities causing loss: 31% Agriculture 23% Residential 11% Commercial and industrial
34 How much is permitted? Percent of identified loss Permitted Likely unpermitted Unknown
35 Now What Are We Doing With The Data?
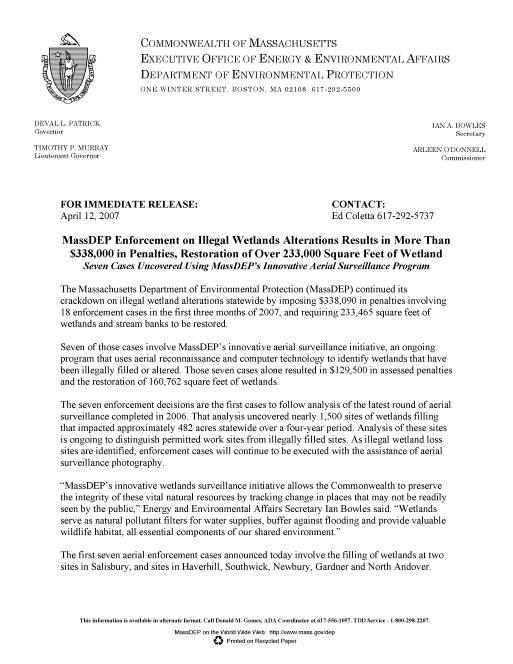
36 Deterring Illegal Fill Using maps to identify enforcement cases Over 50 cases so far Over 300 acres illegal fill Over $4,000,000 penalties Restoration
 Photos DEP Conservancy Program, Apr 1991 Black & White Orthophotos MassGIS, 5/1/95 Color Orthophotos MassGIS,")
37 Detection DEP WETLANDS LOSS IDENTIFICATION DEP Loss Analysis Data Sources: Wetlands & Streams- based on Color Infrared (CIR) photos from 1991 Wetlands Loss Areas determined by DEP Wetlands Conservancy Program, 2003 Color Infrared (CIR) Photos DEP Conservancy Program, Apr 1991 Black & White Orthophotos MassGIS, 5/1/95 Color Orthophotos MassGIS, 4/1/01
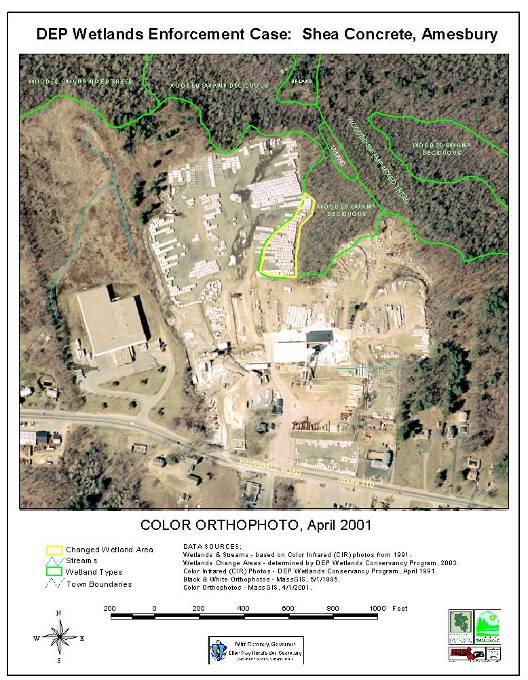
38 Enforcement

39 2005 Imagery Detection -- Enforcement Restoration

40 Publicity = Deterrence

41 New 2005 Imagery Acquired April Band 12bit 0.5m pixel
42 What are we finding? Almost 500 acres of loss in 4 year period Principal activities causing loss: 24% Residential 16% Clearing Unknown Reason 12% Commercial and industrial
43 DEP Wetlands (1:12,000) Change - March 2007 Download this layer (ESRI Shapefile, with ArcGIS 8.3 LYR and ArcView 3.x AVL) OVERVIEW The DEP Wetlands Change Datalayer comprises two polygon feature types, wetlands change from 2001 imagery and wetlands change from 2005 imagery. The attribute codes in the polygon layer describe different types of wetland environments and different types of reasons for the wetlands change. View the Wetlands Change online The layer is named WETCHANGE_POLY.

44
45 LIMITATIONS/DISCLAIMER The DEP Wetlands Change Datalayer has been developed and is made available for distribution for the purpose of serving as a tool to monitor changes within the wetland areas which DEP has included in its statewide wetlands datalayer. The DEP Wetlands Change datalayer is based on the interpretation of aerial photographs and digital aerial imagery. Because the changes represented on these maps have been determined solely through photo-interpretation, they do not represent, and should not be used as, wetlands delineation under the Wetlands Protection Act (M.G.L. c. 131, sec. 40) and the implementing regulations (310 CMR et seq.). While aerial photography can be a useful and reliable tool for ascertaining the existence, past or present, of wetland resource areas, it is not a substitute for and should be used in conjunction with appropriate ground survey observation (vegetation; history of hydrology; soil profiles, etc.).
46

47 Digital On-Screen Stereo Mapping

48 Image Comparisons IR Band True Color Band

49 Improve Wetlands Mapping Data
50 Wetland Changes for New Wetlands Data Duration 2 Years Polygon Registration Errors New Wetlands Areas/Polygons Original Map Errors (including tidal flat corrections) Changed Wetlands (human vs. natural in metadata) Hydro Edits (registration) New Hydro (within & outside wetland polygons) ADOPT MAPPING PROTOCOLS OF FGDC
51 Back yard Encroachments

52 Beaver Activity

53 Cranberry Bog Expansion

54 Coastal Erosion
55
56
57 Eventually Permitting data base that links with GIS Electronic submission of NOIs Easy match of permit files with GIS identified change locations

58 Improving Compatibility of Data Combining Wetlands Change Data with Permit Data
59
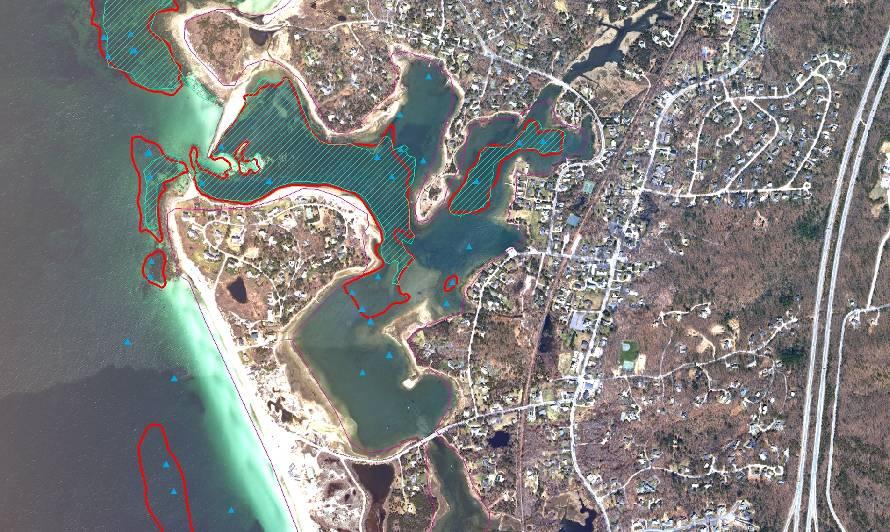
60 Seagrass Beds

61 Zostera marina Primary Producer of Estuarine Habitats Robust system of Rhisomesstabilizing the bottom Shoots float above bottom providing safe haven for larval scallops and other shellfish Highly stressed from macroalgal competition in enriched embayments In some embayments 2-3% areal decline per year

62 Aerial Imagery 1:20,000 Scale Low Tide Low Sun Angle
63 Methods Acquire high resolution aerial imagery to the specifications of the NOAA-C-CAP Program Photointerpret imagery Conduct fieldwork as required to verify photointerpretation Record field data Geo-reference analogue data to state digital map base

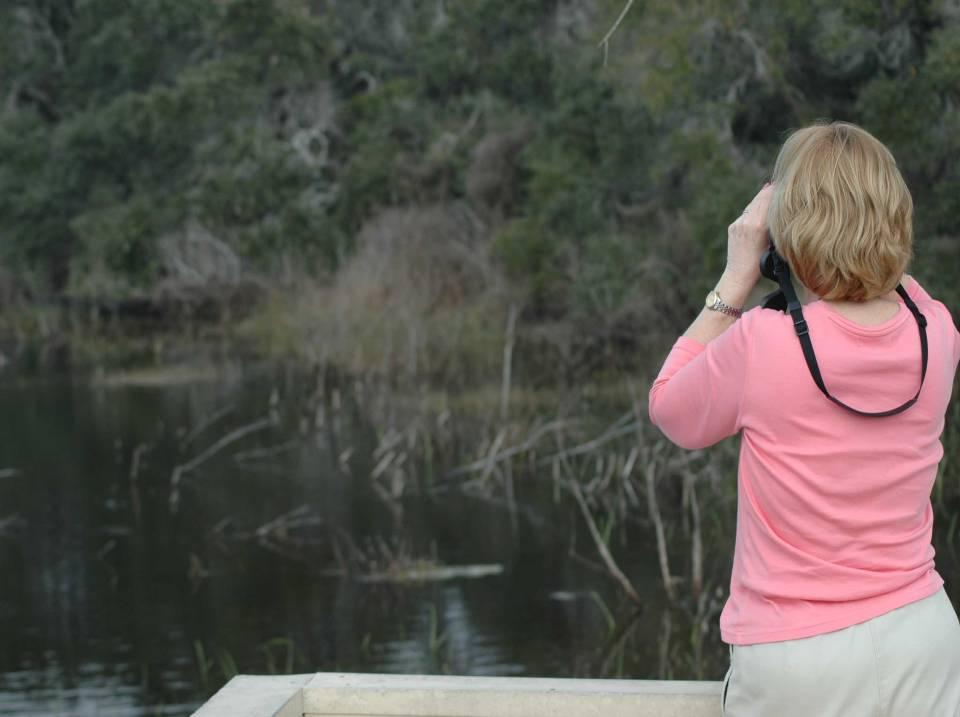
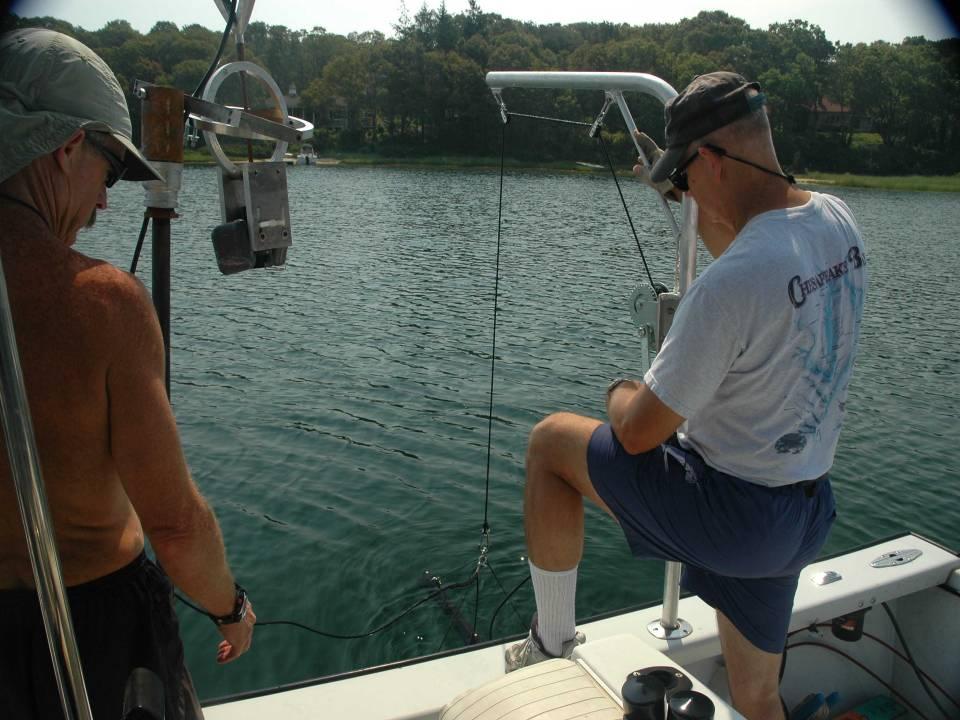
64 Efficient Observer
65 Brief History Conducted pilot project to develop methods Completed first state coastal mapping. Made a digital coverage 2001 Completed 2 nd state coast-wide mapping Monitored all waterbodies To conduct 3 rd mapping of state s most stressed waterbodies

66 Poor Water Quality

67 Jehu Pond at Waquoit Bay

68 Lake Tashmoo

69 Land Use in Estuarine Zone Incompatible with habitat requirements
70 A B Minimum-light water quality requirement Median concentration Management trajectories [TSS] Chlorophyll only (µ c, µ s ) TSS only Line of Constant Attenuation Projection to origin 0 0 [Chl ]

71 Establishing the Optical Requirements of Seagrass Light Profiles

72 Establishing the Optical Requirements of Seagrass AC 9 - Water Column Particulates
73
74

75 Improve Wetlands Mapping Data
76 Final Recommendations It s never too late to begin an update to wetlands data Work with local resources (universities, environmental groups) to cooperate. Money may be tight, but in MA they found the money and it proved to be a shrewd investment. Insure the procedures you develop give you the product you want and need.
77 How to get started: Insure that all future statewide aerial imagery acquisitions include as deliverables the stereo viewable raw images. Prioritize area s of state most needing better wetlands data Lobby for funds to get a pilot project started which includes training for staff involvement Set schedule to complete (regardless of duration)

78 Charles Costello, Section Chief Wetlands Mapping Program Dept. Environmental Protection One Winter Street Tel
Summary Description Municipality of Anchorage. Anchorage Coastal Resource Atlas Project
 Summary Description Municipality of Anchorage Anchorage Coastal Resource Atlas Project By: Thede Tobish, MOA Planner; and Charlie Barnwell, MOA GIS Manager Introduction Local governments often struggle
A Comprehensive Inventory of the Number of Modified Stream Channels in the State of Minnesota. Data, Information and Knowledge Management.
 A Comprehensive Inventory of the Number of Modified Stream Channels in the State of Minnesota Data, Information and Knowledge Management Glenn Skuta Environmental Analysis and Outcomes Division Minnesota
Louisiana Transportation Engineering Conference. Monday, February 12, 2007
 Louisiana Transportation Engineering Conference Monday, February 12, 2007 Agenda Project Background Goal of EIS Why Use GIS? What is GIS? How used on this Project Other site selection tools I-69 Corridor
National Wetlands Inventory Update for New England 2009
 National Wetlands Inventory Update for New England 2009 Ralph Tiner Wetland Ecologist U.S. Fish & Wildlife Service National Wetlands Inventory Program Where we ve been Maps Status and trends investigations
Pierce Cedar Creek Institute GIS Development Final Report. Grand Valley State University
 Pierce Cedar Creek Institute GIS Development Final Report Grand Valley State University Major Goals of Project The two primary goals of the project were to provide Matt VanPortfliet, GVSU student, the
Appendix I Feasibility Study for Vernal Pool and Swale Complex Mapping
 Feasibility Study for Vernal Pool and Swale Complex Mapping This page intentionally left blank. 0 0 0 FEASIBILITY STUDY BY GIC AND SAIC FOR MAPPING VERNAL SWALE COMPLEX AND VERNAL POOLS AND THE RESOLUTION
Home About Us Articles Press Releases Image Gallery Contact Us Media Kit Free Subscription 10/5/2006 5:56:35 PM
 Home About Us Articles Press Releases Image Gallery Contact Us Media Kit Free Subscription 10/5/2006 5:56:35 PM Industry Resources Industry Directory NASA Links Missions/Launches Calendar Human development
Wetland Mapping. Wetland Mapping in the United States. State Wetland Losses 53% in Lower US. Matthew J. Gray University of Tennessee
 Wetland Mapping Caribbean Matthew J. Gray University of Tennessee Wetland Mapping in the United States Shaw and Fredine (1956) National Wetlands Inventory U.S. Fish and Wildlife Service is the principle
3 SHORELINE CLASSIFICATION METHODOLOGY
 3 SHORELINE CLASSIFICATION METHODOLOGY Introduction The ESI scale, as described in Section 2, categorizes coastal habitats in terms of their susceptibility to spilled oil, taking into consideration a number
NR402 GIS Applications in Natural Resources
 NR402 GIS Applications in Natural Resources Lesson 1 Introduction to GIS Eva Strand, University of Idaho Map of the Pacific Northwest from http://www.or.blm.gov/gis/ Welcome to NR402 GIS Applications in
Huron Creek Watershed 2005 Land Use Map
 Huron Creek Watershed 2005 Land Use Map Created By: Linda Kersten, 12/20/06 Created For: MTU Introduction to GIS Class (FW 5550) The Huron Creek Watershed Advisory Committee Michigan Technological University,
Improvement of the National Hydrography Dataset for Parts of the Lower Colorado Region and Additional Areas of Importance to the DLCC
 Improvement of the National Hydrography Dataset for Parts of the Lower Colorado Region and Additional Areas of Importance to the DLCC Carlos Reyes-Andrade California State University, Northridge September
Introduction-Overview. Why use a GIS? What can a GIS do? Spatial (coordinate) data model Relational (tabular) data model
 data model Relational (tabular) data model") Introduction-Overview Why use a GIS? What can a GIS do? How does a GIS work? GIS definitions Spatial (coordinate) data model Relational (tabular) data model intro_gis.ppt 1 Why use a GIS? An extension
Introduction-Overview Why use a GIS? What can a GIS do? How does a GIS work? GIS definitions Spatial (coordinate) data model Relational (tabular) data model intro_gis.ppt 1 Why use a GIS? An extension
Critical Area Mapping Update Project St. Mary s County Town Hall April 8th, :30 p.m.
 Critical Area Mapping Update Project St. Mary s County Town Hall April 8th, 2019 6:30 p.m. Critical Area Commission for the Chesapeake and Atlantic Coastal Bays St. Mary s County What Is the Critical Area
An Internet-based Agricultural Land Use Trends Visualization System (AgLuT)
") An Internet-based Agricultural Land Use Trends Visualization System (AgLuT) Prepared for Missouri Department of Natural Resources Missouri Department of Conservation 07-01-2000-12-31-2001 Submitted by
An Internet-based Agricultural Land Use Trends Visualization System (AgLuT) Prepared for Missouri Department of Natural Resources Missouri Department of Conservation 07-01-2000-12-31-2001 Submitted by
StreamStats: Delivering Streamflow Information to the Public. By Kernell Ries
 StreamStats: Delivering Streamflow Information to the Public By Kernell Ries U.S. Department of the Interior U.S. Geological Survey MD-DE-DC District 410-238-4317 kries@usgs.gov StreamStats Web Application
Minimum Standards for Wetland Delineations
 Minimum Standards for Wetland Delineations Jason Gipson Chief, Utah/Nevada Regulatory Branch Sacramento District Regulatory Program Workshop 16 Mar 2016 US Army Corps of Engineers Delineation Report Minimum
Display data in a map-like format so that geographic patterns and interrelationships are visible
 Vilmaliz Rodríguez Guzmán M.S. Student, Department of Geology University of Puerto Rico at Mayagüez Remote Sensing and Geographic Information Systems (GIS) Reference: James B. Campbell. Introduction to
ORTHOPHOTO PROGRAM FREQUENTLY ASKED QUESTIONS
 ORTHOPHOTO PROGRAM FREQUENTLY ASKED QUESTIONS June 4, 2014 Document Purpose The Florida Department of Revenue (DOR) regularly receives questions regarding its orthophoto program. This document answers
STEREO ANALYST FOR ERDAS IMAGINE Stereo Feature Collection for the GIS Professional
 STEREO ANALYST FOR ERDAS IMAGINE Stereo Feature Collection for the GIS Professional STEREO ANALYST FOR ERDAS IMAGINE Has Your GIS Gone Flat? Hexagon Geospatial takes three-dimensional geographic imaging
PRINCIPLES OF PHOTO INTERPRETATION
 PRINCIPLES OF PHOTO INTERPRETATION Photo Interpretation the act of examining photographic images for the purpose of identifying objects and judging their significance an art more than a science Recognition
GIS and Forest Engineering Applications FE 257 Lecture and laboratory, 3 credits
 GIS and Forest Engineering Applications FE 257 Lecture and laboratory, 3 credits Instructor: Michael Wing Associate Professor Forest Engineering, Resources, and Management Oregon State University Crop
Welcome to NR502 GIS Applications in Natural Resources. You can take this course for 1 or 2 credits. There is also an option for 3 credits.
 Welcome to NR502 GIS Applications in Natural Resources. You can take this course for 1 or 2 credits. There is also an option for 3 credits. The 1st credit consists of a series of readings, demonstration,
GIS APPLICATIONS IN SOIL SURVEY UPDATES
 GIS APPLICATIONS IN SOIL SURVEY UPDATES ABSTRACT Recent computer hardware and GIS software developments provide new methods that can be used to update existing digital soil surveys. Multi-perspective visualization
McHenry County Property Search Sources of Information
 Disclaimer: The information in this system may contain inaccuracies or typographical errors. The information in this system is a digital representation of information derived from original documents; as
Statewide wetland geospatial inventory update
 Statewide wetland geospatial inventory update Factsheet 1: Outcomes from the statewide wetland geospatial inventory update 1 Introduction In 2011 the Victorian Department of Environment and Primary Industries
Photographs to Maps Using Aerial Photographs to Create Land Cover Maps
 Aerial photographs are an important source of information for maps, especially land cover and land use maps. Using ArcView, a map composed of points, lines, and areas (vector data) can be constructed from
A Help Guide for Using gssurgo to Find Potential Wetland Soil Landscapes
 A Help Guide for Using gssurgo to Find Potential Wetland Soil Landscapes Wetland Mapping Consortium Webinar September 17, 2014 Dr. John M. Galbraith Crop & Soil Environmental Sciences Virginia Tech Wetland
Detecting Landscape Changes in High Latitude Environments Using Landsat Trend Analysis: 2. Classification
 1 Detecting Landscape Changes in High Latitude Environments Using Landsat Trend Analysis: 2. Classification Ian Olthof and Robert H. Fraser Canada Centre for Mapping and Earth Observation Natural Resources
SIF_7.1_v2. Indicator. Measurement. What should the measurement tell us?
 Indicator 7 Area of natural and semi-natural habitat Measurement 7.1 Area of natural and semi-natural habitat What should the measurement tell us? Natural habitats are considered the land and water areas
1.1 What is Site Fingerprinting?
 Site Fingerprinting Utilizing GIS/GPS Technology 1.1 What is Site Fingerprinting? Site fingerprinting is a planning tool used to design communities where protection of natural resources is the primary
CHAPTER 7 PRODUCT USE AND AVAILABILITY
 CHAPTER 7 PRODUCT USE AND AVAILABILITY Julie Prior-Magee Photo from SWReGAP Training Site Image Library Recommended Citation Prior-Magee, J.S. 2007. Product use and availability. Chapter 7 in J.S. Prior-Magee,
Application of GIS and remote sensing in conservation of vernal pools
 Priyanka Patel NRS 509 12/16/2014 Application of GIS and remote sensing in conservation of vernal pools Vernal pools are small temporary water bodies that contain water for some parts of the year. They
The Use of Geographic Information Systems to Assess Change in Salt Marsh Ecosystems Under Rising Sea Level Scenarios.
 The Use of Geographic Information Systems to Assess Change in Salt Marsh Ecosystems Under Rising Sea Level Scenarios Robert Hancock The ecological challenges presented by global climate change are vast,
UPDATING THE MINNESOTA NATIONAL WETLAND INVENTORY
 UPDATING THE MINNESOTA NATIONAL WETLAND INVENTORY An Integrated Approach Using Object-Oriented Image Analysis, Human Air-Photo Interpretation and Machine Learning AARON SMITH EQUINOX ANALYTICS INC. FUNDING
Development and Land Use Change in the Central Potomac River Watershed. Rebecca Posa. GIS for Water Resources, Fall 2014 University of Texas
 Development and Land Use Change in the Central Potomac River Watershed Rebecca Posa GIS for Water Resources, Fall 2014 University of Texas December 5, 2014 Table of Contents I. Introduction and Motivation..4
Aerial Photography and Imagery Resources Guide
 Aerial Photography and Imagery Resources Guide Cheyenne and Laramie County Cooperative GIS Created and Maintained by the GIS Coordinator for the Cooperative GIS Program March 2011 CHEYENNE / LARAMIE COUNTY
Chapter 1 Overview of Maps
 Chapter 1 Overview of Maps In this chapter you will learn about: Key points when working with maps General types of maps Incident specific maps Map legend and symbols Map sources A map is a navigational
Virginia Shoreline Mapping Tools
 Virginia Shoreline Mapping Tools December 15, 2017 Karen Duhring Center for Coastal Resources Management Virginia Institute of Marine Science College of William & Mary Virginia Shoreline Mapping Tools
Delineation of high landslide risk areas as a result of land cover, slope, and geology in San Mateo County, California
 Delineation of high landslide risk areas as a result of land cover, slope, and geology in San Mateo County, California Introduction Problem Overview This project attempts to delineate the high-risk areas
Sea Level Rise and the Scarborough Marsh Scarborough Land Trust Annual Meeting April 24, 2018
 Sea Level Rise and the Scarborough Marsh Scarborough Land Trust Annual Meeting April 24, 2018 Peter A. Slovinsky, Marine Geologist Maine Geological Survey Funded by: 50% 40% Figure modified from Griggs,
Overview of Methods. Terrestrial areas that are most important for conservation Conservation
 Overview of Methods The goal of the Western Lake Erie Coastal Conservation Vision project (WLECCV) is to define where we should be working locally to optimally achieve regional conservation impact. The
EBA Engineering Consultants Ltd. Creating and Delivering Better Solutions
 EBA Engineering Consultants Ltd. Creating and Delivering Better Solutions ENHANCING THE CAPABILITY OF ECOSYSTEM MAPPING TO SUPPORT ADAPTIVE FOREST MANAGEMENT Prepared by: EBA ENGINEERING CONSULTANTS LTD.
Image Interpretation and Landscape Analysis: The Verka River Valley
 Image Interpretation and Landscape Analysis: The Verka River Valley Terms of reference Background The local government for the region of Scania has a need for improving the knowledge about current vegetation
MISSOURI LiDAR Stakeholders Meeting
 MISSOURI LiDAR Stakeholders Meeting East-West Gateway June 18, 2010 Tim Haithcoat Missouri GIO Enhanced Elevation Data What s different about it? Business requirements are changing.fast New data collection
Geospatial Data, Services, and Products. National Surveying, mapping and geospatial conference
 Geospatial Data, Services, and Products Federal Programs -- USDA NRCS National Surveying, mapping and geospatial conference March 15, 2016 NRCS Applications using Geosaptial Products & Services Field
ESRI NONPROFIT/CONSERVATION GRANTS PROGRAM STATUS REPORT JANUARY 2010
 ESRI NONPROFIT/CONSERVATION GRANTS PROGRAM STATUS REPORT JANUARY 2010 Grantee ESRI Client Number 150983 FARMINGTON RIVER WATERSHED ASSOCIATION 749 Hopmeadow Street, Simsbury, Connecticut 06070 Contact:
GIS-Based Sediment Quality Database for the St. Louis River Area of Concern (AOC): Overview Presentations and Demonstration
: Overview Presentations and Demonstration") GIS-Based Sediment Quality Database for the St. Louis River Area of Concern (AOC): Overview Presentations and Demonstration Judy L. Crane 1 and Dawn E. Smorong 2 1 Minnesota Pollution Control Agency, St.
GIS-Based Sediment Quality Database for the St. Louis River Area of Concern (AOC): Overview Presentations and Demonstration Judy L. Crane 1 and Dawn E. Smorong 2 1 Minnesota Pollution Control Agency, St.
Sources of Imagery and GIS Data Layers (Last updated October 2005)
") Sources of Imagery and GIS Data Layers (Last updated October 2005) The question of where to find data is one often asked by beginners in precision agriculture and other geospatial projects. The following
Sources of Imagery and GIS Data Layers (Last updated October 2005) The question of where to find data is one often asked by beginners in precision agriculture and other geospatial projects. The following
Lecture 9: Reference Maps & Aerial Photography
 Lecture 9: Reference Maps & Aerial Photography I. Overview of Reference and Topographic Maps There are two basic types of maps? Reference Maps - General purpose maps & Thematic Maps - maps made for a specific
To: Ross Martin, Lisa Stapleton From: Brad Lind Subject: Joint Funding Agreement with USGS for 2012 Imagery Date: March 14, 2012.
 To: Ross Martin, Lisa Stapleton From: Brad Lind Subject: Joint Funding Agreement with USGS for 2012 Imagery Date: March 14, 2012 Attached are two copies of the Joint Funding Agreement (JFA) between SanGIS
Geospatial Technologies for the Agricultural Sciences
 Geospatial Technologies for the Agricultural Sciences Maggi Kelly Assoc. Cooperative Extension Specialist Department of Environmental Science, Policy & Management Director, GIIF UC Berkeley Karin Tuxen
LAND COVER CHANGES IN ROMANIA BASED ON CORINE LAND COVER INVENTORY
 LAND COVER CHANGES IN ROMANIA BASED ON CORINE LAND COVER INVENTORY 1990 2012 JENICĂ HANGANU, ADRIAN CONSTANTINESCU * Key-words: CORINE Land Cover inventory, Land cover changes, GIS. Abstract. From 1990
What s New in Topographic Information - USGS National Map
 + What s New in Topographic Information - USGS National Map SARGIS Workshop November 14, 2016 Rob Dollison, 703-648-5724 rdollison@usgs.gov + USGS 2 National Geospatial Program The National Geospatial
Esri Image & Mapping Forum 9 July 2017 Geiger-Mode for Conservation Planning & Design by USDA NRCS NGCE
 Esri Image & Mapping Forum 9 July 2017 Geiger-Mode for Conservation Planning & Design by USDA NRCS NGCE For over 75 years, the Natural Resources Conservation Service has been a pioneer in conservation,
Indiana GIS Resources
 Indiana GIS Resources National Association of Water Companies September 21, 2017 Jim Sparks Indiana Geographic Information Officer ABOUT THE INDIANA GEOGRAPHIC INFORMATION OFFICE I.C. 4-23-7.3 Indiana
Appendix J Vegetation Change Analysis Methodology
 Appendix J Vegetation Change Analysis Methodology Regional Groundwater Storage and Recovery Project Draft EIR Appendix-J April 2013 APPENDIX J- LAKE MERCED VEGETATION CHANGE ANALYSIS METHODOLOGY Building
Phase 6 Land Use Database version 1
 Phase 6 Land Use Database version 1 Peter Claggett, Fred Irani, Quentin Stubbs, and Renee Thompson. June 11, 2015 Modeling Workgroup Meeting USGS MD-DE-DC Water Science Center U.S. Department of the Interior
NOAA s OCM: Services, tools and collaboration opportunities & Puerto Rico s NE Marine Corridor as a case study
 NOAA s OCM: Services, tools and collaboration opportunities & Puerto Rico s NE Marine Corridor as a case study Dr. Antares Ramos Álvarez NOAA s Office of Coastal Management September 15 th, 2016 Conservation
Development of Webbased. Tool for Tennessee
 Development of Webbased Farm Mapping Tool for Tennessee Southern Region Water Quality Conference, Oct. 24 2005 Forbes Walker and Alan Jolly Biosystems Engineering and SOIL SCIENCE Nutrient Management Planning
Introduction to Geographic Information Systems (GIS): Environmental Science Focus
: Environmental Science Focus") Introduction to Geographic Information Systems (GIS): Environmental Science Focus September 9, 2013 We will begin at 9:10 AM. Login info: Username:!cnrguest Password: gocal_bears Instructor: Domain: CAMPUS
Introduction to Geographic Information Systems (GIS): Environmental Science Focus September 9, 2013 We will begin at 9:10 AM. Login info: Username:!cnrguest Password: gocal_bears Instructor: Domain: CAMPUS
Use of Elevation Data in NOAA Coastal Mapping Shoreline Products. Coastal GeoTools April 1, 2015
 Use of Elevation Data in NOAA Coastal Mapping Shoreline Products Coastal GeoTools April 1, 2015 - NOAA s Coastal Mapping Program & CUSP - Shoreline Uses, Delineation Issues, Definitions - Current Extraction
Aerial Photography and Imagery Resources Guide
 Aerial Photography and Imagery Resources Guide Cheyenne and Laramie County Cooperative GIS Created and Maintained by the GIS Coordinator for the Cooperative GIS Program May 2016 CHEYENNE / LARAMIE COUNTY
EO Information Services. Assessing Vulnerability in the metropolitan area of Rio de Janeiro (Floods & Landslides) Project
 Project") EO Information Services in support of Assessing Vulnerability in the metropolitan area of Rio de Janeiro (Floods & Landslides) Project Ricardo Armas, Critical Software SA Haris Kontoes, ISARS NOA World
EO Information Services in support of Assessing Vulnerability in the metropolitan area of Rio de Janeiro (Floods & Landslides) Project Ricardo Armas, Critical Software SA Haris Kontoes, ISARS NOA World
Syllabus Reminders. Geographic Information Systems. Components of GIS. Lecture 1 Outline. Lecture 1 Introduction to Geographic Information Systems
 Syllabus Reminders Geographic Information s Lecture Introduction to Geographic Information s. Class Info: www.saigis.com/class/ 2. Office T / TH (8:00-9:30 a.m.) and (2:30 3:30pm) or Appt 3. Email: burgerpr@unk.edu
Digital Tax Maps Westport Island Project Summary
 Digital Tax Maps Westport Island Project Summary Presented to the: Mid-Coast Regional Planning Commission Creating GIS-Based Digital Tax Maps And Linked Assessment Records For Small Towns on a Budget Dennis
Current and Future Technology Applications for Coastal Zone Management. Bruce K. Carlisle, Acting Director Office of Coastal Zone Management
 Current and Future Technology Applications for Coastal Zone Management Bruce K. Carlisle, Acting Director Office of Coastal Zone Management The Massachusetts Coastal Zone Management Program Approved in
SoilView: Development of a Custom GIS Application for Publishing Soil Surveys
 SoilView: Development of a Custom GIS Application for Publishing Soil Surveys Allan Johnson and Mike Wigginton Abstract Currently, digital soils information can be obtained from many sources. Numerous
Manitoba s Elevation (LiDAR) & Imagery Datasets. Acquisition Plans & Opportunities for Collaboration
 & Imagery Datasets. Acquisition Plans & Opportunities for Collaboration") Manitoba s Elevation (LiDAR) & Imagery Datasets Acquisition Plans & Opportunities for Collaboration Manitoba Planning Conference May 2017 Presentation Outline Manitoba s Elevation (LiDAR) and Imagery Datasets
Manitoba s Elevation (LiDAR) & Imagery Datasets Acquisition Plans & Opportunities for Collaboration Manitoba Planning Conference May 2017 Presentation Outline Manitoba s Elevation (LiDAR) and Imagery Datasets
Watershed Modeling Orange County Hydrology Using GIS Data
 v. 10.0 WMS 10.0 Tutorial Watershed Modeling Orange County Hydrology Using GIS Data Learn how to delineate sub-basins and compute soil losses for Orange County (California) hydrologic modeling Objectives
United States Department of the Interior NATIONAL PARK SERVICE Northeast Region
 United States Department of the Interior NATIONAL PARK SERVICE Northeast Region June 17, 2017 REQUEST FOR STATEMENTS OF INTEREST and QUALIFICATIONS Project Title: ASSESSMENT OF NATURAL RESOURCE CONDITION
Base Level Engineering FEMA Region 6
 Base Level Engineering Over the past five years, has been evaluating its investment approach and data preparation work flow to establish an efficient and effective change in operation, generating an approach
Waterborne Environmental, Inc., Leesburg, VA, USA 2. Syngenta Crop Protection, LLC, North America 3. Syngenta Crop Protection, Int.
 Application of High Resolution Elevation Data (LiDAR) to Assess Natural and Anthropogenic Agricultural Features Affecting the Transport of Pesticides at Multiple Spatial Scales Josh Amos 1, Chris Holmes
McHenry County Property Search Sources of Information
 Disclaimer: The information in this system may contain inaccuracies or typographical errors. The information in this system is a digital representation of information derived from original documents; as
Resolving habitat classification and structure using aerial photography. Michael Wilson Center for Conservation Biology College of William and Mary
 Resolving habitat classification and structure using aerial photography Michael Wilson Center for Conservation Biology College of William and Mary Aerial Photo-interpretation Digitizing features of aerial
Potential Restorable Wetlands (PRWs):
:") ASWM Webinar Sept. 17, 2014 Potential Restorable Wetlands (PRWs): Working definition: wetland hydrology and soils minus presently mapped wetlands for the re-establishment of wetlands Hydric Soil Query
ASWM Webinar Sept. 17, 2014 Potential Restorable Wetlands (PRWs): Working definition: wetland hydrology and soils minus presently mapped wetlands for the re-establishment of wetlands Hydric Soil Query
USGS Hydrography Overview. May 9, 2018
 + 1 USGS Hydrography Overview May 9, 2018 + 2 The National Geospatial Program Provides the geospatial baseline of the Nation s topography, natural landscape and built environment through The National Map,
Delineation of Watersheds
 Delineation of Watersheds Adirondack Park, New York by Introduction Problem Watershed boundaries are increasingly being used in land and water management, separating the direction of water flow such that
THE DELINEATION OF WETLANDS IN THE WQODHAVEN VILLAGE DEVELOPMENT THE OLD BRIDGE PLANNING BOARD
 A" oii CA002364E REPORT ON THE DELINEATION OF WETLANDS IN THE WQODHAVEN VILLAGE DEVELOPMENT AREA Presented to: THE OLD BRIDGE PLANNING BOARD Presented by: Norbert P. Psuty Charles T. Roman MAY 13, 1986
GIS Lecture 5: Spatial Data
 GIS Lecture 5: Spatial Data GIS 1 Outline Vector Data Formats Raster Data Formats Map Projections Coordinate Systems US Census geographic files US Census data files GIS Data Sources GIS 2 Vector Data Formats
New Land Cover & Land Use Data for the Chesapeake Bay Watershed
 New Land Cover & Land Use Data for the Chesapeake Bay Watershed Why? The Chesapeake Bay Program (CBP) partnership is in the process of improving and refining the Phase 6 suite of models used to inform
Pictometry GIS and Integration Solutions. Presented by Peter White, GISP GIS Product Manager, Pictometry International Corp.
 Pictometry GIS and Integration Solutions Presented by Peter White, GISP GIS Product Manager, Pictometry International Corp. 1. Pictometry Web Integration Solutions 2. Advanced LiDAR Sensor and Solutions
NCTCOG Regional GIS Meeting 6-Years and Going Strong. May 15, 2018 hosted by: Tarrant County
 NCTCOG Regional GIS Meeting 6-Years and Going Strong May 15, 2018 hosted by: Tarrant County Woolpert at a Glance 1911 Founded in Dayton, Ohio 25+ Offices across the nation 800+ Global employees 25+ OFFICES
Mapping Maine s Working Waterfront: for Our Heritage and Economy
 Mapping Maine s Working Waterfront: for Our Heritage and Economy Abstract Mapping Maine s Working Waterfronts is a collaborative project led by the Island Institute that inventories the state s current
BIODIVERSITY CONSERVATION HABITAT ANALYSIS
 BIODIVERSITY CONSERVATION HABITAT ANALYSIS A GIS Comparison of Greater Vancouver Regional Habitat Mapping with Township of Langley Local Habitat Mapping Preface This report was made possible through the
Introduction INTRODUCTION TO GIS GIS - GIS GIS 1/12/2015. New York Association of Professional Land Surveyors January 22, 2015
 New York Association of Professional Land Surveyors January 22, 2015 INTRODUCTION TO GIS Introduction GIS - GIS GIS 1 2 What is a GIS Geographic of or relating to geography the study of the physical features
Vegetation and Wildlife Habitat Mapping Study in the Upper and Middle Susitna Basin Study Plan Section 11.5
 (FERC No. 14241) Vegetation and Wildlife Habitat Mapping Study in the Upper and Middle Susitna Basin Study Plan Section 11.5 Initial Study Report Part C: Executive Summary and Section 7 Prepared for Prepared
NAVAJO NATION PROFILE
 NAVAJO NATION PROFILE Largest land based area and federally recognized tribe in the United States Over 27,000 square miles (or 17.2 million acres with a population of over 300,000 people. Covers Arizona,
GeoWEPP Tutorial Appendix
 GeoWEPP Tutorial Appendix Chris S. Renschler University at Buffalo - The State University of New York Department of Geography, 116 Wilkeson Quad Buffalo, New York 14261, USA Prepared for use at the WEPP/GeoWEPP
Southern California Coastal Water Research Project. Sharon De Leon. California State University Northridge. June 19, May 2013
 Southern California Coastal Water Research Project Sharon De Leon California State University Northridge June 19, 2012- May 2013 Shawna Dark, Center of Geographical Studies, California State University
Quality and Coverage of Data Sources
 Quality and Coverage of Data Sources Objectives Selecting an appropriate source for each item of information to be stored in the GIS database is very important for GIS Data Capture. Selection of quality
Leveraging LiDAR for Statewide NHD Hydrography Projects. Susan Phelps, CFM, GISP
 Leveraging LiDAR for Statewide NHD Hydrography Projects Susan Phelps, CFM, GISP Mon, July 11 th, 2016 National Hydrography Dataset (NHD) Background Why Local-Res NHD? Drivers Include: Availability of accurate
Creating A-16 Compliant National Data Theme for Cultural Resources
 Creating A-16 Compliant National Data Theme for Cultural Resources Cultural Resource GIS Facility National Park Service John J. Knoerl Deidre McCarthy Paper 169 Abstract OMB Circular A-16 defines a set
CUYAHOGA COUNTY URBAN TREE CANOPY & LAND COVER MAPPING
 CUYAHOGA COUNTY URBAN TREE CANOPY & LAND COVER MAPPING FINAL REPORT M IKE GALVIN S AVATREE D IRECTOR, CONSULTING GROUP P HONE: 914 403 8959 E MAIL: MGALVIN@SAVATREE. COM J ARLATH O NEIL DUNNE U NIVERSITY
Quick Response Report #126 Hurricane Floyd Flood Mapping Integrating Landsat 7 TM Satellite Imagery and DEM Data
 Quick Response Report #126 Hurricane Floyd Flood Mapping Integrating Landsat 7 TM Satellite Imagery and DEM Data Jeffrey D. Colby Yong Wang Karen Mulcahy Department of Geography East Carolina University
Introduction: The Gulf of Mexico Alliance. The Gulf GAME project MERMAid and PHINS Results & Conclusions What s next? Examples
 AAG Las Vegas March 25, 2009 Introduction: Ocean governance and Ecosystem-Based Management The Gulf of Mexico Alliance Habitat Identification and Characterization The Gulf GAME project MERMAid and PHINS
Hydric Rating by Map Unit Harrison County, Mississippi. Web Soil Survey National Cooperative Soil Survey
 89 9' 7'' W 89 8' 38'' W 30 34' 13'' N 30 33' 57'' N 3383480 3383560 3383640 3383720 3383800 3383880 3383960 293640 293720 293800 293880 293960 294040 294120 294200 294280 294360 3383480 3383560 3383640
GRAPEVINE LAKE MODELING & WATERSHED CHARACTERISTICS
 GRAPEVINE LAKE MODELING & WATERSHED CHARACTERISTICS Photo Credit: Lake Grapevine Boat Ramps Nash Mock GIS in Water Resources Fall 2016 Table of Contents Figures and Tables... 2 Introduction... 3 Objectives...
Satellite Imagery: A Crucial Resource in Stormwater Billing
 Satellite Imagery: A Crucial Resource in Stormwater Billing May 10, 2007 Carl Stearns Engineering Technician Department of Public Works Stormwater Services Division Sean McKnight GIS Coordinator Department
Baseline Estuarine-Upland Transition Zone
 Baseline Estuarine-Upland Transition Zone in SF, San Pablo and Suisun Bays 10/5/18 Prepared for San Francisco Bay Joint Venture (SFBJV) Prepared by Brian Fulfrost, Principal bfaconsult@gmail.com with additional