Comparing Internal Migration Around the GlobE (IMAGE): The Effects of Scale and Pattern
|
|
|
- Nelson Horn
- 5 years ago
- Views:
Transcription
1 Comparing Internal Migration Around the GlobE (IMAGE): The Effects of Scale and Pattern International Conference on Population Geographies, June 2013 Martin Bell, Elin Charles Edwards 1 John Stillwell, Konstantinos Daras 2 Marek Kupiszewski 3, Dorota Kupiszewska 4 and Yu Zhu 5 1. The University of Queensland, Australia 2. The University of Leeds, UK 3. Institute of Geography and Spatial Organization, PAS, Poland 4. International Organization for Migration, Poland 5. Fujian Normal University, China
2 The IMAGE Project An international collaborative program which aims to provide a robust basis for comparing internal migration between countries around the world Funded by Australian Research Council Discovery Project Project duration: The IMAGE Global Inventory of Internal Migration data The IMAGE Repository of Internal Migration data The IMAGE Studio Computes internal migration metrics Addresses key methodological issues
3 Outline Update on the IMAGE Inventory Update on IMAGE Repository Introduction to the IMAGE Studio Comparison of metrics for 15 countries with a focus on intensity, distance and impact Investigation of the MAUP scale effects and pattern effects Conclusions and next steps
4 IMAGE Inventory of Internal Migration Data Meta-data Collection Instrument Form of data Time interval Spatial framework Characteristics Values Census/Register/Survey Transitions/Events/Duration 1,2,5,other, undefined All moves, # of zones Age, sex Sources Systematic mining of census forms, surveys and websites Review of published papers and reports Advice from IMAGE project collaborators and country experts Survey of national statistical agencies
5 Summary of Countries Collecting Internal Migration Data by Region and Source Region Countries Data sources Census Register Survey Africa Asia Europe Latin America North America Oceania TOTAL
6 Building the IMAGE Repository of Internal Migration Data Collections Data assembled in the Repository National counts of all moves (by age) Origin-destination matrices (aggregate) Marginal totals (aggregate) Populations at risk Digital boundaries Number of zones Countries < > TOTAL 94
7 The IMAGE Studio The IMAGE studio is a flexible suite of software adaptable to a range of country-specific data inputs organized as a set of four linked subsystems: i. Data Preparation, ii. Spatial Aggregation, iii. Computation of Internal Migration Indicators, iv.spatial Interaction Modelling

8 IMAGE Studio: Framework


9 IMAGE Studio Subsystem Interfaces Data Preparation Spatial Aggregation Internal Migration Indicators Spatial Interaction Modelling
10 Why spatial aggregation? Every country has unique Basic Spatial Units (BSUs) different size (area and population) and shape (boundaries) Migration indicators depend upon how space is divided: MAUP (Openshaw 1984) Scale component: How does the indicator vary according to the number of Aggregated Spatial Regions (ASRs)? Pattern component: How does the indicator vary according to the configuration of ASRs at any spatial scale? We address the MAUP using a system which aggregates BSUs in a stepwise manner to identify the scale effect At each step, a series of random configurations of ASRs are produced to capture the pattern effect
11 Aggregation procedure Original Data Prepare boundary data, migration flow matrix and populations at risk for BSUs Manual Input Set step size, number of configurations and spatial aggregation method Data preparation Clean Data Store Data Generate a contiguity matrix for BSUs Set step size and number of configurations at each level Choose spatial aggregation method True True For Each level For Each conf. False False Store Data Run Spatial Aggregation Algorithm F
 Select 2 random seeds 1 4 3 5 2 12 13 14 15 16 11 10 9 3) Assign the")
 1 4 3 5 2 12 13 14 15 16 11 10")
12 IRA-wave Algorithm Basic Spatial Units (16 BSUs) ) Select all neighbouring areas ) Select 2 random seeds ) Assign the selected areas to region Final Aggregation to Aggregate Spatial Regions (2 ASRs)

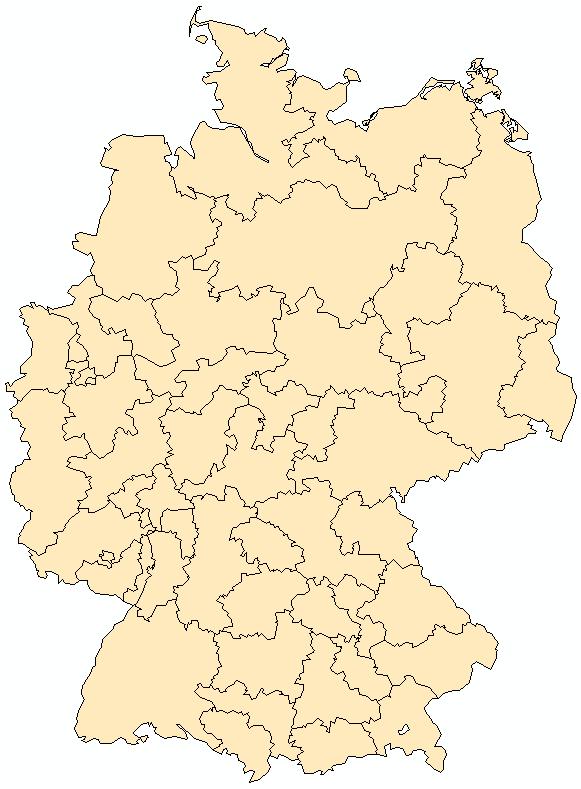

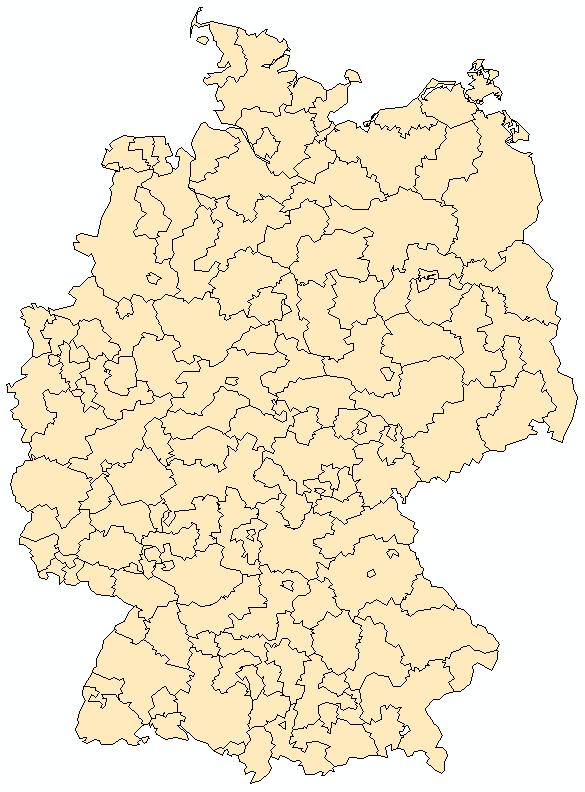


13 Example of aggregation: Germany 412 BSUs 200 ASRs 150 ASRs 100 ASRs 50 ASRs 10 ASRs
14 Comparisons between countries Sample of 15 countries with larger numbers of Basic Spatial Units Cross-national comparisons on three dimensions using six indicators Analysis of scale effects and pattern effects on each indicator Spatial aggregation using IRA wave with steps of 10 and 100 iterations at each step At each scale step, we take the indicator mean of the 100 configurations but also capture variation from the coefficient of variation or the maximum and minimum values for each set of ASRs
15 Sample countries Country Data type Year # BSU 1 Ghana 5yr Transition Brazil 5yr Transition Chile 5yr Transition Ecuador 5yr Transition Honduras 5yr Transition Mexico 5yr Transition ,439 7 Philippines 5yr Transition ,622 8 Canada 5yr Transition South Korea 5yrTransition Australia 1yr/5yr Transition United Kingdom 1yrTransition/Event 2001, Belgium Event Finland Event Germany Event Sweden Event
16 3 1Y transition Total Migrants 12 5Y transition Migrants (Millions) Australia UK 10 Migrants (Millions) Australia Canada Mexico Ghana Philippines Brazil Chile Ecuador Honduras S Korea Number of ASRs Number of ASRs 3 Events 2.5 Migrants (Millions) Belgium* Finland Germany Sweden Number of ASRs
17 Indicators of Internal Migration Dimensions identified in Bell et al. (2002) Journal of the Royal Statistical Society A Migration Intensity Migration Distance Migration Connectivity Migration Impact 1 Crude Migration Intensity 2 Standardized Migration Intensity 3 Gross Migraproduction Rate 4 Migration Expectancy 5 Courgeau s K 6 Peak Migration Intensity 7 Age at Peak Intensity 8 Mean/Median Distance Moved 9 Distance Decay Parameter 10 Index of Migration Connectivity 11 Index of Migration Inequality 12 Migration Weighted Gini 13 Coefficient of Variation 14 Migration Effectiveness Index 15 Aggregate Net Migration Rate
18 Comparing Migration Intensities A migration intensity is the proportion of a population changing residence in a specified time interval Encompasses both migration rates and probabilities Crude migration Intensity (CMI) is the migration count (M) divided by the population at risk (P): CMI R = M R / P where R is the number of ASRs Prior work (Long 1991; Bogue et al. 2010; Courgeau 1973)
19 Building on Courgeau s k Value of CMI n depends on the number of zones (n) Courgeau (1973) plotted CMI at multiple scales to define a linear relationship (k) Courgeau et al. (2012) plots CMI against ln [average households (H) per zone (n)] Algebraically, CMI n = a + b ln (H/n) When H/n = 1 (i.e. average of 1 household per zone) then CMI n = a (representing overall mobility) Simultaneously addresses the scale and pattern components of MAUP for migration intensities
20 Using the Courgeau et al. (2012) method year event Estimated overall mobility (a) Crude Migration Intensity (%) Sweden_E Germany_E Belgium_E Finland_E Ln (No of Households / No of ASRs)
21 CMIs using Courgeau s method Country R 2 Estimated CMIs (all moves) ranked Observed CMIs (all moves) Event Finland Event Belgium Event Sweden Event Germany Y transition Australia Y transition UK Y transition Australia Y transition Chile Y transition Canada Y transition South Korea Y transition Ghana Y transition Brazil Y transition Ecuador Y transition Honduras Y transition Mexico Y transition Philippines
22 Australia, 1 year transition Australia 1Y Australia(obs) Crude Migration Intensity (%) y = x y = x x ln (No of Households / No of ASRs) The relationship between CMI and distance may not always be linear
23 Comparing Migration Distance Many studies have identified the negative influence of distance on migration since Ravenstein s law in 1885 indicating that The majority of migrants go only a short distance including: Stewart (1941); Zipf (1946); Lee (1966); Lowry (1966); Wilson (1967); Tobler (1970); Stillwell (1978); Fotheringham (1980); Flowerdew (1982); Plane (1984);.. and more recently: ODPM (2002); Fotheringham et al. (2004); Kalogirou (2005);. Dennett and Wilson (2011);... Range of different model formulations and calibration methods for capturing the frictional effect of distance
24 Spatial Interaction Model (SIM) Modelling would typically involve calibrating a model for a selected set of BSUs, e.g. fitting a doubly constrained SIM: M ij = A i O i B j D j d ij -β where O i = the out-migration from zone i to all other zones D j = the in-migration to zone j from all other zones A i and B j = balancing factors that ensure the constraints are satisfied d ij - β = a linear distance decay function with parameter β Mean distance migrated (MDM) is computed directly based on inter-bsu migration flow and distance matrices MDM = Σ i j Σ j i M ij d ij / Σ i j Σ j i M ij
25 Key question What happens to the β parameter and MDM and when we progressively aggregate each set of Basic Spatial Units (BSUs) to Aggregated Spatial Regions (ASRs)? At each scale step, we take the mean β and MDM values of the 100 configurations but also capture variation from the maximum and minimum values for each set of ASRs These sets of values for different spatial levels tell us more about the inverse migration v distance relationship than values for single geographies
26 Mean Mean Distance Distance Migrated Migrated (Km) (Km) Mean Migration Distance by number of ASRs Finland UK Germany Finland Sweden Sweden UK Australia Number of ASRs
27 Decay parameter by number of ASRs Beta Value UK Germany Sweden 1 Finland Australia Number of ASRs
28 Decay parameters using SIM Event 1yr MDM > 200 km MDM < 200 km GROUP Mean Beta Value A/A Country Data type # BSU All BSUs 50 ASRs ASRs ASRs 1 Ecuador 5yr Transition South Korea 5yr Transition Ghana 5yr Transition Philippines 5yr Transition 1, Honduras 5yr Transition Brazil 5yr Transition Mexico 5yr Transition 2, a Australia 5yr Transition Chile 5yr Transition Canada 5yr Transition United Kingdom 1yr Transition b Australia 1yr Transition Belgium Event Germany Event Finland Event Sweden Event
29 Comparing migration impact The most significant aspect of internal migration is how it alters the spatial distribution of populations Does impact vary at different spatial scales and between countries? How do we measure this impact? Aggregate net migration rate ANMR = 100 * 0.5 i D i -O i / P D i = inflows to i, O i = outflows from i, P = total population ANMR represents the net system-wide redistribution per 100 persons
30 Aggregate Net Migration Rate by number of ASRs year events Aggregate Net Migration Rate Finland Germany Number of ASRs
31 Aggregate Net Migration Rate by ln (number of ASRs) year events Aggregate Net Migration Rate Aggregate Net Migation Rate ln (Number of ASRs) year transition Belgium Finland Germany Sweden Australia Ghana Honduras Brazil Mexico Ecuador Chile ln (Number of ASRs) Philippines
32 Determinants of ANMR ANMR = MEI * CMI / 100 where Migration Effectiveness Index (MEI) measures the overall degree of symmetry between inflows and outflows within a migration system MEI = 100 * i D i -O i / i (D i +O i ) MEI captures the net system-wide redistribution per 100 migrants


33 Migration Effectivness Index by number of ASRs
34 Relationship between ANMR, CMI and MEI ANMR = MEI * CMI / 100 =
35 CMI and MEI values for 50 and 100 ASR for 5 year transition data by ANMR value No of ASR No of ASR ANMR CMI MEI ANMR CMI MEI South Korea 0,47 9,08 5,13 South Korea 0,59 10,25 5,72 Philippines 0,51 2,80 17,95 Philippines 0,60 3,21 18,78 Mexico 0,81 4,60 17,55 Mexico 0,98 5,12 19,23 Ghana 0,90 5,26 17,02 Brazil 1,11 5,54 20,06 Brazil 0,91 4,86 18,64 Ghana 1,28 5,88 21,78 Australia 1,11 14,32 7,74 Australia 1,31 16,72 7,83 Honduras 1,26 4,81 26,26 Honduras 1,37 5,33 25,69 Ecuador 1,60 6,84 23,44 Ecuador 1,77 7,43 23,80 Chile 1,84 12,10 15,21 Chile 2,23 13,52 16,52 Canada 2,96 10,83 27,32 Canada 3,18 12,25 26,02
36 Patterns of population redistribution (BSUs) Belgium Brazil Net Migration Rate ( per 1000) Net Migration Rate ( per 1000) > Population density (persons per km2) Population density (persons per km2)

37 Conclusions The simplest solution to the MAUP is to pretend it does not exist and hope that the results being produced for ad hoc zoning systems will still be meaningful or least interpretable (Openshaw, 1984)
38 MAUP: Scale Effect Conclusions There are systematic regularities in the behaviour of summary migration indicators in relation to scale These regularities can be useful in estimating parameters at other spatial scales These regularities break down at very coarse levels of aggregation e.g. <30 regions This can be problematic for countries which do not have data at fine levels of spatial disaggregation
39 Conclusions MAUP: Pattern Effect The pattern effect becomes more problematic the smaller the number of ASRs, because variability increases Observed values of internal migration indicators based on standard statistical geographies may be outliers with respect to the mean configurations of zones at equivalent spatial scales and are therefore misleading for crossnational comparisons Both the scale and pattern effects of the MAUP do matter. Our results show they impact on migration in systematic ways. However, these manifest differently between countries.
40 Intensity Conclusions CMI varies systematically with spatial scale Scale effects can be exploited to generate a measure of aggregate population mobility which is comparable across countries Distance The frictional effect of distance varies between countries Countries exhibit systematic variations in the frictional effect of distance which may rise, fall, or remain stable with increasing distance Impact ANMR varies systematically with the CMI with changing scale The MEI is relatively stable except at low numbers of ASRs Differences in the ranking of countries on the ANMR compared with their ranking on the CMI are due to variations in the MEI
41 Next steps How much closer are we to methods for crossnational comparison? CMI: Closer use Courgeau given multiple data points Distance and Impact: Closer - as we now know that distance and impact vary in a well behaved fashion MAUP: explore ASRs based on Objective Functions Equality (e.g. ASRs with equal populations) Similarity (e.g. ASRs with similar population densities) Develop league tables based on key indicators Investigate how the internal migration indicators vary for population sub-groups and over time We invite collaborations using the IMAGE Studio.
Are cross-national comparisons of internal migration really feasible?
 Are cross-national comparisons of internal migration really feasible? Presentation, Second imigmob Conference, University of Plymouth, 12-13 July 2018 John Stillwell, School of Geography, University of
The Impact of Internal Migration on Population Redistribution: An International Comparison
 The Impact of Internal Migration on Population Redistribution: An International Comparison MARTIN BELL * PHILIP REES MAREK KUPISZEWSKI DOROTA KUPISZEWSKA PHILIPP UEFFING AUDE BERNARD ELIN CHARLES-EDWARDS
Spatial Aggregation Methods for Investigating the MAUP Effects in Migration Analysis
 Applied Spatial Analysis and Policy https://doi.org/10.1007/s12061-018-9274-6 Spatial Aggregation Methods for Investigating the MAUP Effects in Migration Analysis John Stillwell 1 & Konstantinos Daras
It has been possible to compare fertility and
 POPULATION, SPACE AND PLACE Published online 9 June 2016 in Wiley Online Library (wileyonlinelibrary.com).2036 The Impact of Internal Migration on Population Redistribution: an International Comparison
Demography, Time and Space
 Demography, Time and Space Martin Bell The University of Queensland WD Borrie Lecture Australian Population Association 2014 Conference Hobart, Tasmania Wednesday December 3rd 2014 Professor WD (Mick)
Refinement of the OECD regional typology: Economic Performance of Remote Rural Regions
 [Preliminary draft April 2010] Refinement of the OECD regional typology: Economic Performance of Remote Rural Regions by Lewis Dijkstra* and Vicente Ruiz** Abstract To account for differences among rural
Final report for the Expert Group on the Integration of Statistical and Geospatial Information, May 2015
 Final report for the Expert Group on the Integration of Statistical and Geospatial Information, May 2015 Global geographic classification and geocoding practices Executive summary This final report was
Global Data Catalog initiative Christophe Charpentier ArcGIS Content Product Manager
 Global Data Catalog initiative Christophe Charpentier ArcGIS Content Product Manager ccharpentier@esri.com We are in a global economy Global Economy Business and Operations are now global Strategic need
Do Policy-Related Shocks Affect Real Exchange Rates? An Empirical Analysis Using Sign Restrictions and a Penalty-Function Approach
 ISSN 1440-771X Australia Department of Econometrics and Business Statistics http://www.buseco.monash.edu.au/depts/ebs/pubs/wpapers/ Do Policy-Related Shocks Affect Real Exchange Rates? An Empirical Analysis
2017 Source of Foreign Income Earned By Fund
 2017 Source of Foreign Income Earned By Fund Putnam Emerging Markets Equity Fund EIN: 26-2670607 FYE: 08/31/2017 Statement Pursuant to 1.853-4: The fund is hereby electing to apply code section 853 for
GLA small area population projection methodology
 Update 2017-04 GLA small area population projection methodology 2015-based projections February 2017 Introduction The GLA produces a range of annually updated demographic projections for London. Among
Appendix B: Detailed tables showing overall figures by country and measure
 44 country and measure % who report that they are very happy Source: World Values Survey, 2010-2014 except United States, Pew Research Center 2012 Gender and Generations survey and Argentina 32% 32% 36%
Exploring Digital Welfare data using GeoTools and Grids
 Exploring Digital Welfare data using GeoTools and Grids Hodkinson, S.N., Turner, A.G.D. School of Geography, University of Leeds June 20, 2014 Summary As part of the Digital Welfare project [1] a Java
International Copper Study Group April 2011 Lisbon, Portugal COPPER The Project Pipeline Presented By: Glen Jones
 International Copper Study Group April 2011 Lisbon, Portugal COPPER The Project Pipeline Presented By: Glen Jones The data contained in this presentation is a snapshot from the live Intierra database.
Long-Term Trends in Spatial Mobility in Sweden: An Order-Specific Analysis of Migration of Young Adults
 Long-Term Trends in Spatial Mobility in Sweden: An Order-Specific Analysis of Migration of Young Adults Hill Kulu, Gunnar Malmberg and Emma Lundholm The aim of this study is to investigate spatial mobility
The Raman Spectroscopy of Graphene and the Determination of Layer Thickness
 Application Note: 52252 The Raman Spectroscopy of Graphene and the Determination of Layer Thickness Mark Wall, Ph.D., Thermo Fisher Scientific, Madison, WI, USA Key Words DXR Raman Microscope 2D Band D
Canadian Imports of Honey
 of 0409000029 - Honey, natural, in containers of a weight > 5 kg, nes (Kilogram) Argentina 236,716 663,087 2,160,216 761,990 35.27% 202.09% /0 76,819 212,038 717,834 257,569 35.88% 205.69% /0 United States
CONTINENT WISE ANALYSIS OF ZOOLOGICAL SCIENCE PERIODICALS: A SCIENTOMETRIC STUDY
 CONTINENT WISE ANALYSIS OF ZOOLOGICAL SCIENCE PERIODICALS: A SCIENTOMETRIC STUDY Mr.Chopkar Hemraj D. Librarian NKSPT S Arts, Science & Commerce College, Badnapur. (MS) India Mr. Phatak Anil Shahaji Research
READY TO SCRAP: HOW MANY VESSELS AT DEMOLITION VALUE?
 READY TO SCRAP: HOW MANY VESSELS AT DEMOLITION VALUE? August 206 VesselsValue Global number of vessels at demolition value At scrap value 7,27 6 Above scrap value,8 84 Number of vessels at demolition value
Developing a global, peoplebased definition of cities and settlements
 Developing a global, peoplebased definition of cities and settlements By Lewis Dijkstra, Lewis.Dijkstra@ec.europa.eu Head of the Economic Analysis Sector DG for Regional and Urban Policy, Regional & Urban
Gravity Analysis of Regional Economic Interdependence: In case of Japan
 Prepared for the 21 st INFORUM World Conference 26-31 August 2013, Listvyanka, Russia Gravity Analysis of Regional Economic Interdependence: In case of Japan Toshiaki Hasegawa Chuo University Tokyo, JAPAN
From Argentina to Zimbabwe: Where Should I Sell my Widgets?
 From Argentina to Zimbabwe: Department of Statistics Texas A&M University 15 Feb 2010 Acknowledgments This is joint work with my coauthors Bani Mallick (Texas A&M University) Debu Talukdar (SUNY - Buffalo)
DISTILLED SPIRITS - EXPORTS BY VALUE DECEMBER 2017
 DISTILLED SPIRITS - EXPORTS BY VALUE DECEMBER 2017 U.S. COMMERCIAL EXPORTS OF DISTILLED SPIRITS - DECEMBER 2017 (U.S. DOLLARS) Da-Value-17-12 SUMMARY BY CLASS CLASS DECEMBER DECEMBER DOLLAR YTD YTD DOLLAR
FORENSIC TOXICOLOGY SCREENING APPLICATION SOLUTION
 FORENSIC TOXICOLOGY SCREENING APPLICATION SOLUTION A purpose-built collection of the best-inclass components for forensic toxicology Whether you re challenged to present reliable and secure forensic sample
Sustainability of balancing item of balance of payment for OECD countries: evidence from Fourier Unit Root Tests
 Theoretical and Applied Economics FFet al Volume XXII (2015), No. 3(604), Autumn, pp. 93-100 Sustainability of balancing item of balance of payment for OECD countries: evidence from Fourier Unit Root Tests
Export Destinations and Input Prices. Appendix A
 Export Destinations and Input Prices Paulo Bastos Joana Silva Eric Verhoogen Jan. 2016 Appendix A For Online Publication Figure A1. Real Exchange Rate, Selected Richer Export Destinations UK USA Sweden
What is PRECIS and what can it do?
 PRECIS: Facilitating capacity building and technology transfer to enable climate change mitigation and adaptation activities worldwide Joseph Intsiful, UNFCCC NWP Meeting, Mexico City 4-7 March 2008 Content:
International Student Enrollment Fall 2018 By CIP Code, Country of Citizenship, and Education Level Harpur College of Arts and Sciences
 International Student Enrollment Fall 2018 By CIP Code, Country of Citizenship, and Education Level Harpur College of Arts and Sciences CIP Code Description Citizenship Graduate Undergrad Total 00.0000
2017 Scientific Ocean Drilling Bibliographic Database Report
 2017 Scientific Ocean Drilling Bibliographic Database Report Covering records related to the Deep Sea Drilling Project, Ocean Drilling Program, Integrated Ocean Drilling Program, and International Ocean
Multimedia on Nuclear Reactor Physics In order to improve education and training quality, a Multimedia on Nuclear Reactor Physics has been developed.
 MULTIMEDIA ON NUCLEAR REACTOR PHYSICS Prof. PhD. Javier Dies, Doctor Engineer Professor Chair in Nuclear Engineering g Upc- Barcelona-Tech, Spain Nuclear Engineering Research Group (NERG), Departament
IPWG recent accomplishments and future directions
 IPWG recent accomplishments and future directions Paul Kucera (NCAR, Boulder, USA) And Bozena Lapeta (IMWM Krakow, Poland) with additions by Volker Gärtner (EUMETSAT, IPWG Rapporteur) IPWG Objectives IPWG
ACCESSIBILITY TO SERVICES IN REGIONS AND CITIES: MEASURES AND POLICIES NOTE FOR THE WPTI WORKSHOP, 18 JUNE 2013
 ACCESSIBILITY TO SERVICES IN REGIONS AND CITIES: MEASURES AND POLICIES NOTE FOR THE WPTI WORKSHOP, 18 JUNE 2013 1. Significant differences in the access to basic and advanced services, such as transport,
Bilateral Labour Agreements, 2004
 Guest Austria Canada Turkey ( 64) Canada, Czech Republic, Hungary ( 98), Belgium Italy ( 46, 54), Turkey ( 64) Bulgaria ( 99), Pol (02) Germany ( 91) Bulgaria ( 99), Mongolia ( 99), Pol ( 92), Russia (
Monica Brezzi (with (with Justine Boulant and Paolo Veneri) OECD EFGS Conference Paris 16 November 2016
 OECD EFGS Conference Paris 16 November 2016") ESTIMATING INCOME INEQUALITY IN OECD METROPOLITAN AREAS Monica Brezzi (with (with Justine Boulant and Paolo Veneri) OECD EFGS Conference Paris 16 November 2016 Outline 1. 2. 3. 4. 5. 6. Context and objectives
ESTIMATING INCOME INEQUALITY IN OECD METROPOLITAN AREAS Monica Brezzi (with (with Justine Boulant and Paolo Veneri) OECD EFGS Conference Paris 16 November 2016 Outline 1. 2. 3. 4. 5. 6. Context and objectives
MOBILITIES AND LONG TERM LOCATION CHOICES IN BELGIUM MOBLOC
 MOBILITIES AND LONG TERM LOCATION CHOICES IN BELGIUM MOBLOC A. BAHRI, T. EGGERICKX, S. CARPENTIER, S. KLEIN, PH. GERBER X. PAULY, F. WALLE, PH. TOINT, E. CORNELIS SCIENCE FOR A SUSTAINABLE DEVELOPMENT
Forecast Million Lbs. % Change 1. Carryin August 1, ,677, ,001, % 45.0
 Almond Industry Position Report DECEMBER 2017 2017-2018 Crop Year Salable Forecast Million Lbs. 2017-2018 08/01-12/31 Kernel Wt. 2016-2017 08/01-12/31 Kernel Wt. % Change 1. Carryin August 1, 2017 398.7
Data Science Unit. Global DTM Support Team, HQ Geneva
 NET FLUX VISUALISATION FOR FLOW MONITORING DATA Data Science Unit Global DTM Support Team, HQ Geneva March 2018 Summary This annex seeks to explain the way in which Flow Monitoring data collected by the
Keysight Technologies Instrumented Indentation Testing with the Keysight Nano Indenter G200. Application Note
 Keysight Technologies Instrumented Indentation Testing with the Keysight Nano Indenter G200 Application Note Introduction The scale of materials and machined components continues to decrease with advances
Measuring Export Competitiveness
 Dynamic Measures of Competitiveness: Are the Geese Still Flying in Formation? Andrew K. Rose U.C. Berkeley and visiting scholar, FRB San Francisco Haas School of Business, Berkeley CA 94720-900 Tel: (50)
Corporate Governance, and the Returns on Investment
 Corporate Governance, and the Returns on Investment Klaus Gugler, Dennis C. Mueller and B. Burcin Yurtoglu University of Vienna, Department of Economics BWZ, Bruennerstr. 72, A-1210, Vienna 1 Considerable
Europe, Canada, Latin America, & Australia
 Europe, Canada, Latin America, & Australia EUROPE SS6G8 The student will locate selected features of Europe. a. Locate on a world and regional political- physical map: the Danube River, Rhine River, English
NASA s Activities in Europe
 NASA s Activities in Europe Presented by Dr. Bill Barry NASA European Representative November 10, 2009 at the 2009 International Workshop on Environment and Alternative Energy 2 Current Activities The
UNIVERSITY OF OTAGO EXAMINATIONS 2008
 UNIVERSITY OF OTAGO EXAMINATIONS 2008 STATISTICS Paper STAT 242/342 Multivariate Methods (TIME ALLOWED: THREE HOURS) This examination paper comprises 25 pages. Candidates should answer questions as follows:
World Bank Group GEF Program
 World Bank Group GEF Program Global Environment Facility: -Transport World Bank GEF Coordination Team Content How does GEF work? World Bank s role in the GEF partnership The GEF transport activities What
ˆ GDP t = GDP t SCAN t (1) t stat : (3.71) (5.53) (3.27) AdjustedR 2 : 0.652
 t stat : (3.71) (5.53) (3.27) AdjustedR 2 : 0.652") We study the relationship between SCAN index and GDP growth for some major countries. The SCAN data is taken as of Oct. The SCAN is of monthly frequency so we first compute its three-month average as quarterly
We study the relationship between SCAN index and GDP growth for some major countries. The SCAN data is taken as of Oct. The SCAN is of monthly frequency so we first compute its three-month average as quarterly
2,152,283. Japan 6,350,859 32,301 6,383,160 58,239, ,790 58,464,425 6,091, ,091,085 52,565, ,420 52,768,905
 Almond Industry Position Report APRIL 2018 2017-2018 Crop Year Salable Forecast Million Lbs. 2017-2018 08/01-04/30 Kernel Wt. 2016-2017 08/01-04/30 Kernel Wt. % Change 1. Carryin August 1, 2017 398.7 398,677,112
04 June Dim A W V Total. Total Laser Met
 4 June 218 Member State State as on 4 June 218 Acronyms are listed in the last page of this document. AUV Mass and Related Quantities Length PR T TF EM Mass Dens Pres F Torq Visc H Grav FF Dim A W V Total
TMM UPDATE TRANS DAY OF REMEMBRANCE 2017
 TMM UPDATE TRANS DAY OF REMEMBRANCE 2017 2,609 reported murders of trans and gender-diverse people between 1 January 2008 and 30 September 2017 World Regions/Countries All regions Africa South Africa 1
Gridded population. redistribution models and applications. David Martin 20 February 2009
 Gridded population data for the UK redistribution models and applications David Martin 20 February 2009 Overview UK gridded data history (brief!) Small area data availability Grid-based modelling responses
Update on IPWG Activities
 Update on IPWG Activities Paul Kucera National Center for Atmospheric Research Research Applications Laboratory Boulder, Colorado, USA Bozena Lapeta Satellite Remote Sensing Centre Institute of Meteorology
A Numerical Simulation Analysis of (Hukou) Labour Mobility Restrictions in China
 Labour Mobility Restrictions in China") A Numerical Simulation Analysis of (Hukou) Labour Mobility Restrictions in China John Whalley Department of Economics, The University of Western Ontario and Shunming Zhang Department of Finance, School
A Numerical Simulation Analysis of (Hukou) Labour Mobility Restrictions in China John Whalley Department of Economics, The University of Western Ontario and Shunming Zhang Department of Finance, School
About the Authors Geography and Tourism: The Attraction of Place p. 1 The Elements of Geography p. 2 Themes of Geography p. 4 Location: The Where of
 Preface p. ix About the Authors p. xi Geography and Tourism: The Attraction of Place p. 1 The Elements of Geography p. 2 Themes of Geography p. 4 Location: The Where of Geography p. 4 Place and Space:
21st Century Global Learning
 21st Century Global Learning A focus for 7th grade is on the ever-increasing global interactions in society. This focus includes a study of various societies and regions from every continent. We have already
Emergent Geospatial Data & Measurement Issues
 CUNY Institute for Demographic Research Emergent Geospatial Data & Measurement Issues Deborah Balk CUNY Institute for Demographic Research (CIDR) & School of Public Affairs, Baruch College City University
Established Global bathymetry yproducts. Undersea feature names. Capacity building
 IHO IOC Established 1903 Global bathymetry yproducts Undersea feature names Capacity building A GEBCO data GEBCO s d t sets t and d products d t Global bathymetric grids Global set of bathymetric contours
OCTOBER Almond Industry Position Report Crop Year /01-10/31 Kernel Wt /01-10/31 Kernel Wt.
 Almond Industry Position Report OCTOBER 2018 2018-2019 Crop Year Salable Forecast Million Lbs. 2018-2019 08/01-10/31 Kernel Wt. 2017-2018 08/01-10/31 Kernel Wt. % Change 1. Carryin August 1, 2018 359.0
USDA Dairy Import License Circular for 2018
 USDA Dairy Import License Circular for 2018 Commodity/Note Country Name TRQ Jan Feb Mar Apr May Jun Jul Aug Sep Oct Nov Grand Total Non-Cheese 21,864,781 624,064 651,121 432,669 901,074 1,202,567 907,493
Important Developments in International Coke Markets
 Important Developments in International Coke Markets Andrew Jones Resource-Net South Africa China Coke Market Congress Xuzhou, Jiangsu September 2018 Introduction to Presentation Resource-Net produces
SDG s and the role of Earth Observation
 SDG s and the role of Earth Observation Christian Heipke IPI - Institute for Photogrammetry and GeoInformation Leibniz Universität Hannover Germany Secretary General, ISPRS 1. No Poverty 2. Zero Hunger
Variance estimation on SILC based indicators
 Variance estimation on SILC based indicators Emilio Di Meglio Eurostat emilio.di-meglio@ec.europa.eu Guillaume Osier STATEC guillaume.osier@statec.etat.lu 3rd EU-LFS/EU-SILC European User Conference 1
Interactive Statistics Visualisation based on Geovisual Analytics
 Interactive Statistics Visualisation based on Geovisual Analytics Prof. Mikael Jern NCVA LiU and NComVA AB May 2010 - Spin-off company to focus on Interactive Statistics Visualization and Storytelling
DISTILLED SPIRITS - IMPORTS BY VALUE DECEMBER 2017
 DISTILLED SPIRITS - IMPORTS BY VALUE DECEMBER 2017 U.S. DUTIABLE IMPORTS OF DISTILLED SPIRITS (U.S. DOLLARS) Ea-Value-17-12 SUMMARY: IMPORTS ENTERED FOR CONSUMPTION CLASS DECEMBER DECEMBER PERCENT JANUARY
Forecast Million Lbs. % Change 1. Carryin August 1, ,677, ,001, % 45.0
 Almond Industry Position Report NOVEMBER 2017 2017-2018 Crop Year Salable Forecast Million Lbs. 2017-2018 08/01-11/30 Kernel Wt. 2016-2017 08/01-11/30 Kernel Wt. % Change 1. Carryin August 1, 2017 398.7
USDA Dairy Import License Circular for 2018
 USDA Dairy Import License Circular for 2018 Commodity/Note Country Name TRQ Jan Feb Mar Apr May Jun Grand Total Non-Cheese 21,864,781 624,064 651,121 432,669 901,074 1,202,567 907,493 4,718,988 BUTTER
DISTILLED SPIRITS - IMPORTS BY VOLUME DECEMBER 2017
 DISTILLED SPIRITS - IMPORTS BY VOLUME DECEMBER 2017 U.S. DUTIABLE IMPORTS OF DISTILLED SPIRITS (PROOF GALLONS) Ea-17-12 SUMMARY: IMPORTS ENTERED FOR CONSUMPTION CLASS DECEMBER DECEMBER PERCENT JANUARY
Weather Company Energy and Power Products
 Service Weather Company Energy and Power Products This Service (SD) describes the Cloud Service IBM provides to Client. Client means the company and its authorized users and recipients of the Cloud Service.
2/2/2015 GEOGRAPHY 204: STATISTICAL PROBLEM SOLVING IN GEOGRAPHY MEASURES OF CENTRAL TENDENCY CHAPTER 3: DESCRIPTIVE STATISTICS AND GRAPHICS
 Spring 2015: Lembo GEOGRAPHY 204: STATISTICAL PROBLEM SOLVING IN GEOGRAPHY CHAPTER 3: DESCRIPTIVE STATISTICS AND GRAPHICS Descriptive statistics concise and easily understood summary of data set characteristics
Kernel Wt. 593,190,150 1,218,046,237 1,811,236, ,364, ,826, ,191, Crop Year
 Almond Industry Position Report JULY 2016 2015-2016 Crop Year Salable Forecast Million Lbs. 2015-2016 8/1-7/31 Kernel Wt. 2014-2015 8/1-7/31 Kernel Wt. % Change 1. Carryin August 1, 2015 2. Crop Receipts
Coastal regions: People living along the coastline and integration of NUTS 2010 and latest population grid
 Statistics in focus (SIF-SE background article) Authors: Andries ENGELBERT, Isabelle COLLET Coastal regions: People living along the coastline and integration of NUTS 2010 and latest population grid Among
Chapter 14. Representative Table and Composite Regions. Betina V. Dimaranan Representative Table
 Chapter 14 Representative Table and Composite Regions Betina V. Dimaranan This chapter describes the representative input-output table and the construction of input-output tables for the composite regions
GCSE 4231/01 GEOGRAPHY (Specification A) FOUNDATION TIER UNIT 1: Core Geography
 FOUNDATION TIER UNIT 1: Core Geography") Surname Centre Number Candidate Number Other Names 0 GCSE 4231/01 GEOGRAPHY (Specification A) FOUNDATION TIER UNIT 1: Core Geography S16-4231-01 P.M. TUESDAY, 24 May 2016 1 hour 45 minutes For s use Question
Surname Centre Number Candidate Number Other Names 0 GCSE 4231/01 GEOGRAPHY (Specification A) FOUNDATION TIER UNIT 1: Core Geography S16-4231-01 P.M. TUESDAY, 24 May 2016 1 hour 45 minutes For s use Question
Demographic Data in ArcGIS. Harry J. Moore IV
 Demographic Data in ArcGIS Harry J. Moore IV Outline What is demographic data? Esri Demographic data - Real world examples with GIS - Redistricting - Emergency Preparedness - Economic Development Next
2011 census geography and beyond: what can we expect? David Martin SLA Conference, 27 October 2008
 2011 census geography and beyond: what can we expect? David Martin SLA Conference, 27 October 2008 Overview A quick history lesson: census 2001-2001 output area design Where have we got to since then?
A route map to calibrate spatial interaction models from GPS movement data
 A route map to calibrate spatial interaction models from GPS movement data K. Sila-Nowicka 1, A.S. Fotheringham 2 1 Urban Big Data Centre School of Political and Social Sciences University of Glasgow Lilybank
USDA Dairy Import License Circular for 2018 Commodity/
 USDA Dairy Import License Circular for 2018 Commodity/ Grand Country Name TRQ Jan Feb Mar Apr May Jun Jul Aug Sep Note Total Non-Cheese 21,864,781 624,064 651,121 432,669 901,074 1,202,567 907,493 1,117,261
World Status of National Spatial Data Clearinghouses
 World Status of National Spatial Data Clearinghouses Joep Crompvoets and Arnold Bregt Abstract: In December 2001, a survey of the World Wide Web was carried out to assess systematically the state-of-the-art
Global City Definition
 Regional Training Workshop on Human Settlement Indicators Global City Definition Dennis Mwaniki Global Urban Observatory, Research and Capacity Development Branch, UN-Habitat Bangkok, Thailand Outline
2012 OCEAN DRILLING CITATION REPORT
 2012 OCEAN DRILLING CITATION REPORT Covering Citations Related to the Deep Sea Drilling Project, Ocean Drilling Program, and Integrated Ocean Drilling Program from GeoRef Citations Indexed by the American
PERFORMANCE. 1 Scheduled and successfully completed observing time
 PERFORMANCE INDICATORS The ATNF assesses its performance through key performance indicators, based on those used generally by CSIRO but adapted to be appropriate for a National Facility. Unless otherwise
WELCOME TO GCSE GEOGRAPHY WHERE WILL IT TAKE US TODAY?
 WELCOME TO GCSE GEOGRAPHY WHERE WILL IT TAKE US TODAY? What is our challenge? X WHAT IS THE GLOBAL PATTERN OF URBAN GROWTH? TOPIC 5: URBAN FUTURES 5.1: WHY DO MORE THAN HALF OF THE WORLD S POPULATION
Economic and Social Council
 United Nations E/CN.3/2019/31 Economic and Social Council Distr.: General 19 December 2018 Original: English Statistical Commission Fiftieth session 5-8 March 2019 Item 4(i) of the provisional agenda*
Bayesian Poisson Tensor Factorization for Inferring Multilateral Relations from Sparse Dyadic Event Counts
 Bayesian Poisson Tensor Factorization for Inferring Multilateral Relations from Sparse Dyadic Event Counts KDD 2015 Aaron Schein UMass Amherst Joint work with: John Paisley, Dave Blei & Hanna Wallach Columbia
City Size and Economic Growth
 City Size and Economic Growth Susanne Frick & Andrés Rodríguez-Pose Divergent Cities Conference Cambridge July 16, 2015 Does the size of a country s cities impact national economic growth? 2 Outline Motivation
Evaluation of a New HPLC, a New Tandem MS and a New Data Processing Software for General Clinical Use
 Evaluation of a New HPLC, a New Tandem MS and a New Data Processing Software for General Clinical Use Shih-Tse Jason Lai, Jia Wang, Brad Hart, Kristine Van Natta, Marta Kozak, Jorge Valdivia, Haibo Wang,
Global Studies A and B Mr. Lord
 1. ARRIVE ON TIME. Global Studies A and B Mr. Lord michael.lord@orecity.k12.or.us Global Studies A and B Classroom Rules and Grading Expectations 2. BE PREPARED BOTH MENTALLY AND PHYSICALLY FOR CLASS.
High-Pressure Electrolytic Carbonate Eluent Generation Devices and Their Applications in Ion Chromatography Systems
 High-Pressure Electrolytic Carbonate Eluent Generation Devices and Their Applications in Ion Chromatography Systems Yan Liu, Zhongqing Lu, and Chris Pohl; Thermo Fisher Scientific, Sunnyvale, CA USA Overview
UNIT 1: Pa-erns in Human Geography. Chapter 1: Where people live.
 UNIT 1: Pa-erns in Human Geography Chapter 1- Where people live. Chapter 2- How they live. Chapter 3- How we use the Earth Chapter 4- How we work. Chapter 5- Consequences. Chapter 1: Where people live.
Keysight Technologies Oxygen-Free High-Resolution Electrochemical SPM. Application Note
 Keysight Technologies Oxygen-Free High-Resolution Electrochemical SPM Application Note Introduction For two decades, scanning probe microscopy (SPM) has provided scientists a unique tool to study in situ
A possible solution for the centroid-to-centroid and intra-zonal trip length problems
 A possible solution for the centroid-to-centroid and intra-zonal trip length problems Maryam Kordi Centre for GeoInformatics (CGI) School of Geography & Geosciences University of St Andrews St Andrews,
AP Human Geography Summer Homework 2016 JW Mitchell High School Mrs. Daniel
 AP Human Geography Summer Homework 2016 JW Mitchell High School Mrs. Daniel hdaniel@pasco.k12.fl.us Welcome to A.P. Human Geography. I am excited that you decided to take this journey to learn more about
of mass spectrometry
 Thermo Scientific 253 Ultra High resolution isotope ratio MS Discover a new world of mass spectrometry Paleoclimatology Atmospheric science Biogeochemistry Petrology Discover the isotopic anatomy of molecules
AD HOC DRAFTING GROUP ON TRANSNATIONAL ORGANISED CRIME (PC-GR-COT) STATUS OF RATIFICATIONS BY COUNCIL OF EUROPE MEMBER STATES
 STATUS OF RATIFICATIONS BY COUNCIL OF EUROPE MEMBER STATES") Strasbourg, 29 May 2015 PC-GR-COT (2013) 2 EN_Rev AD HOC DRAFTING GROUP ON TRANSNATIONAL ORGANISED CRIME (PC-GR-COT) STATUS OF RATIFICATIONS BY COUNCIL OF EUROPE MEMBER STATES TO THE UNITED NATIONS CONVENTION
Strasbourg, 29 May 2015 PC-GR-COT (2013) 2 EN_Rev AD HOC DRAFTING GROUP ON TRANSNATIONAL ORGANISED CRIME (PC-GR-COT) STATUS OF RATIFICATIONS BY COUNCIL OF EUROPE MEMBER STATES TO THE UNITED NATIONS CONVENTION
Big Data at BBVA Research using BigQuery
 Big Data at BBVA Research using BigQuery Tomasa Rodrigo June 2017 Google Cloud Next Click here to modify the style of the master title Summary 01 What is GDELT and how BigQuery helps us to exploit it 02
2006 Supplemental Tax Information for JennisonDryden and Strategic Partners Funds
 2006 Supplemental Information for JennisonDryden and Strategic Partners s We have compiled the following information to help you prepare your 2006 federal and state tax returns: Percentage of income from
Insights Into the Nanoworld Analysis of Nanoparticles with ICP-MS
 Insights Into the Nanoworld Analysis of Nanoparticles with ICP-MS Daniel Kutscher, 1 Jörg Bettmer, 2 Torsten Lindemann, 1 Shona McSheehy-Ducos, 1 Lothar Rottmann 1 1 Thermo Fisher Scientific, Germany 2
AN922 Application note
 Application note Using a Super Cap to back up the M41T56, M41T00 M41T11, M41T81, M41T94, and M41ST84W (16-pin) Introduction The M41T56, M41T00, M41T11, M41T81, M41T94, and M41ST84W (16-pin) real-time clocks
Keysight Technologies Measurement Uncertainty of VNA Based TDR/TDT Measurement. Application Note
 Keysight Technologies Measurement Uncertainty of VNA Based TDR/TDT Measurement Application Note Table of Contents Introduction... 3 S-parameter measurement uncertainty of VNA... 4 Simplification of systematic
Geosciences Data Digitize and Materialize, Standardization Based on Logical Inter- Domain Relationships GeoDMS
 Geosciences Data Digitize and Materialize, Standardization Based on Logical Inter- Domain Relationships GeoDMS Somayeh Veiseh Iran, Corresponding author: Geological Survey of Iran, Azadi Sq, Meraj St,
HILIC Method Development in a Few Simple Steps
 HILIC Method Development in a Few Simple Steps Monica Dolci, Luisa Pereira, Dafydd Milton and Tony Edge Thermo Fisher Scientific, Runcorn, Cheshire, UK Overview This poster presents a systematic approach
WMO Worldwide Space Weather Coordination
 WMO Worldwide Space Weather Coordination Terry Onsager Physicist U.S. National Weather Service, Space Weather Prediction Center Co-Chair WMO Inter-Programme Coordination Team on Space Weather Director