Comparisons to other buildings in BC Eco- Sense and Net Zero Energy. Introduction. Comparison to conventional
|
|
|
- Elmer Hill
- 5 years ago
- Views:
Transcription
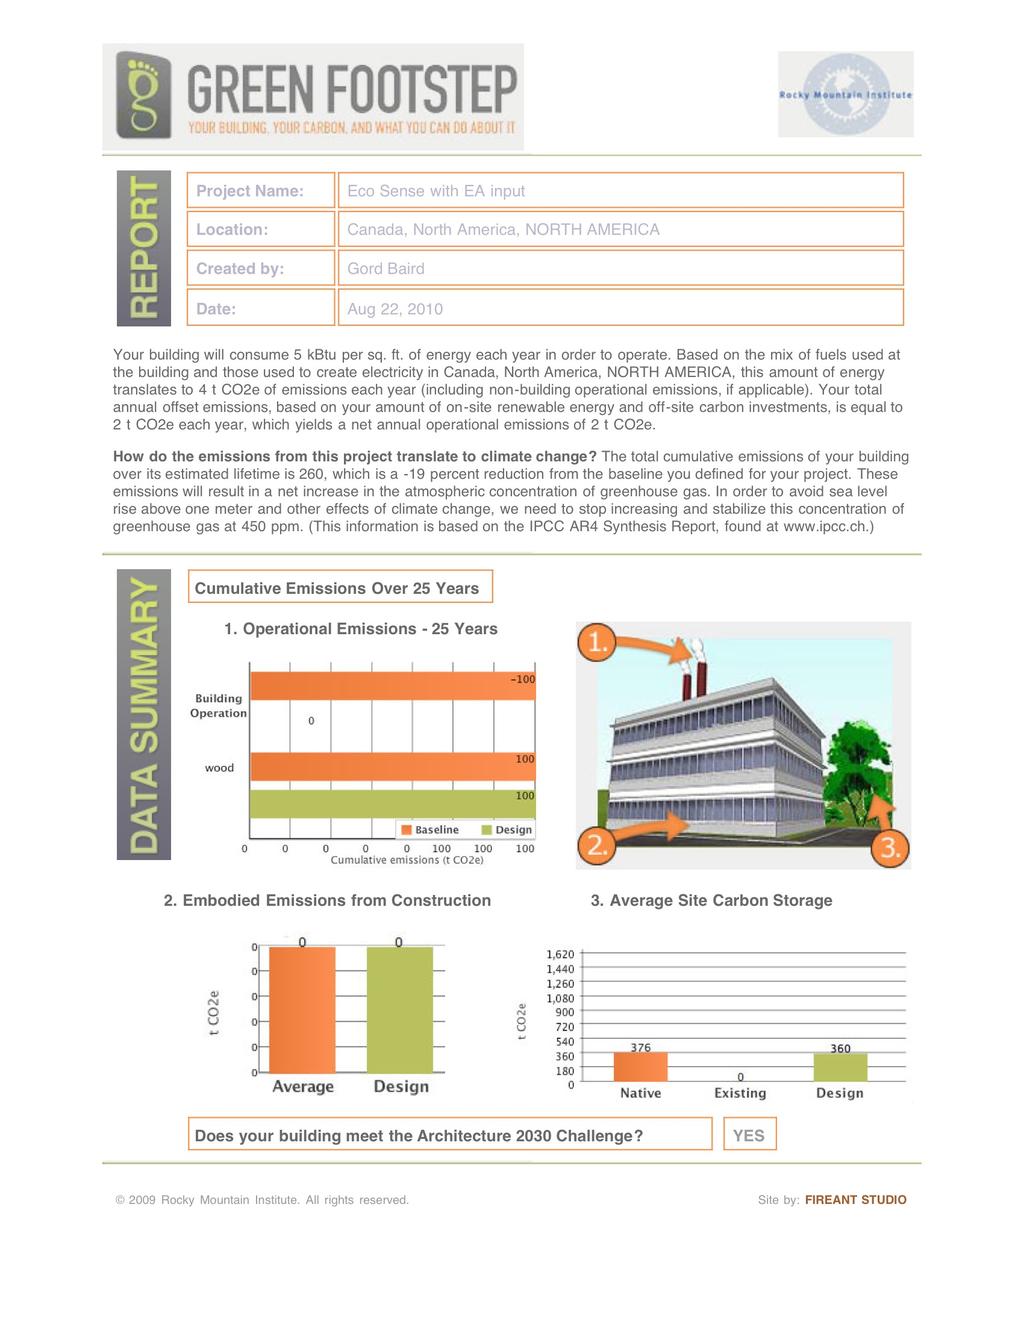
1 Comparisons to other buildings in BC Eco- Sense and Net Zero Energy Introduction Eco-Sense is an example of an emerging trend in housing that integrates sustainable energy and water systems with low carbon construction materials and methods. Located in the Highlands of Greater Victoria, this project began as a challenge to build a home as sustainable as the BC Building Code would allow. What developed was the creation of the first legal, seismically engineered load bearing high occupancy cob building in North America. Based on the earthen architectural concepts that have been utilized for millennia throughout the world, this home incorporated the science of modern structural engineering while surpassing the standards as set out in the BC Building Code. Sustainable systems integrated into this house include net zero solar PV (electricity), solar thermal (hot water), wood pyrolysis (or gasification) for winter heating, living roofs, rainwater harvesting, grey water systems, waterless no-flush composting toilet, and productive food gardens for the occupants. The purpose of the comparative research was to document the performance of this historically proven building method and compare with todayʼs technology and housing standards. Specific research areas include heating, cooling, moisture control, and temperature moderation while providing a living space that was equal to if not better than current housing standards. Comparison to conventional A critical area of the research is the comparison of the Eco-Sense home with that of the average typical detached residence in British Columbia. The 2008 year represents the most recent data available from the Natural Resources Canadaʼs (NRCan) National Energy Use Database (NEUD): Comprehensive Energy Use Data 1. Review of the Climatic variables - Insolation Important Note: Solar insolation was abnormally low for the region for the year of study. The average yearly insolation is 1,242 kwhr/m 2 ; the measured value was 1,050 kwhr/m 2 ; this represents a 192 kwhr/m 2 reduction from the average, or approximately 15% less available sunshine. This equates to missing approx. 2 months of solar insolation. (Note that the months that showed the largest actual decrease were the shoulder seasons (spring and fall), when reliance on the solar insolation for both passive and active solar heating is greatest. Actual Monthly Insolation (kwh/m2) Average Insolation for Lat/Log from NASA (kwhr/m2/day) Average Monthly Insolation for Lat/Log from NASA (kwhr/m2) Average difference from expected
2 Jan % Feb % Mar % Apr % May % Jun % Jul % Aug % Sep % Oct % Nov % Dec % % A year with a 15% overall decrease of insolation results in higher energy inputs for heating across this region, and is demonstrated in the difference between the average Heating Degree Days (HDD) for the area (2902 HDD 3 ), and the measured HDD (3307 HDD 4 ). This notable difference translates into a 14% increase in HDD for the time period of study. Energy Intensity In BC the average single detached residence has a footprint size of m 2, inhabited by 2.5 occupants 5. The Eco-Sense house has an area of 200 m2, with an average of 5 occupants 6. The average space per BC resident is 59.1 m 2 ; whereas at Eco-Sense it is 40 m 2, a decrease in footprint per occupant of 32% from the BC normal. When the measured energy data for heating is adjusted to account for the actual low insolation period (based on the difference in HDD), the adjusted energy intensity numbers show how the house would perform in an average year. This method would give a more accurate comparison. See third column. Overall energy usage shows Eco-Sense consumed 94.7% of that of a typical average residence in BC. The make up of energy consumption shows a drastically decreased use of electricity, using only 18.3% of the average, but is accounted for with the use of wood fuel where the numbers are reversed. Due to this drastically different energy make-up between the Average and Eco-Sense, we must drill down and look at the energy intensity of the home, the area of the home and relate it to the residents. Eco-Sense is approximately 13 m 2 larger in living area than the BC average, with a total area of m 2. The energy intensity per square meter for Eco-Sense is kwhr/m 2 (or 0.54 GJ/m 2 ) vs kwhr/m 2 (0.61 GJ/m 2 ); this is a difference of 11.2% less, or Eco-sense has an energy footprint that is 88.8% of the average.
3 Energy intensity measurements take into account both the operations of the structure and the lifestyles of the occupants and therefore the energy footprints of individuals are included. (Examples of lifestyle energy footprints include length of hot showers, size and number of TVʼs, number of household appliances, type of cooking, etc) The residents of Eco-Sense have an energy footprint of 6037 kwhrs/year as compared to the average BC resident at kwhrs/year; a difference of 52.6% less energy per person, then that of the average resident in a similar home. When the energy footprint from above is applied to the space they inhabit, the results show that energy intensity/person/m 2 is more substantial; that Eco-sense has an intensity of kwhrs/person/m 2 versus the BC average of kwhrs/person/m 2. Therefore on a per person /m 2 basis, the individual energy intensity is 55.6% less than that of the BC average. The Eco-Sense results would have been quite different if the data were collected in an average insolation year. See table. Energy Use by Energy Source (kwhr) BC Avg Single Detached Residence (NRCAN NEUD 2008) Actual Eco-Sense (kwhr) Adjusted Eco-Sense (kwhr) Electricity Natural Gas LP Gas Heating Oil Other2 (inclusive of Solar Thermal) Wood Total Energy (kwhr) % Difference from average Energy Source Breakdown (%) Electricity 39.9% 7.6% 8.5% Natural Gas 50.9% 4.2% 4.6% Heating Oil 0.6% 0.0% 0.0% Other2 (including solar thermal) 0.8% 18.9% 20.9% Wood 7.7% 69.2% 65.9% Average Floor Space (m 2 ) Energy Intensity (GJ/m 2 ) % Less Energy Intensity (GJ/household) % Less Energy intensity/person/m 2 (per detached residence) % Less Energy intensity/person/detached residence % Less Energy Intensity (kwhr/m 2 ) % Less Energy Intensity (kwhr/household) % Less Energy intensity per person m 2 (per detached residence) (kwhr/m2) % Less Energy intensity per person per detached residence (kwhr) % Less
4 Summary of Energy Intensity A more efficient use of space produces a home that uses less energy across a wide range of indices, where the energy intensity of the building itself is 11.2% less, where the residents use 52.6% less than the average BC resident, and where the energy intensity per person/m2 is 55.6% less than that of the average BC residentʼs footprint intensity. These comparisons are between an average house in an average insolation year and it has been clearly demonstrated that the period of research was not a normal year. See table. This demonstrates an exceptional divergence from normal values in the energy profile of the home and the occupants. Space Heating In an average year the average residence in BC uses 19,739 kwhrs of energy to heat its space resulting in energy intensity of 105 kwhrs/m 2 ; for comparison, Eco-Sense, in a sunlight deficient year used 24,948 kwhrs for an intensity of 124 kwhrs/m 2. As noted earlier the test year observed a 15% decrease in solar insolation and a subsequent increase in HDD by 14%. If the research study was conducted in an average year the adjusted space heating would have been 21,719 kwhr for an intensity of 108 kwhrs/m 2. This demonstrates that the envelope is performing very similar, with an increased energy intensity usage of 2.9%. As noted earlier, the recorded insolation deficiency came in the Spring and Fall when the Eco-Sense home was very dependant on solar gain for both passive and active solar heating. Average Single Detached 2008 (kwhr) Average Space Heating intensity (kwhr/m2) Eco-Sense Space Heating (wwhr) Eco-Sense Space Heating Intensity (kwhr/m2) Adjusted Eco- Sense Space Heating (kwhr) Adjusted Eco- Sense Space Heating Intensity (kwhr/m2) Since the completion of the house, much has been learned that would greatly increase the thermal performance of the earthen home. Such improvements would include: 1. The detailing of the insulation of the concrete foundation with the addition of better thermal breaks; 2. The use of light clay (wood chip and clay) infill for the upstairs exterior walls instead of pumice cob. 3. Addition of a Larson truss on the exterior north load bearing cob wall filled with a light clay infill and then plastered. 4. Utilizing a summer heat dump under the earthen slab for storing surplus solar energy to draw upon in winter heating months.
5 Water Heating Water heating is generally controlled by the usage patterns of the residents. The BC average energy per person per BC household is kwhr; the Eco-Sense average is kWhrs. This is a dramatically different usage pattern than that of the average BC resident wherein Eco-Sense on a per person basis uses 84.6% less energy to heat its domestic hot water on a per person basis. Of all the heated water, the majority is from solar thermal collection BC Average 2008 BC Average Eco-Sense Eco-Sense Total usage/household (kwhrs) Intensity / m2 (kwhr/m2) Intensity Total household usage (kwhr) Intensity / m2 (kwhr/m2) Avg usage /Person (kwhr) Usage / person (kwhr) Carbon Analysis Average BC annual GHGe for operations for a detached BC household in 2008 was 3.15 metric tons, (NRCAN NEUD: Table 34: Single Detached Secondary Energy Use and GHG Emissions by Energy Source). Note that the electricity generation is excluded from the 2008 BC average GHGe however electricity is included in the Eco-Sense calculations. This skews the figures showing that the Eco-Sense values are over estimates Average construction GHG based on a house the same size using the Build Carbon Neutral carbon calculator 65 metric tons 9. (This document is attached in Appendices) Average lifespan of conventional home is 40 years. Overall carbon footprint /year for the average home is 40 years x 3.15 = 126, plus 65 tons for a total of 191 tons of GHGe/carbon emitted over the life span which works out to be 4.78 metric tons per year. Eco-Sense GHG carbon from construction derived from the Environmental Agency and Green Footprint calculators (calculations are attached in appendices) estimates the carbon footprint of construction at a zero carbon footprint. For operations, the Eco-Sense average GHGe from wood is based on kwhrs of energy. There is 5.49 kwhr/kg of energy; therefore there is 3272 kg of wood used to produce kwhrs with a conversion factor of this equates to 5821 kg of
6 CO2e with a allowance for a half charge to be accounted for re-uptake, this leaves 2910 kg (2.91 tons) 10 of yearly emissions. In addition there is 266 ltrs of propane consumed, which is equivalent to 400 kg CO2 (0.4 ton). Thus the annual carbon footprint emitted from operations is 3.79 tons. Average Lifespan Overall carbon footprint per year over lifespan of 500 years is 500 x 3.79 = 1895 tons of carbon, which is 3.79 tons per year. Therefore the overall carbon footprint of the eco-sense home is 1 ton lower than that of a conventional house of the same size over its lifespan. On a per person basis (4.78/2.5) 1.91 tons is emitted per BC resident on average, whereas at Eco-Sense 0.66 tons are emitted per person. Average House/year (2.5 people) Eco-Sense House/year (5 people) GHGe operations GHGe construction tghge tghge perperson Affordability Stats Canada data from 2009 Mortgage loan approvals shows new residential construction and existing residential properties, by province and territory: Alberta, British Columbia, Yukon, Northwest Territories 11 show that the average new construction cost for a single detached home in BC was $441,197; as the average size is m 2, this comes to a cost /m 2 of $2987/m 2 (or $277/ft 2 ). For comparison, the Eco-Sense cost of construction was $1593/m 2 (or $148/ft 2 ). The monthly costs for energy are drastically different as the costs of wood per year do not exceed $550 (average of $45/month). Other costs are negligible, such as minor charges like an Eco Fee on the BC Hydro statement. Compared to the average new construction, Eco-Sense was 46.5% less expensive to build with the added benefit of minimal $45 in additional costs to service supplemental energy that is not generated onsite. If the Eco-Sense homeowners were to invest the $40,000 to remove all requirements for fossil and wood fuels (i.e. install a heat pump and more solar panels), the costs would increase an additional amount of $200/m2 for a total of $1793/m2 (or $167/ft2). Still a reasonable cost in relation to today s construction costs.
7 Lessons learned 1. Higher density living arrangements within a single family home promote decreased energy intensity overall. 2. Equal emphasis should be placed on occupant lifestyle and building envelope performance in regards to energy performance. Cannot separate the lifestyle of the inhabitants from the performance of the building. 3. Equal emphasis should be placed on embodied energy for construction and operations over the expected lifespan of the building. 4. The earthen architectural method utilized for Eco-Sense requires a very similar amount of energy to heat compared to the average house in an average year. a. However, it has been demonstrated the importance of building such an earthen home in the full sun b. Essential to incorporate passive solar features into the design. c. Also beneficial to increase thermal performance of north walls. 5. Green House Gas reduction possibilities for the Eco-Sense home include: a. tghgeʼs for space heating could be reduced by installing an air to water heat pump instead of the wood gasification boiler. A heat pump (with a COP of 4.5) could reduce the energy intensity of the space heating from the kwhrs down to 4700 kwhrs, but would require 200% more solar panels (thirty-two 170 Watt) with a current value of $16,000. b. tghgeʼs from cooking could be reduced by removing the propane ranges and replacing with electric. This would require an addition of 50% more solar panels (eight 170 Watt) at a cost of $4, Eco-Sense could be an affordable net zero energy home: a. Addition of forty 170 Watt solar panels would decrease the annual carbon emissions of the home to zero, and thus make it truly a net zero energy home that uses no carbon emitting sources of energy. b. Total costs of these additions would equate to approximately $40,000 (heat pump, solar panels, mounting hardware, additional inverter, and professional install). Total cost per square foot would increase to $164/ ft Local Resiliency: Noted observation that reliance on technology may decrease resiliency in the face of technological failure, and lower tech solutions are easier to repair and less costly to maintain. 8. Climate change: If the weather anomaly experienced for the duration of this research (June 15, 2010 to June 16, 2011) is any indication of insolation patterns to be expected in the future, it will become increasingly important to optimize passive solar design and size active solar installations appropriately and not to base these on past normalʼs.
8 Appendix of Documents Solar Insolation Data Solar insolation data was collected from Uvic Weatherstaon Networkʼs three closest weather stations, Eagle View Elemetary, Cal Revelle Nature Sanctuary, and East Highlands Firehall. Due to shading from trees at Cal Revelle and East Highlands, the data was weighted more heavily on Eagle View Elementary. Table 1 Daily Insolation Daily Insolation W/m2 1 06/20/ /21/ /22/ /23/ /24/ /25/ /26/ /27/ /28/ /29/ /30/ /01/ /02/ /03/ /04/ /05/ /06/ /07/ /08/ /09/ /10/ /11/ /12/ /13/ /14/ /15/ /16/ /17/ /18/ /19/ /20/ /21/ /22/ /23/ /24/ /25/ /26/ /27/ /28/ /29/ /30/ /31/ /01/ /02/ /03/ /04/ /05/ /06/ /07/ /08/ /09/ /10/ /11/ /12/ /13/ /14/ /15/ /16/ /17/ /18/ /19/ /20/ /21/ /22/ /23/ /24/ /25/ /26/ /27/ /28/ /29/ /30/ /31/ /01/ /02/ /03/ /04/ /05/ /06/ /07/ /08/ /09/ /10/ /11/ /12/ /13/ /14/ /15/ /16/ /17/ /18/ /19/ /20/ /21/ /22/ /23/
9 6 09/24/ /25/ /26/ /27/ /28/ /29/ /30/ /01/ /02/ /03/ /04/ /05/ /06/ /07/ /08/ /09/ /10/ /11/ /12/ /13/ /14/ /15/ /16/ /17/ /18/ /19/ /20/ /21/ /22/ /23/ /24/ /25/ /26/ /27/ /28/ /29/ /30/ /31/ /01/ /02/ /03/ /04/ /05/ /06/ /07/ /08/ /09/ /10/ /11/ /12/ /13/ /14/ /15/ /16/ /17/ /18/ /19/ /20/ /21/ /22/ /23/ /24/ /25/ /26/ /27/ /28/ /29/ /30/ /01/ /02/ /03/ /04/ /05/ /06/ /07/ /08/ /09/ /10/ /11/ /12/ /13/ /14/ /15/ /16/ /17/ /18/ /19/ /20/ /21/ /22/ /23/ /24/ /25/ /26/ /27/ /28/ /29/ /30/ /31/ /01/ /02/ /03/ /04/ /05/ /06/ /07/ /08/ /09/ /10/ /11/ /12/ /13/ /14/ /15/ /16/ /17/ /18/ /19/ /20/ /21/ /22/ /23/ /24/ /25/ /26/ /27/ /28/ /29/ /30/ /31/ /01/ /02/ /03/ /04/ /05/ /06/ /07/ /08/ /09/ /10/ /11/ /12/ /13/ /14/ /15/ /16/ /17/ /18/ /19/ /20/ /21/ /22/
10 4 02/23/ /24/ /25/ /26/ /27/ /28/ /01/ /02/ /03/ /04/ /05/ /06/ /07/ /08/ /09/ /10/ /11/ /12/ /13/ /14/ /15/ /16/ /17/ /18/ /19/ /20/ /21/ /22/ /23/ /24/ /25/ /26/ /27/ /28/ /29/ /30/ /31/ /01/ /02/ /03/ /04/ /05/ /06/ /07/ /08/ /09/ /10/ /11/ /12/ /13/ /14/ /15/ /16/ /17/ /18/ /19/ /20/ /21/ /22/ /23/ /24/ /25/ /26/ /27/ /28/ /29/ Source: 7 04/30/ /01/ /02/ /03/ /04/ /05/ /06/ /07/ /08/ /09/ /10/ /11/ /12/ /13/ /14/ /15/ /16/ /17/ /18/ /19/ /20/ /21/ /22/ /23/ /24/ /25/ /26/ /27/ /28/ /29/ /30/ /31/ /01/ /02/ /03/ /04/ /05/ /06/ /07/ /08/ /09/ /10/ /11/ /12/ /13/ /14/ /15/ /16/ /17/ /18/ /19/ /20/ /21/ Total Insolation Based on data from Eagle View Elementary, Cal Revelle Nature Sanctuary and East Highlands Firehall Weighted average where Eagle View elementary is weighted at 66.8% and East Highlands and Cal Revelle are weighted at 16.7% each. This is due to some shading issues that are prevalent at both sites on the east and west of the weather staions. Table 2 Weekly Insolation Weekly Insolation Week Insolation (W/m2)
11 Total W/m kwhr/m2 Table 3 Insolation Summary Actual Monthly Insolation (W/m2) Actual Monthly Insolation (kwh/m2) Average Insolation for Lat/Log from NASA (kwhr/m2/day) AverageMonthly Insolation for Lat/Log from NASA (kwhr/m2) Jan Feb Mar Apr May Jun Jul Aug Sep Oct Nov Dec Source: NASA Atmospheric Science Data Centre ; Surface meteorlogical and Solar Energy Tables; Lat 48.5 Monthly Averaged Insolation Incident On A Horizontal Surface (kwh/m2/day) Lon Jan Feb Mar Apr May Jun Jul Aug Sep Oct Nov Dec Annual Average 22-year Average Table 4 Energy Summary Data
12 Date Daily Solar Thermal kwhrs Wood kwhrs Solar PV kwhrs Total Energy Generated Cumulative Energy Generated Daily Insolation W/m 2 Daily Hot Water usage Energy Attributed to DHW (kwhrs) Solar thermal energy actually used Unutilized Solar Thermal Energy (kwhr) June 23, June 24, June 25, June 26, June 27, June 28, June 29, June 30, July 1, July 2, July 3, July 4, July 5, July 6, July 7, July 8, July 9, July 10, July 11, July 12, July 13, July 14, July 15, July 16, July 17, July 18, July 19, July 20, July 21, July 22, July 23, July 24, July 25, July 26, July 27, July 28, July 29, July 30, July 31, August 1, August 2, August 3, August 4, August 5, August 6, August 7, August 8, August 9, August 10, August 11, August 12, August 13, August 14, August 15, August 16, August 17, August 18, August 19, August 20, August 21, August 22, August 23, August 24, August 25, August 26, August 27, August 28, August 29, August 30, August 31, September 1, September 2, September 3, September 4, September 5, September 6, September 7, September 8, September 9, September 10, September 11, September 12, September 13, September 14, September 15, September 16, September 17, September 18, September 19, September 20, September 21, September 22, September 23, September 24, September 25, September 26, September 27, September 28,
13 September 29, September 30, October 1, October 2, October 3, October 4, October 5, October 6, October 7, October 8, October 9, October 10, October 11, October 12, October 13, October 14, October 15, October 16, October 17, October 18, October 19, October 20, October 21, October 22, October 23, October 24, October 25, October 26, October 27, October 28, October 29, October 30, October 31, November 1, November 2, November 3, November 4, November 5, November 6, November 7, November 8, November 9, November 10, November 11, November 12, November 13, November 14, November 15, November 16, November 17, November 18, November 19, November 20, November 21, November 22, November 23, November 24, November 25, November 26, November 27, November 28, November 29, November 30, December 1, December 2, December 3, December 4, December 5, December 6, December 7, December 8, December 9, December 10, December 11, December 12, December 13, December 14, December 15, December 16, December 17, December 18, December 19, December 20, December 21, December 22, December 23, December 24, December 25, December 26, December 27, December 28, December 29, December 30, December 31, January 1, January 2, January 3, January 4, January 5, January 6, January 7, January 8, January 9, January 10, January 11, January 12,
14 January 13, January 14, January 15, January 16, January 17, January 18, January 19, January 20, January 21, January 22, January 23, January 24, January 25, January 26, January 27, January 28, January 29, January 30, January 31, February 1, February 2, February 3, February 4, February 5, February 6, February 7, February 8, February 9, February 10, February 11, February 12, February 13, February 14, February 15, February 16, February 17, February 18, February 19, February 20, February 21, February 22, February 23, February 24, February 25, February 26, February 27, February 28, March 1, March 2, March 3, March 4, March 5, March 6, March 7, March 8, March 9, March 10, March 11, March 12, March 13, March 14, March 15, March 16, March 17, March 18, March 19, March 20, March 21, March 22, March 23, March 24, March 25, March 26, March 27, March 28, March 29, March 30, March 31, April 1, April 2, April 3, April 4, April 5, April 6, April 7, April 8, April 9, April 10, April 11, April 12, April 13, April 14, April 15, April 16, April 17, April 18, April 19, April 20, April 21, April 22, April 23, April 24, April 25, April 26, April 27, April 28,
15 April 29, April 30, May 1, May 2, May 3, May 4, May 5, May 6, May 7, May 8, May 9, May 10, May 11, May 12, May 13, May 14, May 15, May 16, May 17, May 18, May 19, May 20, May 21, May 22, May 23, May 24, May 25, May 26, May 27, May 28, May 29, May 30, May 31, June 1, June 2, June 3, June 4, June 5, June 6, June 7, June 8, June 9, June 10, June 11, June 12, June 13, June 14, June 15, June 16, June 17, June 18, June 19, June 20, June 21, June 22, Totals (kwhr) gallons Domestic Hot Water Usage Theory and Data Energy inputs that enter the home include both solar thermal collection from evacuated tubes and that from wood gasification. During the months from mid june through early September there is no heat added to the floors, thus the only use for energy is for domestic hot water (DHW). Therefore it can be assumed that any solar thermal energy inputs that surpass that required to provide the needs for DHW are dumped via a heat dump; all solar thermal systems have a method of dumping excess solar thermal gain. The water entering the home has a constant temperature of 6 C (43 F), and the water that is supplied to the DHW is tempered to 54.4 c (130 F). Using the following constants: 1 BTU = kwhrs 1 BTU = 1 lb of water raised 1 o F
16 1 gallon of water weighs 8.34 lbs therefore it requires 8.34 BTUs to raise 1 gallon of water 1 F. Formula: Temperature rise (F) X Volume (gallons) X 8.34 BTU Conversion to kwhrs: Total BTUs X = Total kwhrs energy Source: Basic units of thermal measurement Actual Calculations: (130F 43F) X 1 gallon X 8.34 = btus to heat 1 gallon of water from inlet to supply temp. This number then gets subtracted off of the solar thermal inputs for the corresponding dates (June September , and June ) when there is no requirement for the excess and thus nothing used for space heating; this number represents the dumped heat energy. Table 5 Domestic Hot Water calculations Gallons kwhrs Total Avg per Week Avg per day Avg per person/day Space Heating At Eco-Sense all energy inputs are known, from wood and from solar thermal. We also can extrapolate as noted in Table 5, that certain energy can be subtracted out from the total inputs for DHW. We also can extrapolate the amount of heat that is collected in the summer months but not used and thus dumped. With this we can calculate the energy attributed to heating the household. Wood + Solar Thermal DHW heat dump = Space heating. Table 6 - Space heating calculations Space Heating (kwhr) Total Wood inputs Total Solar Thermal Minus DHW Minus Dumped
17 Total Solar PV Data Gord to start on saturday
18 Carbon Footprint Report by Christina Goodvin Carbon Comparison for Similar sized home Buildcarbonneutral.org Construction Carbon calculator for Earthen Homes C.Goodvin, B.Eng., M.A.Sc., E.I.T. Calculator Inputs: Inputs Total square feet of building equals 2500, in two stories, above ground. Primary structure of system selected as wood as there is no option for earthen construction. Eco region selected based on map provided (Marine west coast forest). Predominate existing vegetation considered forest (protected zones). Installed vegetation would include native plants, living roofs, and extensive food producing annual and perennial edible gardens (selected as shrubland). The space footprint of the building installed is 1500 sq. feet. This coincides with the amount of disturbed area. Results Inputs Earthen home Earthen home Oak Bay home Total Square Feet Stories Above Grade Stories Below Grade System Type Wood Concrete Mixed Ecoregion Marine West Coastal Forest Marine West Coastal Forest Marine West Coastal Forest Existing Forest Forest Forest Vegetation Type Installed Vegetation Type Shrubland Shrubland Short grass or lawn Landscape , 000 Disturbed (SF) Landscape Installed (SF) Embodied CO2 62 Metric Tonnes 115 Metric Tonnes 65 Metric Tonnes Building carbon model: Calculator shortfalls for earthen homes:

19 The primary construction system for aboveground earthen home is not available for selection. There is no estimate of carbon intensity ratios for cob in the calculator, something that could presumably be added in the future. An estimation made by selecting (non-certified) wood has significant differences in material properties from a cob mixture but is the calculator s closest representation of cob as a natural biomass on-site building material. Certified wood changes the calculation as it compensates for carbon released and acts as a carbon sink. Earthen systems presumably would also act as a carbon sink or have a negligible comparable carbon impact, as natural biomass materials have negative carbon intensity ratios [1]. Figure 1 Carbon dioxide intensity ratios [2] Note that a system selection of mixed would presumably include large volumes of concrete and steel, which skews the estimation even farther then choosing wood, with an embodied CO2 estimate at 69 metric tonnes. If we were to choose concrete as a building material, for thermal mass similarities, the embodied CO2 estimate jumps to 115 metric tonnes. For comparison, we added our contemporary 1960s home in Oak Bay (drywall, wood frame, brick, concrete, lawn, etc.) and got a comparable 65 metric tonnes. The two homes could not be more different. There is also no compensation in the calculator for substitution of low CO2 impact materials for high CO2 impact materials, or for the selection of high-recycled content materials. This is a particular factor in the consideration for the substitution of fly ash for Portland cement. Portland cement substitutes can significantly reduce the largest component of CO2 emissions in the life cycle of concrete production. The manufacture of portland cement accounts for about 95% of all CO2 emissions resulting from the production of concrete [2]. Landscape footprint:
20 What compensations are there to distinguish a contemporary build from an earthen home created practically on-site? How does the calculator compensate for the 2000 sq foot living roof made up with native plants suitable for climate location and plant life? Is there compensation for large vegetable gardens repurposed from a blasted rock dump that supports the family in residence? What compensations are included for self-sufficient levels of living, to include beehives, chickens, and other urban farming lifestyles created on the previously disturbed construction site? How does the calculator estimate restored site habitat? Though the calculator landscape data is for soil organic carbon and does not include above ground biomass, there should be compensation for restored soil habitat. Total carbon footprint: Since the embodied CO2 calculator s purpose is presumably used as a measure to estimate the global warming potential of construction materials, it seems the calculator falls drastically short of the capability to produce a number for earthen materials used: earth walls, floors, living roof, longevity, less wood, high flyash concrete, home made paint, lime plaster, earth plaster, virtually no caulking, natural materials, very little plastic. Noted about calculator: Tenant improvements, interiors or furniture, fixtures or equipment have not been included in version Calculator principles: The principles behind the calculator suggest a change to a Reduce, Renew, and Offset lifestyle. The current version of the calculator does not compensate for the embodiment of this philosophy in many natural homes, in this instance in particular the Baird Earthen Cob home, where the purchase of carbon offsets in unnecessary. The Baird home has used less to build less, protects and restores the natural ecosystem, is built smart and built efficiently. They use renewable energy, have restored or significantly improved disturbed sites to return to native ecosystems, use natural building materials, and have incorporated recycled and recyclable materials. This has not been reflected in the construction carbon calculator result. Note on Life Cycle Balancing used in calculator: The conventional building data takes into account site excavation, shell and core (structural systems, building envelope and building systems). The building data is based on Life Cycle Balancing and is not applicable to earthen homes. The carbon intensity factors for the calculator are as follows: Shell Known - 12%, Shell Unknown - 12%, Service Systems - 22%, Service Sector - 14%, Substructure Known - 2%, Substructure Unknown - 3%, Other/ Miscellaneous - 5%. Are these suitable for earthen homes? The carbon dioxide intensity ratio (CDIR) is defined here as the ratio between the upstream CO2 impact (emissions minus storage) of a material and the weight of the material. CDIR = (CO2e CO2s)/material end use weight where C O2 e = the weight of upstream C O2 emissions and C O2 s = the equivalent weight of C O2 stored as carbon in the mass of the material. A material with a positive CDIR is a net CO2 source and one with a negative CDIR is a net CO2 sink. Also, a material s initial embodied CO2 and GWP is not the whole story of its environmental sustainability. It s necessary to look beyond that in order to measure a building s true environmental
21 impact. Over 50% of the UK s carbon emissions result from the energy used to heat, cool and light buildings. Over the life of a building, the operational CO2 emissions are far higher than the embodied CO2 of the material used to build it. The whole- life performance and energy consumption of a building are, therefore, vitally important factors to consider when evaluating the sustainability of construction materials. [3] Upstream CO2 emissions (The upstream phase of processing and manufacturing building materials and products causes enormous off- site impacts prior to the building's use) Upstream CO2 emissions are roughly 5 times greater than direct emissions (for construction of the building) and times greater than the annual operation (use) of the building. [1] Some natural organic or biomass materials are net upstream CO2 sinks. In general, the denser the biomass material, the greater the carbon content and the greater the CO2 accumulation [2]. References [1] MacMath, R. and P. Fisk III Life Cycle Balancing: Building Shell, Interiors, & Furnishings Sub-Systems: Nursing and Biomedical Sciences Building. The University of Texas at Houston Health Sciences Center. [2] MacMath, R. and P. Fisk III Carbon Dioxide Intensity Ratios: A Method of Evaluating the Upstream Global Warming Impact of Long-Life Building Materials. Center for Maximum Potential Building Systems; Austin, TX. [3]
22 Carbon Calculation as per inputs from the Environmental Agency and Green Footstep
23
Exercise 6. Solar Panel Orientation EXERCISE OBJECTIVE DISCUSSION OUTLINE. Introduction to the importance of solar panel orientation DISCUSSION
 Exercise 6 Solar Panel Orientation EXERCISE OBJECTIVE When you have completed this exercise, you will understand how the solar illumination at any location on Earth varies over the course of a year. You
not for commercial-scale installations. Thus, there is a need to study the effects of snow on
 1. Problem Statement There is a great deal of uncertainty regarding the effects of snow depth on energy production from large-scale photovoltaic (PV) solar installations. The solar energy industry claims
Solar photovoltaic energy production comparison of east, west, south-facing and tracked arrays
 The Canadian Society for Bioengineering The Canadian society for engineering in agricultural, food, environmental, and biological systems. La Société Canadienne de Génie Agroalimentaire et de Bioingénierie
WHEN IS IT EVER GOING TO RAIN? Table of Average Annual Rainfall and Rainfall For Selected Arizona Cities
 WHEN IS IT EVER GOING TO RAIN? Table of Average Annual Rainfall and 2001-2002 Rainfall For Selected Arizona Cities Phoenix Tucson Flagstaff Avg. 2001-2002 Avg. 2001-2002 Avg. 2001-2002 October 0.7 0.0
Changing Hydrology under a Changing Climate for a Coastal Plain Watershed
 Changing Hydrology under a Changing Climate for a Coastal Plain Watershed David Bosch USDA-ARS, Tifton, GA Jeff Arnold ARS Temple, TX and Peter Allen Baylor University, TX SEWRU Objectives 1. Project changes
Multivariate Regression Model Results
 Updated: August, 0 Page of Multivariate Regression Model Results 4 5 6 7 8 This exhibit provides the results of the load model forecast discussed in Schedule. Included is the forecast of short term system
Champaign-Urbana 2001 Annual Weather Summary
 Champaign-Urbana 2001 Annual Weather Summary ILLINOIS STATE WATER SURVEY 2204 Griffith Dr. Champaign, IL 61820 wxobsrvr@sws.uiuc.edu Maria Peters, Weather Observer January: After a cold and snowy December,
Jackson County 2013 Weather Data
 Jackson County 2013 Weather Data 61 Years of Weather Data Recorded at the UF/IFAS Marianna North Florida Research and Education Center Doug Mayo Jackson County Extension Director 1952-2008 Rainfall Data
Interannual variation of MODIS NDVI in Lake Taihu and its relation to climate in submerged macrophyte region
 Yale-NUIST Center on Atmospheric Environment Interannual variation of MODIS NDVI in Lake Taihu and its relation to climate in submerged macrophyte region ZhangZhen 2015.07.10 1 Outline Introduction Data
2015: A YEAR IN REVIEW F.S. ANSLOW
 2015: A YEAR IN REVIEW F.S. ANSLOW 1 INTRODUCTION Recently, three of the major centres for global climate monitoring determined with high confidence that 2015 was the warmest year on record, globally.
Champaign-Urbana 2000 Annual Weather Summary
 Champaign-Urbana 2000 Annual Weather Summary ILLINOIS STATE WATER SURVEY 2204 Griffith Dr. Champaign, IL 61820 wxobsrvr@sws.uiuc.edu Maria Peters, Weather Observer January: January started on a mild note,
Fire Season Prediction for Canada, Kerry Anderson Canadian Forest Service
 Fire Season Prediction for Canada, 2014 Kerry Anderson Canadian Forest Service 1 Introduction The Canadian Forest Service is now presenting monthly and seasonal forecast maps through the Canadian Wildland
Determine the trend for time series data
 Extra Online Questions Determine the trend for time series data Covers AS 90641 (Statistics and Modelling 3.1) Scholarship Statistics and Modelling Chapter 1 Essent ial exam notes Time series 1. The value
P7.7 A CLIMATOLOGICAL STUDY OF CLOUD TO GROUND LIGHTNING STRIKES IN THE VICINITY OF KENNEDY SPACE CENTER, FLORIDA
 P7.7 A CLIMATOLOGICAL STUDY OF CLOUD TO GROUND LIGHTNING STRIKES IN THE VICINITY OF KENNEDY SPACE CENTER, FLORIDA K. Lee Burns* Raytheon, Huntsville, Alabama Ryan K. Decker NASA, Marshall Space Flight
Chiang Rai Province CC Threat overview AAS1109 Mekong ARCC
 Chiang Rai Province CC Threat overview AAS1109 Mekong ARCC This threat overview relies on projections of future climate change in the Mekong Basin for the period 2045-2069 compared to a baseline of 1980-2005.
EVALUATION OF ALGORITHM PERFORMANCE 2012/13 GAS YEAR SCALING FACTOR AND WEATHER CORRECTION FACTOR
 EVALUATION OF ALGORITHM PERFORMANCE /3 GAS YEAR SCALING FACTOR AND WEATHER CORRECTION FACTOR. Background The annual gas year algorithm performance evaluation normally considers three sources of information
NatGasWeather.com Daily Report
 NatGasWeather.com Daily Report Issue Time: 5:15 pm EST Sunday, February 28 th, 2016 for Monday, Feb 29 th 7-Day Weather Summary (February 28 th March 5 th ): High pressure will dominate much of the US
Drought Characterization. Examination of Extreme Precipitation Events
 Drought Characterization Examination of Extreme Precipitation Events Extreme Precipitation Events During the Drought For the drought years (1999-2005) daily precipitation data was analyzed to find extreme
The Climate of Payne County
 The Climate of Payne County Payne County is part of the Central Great Plains in the west, encompassing some of the best agricultural land in Oklahoma. Payne County is also part of the Crosstimbers in the
Occupant Behavior Related to Space Cooling in a High Rise Residential Building Located in a Tropical Region N.F. Mat Hanip 1, S.A. Zaki 1,*, A. Hagish
 Occupant Behavior Related to Space Cooling in a High Rise Residential Building Located in a Tropical Region N.F. Mat Hanip 1, S.A. Zaki 1,*, A. Hagishima 2, J. Tanimoto 2, and M.S.M. Ali 1 1 Malaysia-Japan
Chapter 3. Regression-Based Models for Developing Commercial Demand Characteristics Investigation
 Chapter Regression-Based Models for Developing Commercial Demand Characteristics Investigation. Introduction Commercial area is another important area in terms of consume high electric energy in Japan.
The Climate of Texas County
 The Climate of Texas County Texas County is part of the Western High Plains in the north and west and the Southwestern Tablelands in the east. The Western High Plains are characterized by abundant cropland
The Climate of Marshall County
 The Climate of Marshall County Marshall County is part of the Crosstimbers. This region is a transition region from the Central Great Plains to the more irregular terrain of southeastern Oklahoma. Average
Project No India Basin Shadow Study San Francisco, California, USA
 Project No. 432301 India Basin Shadow Study San Francisco, California, USA Numerical Modelling Studies 04 th June 2018 For Build Inc. Report Title: India Basin Shadow Study San Francisco, California, USA
ENGINE SERIAL NUMBERS
 ENGINE SERIAL NUMBERS The engine number was also the serial number of the car. Engines were numbered when they were completed, and for the most part went into a chassis within a day or so. However, some
announcements 4/17/08
 Heat Transfer and the Building Envelope ARCH 331/431 Spring 2008 Lecture 6 announcements 4/17/08 A3: Envelope Heat Transfer Assignment: Available later today (course website) References: Available by this
PREDICTING SOIL SUCTION PROFILES USING PREVAILING WEATHER
 PREDICTING SOIL SUCTION PROFILES USING PREVAILING WEATHER Ronald F. Reed, P.E. Member, ASCE rreed@reed-engineering.com Reed Engineering Group, Ltd. 2424 Stutz, Suite 4 Dallas, Texas 723 214-3-6 Abstract
February 10, Mr. Jeff Smith, Chairman Imperial Valley Water Authority E County Road 1000 N Easton, IL Dear Chairman Smith:
 February 1, 1 Mr. Jeff Smith, Chairman Imperial Valley Water Authority 8 E County Road 1 N Easton, IL Dear Chairman Smith: The Illinois State Water Survey (ISWS), under contract to the Imperial Valley
The Climate of Haskell County
 The Climate of Haskell County Haskell County is part of the Hardwood Forest. The Hardwood Forest is characterized by its irregular landscape and the largest lake in Oklahoma, Lake Eufaula. Average annual
The Climate of Pontotoc County
 The Climate of Pontotoc County Pontotoc County is part of the Crosstimbers. This region is a transition region from the Central Great Plains to the more irregular terrain of southeast Oklahoma. Average
The Climate of Grady County
 The Climate of Grady County Grady County is part of the Central Great Plains, encompassing some of the best agricultural land in Oklahoma. Average annual precipitation ranges from about 33 inches in northern
The Climate of Kiowa County
 The Climate of Kiowa County Kiowa County is part of the Central Great Plains, encompassing some of the best agricultural land in Oklahoma. Average annual precipitation ranges from about 24 inches in northwestern
LAB 3: THE SUN AND CLIMATE NAME: LAB PARTNER(S):
:") GEOG 101L PHYSICAL GEOGRAPHY LAB SAN DIEGO CITY COLLEGE SELKIN 1 LAB 3: THE SUN AND CLIMATE NAME: LAB PARTNER(S): The main objective of today s lab is for you to be able to visualize the sun s position
GEOG 101L PHYSICAL GEOGRAPHY LAB SAN DIEGO CITY COLLEGE SELKIN 1 LAB 3: THE SUN AND CLIMATE NAME: LAB PARTNER(S): The main objective of today s lab is for you to be able to visualize the sun s position
The Climate of Bryan County
 The Climate of Bryan County Bryan County is part of the Crosstimbers throughout most of the county. The extreme eastern portions of Bryan County are part of the Cypress Swamp and Forest. Average annual
Agricultural Science Climatology Semester 2, Anne Green / Richard Thompson
 Agricultural Science Climatology Semester 2, 2006 Anne Green / Richard Thompson http://www.physics.usyd.edu.au/ag/agschome.htm Course Coordinator: Mike Wheatland Course Goals Evaluate & interpret information,
The Climate of Seminole County
 The Climate of Seminole County Seminole County is part of the Crosstimbers. This region is a transition region from the Central Great Plains to the more irregular terrain of southeastern Oklahoma. Average
The Climate of Murray County
 The Climate of Murray County Murray County is part of the Crosstimbers. This region is a transition between prairies and the mountains of southeastern Oklahoma. Average annual precipitation ranges from
DROUGHT IN MAINLAND PORTUGAL
 DROUGHT IN MAINLAND Ministério da Ciência, Tecnologia e Ensino Superior Instituto de Meteorologia, I. P. Rua C Aeroporto de Lisboa Tel.: (351) 21 844 7000 e-mail:informacoes@meteo.pt 1749-077 Lisboa Portugal
STATISTICAL FORECASTING and SEASONALITY (M. E. Ippolito; )
") STATISTICAL FORECASTING and SEASONALITY (M. E. Ippolito; 10-6-13) PART I OVERVIEW The following discussion expands upon exponential smoothing and seasonality as presented in Chapter 11, Forecasting, in
STATISTICAL FORECASTING and SEASONALITY (M. E. Ippolito; 10-6-13) PART I OVERVIEW The following discussion expands upon exponential smoothing and seasonality as presented in Chapter 11, Forecasting, in
2015 Fall Conditions Report
 2015 Fall Conditions Report Prepared by: Hydrologic Forecast Centre Date: December 21 st, 2015 Table of Contents Table of Figures... ii EXECUTIVE SUMMARY... 1 BACKGROUND... 2 SUMMER AND FALL PRECIPITATION...
Solar Energy Basics II - Estimation of Solar Radiation to a Solar Panel
 PDHonline Course E287 (3 PDH) Solar Energy Basics II - Estimation of Solar Radiation to a Solar Panel Instructor: Harlan H. Bengtson, Ph.D., PE 2012 PDH Online PDH Center 5272 Meadow Estates Drive Fairfax,
Analysis of Rainfall and Other Weather Parameters under Climatic Variability of Parbhani ( )
") International Journal of Current Microbiology and Applied Sciences ISSN: 2319-7706 Volume 7 Number 06 (2018) Journal homepage: http://www.ijcmas.com Original Research Article https://doi.org/10.20546/ijcmas.2018.706.295
International Journal of Current Microbiology and Applied Sciences ISSN: 2319-7706 Volume 7 Number 06 (2018) Journal homepage: http://www.ijcmas.com Original Research Article https://doi.org/10.20546/ijcmas.2018.706.295
Jackson County 2018 Weather Data 67 Years of Weather Data Recorded at the UF/IFAS Marianna North Florida Research and Education Center
 Jackson County 2018 Weather Data 67 Years of Weather Data Recorded at the UF/IFAS Marianna North Florida Research and Education Center Doug Mayo Jackson County Extension Director 1952-2008 Rainfall Data
NEGST. New generation of solar thermal systems. Advanced applications ENEA. Comparison of solar cooling technologies. Vincenzo Sabatelli
 NEGST New generation of solar thermal systems Advanced applications Comparison of solar cooling technologies Vincenzo Sabatelli ENEA vincenzo.sabatelli@trisaia.enea.it NEGST Workshop - Freiburg - June
Monthly Magnetic Bulletin
 BRITISH GEOLOGICAL SURVEY Ascension Island Observatory Monthly Magnetic Bulletin December 2008 08/12/AS Crown copyright; Ordnance Survey ASCENSION ISLAND OBSERVATORY MAGNETIC DATA 1. Introduction Ascension
LAB 2: Earth Sun Relations
 LAB 2: Earth Sun Relations Name School The amount of solar energy striking the Earth s atmosphere is not uniform; distances, angles and seasons play a dominant role on this distribution of radiation. Needless
Press Release Consumer Price Index October 2017
 Consumer Price Index, base period December 2006 October 2017 The Central Bureau of Statistics presents the most important findings for the Consumer Price Index (CPI) for the month of October 2017. The
CIMA Professional
 CIMA Professional 201819 Birmingham Interactive Timetable Version 3.1 Information last updated 12/10/18 Please note: Information and dates in this timetable are subject to change. A better way of learning
CIMA Professional
 CIMA Professional 201819 Manchester Interactive Timetable Version 3.1 Information last updated 12/10/18 Please note: Information and dates in this timetable are subject to change. A better way of learning
HAIDA GWAII CLIMATE ASSESSMENT 2010 Special Report for MIEDS Franc Pridoehl
 HAIDA GWAII CLIMATE ASSESSMENT 2010 Special Report for MIEDS Franc Pridoehl INTRODUCTION Climatic conditions have varied considerably on Haida Gwaii over the past centuries and millennia (Hebda 2007).
A Report on a Statistical Model to Forecast Seasonal Inflows to Cowichan Lake
 A Report on a Statistical Model to Forecast Seasonal Inflows to Cowichan Lake Prepared by: Allan Chapman, MSc, PGeo Hydrologist, Chapman Geoscience Ltd., and Former Head, BC River Forecast Centre Victoria
HOT /05/2014. Page 1 of 14 GENERAL HOUSE CHARACTERISTICS. Natural Resources CANADA Version sample house report
 Page 1 of 14 File: Application Type: sample house report EnerGuide for New Houses HOT2000 Natural Resources CANADA Version 10.51 Weather Library: C:\H2KEGH~1\Dat\Wth100.dir Weather Data for VANCOUVER,
Monthly Long Range Weather Commentary Issued: APRIL 1, 2015 Steven A. Root, CCM, President/CEO
 Monthly Long Range Weather Commentary Issued: APRIL 1, 2015 Steven A. Root, CCM, President/CEO sroot@weatherbank.com FEBRUARY 2015 Climate Highlights The Month in Review The February contiguous U.S. temperature
Champaign-Urbana 1999 Annual Weather Summary
 Champaign-Urbana 1999 Annual Weather Summary ILLINOIS STATE WATER SURVEY 2204 Griffith Dr. Champaign, IL 61820 wxobsrvr@sws.uiuc.edu Maria Peters, Weather Observer A major snowstorm kicked off the new
REDWOOD VALLEY SUBAREA
 Independent Science Review Panel Conceptual Model of Watershed Hydrology, Surface Water and Groundwater Interactions and Stream Ecology for the Russian River Watershed Appendices A-1 APPENDIX A A-2 REDWOOD
Local Ctimatotogical Data Summary White Hall, Illinois
 SWS Miscellaneous Publication 98-5 STATE OF ILLINOIS DEPARTMENT OF ENERGY AND NATURAL RESOURCES Local Ctimatotogical Data Summary White Hall, Illinois 1901-1990 by Audrey A. Bryan and Wayne Armstrong Illinois
TILT, DAYLIGHT AND SEASONS WORKSHEET
 TILT, DAYLIGHT AND SEASONS WORKSHEET Activity Description: Students will use a data table to make a graph for the length of day and average high temperature in Utah. They will then answer questions based
Drought in Southeast Colorado
 Drought in Southeast Colorado Nolan Doesken and Roger Pielke, Sr. Colorado Climate Center Prepared by Tara Green and Odie Bliss http://climate.atmos.colostate.edu 1 Historical Perspective on Drought Tourism
Variability of Reference Evapotranspiration Across Nebraska
 Know how. Know now. EC733 Variability of Reference Evapotranspiration Across Nebraska Suat Irmak, Extension Soil and Water Resources and Irrigation Specialist Kari E. Skaggs, Research Associate, Biological
C L I M A T E R E S P O N S I V E U R B A N D E S I G N F O R G R E E K P U B L I C S P A C E
 C L I M A T E R E S P O N S I V E U R B A N D E S I G N F O R G R E E K P U B L I C S P A C E Prepared by: Ioannis Karakounos With the guidance of: Raphael Lafargue Kristina Von Bomhard Concept Make public
OPTIMIZATION OF GLOBAL SOLAR RADIATION OF TILT ANGLE FOR SOLAR PANELS, LOCATION: OUARGLA, ALGERIA
 OPTIMIZATION OF GLOBAL SOLAR RADIATION OF TILT ANGLE FOR SOLAR PANELS, LOCATION: OUARGLA, ALGERIA Mohamed Lakhdar LOUAZENE Dris KORICHI Department of Electrical Engineering, University of Ouargla, Algeria.
Champaign-Urbana 1998 Annual Weather Summary
 Champaign-Urbana 1998 Annual Weather Summary ILLINOIS STATE WATER SURVEY Audrey Bryan, Weather Observer 2204 Griffith Dr. Champaign, IL 61820 wxobsrvr@sparc.sws.uiuc.edu The development of the El Nìno
March 5, British Columbia Utilities Commission 6 th Floor, 900 Howe Street Vancouver, BC V6Z 2N3
 Tom A. Loski Chief Regulatory Officer March 5, 2010 British Columbia Utilities Commission 6 th Floor, 900 Howe Street Vancouver, BC V6Z 2N3 16705 Fraser Highway Surrey, B.C. V4N 0E8 Tel: (604) 592-7464
Institut national des sciences appliquées de Strasbourg GENIE CLIMATIQUE ET ENERGETIQUE APPENDICES
 Institut national des sciences appliquées de Strasbourg GENIE CLIMATIQUE ET ENERGETIQUE APPENDICES DEVELOPMENT OF A TOOL, BASED ON THE THERMAL DYNAMIC SIMULATION SOFTWARE TRNSYS, WHICH RUNS PARAMETRIC
Press Release Consumer Price Index December 2014
 Consumer Price Index, base period December 2006 December 2014 The Central Bureau of Statistics presents the most important findings for the Consumer Price Index (CPI) for the month of December 2014. The
8.1 Attachment 1: Ambient Weather Conditions at Jervoise Bay, Cockburn Sound
 8.1 Attachment 1: Ambient Weather Conditions at Jervoise Bay, Cockburn Sound Cockburn Sound is 20km south of the Perth-Fremantle area and has two features that are unique along Perth s metropolitan coast
P7: Limiting Factors in Ecosystems
 P7: Limiting Factors in Ecosystems Purpose To understand that physical factors temperature and precipitation limit the growth of vegetative ecosystems Overview Students correlate graphs of vegetation vigor
SYSTEM BRIEF DAILY SUMMARY
 SYSTEM BRIEF DAILY SUMMARY * ANNUAL MaxTemp NEL (MWH) Hr Ending Hr Ending LOAD (PEAK HOURS 7:00 AM TO 10:00 PM MON-SAT) ENERGY (MWH) INCREMENTAL COST DAY DATE Civic TOTAL MAXIMUM @Max MINIMUM @Min FACTOR
Supplementary appendix
 Supplementary appendix This appendix formed part of the original submission and has been peer reviewed. We post it as supplied by the authors. Supplement to: Lowe R, Stewart-Ibarra AM, Petrova D, et al.
Suppression of colonies of Reticulitermes spp. using the Sentricon termite colony elimination system: : A case study in Chatsworth, CA
 Suppression of colonies of Reticulitermes spp. using the Sentricon termite colony elimination system: : A case study in Chatsworth, CA Gail M. Getty, MS, Chris Solek, MS, Ron 1 1 Sbragia, Ph.D., Michael
DOZENALS. A project promoting base 12 counting and measuring. Ideas and designs by DSA member (#342) and board member, Timothy F. Travis.
 and board member, Timothy F. Travis.") R AENBO DOZENALS A project promoting base 12 counting and measuring. Ideas and designs by DSA member (#342) and board member Timothy F. Travis. I became aware as a teenager of base twelve numbering from
R AENBO DOZENALS A project promoting base 12 counting and measuring. Ideas and designs by DSA member (#342) and board member Timothy F. Travis. I became aware as a teenager of base twelve numbering from
CCMR Educational Programs
 CCMR Educational Programs Title: Date Created: August 10, 2006 Latest Revision: August 10, 2006 Author(s): Myriam Ibarra Appropriate Level: Grades 8-10 Abstract: Energy and the Angle of Insolation Sun
NASA Products to Enhance Energy Utility Load Forecasting
 NASA Products to Enhance Energy Utility Load Forecasting Erica Zell, Battelle zelle@battelle.org, Arlington, VA ESIP 2010 Summer Meeting, Knoxville, TN, July 20-23 Project Overview Funded by the NASA Applied
ADVANCED ROOF COATINGS: MATERIALS AND THEIR APPLICATIONS
 ADVANCED ROOF COATINGS: MATERIALS AND THEIR APPLICATIONS Abstract J.M. Bell 1 and G.B. Smith 2 The use of low emittance and high solar reflectance coatings is widespread in window glazings, wall and roof
2018 Annual Review of Availability Assessment Hours
 2018 Annual Review of Availability Assessment Hours Amber Motley Manager, Short Term Forecasting Clyde Loutan Principal, Renewable Energy Integration Karl Meeusen Senior Advisor, Infrastructure & Regulatory
A summary of the weather year based on data from the Zumwalt weather station
 ZUMWALT PRAIRIE WEATHER 2016 A summary of the weather year based on data from the Zumwalt weather station Figure 1. An unusual summer storm on July 10, 2016 brought the second-largest precipitation day
A Typical Meteorological Year for Energy Simulations in Hamilton, New Zealand
 Anderson T N, Duke M & Carson J K 26, A Typical Meteorological Year for Energy Simulations in Hamilton, New Zealand IPENZ engineering trenz 27-3 A Typical Meteorological Year for Energy Simulations in
PROPOSAL OF SEVEN-DAY DESIGN WEATHER DATA FOR HVAC PEAK LOAD CALCULATION
 Ninth International IBPSA Conference Montréal, Canada August 5-8, PROPOSAL OF SEVEN-DAY DESIGN WEATHER DATA FOR HVAC PEAK LOAD CALCULATION Hisaya ISHINO Faculty of Urban Environmental Sciences, Metropolitan
SYSTEM BRIEF DAILY SUMMARY
 SYSTEM BRIEF DAILY SUMMARY * ANNUAL MaxTemp NEL (MWH) Hr Ending Hr Ending LOAD (PEAK HOURS 7:00 AM TO 10:00 PM MON-SAT) ENERGY (MWH) INCREMENTAL COST DAY DATE Civic TOTAL MAXIMUM @Max MINIMUM @Min FACTOR
SEPTEMBER 2013 REVIEW
 Monthly Long Range Weather Commentary Issued: October 21, 2013 Steven A. Root, CCM, President/CEO sroot@weatherbank.com SEPTEMBER 2013 REVIEW Climate Highlights The Month in Review The average temperature
Press Release Consumer Price Index March 2018
 Consumer Price Index, base period December 2006 March 2018 The Central Bureau of Statistics presents the most important findings for the Consumer Price Index (CPI) for the month of March 2018. The CPI
Monthly Long Range Weather Commentary Issued: February 15, 2015 Steven A. Root, CCM, President/CEO
 Monthly Long Range Weather Commentary Issued: February 15, 2015 Steven A. Root, CCM, President/CEO sroot@weatherbank.com JANUARY 2015 Climate Highlights The Month in Review During January, the average
Thursday 4 June 2015 Afternoon
 Oxford Cambridge and RSA Thursday 4 June 2015 Afternoon AS GCE PHYSICS B (ADVANCING PHYSICS) G492/01 Understanding Processes, Experimentation and Data Handling INSERT *5000035423* Duration: 2 hours INSTRUCTIONS
CIMA Professional 2018
 CIMA Professional 2018 Interactive Timetable Version 16.25 Information last updated 06/08/18 Please note: Information and dates in this timetable are subject to change. A better way of learning that s
Press Release Consumer Price Index April 2018
 [Type text] Press Release Consumer Price Index April 2018 Consumer Price Index, base period December 2006 April 2018 The Central Bureau of Statistics presents the most important findings for the Consumer
Three main areas of work:
 Task 2: Climate Information 1 Task 2: Climate Information Three main areas of work: Collect historical and projected weather and climate data Conduct storm surge and wave modeling, sea-level rise (SLR)
CWV Review London Weather Station Move
 CWV Review London Weather Station Move 6th November 26 Demand Estimation Sub-Committee Background The current composite weather variables (CWVs) for North Thames (NT), Eastern (EA) and South Eastern (SE)
Attachment E: CADP Design Shadow Analysis
 Attachment E: CADP Design Shadow Analysis June 6, 2016 TO: Don Lewis San Francisco Planning Department 1650 Mission Street, Suite 400 San Francisco, CA 94103 SUBJECT: 2060 Folsom Street 17 th & Folsom
Energy Use in Homes. A series of reports on domestic energy use in England. Energy Efficiency
 Energy Use in Homes A series of reports on domestic energy use in England Energy Efficiency Energy Use in Homes A series of reports on domestic energy use in England This is one of a series of three reports
UPPLEMENT A COMPARISON OF THE EARLY TWENTY-FIRST CENTURY DROUGHT IN THE UNITED STATES TO THE 1930S AND 1950S DROUGHT EPISODES
 UPPLEMENT A COMPARISON OF THE EARLY TWENTY-FIRST CENTURY DROUGHT IN THE UNITED STATES TO THE 1930S AND 1950S DROUGHT EPISODES Richard R. Heim Jr. This document is a supplement to A Comparison of the Early
Statistical Analysis of Temperature and Rainfall Trend in Raipur District of Chhattisgarh
 Current World Environment Vol. 10(1), 305-312 (2015) Statistical Analysis of Temperature and Rainfall Trend in Raipur District of Chhattisgarh R. Khavse*, R. Deshmukh, N. Manikandan, J. L Chaudhary and
Comparison of meteorological data from different sources for Bishkek city, Kyrgyzstan
 Comparison of meteorological data from different sources for Bishkek city, Kyrgyzstan Ruslan Botpaev¹*, Alaibek Obozov¹, Janybek Orozaliev², Christian Budig², Klaus Vajen², 1 Kyrgyz State Technical University,
ZUMWALT WEATHER AND CLIMATE ANNUAL REPORT ( )
") ZUMWALT WEATHER AND CLIMATE ANNUAL REPORT (26-29) FINAL DRAFT (9 AUGUST 21) J.D. HANSEN 1, R.V. TAYLOR 2, AND V.S. JANSEN 3 INTRODUCTION The Zumwalt Prairie in northeastern Oregon is a unique grassland
ZUMWALT WEATHER AND CLIMATE ANNUAL REPORT (26-29) FINAL DRAFT (9 AUGUST 21) J.D. HANSEN 1, R.V. TAYLOR 2, AND V.S. JANSEN 3 INTRODUCTION The Zumwalt Prairie in northeastern Oregon is a unique grassland
CIMA Professional 2018
 CIMA Professional 2018 Newcastle Interactive Timetable Version 10.20 Information last updated 12/06/18 Please note: Information and dates in this timetable are subject to change. A better way of learning
Press Release Consumer Price Index December 2018
 [Type text] Press Release Consumer Price Index December 2018 Consumer Price Index, base period December 2006 December 2018 The Central Bureau of Statistics presents the most important findings for the
Experimental measurements and analysis of the indoor conditions in Italian museum storerooms: a study case
 Experimental measurements and analysis of the indoor conditions in Italian museum storerooms: a study case F. Cappelletti, P. Romagnoni and A. Birra University Iuav of Venezia, Italy Aims and methods Analysis
January 25, Summary
 January 25, 2013 Summary Precipitation since the December 17, 2012, Drought Update has been slightly below average in parts of central and northern Illinois and above average in southern Illinois. Soil
The World Bank. Kenya: Off-grid Solar Access Project for Underserved Counties (P160009) Key Dates. Project Development Objectives.
 Key Dates. Project Development Objectives.") Public Disclosure Authorized AFRICA Kenya Energy & Extractives Global Practice IBRD/IDA Investment Project Financing FY 2018 Seq No: 1 ARCHIVED on 24-Oct-2017 ISR29813 Implementing Agencies: Kenya Power
Public Disclosure Authorized AFRICA Kenya Energy & Extractives Global Practice IBRD/IDA Investment Project Financing FY 2018 Seq No: 1 ARCHIVED on 24-Oct-2017 ISR29813 Implementing Agencies: Kenya Power
Climate also has a large influence on how local ecosystems have evolved and how we interact with them.
 The Mississippi River in a Changing Climate By Paul Lehman, P.Eng., General Manager Mississippi Valley Conservation (This article originally appeared in the Mississippi Lakes Association s 212 Mississippi
Colorado s 2003 Moisture Outlook
 Colorado s 2003 Moisture Outlook Nolan Doesken and Roger Pielke, Sr. Colorado Climate Center Prepared by Tara Green and Odie Bliss http://climate.atmos.colostate.edu How we got into this drought! Fort