Spatial Regression Modeling
|
|
|
- Dennis Morgan Lane
- 6 years ago
- Views:
Transcription
1 Spatial Regression Modeling Paul Voss & Katherine Curtis The Center for Spatially Integrated Social Science Santa Barbara, CA July 12-17, 2009 Day 4
2 Plan for today Focus on spatial heterogeneity A bit of wrap-up and EDA regarding our regression results from yesterday morning Putting it all together: A worked example Spatial heterogeneity in relationships Geographically Weighted Regression (GWR) Lab: Spatial regression diagnostics & model strategies; GWR
3 Questions?
4 As class ended yesterday, we quickly looked at the results of a simple OLS multivariate regression model using GeoDa Dependent variable: sqrt(ppov) Independent variables: sqrt(unem) sqrt(pfhh) log(hdplus)
5 Compare R results with the same model run in GeoDa As a reminder, here were the GeoDa results
6 GeoDa output OLS regression Virtually identical results
7 Advantages of AIC and SC Both measures improve (decline) as R 2 increases, but they degrade as the model size increases Like adjusted, R 2, they place a premium on achieving a given fit with a smaller number of parameters per observation, but the penalty for added variables is greater Both criteria have their virtues, neither has an advantage over the other. The SC, with its heavier penalty for degrees of freedom lost, will lean toward a simpler model
8 Some general comments regarding goodness of fit measures R 2 is fine for OLS; other estimators often generate a pseudo R 2 (which is usually the squared correlation of observed and predicted values) Log likelihood values can be used to compare models only if the models are nested AIC is more general measure than log likelihood, but must play by the rules: Like Log likelihood, can use AIC to compare models of the same type (e.g., OLS) with same DV but different specifications, or Can compare models of different types (e.g., OLS, spatial regression, GWR) if they have the same model specification
9 End of digression regarding goodness of fit measures What about all those other diagnostics at the end of the GeoDa regression output?
10 Recall, the lower half of the GeoDa output from the OLS regression run looked like this
11 We need seriously to consider this part of the output There are some troubling numbers here. Let s take them one at a time
12 Part 2 of the GeoDa regression output
13 One advantage of R over GeoDa is that the diagnostic analysis capability is much richer in R And we looked at some of this in the lab session on Tuesda
14 A very useful diagnostic plot. What are we looking for here and what s our conclusion?
15 There are other common residual diagnostic plots. Here s a residual vs. carrier plot Heteroskedasticity? Probably
16 Another residual vs. carrier plot Heteroskedasticity? Probably, although the fan seems a bit softer to me
17 Another residual vs. carrier plot Seems to be much less heteroskedasticity coming from the education variable
18 What about the rejection of normality among residuals found in the GeoDa run? They don t look too bad here. Maybe it s the sample size that s just giving us a large JB statistic Shapiro-Wilk normality test gives us the same story, however: data: residuals(reg1) W = , p-value = 6.702e-16
19 How can the Q-Q plot of residuals further inform us? The residual Q-Q plot confirms that we have a problem. The problem continues even if we remove the most obvious offenders (almost all counties in Texas)
20 What about the rejection of normality among residuals found in the GeoDa run? Here it is with 8 serious outliers removed from the plot. Better, but still some problems. Shapiro-Wilk normality test data: residuals(reg1)[-c(275, 774, 1048, 1066, 1114, 1130, 1135, 1143)] W = , p-value = 3.867e-07
21 What s the take-home message? GeoDa and R give us the same message (which they should!) Unless you re very fortunate, the OLS model diagnostics almost always leave us with a bad taste. Why? Because we need to and want to move on. We especially want to do something about the spatial autocorrelation in the residuals But neither the residual Moran statistic nor the Lagrange multiplier statistics are trustworthy in the presence of non-normality & heteroskedasticy Furthermore, Monte Carlo simulations have shown that in the presence of residual spatial autocorrelation, heteroskedasticity is induced This is where we begin to look for ways of reducing the unresolved heterogeneity that appears to be plaguing our OLS model
22 Perhaps a worked example will help An example using county levels of child poverty, all U.S. counties: 2000
23 Objective Considering spatial effects when analyzing the uneven geographic distribution of child poverty in the U.S. Still a work in progress A central issue is whether to model our data under an assumption of spatial dependence or spatial heterogeneity
24 Our Data Proportion of Children in Poverty (transformed) 2000 Census of Population (U.S.) Counties are unit of analysis (n = 3,074) Contiguous 48 states only Most indep. cities merged with surrounding county

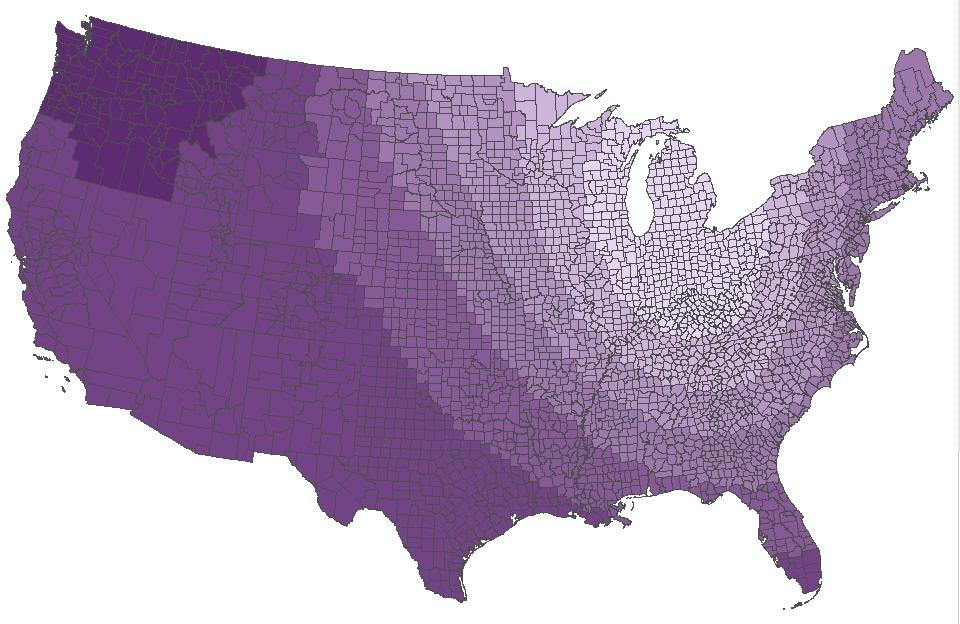
25 Log Odds of Proportion of Children in Poverty: 2000
26 Industrial Structure % Extr. ind. % Non dur. mfg. ind. % Misc. svcs. % Prof. svcs. Our Model (after Friedman and Lichter, 1998) Emp. Oppy. Structure % Unemp. % Males under emp. Family Structure % of families w/ children headed by females Control Variables % Hispanic % Black % HS or less % Emp. in county Log Odds % Children in Poverty
27 Begin with a Standard Regression Approach and examine the diagnostics
28 Standard Regression Results Variable Industrial composition: Parameter (p-value) Extractive (+) (0.0000) Non-durable manufacturing (+) (0.5359) ns Miscellaneous services (+) (0.2215) ns Professional services (-) (0.0000) Local employment opportunities: Prop. LF unemployed (+) (0.0000) Prop. male underemployment (+) (0.0000) Family structure: Prop. Female-headed families (+) (0.0000) Control variables: Proportion black (+) (0.5254) ns Proportion Hispanic (+) (0.0000) Prop. HS education or less (+) (0.0000) Proportion work in county (+) (0.0000) Intercept (0.0000) Adjusted R Jarque-Bera test (normality of errors) (0.0000) B-P test (Heteroskedasticity) (0.0000) Moran s I (residuals) (0.0000) Compare Moran s I on dep. var. = 0.590
29 Test for Normality of Residuals JB = n 6 k S 2 K + ( 3) 4 2 H : JB = 0 0 The statistic has an asymptotic chisquared distribution with two degrees of freedom (one for skewness, one for kurtosis). 5% critical value is 5.99
30 Tests for Heteroskedasticity H = E 2 i Var[ ε ] [ ] = 0 i : ε σ 2 H A + : σ 2 = σ 2 f ( α z α ) i 0 p p Breusch and Pagan (1979) Koenker and Bassett (1982) White (1980) p Tests are not valid in the presence of spatial dependence
31 Standard Regression Results Variable Industrial composition: Parameter (p-value) Extractive (+) (0.0000) Non-durable manufacturing (+) (0.5359) ns Miscellaneous services (+) (0.2215) ns Professional services (-) (0.0000) Local employment opportunities: Prop. LF unemployed (+) (0.0000) Prop. male underemployment (+) (0.0000) Family structure: Prop. Female-headed families (+) (0.0000) Control variables: Proportion black (+) (0.5254) ns Proportion Hispanic (+) (0.0000) Prop. HS education or less (+) (0.0000) Proportion work in county (+) (0.0000) Intercept (0.0000) Adjusted R Jarque-Bera test (normality of errors) (0.0000) B-P test (Heteroskedasticity) (0.0000) Moran s I (residuals) (0.0000)
32 So, what to do now.(?) Proceed directly to re-specify the process under a spatial dependence assumption? A common approach, but not necessarily the best one. We really should try first to do something with the obvious spatial heterogeneity (non-stationarity) Moreover, are we ready at this point to assume that poverty is a social phenomenon resulting from spatial interaction? Eliminate or control for the spatial heterogeneity? Model it first and then work with residuals as the new dependent variable Add a trend surface to our OLS model Seek other variables to improve specification? Identify spatial regimes and interaction effects Shift to a space-time framework
33 We ll proceed to perform each of these options and comment along the way Hopefully in the end we ll have some sense of reasonable ways to introduce the different spatial effects as possible alternative datagenerating processes w.r.t. child poverty
34 So let s proceed directly to re-specify the process under a spatial dependence assumption The Lagrange Multiplier statistics suggested preference for a spatial error dependence model
35 Spatial Dependence Models Variable (A) = OLS (A) + Spatial Lag (A) + Spatial Error (Several control variables) *** (***) *** (***) *** (***) Industrial composition: Extractive (0.0000) (0.0000) (0.0000) Non-durable manufacturing (0.5359) ns (0.9383) ns (0.6720) ns Miscellaneous services ( ) ns (0.8432) ns (0.8830) ns Professional services (0.0000) ( ) (0.0366) Local employment opportunities: Prop. LF unemployed (0.0000) (0.0000) (0.0000) Prop. male underemployment (0.0000) (0.0000) (0.0000) Family structure: Prop. Female-headed families (0.0000) (0.0000) (0.0000) Intercept: (0.0000) (0.0000) (0.0000) Spatial parameter: (0.0000) (0.0000) Diagnostics: Robust LM (lag) (0.0000) Robust LM (error) (0.0000) Heteroskedasticity (B-P) (0.0000) (0.0000) (0.0000) Likelihood AIC Moran s I (residuals)
36 So Where are we? Happy with these results? In particular, are we satisfied with the spatial error dependence model? Write it up and ship it off?? But what s our theory? How do we introduce the spatial dependence model? or interpret it? What about apparent unresolved spatial dependence and heterogeneity? Just let it go?
37 A brief digression to address the theory question Why do high poverty counties (and low poverty counties) cluster in space? Poverty spillover Importance of family Welfare levels as product of spatial dependence Tendency of non-poor to live near one another Role of government in fostering economic segregation Legacy effects
38 So let s say we re satisfied with the spatial dependence model But what about the apparent heteroskedasticity in the spatial error model? This clearly is a sign that we ve not resolved the nonstationarity (heterogeneity) in our model and this has consequences Just ignore the heterogeneity? Try to model it first and then examine the remaining dependence process assuming stationarity? Bring it into our model? how? trend surface?
39 Trend Surface Analysis One commonly suggested approach to handling spatial heterogeneity Alas, there are problems (Ripley, 1981) It tends to distort ( wave ) the surface at the edges of the area in order to fit points in the center For higher orders, the polynomial terms tend to be highly correlated, causing fierce multicollinearity problems Uneven distribution in the data can distort the fit High positive autocorrelation in the process can lead to a tendency to fit a surface of too high an order Nevertheless

40 Second-Order Trend Surface?
41 Variable (A) OLS (B) Trend Surface only (Several control variables) *** (***) *** (***) Industrial composition: (C) OLS Vars + Trend Extractive (0.0000) (0.0000) Non-durable manufacturing (0.5359) ns (0.7781) ns Miscellaneous services (0.2215) ns (0.9785) ns Professional services (0.0000) (0.0000) Local employment opportunities: Prop. LF unemployed (0.0000) (0.0000) Prop. male underemployment (0.0000) (0.0000) Family structure: Prop. Female-headed families (0.0000) (0.0000) Intercept (0.0000) (0.0000) (0.0026) Large-scale spatial effect: Trend Surface Models Long (0.0021) (0.0000) Lat (0.0000) (0.0000) Long (0.8756) ns (0.8271) ns Lat (0.0000) (0.0628) ns Long * Lat (0.0000) (0.0000) AIC Moran s I (residuals)
42 Might even try adding the spatial dependence processes to this latter model Such models assume the data-generating process is approximated both by a spatial heterogeneity component and a spatial dependence component
43 Variable (C) OLS vars + trend (C) + Spatial Lag (C) + Spatial Error (Several control variables) *** (***) *** (***) *** (***) Industrial composition: Extractive (0.0000) (0.0000) (0.0000) Non-durable manufacturing (0.7781) ns (0.7753) ns (0.7941) ns Miscellaneous services (0.9785) ns (0.7375) ns (0.8159) ns Professional services (0.0000) (0.0019) (0.0111) Local employment opportunities: Prop. LF unemployed (0.0000) (0.0000) (0.0000) Prop. male underemployment (0.0000) (0.0000) (0.0000) Family structure: OLS Vars. + Trend Surface + Spatial Effects Prop. Female-headed families (0.0000) (0.0000) (0.0000) Intercept (0.0026) (0.0000) (0.1065) ns Large-scale spatial effect: Long (0.0000) (0.0125) (0.0539) ns Lat (0.0000) (0.5547) ns (0.0060) Long (0.8271) ns (0.2715) ns (0.4405) ns Lat (0.0628) ns (0.0001) (0.3379) ns Long * Lat (0.0000) (0.0000) (0.0000) AIC Moran s I (residuals)
44 We now continue by asking whether unresolved spatial heterogeneity (and the consequent heteroskedasticity in the model) might better be addressed by exploring the role of a key missing variable What might be a good candidate for such a variable? Possibly a poverty legacy variable?
45 Models with Legacy Variable (1980 child poverty) Variable OLS + Legacy OLS + Legacy + Trend OLS + Leg + Trend + Sp Error (Several control variables) *** (***) *** (***) *** (***) Industrial composition: Extractive (0.0000) (0.0000) (0.0000) Non-durable manufacturing (0.9391) ns (0.4043) ns (0.8861) ns Miscellaneous services (0.7216) ns (0.3819) ns (0.2923) ns Professional services (0.0004) (0.0001) (0.0260) Local employment opportunities: Prop. LF unemployed (0.0000) (0.0000) (0.0000) Prop. male underemployment (0.0000) (0.0000) (0.0000) Family structure: Prop. Female-headed families (0.0000) (0.0000) (0.0000) Intercept: Legacy: Poverty rate in (0.0000) (0.0000) (0.0000) Large scale trend *** (***) *** (***) Spatial error parameter (0.0000) Diagnostics: Heteroskedasticity (B-P) Likelihood AIC Moran s I (residuals)
46 Concluding Comments Attention to spatial effects gives us better parameter estimates than OLS and a model with much improved diagnostics Combining corrections for both spatial heterogeneity and spatial dependence appears to give us a more realistic model Addition of the temporally lagged dependent variable ( legacy effect) gives us a strong additional predictor variable without seriously attenuating the contributions of other IVs w.r.t. the determinants of child poverty, attributes of place retain a strong causal influence even after controlling for family-level attributes and the temporally lagged dependent variable
47 Questions about the example?
48 Geographically Weighted Regression Again, our child poverty data
49 Log Odds of Proportion of Children in Poverty: 2000
50 Industrial Structure % Extr. Ind. % Non Dur Ind. % Misc. Svcs. % Prof. Svcs Same Model (after Friedman and Lichter, 1998) Emp. Oppy. Structure % Unemp % Males under emp. Family Structure % of families w/ children headed by females Control Variables % Hispanic % Black % HS or less % Emp. in county Log Odds % Children in Poverty
51 Now, we ll take a look at a particular form of spatial heterogeneity: heterogeneity in relationships Enter GWR


52 Geographically Weighted Regression: the analysis of spatially varying relationships A. Stewart Fotheringham, Chris Brunsdon, and Martin Charlton (John Wiley & Sons, Ltd, 2002)
53 GWR Software GWR 3.x Software developed by Stewart Fotheringham Martin Charlton Chris Brunsdon University of Newcastle upon Tyne (at the time)
54 Standard Regression y i = β + β x + β x β x + 0 where: 1 1i βˆ = 2 2i ( X X T ) 1 T X y k ki ε i Contrast Geographically Weighted Regression (GWR) y i = β + β x + β x β x + 0i 1i 1i 2i 2i ki ki ε i where: βˆ i = T ( X W X i ) 1 T X W y i

55 Schematic Showing Kernel Estimation
56 Basic Operation of GWR 3.x Data Ideas GWR MODEL EDITOR Creates a Control File RUN PROGRAM Listing File Output File Map Results ArcGIS Other GIS Files
57 Here s how it works Log Odds of Proportion of Children in Poverty: 2000

58 Regression Intercept Global =

59 T-value: Regression Intercept
60 Variable: Prop. H.S. Educ. or Less Global: 2.6 Local:
61 Variable: Proportion Labor Force Unemployed Global: 4.2 Local:
62 Variable: Prop. Extractive Industries Global: 2.5 Local:
63 Variable: Prop. Female Headed Households Global: 3.9 Local: ns


64 Local R 2 Values Global R 2 : 0.713
65 Strengths of GWR Potentially important tool when exploring spatial data. Nothing is the same everywhere. Helps you to understand spatial heterogeneity in your data. Provides better understanding global model. Serves as a device for possibly identifying specification errors in global model (e.g., important interaction effects). Thus, GWR and local analysis becomes a potential model-building procedure Permits logistic regression and Poisson regression as well as normal regression
66 Okay. Pretty slick! Everyone likes this, right? Well, No
67 Some faults regarding GWR Very rote. Regression undertaken at each regression point without much care regarding regression assumptions Data with spatially autocorrelated residuals fit with OLS rather than spatial regression model (MLE, IV/GMM) The results are not easily amenable to tabular presentation; they often make great maps, however
68 But Wait There s More Usual rule in regression: n observations, k parameters; n >> k GWR fits n x k parameters with only n observations Some unusual results arising from GWR are not yet fully understood. For example, it has been observed and commented upon that GWR can sometimes generate high (negative) correlations among estimated parameters
69 Variables: Proportion Black vs. Proportion Nondurable Manufacturing Pearson s r =.368 PROBLCK PRONMAN 3 2 Parameters: Proportion Black vs. Proportion Nondurable Manufacturing Pearson s r = PARM_ PARM_9
70 David Wheeler & Michael Tiefelsdorf Journal of Geographical Systems 7(2005): GWR appears to amplify regression parameter correlations present in global model One local parameter pattern can be used to predict another local parameter pattern Misspecified kernel function increases coefficient correlation Perhaps, local spatial autocorrelation among the residuals influences the parameter correlation
71 Readings for today Fotheringham, A. Stewart, and Chris Brunsdon Local forms of Spatial Analysis. Geographical Analysis 31(4): Wheeler, David, and Michael Tiefelsdorf Multicollinearity and Correlation among Local Regression Coefficients in Geographically Weighted Regression. Journal of Geographical Systems 7: Messner, Steven F., and Luc Anselin Spatial Analyses of Homicide with Areal Data. Pp in Michael F. Goodchild and Donald G. Janelle (eds.) Spatially Integrated Social Science. (Oxford: Oxford University Press). O Loughlin, John, Colin Flint, and Luc Anselin The Geography of the Nazi Vote: Context, Confession, and Class in the Reichstag Election of Annals of the Association of American Geographers 84(3):
72 Questions?
73 Afternoon Lab GWR hands on (in R)
Using Spatial Statistics Social Service Applications Public Safety and Public Health
 Using Spatial Statistics Social Service Applications Public Safety and Public Health Lauren Rosenshein 1 Regression analysis Regression analysis allows you to model, examine, and explore spatial relationships,
Community & Environmental Sociology/Sociology 977 Spatial Data Analysis
 Community & Environmental Sociology/Sociology 977 Spatial Data Analysis Spring 2012 Katherine Curtis Class Meeting: 301 Ag Hall, Labs 3218 SS 316B Ag Hall/4424 Social Sciences Class Hours: Thursdays, 1:20-3:15P
Exploratory Spatial Data Analysis (ESDA)
") Exploratory Spatial Data Analysis (ESDA) VANGHR s method of ESDA follows a typical geospatial framework of selecting variables, exploring spatial patterns, and regression analysis. The primary software
Exploratory Spatial Data Analysis (ESDA) VANGHR s method of ESDA follows a typical geospatial framework of selecting variables, exploring spatial patterns, and regression analysis. The primary software
Spatial Regression Modeling
 Spatial Regression Modeling Paul Voss & Katherine Curtis The Center for Spatially Integrated Social Science Santa Barbara, CA July 12-17, 2009 Day 1 Objective Provide a solid introduction and overview
GIS Analysis: Spatial Statistics for Public Health: Lauren M. Scott, PhD; Mark V. Janikas, PhD
 Some Slides to Go Along with the Demo Hot spot analysis of average age of death Section B DEMO: Mortality Data Analysis 2 Some Slides to Go Along with the Demo Do Economic Factors Alone Explain Early Death?
Spatial Regression. 3. Review - OLS and 2SLS. Luc Anselin. Copyright 2017 by Luc Anselin, All Rights Reserved
 Spatial Regression 3. Review - OLS and 2SLS Luc Anselin http://spatial.uchicago.edu OLS estimation (recap) non-spatial regression diagnostics endogeneity - IV and 2SLS OLS Estimation (recap) Linear Regression
Introduction. Part I: Quick run through of ESDA checklist on our data
 CSDE GIS Workshop Series Spatial Regression Chris Fowler csfowler@uw.edu Introduction The goal of these exercises is to give you a chance to put the concepts we have just discussed into practice. Keep
Modeling the Ecology of Urban Inequality in Space and Time
 Modeling the Ecology of Urban Inequality in Space and Time Corina Graif PhD Candidate, Department Of Sociology Harvard University Presentation for the Workshop on Spatial and Temporal Modeling, Center
Attribute Data. ArcGIS reads DBF extensions. Data in any statistical software format can be
 This hands on application is intended to introduce you to the foundational methods of spatial data analysis available in GeoDa. We will undertake an exploratory spatial data analysis, of 1,387 southern
SPACE Workshop NSF NCGIA CSISS UCGIS SDSU. Aldstadt, Getis, Jankowski, Rey, Weeks SDSU F. Goodchild, M. Goodchild, Janelle, Rebich UCSB
 SPACE Workshop NSF NCGIA CSISS UCGIS SDSU Aldstadt, Getis, Jankowski, Rey, Weeks SDSU F. Goodchild, M. Goodchild, Janelle, Rebich UCSB August 2-8, 2004 San Diego State University Some Examples of Spatial
Introduction to Spatial Regression Analysis ICPSR Summer Program University of North Carolina at Chapel Hill. University of Wisconsin-Madison
 Introduction to Spatial Regression Analysis ICPSR Summer Program 2012 Paul R. Voss 1 and Katherine J. Curtis 2 1 University of North Carolina at Chapel Hill 2 University of Wisconsin-Madison 1 Odum Institute
1Department of Demography and Organization Studies, University of Texas at San Antonio, One UTSA Circle, San Antonio, TX
 Well, it depends on where you're born: A practical application of geographically weighted regression to the study of infant mortality in the U.S. P. Johnelle Sparks and Corey S. Sparks 1 Introduction Infant
ESRI 2008 Health GIS Conference
 ESRI 2008 Health GIS Conference An Exploration of Geographically Weighted Regression on Spatial Non- Stationarity and Principal Component Extraction of Determinative Information from Robust Datasets A
Modeling Spatial Relationships Using Regression Analysis. Lauren M. Scott, PhD Lauren Rosenshein Bennett, MS
 Modeling Spatial Relationships Using Regression Analysis Lauren M. Scott, PhD Lauren Rosenshein Bennett, MS Workshop Overview Answering why? questions Introduce regression analysis - What it is and why
Spatial Regression. 10. Specification Tests (2) Luc Anselin. Copyright 2017 by Luc Anselin, All Rights Reserved
 Luc Anselin. Copyright 2017 by Luc Anselin, All Rights Reserved") Spatial Regression 10. Specification Tests (2) Luc Anselin http://spatial.uchicago.edu 1 robust LM tests higher order tests 2SLS residuals specification search 2 Robust LM Tests 3 Recap and Notation LM-Error
Spatial Regression 10. Specification Tests (2) Luc Anselin http://spatial.uchicago.edu 1 robust LM tests higher order tests 2SLS residuals specification search 2 Robust LM Tests 3 Recap and Notation LM-Error
Spatial Investigation of Mineral Transportation Characteristics in the State of Washington
 Khachatryan, Jessup 1 Spatial Investigation of Mineral Transportation Characteristics in the State of Washington Hayk Khachatryan Graduate Student Email: hkhachatryan@wsu.edu Eric L. Jessup Assistant Professor
GeoDa-GWR Results: GeoDa-GWR Output (portion only): Program began at 4/8/2016 4:40:38 PM
: Program began at 4/8/2016 4:40:38 PM") New Mexico Health Insurance Coverage, 2009-2013 Exploratory, Ordinary Least Squares, and Geographically Weighted Regression Using GeoDa-GWR, R, and QGIS Larry Spear 4/13/2016 (Draft) A dataset consisting
New Mexico Health Insurance Coverage, 2009-2013 Exploratory, Ordinary Least Squares, and Geographically Weighted Regression Using GeoDa-GWR, R, and QGIS Larry Spear 4/13/2016 (Draft) A dataset consisting
Spatial Analysis 1. Introduction
 Spatial Analysis 1 Introduction Geo-referenced Data (not any data) x, y coordinates (e.g., lat., long.) ------------------------------------------------------ - Table of Data: Obs. # x y Variables -------------------------------------
G. S. Maddala Kajal Lahiri. WILEY A John Wiley and Sons, Ltd., Publication
 G. S. Maddala Kajal Lahiri WILEY A John Wiley and Sons, Ltd., Publication TEMT Foreword Preface to the Fourth Edition xvii xix Part I Introduction and the Linear Regression Model 1 CHAPTER 1 What is Econometrics?
Modeling Spatial Relationships using Regression Analysis
 Esri International User Conference San Diego, CA Technical Workshops July 2011 Modeling Spatial Relationships using Regression Analysis Lauren M. Scott, PhD Lauren Rosenshein, MS Mark V. Janikas, PhD Answering
Modeling Spatial Relationships Using Regression Analysis
 Esri International User Conference San Diego, California Technical Workshops July 24, 2012 Modeling Spatial Relationships Using Regression Analysis Lauren M. Scott, PhD Lauren Rosenshein Bennett, MS Answering
A Guide to Modern Econometric:
 A Guide to Modern Econometric: 4th edition Marno Verbeek Rotterdam School of Management, Erasmus University, Rotterdam B 379887 )WILEY A John Wiley & Sons, Ltd., Publication Contents Preface xiii 1 Introduction
Medical GIS: New Uses of Mapping Technology in Public Health. Peter Hayward, PhD Department of Geography SUNY College at Oneonta
 Medical GIS: New Uses of Mapping Technology in Public Health Peter Hayward, PhD Department of Geography SUNY College at Oneonta Invited research seminar presentation at Bassett Healthcare. Cooperstown,
A GEOSTATISTICAL APPROACH TO PREDICTING A PHYSICAL VARIABLE THROUGH A CONTINUOUS SURFACE
 Katherine E. Williams University of Denver GEOG3010 Geogrpahic Information Analysis April 28, 2011 A GEOSTATISTICAL APPROACH TO PREDICTING A PHYSICAL VARIABLE THROUGH A CONTINUOUS SURFACE Overview Data
ECON 497: Lecture 4 Page 1 of 1
 ECON 497: Lecture 4 Page 1 of 1 Metropolitan State University ECON 497: Research and Forecasting Lecture Notes 4 The Classical Model: Assumptions and Violations Studenmund Chapter 4 Ordinary least squares
LEHMAN COLLEGE CITY UNIVERSITY OF NEW YORK DEPARTMENT OF ENVIRONMENTAL, GEOGRAPHIC, AND GEOLOGICAL SCIENCES CURRICULAR CHANGE
 LEHMAN COLLEGE CITY UNIVERSITY OF NEW YORK DEPARTMENT OF ENVIRONMENTAL, GEOGRAPHIC, AND GEOLOGICAL SCIENCES CURRICULAR CHANGE Hegis Code: 2206.00 Program Code: 452/2682 1. Type of Change: New Course 2.
County child poverty rates in the US: a spatial regression approach
 Popul Res Policy Rev (2006) 25:369 391 DOI 10.1007/s11113-006-9007-4 County child poverty rates in the US: a spatial regression approach Paul R. Voss Æ David D. Long Æ Roger B. Hammer Æ Samantha Friedman
Decision 411: Class 7
 Decision 411: Class 7 Confidence limits for sums of coefficients Use of the time index as a regressor The difficulty of predicting the future Confidence intervals for sums of coefficients Sometimes the
CSISS Tools and Spatial Analysis Software
 CSISS Tools and Spatial Analysis Software June 5, 2006 Stephen A. Matthews Associate Professor of Sociology & Anthropology, Geography and Demography Director of the Geographic Information Analysis Core
Departamento de Economía Universidad de Chile
 Departamento de Economía Universidad de Chile GRADUATE COURSE SPATIAL ECONOMETRICS November 14, 16, 17, 20 and 21, 2017 Prof. Henk Folmer University of Groningen Objectives The main objective of the course
Spatial Variation in Infant Mortality with Geographically Weighted Poisson Regression (GWPR) Approach
 Approach") Spatial Variation in Infant Mortality with Geographically Weighted Poisson Regression (GWPR) Approach Kristina Pestaria Sinaga, Manuntun Hutahaean 2, Petrus Gea 3 1, 2, 3 University of Sumatera Utara,
Spatial Variation in Infant Mortality with Geographically Weighted Poisson Regression (GWPR) Approach Kristina Pestaria Sinaga, Manuntun Hutahaean 2, Petrus Gea 3 1, 2, 3 University of Sumatera Utara,
Longitudinal Data Analysis Using Stata Paul D. Allison, Ph.D. Upcoming Seminar: May 18-19, 2017, Chicago, Illinois
 Longitudinal Data Analysis Using Stata Paul D. Allison, Ph.D. Upcoming Seminar: May 18-19, 217, Chicago, Illinois Outline 1. Opportunities and challenges of panel data. a. Data requirements b. Control
Empirical Economic Research, Part II
 Based on the text book by Ramanathan: Introductory Econometrics Robert M. Kunst robert.kunst@univie.ac.at University of Vienna and Institute for Advanced Studies Vienna December 7, 2011 Outline Introduction
Introduction to Spatial Statistics and Modeling for Regional Analysis
 Introduction to Spatial Statistics and Modeling for Regional Analysis Dr. Xinyue Ye, Assistant Professor Center for Regional Development (Department of Commerce EDA University Center) & School of Earth,
A Space-Time Model for Computer Assisted Mass Appraisal
 RICHARD A. BORST, PHD Senior Research Scientist Tyler Technologies, Inc. USA Rich.Borst@tylertech.com A Space-Time Model for Computer Assisted Mass Appraisal A Computer Assisted Mass Appraisal System (CAMA)
Introduction to Spatial Regression Analysis ICPSR 2014
 Introduction to Spatial Regression Analysis ICPSR 2014 Elisabeth Dowling Root (roote@colorado.edu) University of Colorado, Boulder Department of Geography and Institute of Behavioral Science 1440 15 th
Time: the late arrival at the Geocomputation party and the need for considered approaches to spatio- temporal analyses
 Time: the late arrival at the Geocomputation party and the need for considered approaches to spatio- temporal analyses Alexis Comber 1, Paul Harris* 2, Narumasa Tsutsumida 3 1 School of Geography, University
Panel Data. March 2, () Applied Economoetrics: Topic 6 March 2, / 43
 Applied Economoetrics: Topic 6 March 2, / 43") Panel Data March 2, 212 () Applied Economoetrics: Topic March 2, 212 1 / 43 Overview Many economic applications involve panel data. Panel data has both cross-sectional and time series aspects. Regression
Panel Data March 2, 212 () Applied Economoetrics: Topic March 2, 212 1 / 43 Overview Many economic applications involve panel data. Panel data has both cross-sectional and time series aspects. Regression
Application of Spatial Regression Models to Income Poverty Ratios in Middle Delta Contiguous Counties in Egypt
 Application of Spatial Regression Models to Income Poverty Ratios in Middle Delta Contiguous Counties in Egypt Sohair F Higazi Dept. Applied Statistics Faculty of Commerce, Tanta University, Tanta, Egypt
A Space-Time Model of Fertility and Development in China, Katherine King University of Michigan
 A Space-Time Model of Fertility and Development in China, 1982-2000 Katherine King University of Michigan Abstract Although China is extremely regionally diverse and fertility policy is implemented at
GeoDa and Spatial Regression Modeling
 GeoDa and Spatial Regression Modeling June 9, 2006 Stephen A. Matthews Associate Professor of Sociology & Anthropology, Geography and Demography Director of the Geographic Information Analysis Core Population
Statistics: A review. Why statistics?
 Statistics: A review Why statistics? What statistical concepts should we know? Why statistics? To summarize, to explore, to look for relations, to predict What kinds of data exist? Nominal, Ordinal, Interval
Testing Restrictions and Comparing Models
 Econ. 513, Time Series Econometrics Fall 00 Chris Sims Testing Restrictions and Comparing Models 1. THE PROBLEM We consider here the problem of comparing two parametric models for the data X, defined by
Community Health Needs Assessment through Spatial Regression Modeling
 Community Health Needs Assessment through Spatial Regression Modeling Glen D. Johnson, PhD CUNY School of Public Health glen.johnson@lehman.cuny.edu Objectives: Assess community needs with respect to particular
Introduction to Eco n o m et rics
 2008 AGI-Information Management Consultants May be used for personal purporses only or by libraries associated to dandelon.com network. Introduction to Eco n o m et rics Third Edition G.S. Maddala Formerly
Spatial Analysis 2. Spatial Autocorrelation
 Spatial Analysis 2 Spatial Autocorrelation Spatial Autocorrelation a relationship between nearby spatial units of the same variable If, for every pair of subareas i and j in the study region, the drawings
:Effects of Data Scaling We ve already looked at the effects of data scaling on the OLS statistics, 2, and R 2. What about test statistics?
 MRA: Further Issues :Effects of Data Scaling We ve already looked at the effects of data scaling on the OLS statistics, 2, and R 2. What about test statistics? 1. Scaling the explanatory variables Suppose
LATVIAN GDP: TIME SERIES FORECASTING USING VECTOR AUTO REGRESSION
 LATVIAN GDP: TIME SERIES FORECASTING USING VECTOR AUTO REGRESSION BEZRUCKO Aleksandrs, (LV) Abstract: The target goal of this work is to develop a methodology of forecasting Latvian GDP using ARMA (AutoRegressive-Moving-Average)
Estimation and Hypothesis Testing in LAV Regression with Autocorrelated Errors: Is Correction for Autocorrelation Helpful?
 Journal of Modern Applied Statistical Methods Volume 10 Issue Article 13 11-1-011 Estimation and Hypothesis Testing in LAV Regression with Autocorrelated Errors: Is Correction for Autocorrelation Helpful?
Econometrics with Observational Data. Introduction and Identification Todd Wagner February 1, 2017
 Econometrics with Observational Data Introduction and Identification Todd Wagner February 1, 2017 Goals for Course To enable researchers to conduct careful quantitative analyses with existing VA (and non-va)
Spatial Effects and Externalities
 Spatial Effects and Externalities Philip A. Viton November 5, Philip A. Viton CRP 66 Spatial () Externalities November 5, / 5 Introduction If you do certain things to your property for example, paint your
Geographically Weighted Regression as a Statistical Model
 Geographically Weighted Regression as a Statistical Model Chris Brunsdon Stewart Fotheringham Martin Charlton October 6, 2000 Spatial Analysis Research Group Department of Geography University of Newcastle-upon-Tyne
Running head: GEOGRAPHICALLY WEIGHTED REGRESSION 1. Geographically Weighted Regression. Chelsey-Ann Cu GEOB 479 L2A. University of British Columbia
 Running head: GEOGRAPHICALLY WEIGHTED REGRESSION 1 Geographically Weighted Regression Chelsey-Ann Cu 32482135 GEOB 479 L2A University of British Columbia Dr. Brian Klinkenberg 9 February 2018 GEOGRAPHICALLY
Katherine J. Curtis 1, Heather O Connell 1, Perla E. Reyes 2, and Jun Zhu 1. University of Wisconsin-Madison 2. University of California-Santa Cruz
 Disentangling the Spatial Concentration and Temporal Stickiness of Poverty: Industrial Structure, Racial/Ethnic Composition, and the Complex Links to Poverty Katherine J. Curtis 1, Heather O Connell 1,
CHAPTER 6: SPECIFICATION VARIABLES
 Recall, we had the following six assumptions required for the Gauss-Markov Theorem: 1. The regression model is linear, correctly specified, and has an additive error term. 2. The error term has a zero
Chapter 8 Heteroskedasticity
 Chapter 8 Walter R. Paczkowski Rutgers University Page 1 Chapter Contents 8.1 The Nature of 8. Detecting 8.3 -Consistent Standard Errors 8.4 Generalized Least Squares: Known Form of Variance 8.5 Generalized
Spatial Modeling, Regional Science, Arthur Getis Emeritus, San Diego State University March 1, 2016
 Spatial Modeling, Regional Science, and UCSB Arthur Getis Emeritus, San Diego State University March 1, 2016 My Link to UCSB The 1980s at UCSB (summers and sabbatical) Problems within Geography: The Quantitative
In matrix algebra notation, a linear model is written as
 DM3 Calculation of health disparity Indices Using Data Mining and the SAS Bridge to ESRI Mussie Tesfamicael, University of Louisville, Louisville, KY Abstract Socioeconomic indices are strongly believed
Introduction to Econometrics
 Introduction to Econometrics T H I R D E D I T I O N Global Edition James H. Stock Harvard University Mark W. Watson Princeton University Boston Columbus Indianapolis New York San Francisco Upper Saddle
Urban Transportation Planning Prof. Dr.V.Thamizh Arasan Department of Civil Engineering Indian Institute of Technology Madras
 Urban Transportation Planning Prof. Dr.V.Thamizh Arasan Department of Civil Engineering Indian Institute of Technology Madras Module #03 Lecture #12 Trip Generation Analysis Contd. This is lecture 12 on
Luc Anselin Spatial Analysis Laboratory Dept. Agricultural and Consumer Economics University of Illinois, Urbana-Champaign
 GIS and Spatial Analysis Luc Anselin Spatial Analysis Laboratory Dept. Agricultural and Consumer Economics University of Illinois, Urbana-Champaign http://sal.agecon.uiuc.edu Outline GIS and Spatial Analysis
Spatial Effects in Convergence of Portuguese Product
 Spatial Effects in Convergence of Portuguese Product Vitor João Pereira Domingues Martinho Unidade de I&D do Instituto Politécnico de Viseu Av. Cor. José Maria Vale de Andrade Campus Politécnico 354-51
Chapter 1 Statistical Inference
 Chapter 1 Statistical Inference causal inference To infer causality, you need a randomized experiment (or a huge observational study and lots of outside information). inference to populations Generalizations
Migration Clusters in Brazil: an Analysis of Areas of Origin and Destination Ernesto Friedrich Amaral
 1 Migration Clusters in Brazil: an Analysis of Areas of Origin and Destination Ernesto Friedrich Amaral Research question and data The main goal of this research is to analyze whether the pattern of concentration
Spatial Modelling of Disparity in Economic Activity and Unemployment in Southern and Oromia Regional States of Ethiopia
 American Journal of Theoretical and Applied Statistics 2015; 4(5): 347-358 Published online August 17, 2015 (http://www.sciencepublishinggroup.com/j/ajtas) doi: 10.11648/j.ajtas.20150405.15 ISSN: 2326-8999
Longitudinal Data Analysis Using SAS Paul D. Allison, Ph.D. Upcoming Seminar: October 13-14, 2017, Boston, Massachusetts
 Longitudinal Data Analysis Using SAS Paul D. Allison, Ph.D. Upcoming Seminar: October 13-14, 217, Boston, Massachusetts Outline 1. Opportunities and challenges of panel data. a. Data requirements b. Control
COLUMN. Spatial Analysis in R: Part 2 Performing spatial regression modeling in R with ACS data
 Spatial Demography 2013 1(2): 219-226 http://spatialdemography.org OPEN ACCESS via Creative Commons 3.0 ISSN 2164-7070 (online) COLUMN Spatial Analysis in R: Part 2 Performing spatial regression modeling
Daniel Fuller Lise Gauvin Yan Kestens
 Examining the spatial distribution and relationship between support for policies aimed at active living in transportation and transportation behavior Daniel Fuller Lise Gauvin Yan Kestens Introduction
Christopher Dougherty London School of Economics and Political Science
 Introduction to Econometrics FIFTH EDITION Christopher Dougherty London School of Economics and Political Science OXFORD UNIVERSITY PRESS Contents INTRODU CTION 1 Why study econometrics? 1 Aim of this
SPACE Workshop Santa Barbara, California July 2007
 SPACE Workshop Santa Barbara, California 15 20 July 2007 Modeling a Center for Spatially Integrated Social Science Critical Themes in Social Science + Tools and Concepts for Spatial Thinking + Infrastructure
Regional patterns and correlates in recent family formation in Japan: Spatial Analysis of Upturn in Prefecture-level Fertility after 2005
 Regional patterns and correlates in recent family formation in Japan: Spatial Analysis of Upturn in Prefecture-level Fertility after 2005 Miho Iwasawa 1 Kenji Kamata 1 Kimiko Tanaka 2 Ryuichi Kaneko 1
Multiple Regression Analysis
 Multiple Regression Analysis y = 0 + 1 x 1 + x +... k x k + u 6. Heteroskedasticity What is Heteroskedasticity?! Recall the assumption of homoskedasticity implied that conditional on the explanatory variables,
Cluster Analysis using SaTScan
 Cluster Analysis using SaTScan Summary 1. Statistical methods for spatial epidemiology 2. Cluster Detection What is a cluster? Few issues 3. Spatial and spatio-temporal Scan Statistic Methods Probability
Multiple Regression Analysis: Heteroskedasticity
 Multiple Regression Analysis: Heteroskedasticity y = β 0 + β 1 x 1 + β x +... β k x k + u Read chapter 8. EE45 -Chaiyuth Punyasavatsut 1 topics 8.1 Heteroskedasticity and OLS 8. Robust estimation 8.3 Testing
ISQS 5349 Spring 2013 Final Exam
 ISQS 5349 Spring 2013 Final Exam Name: General Instructions: Closed books, notes, no electronic devices. Points (out of 200) are in parentheses. Put written answers on separate paper; multiple choices
Spatial Effects in Convergence of Portuguese Product
 Spatial Effects in Convergence of Portuguese Product Vítor João Pereira Domingues Martinho Instituto Politécnico de Viseu 2011 Working paper nº 79/2011 globadvantage Center of Research in International
SIMULATION AND APPLICATION OF THE SPATIAL AUTOREGRESSIVE GEOGRAPHICALLY WEIGHTED REGRESSION MODEL (SAR-GWR)
") SIMULATION AND APPLICATION OF THE SPATIAL AUTOREGRESSIVE GEOGRAPHICALLY WEIGHTED REGRESSION MODEL (SAR-GWR) I. Gede Nyoman Mindra Jaya 1, Budi Nurani Ruchjana 2, Bertho Tantular 1, Zulhanif 1 and Yudhie
SIMULATION AND APPLICATION OF THE SPATIAL AUTOREGRESSIVE GEOGRAPHICALLY WEIGHTED REGRESSION MODEL (SAR-GWR) I. Gede Nyoman Mindra Jaya 1, Budi Nurani Ruchjana 2, Bertho Tantular 1, Zulhanif 1 and Yudhie
Using AMOEBA to Create a Spatial Weights Matrix and Identify Spatial Clusters, and a Comparison to Other Clustering Algorithms
 Using AMOEBA to Create a Spatial Weights Matrix and Identify Spatial Clusters, and a Comparison to Other Clustering Algorithms Arthur Getis* and Jared Aldstadt** *San Diego State University **SDSU/UCSB
1 The Multiple Regression Model: Freeing Up the Classical Assumptions
 1 The Multiple Regression Model: Freeing Up the Classical Assumptions Some or all of classical assumptions were crucial for many of the derivations of the previous chapters. Derivation of the OLS estimator
Introduction to Bayesian Statistics and Markov Chain Monte Carlo Estimation. EPSY 905: Multivariate Analysis Spring 2016 Lecture #10: April 6, 2016
 Introduction to Bayesian Statistics and Markov Chain Monte Carlo Estimation EPSY 905: Multivariate Analysis Spring 2016 Lecture #10: April 6, 2016 EPSY 905: Intro to Bayesian and MCMC Today s Class An
Lecture 4: Multivariate Regression, Part 2
 Lecture 4: Multivariate Regression, Part 2 Gauss-Markov Assumptions 1) Linear in Parameters: Y X X X i 0 1 1 2 2 k k 2) Random Sampling: we have a random sample from the population that follows the above
Non-parametric bootstrap and small area estimation to mitigate bias in crowdsourced data Simulation study and application to perceived safety
 Non-parametric bootstrap and small area estimation to mitigate bias in crowdsourced data Simulation study and application to perceived safety David Buil-Gil, Reka Solymosi Centre for Criminology and Criminal
Spatial Analysis I. Spatial data analysis Spatial analysis and inference
 Spatial Analysis I Spatial data analysis Spatial analysis and inference Roadmap Outline: What is spatial analysis? Spatial Joins Step 1: Analysis of attributes Step 2: Preparing for analyses: working with
Regression Analysis V... More Model Building: Including Qualitative Predictors, Model Searching, Model "Checking"/Diagnostics
 Regression Analysis V... More Model Building: Including Qualitative Predictors, Model Searching, Model "Checking"/Diagnostics The session is a continuation of a version of Section 11.3 of MMD&S. It concerns
Cluster Analysis using SaTScan. Patrick DeLuca, M.A. APHEO 2007 Conference, Ottawa October 16 th, 2007
 Cluster Analysis using SaTScan Patrick DeLuca, M.A. APHEO 2007 Conference, Ottawa October 16 th, 2007 Outline Clusters & Cluster Detection Spatial Scan Statistic Case Study 28 September 2007 APHEO Conference
Spatial Analysis and Modeling (GIST 4302/5302) Guofeng Cao Department of Geosciences Texas Tech University
 Guofeng Cao Department of Geosciences Texas Tech University") Spatial Analysis and Modeling (GIST 4302/5302) Guofeng Cao Department of Geosciences Texas Tech University TTU Graduate Certificate Geographic Information Science and Technology (GIST) 3 Core Courses and
Spatial Analysis and Modeling (GIST 4302/5302) Guofeng Cao Department of Geosciences Texas Tech University TTU Graduate Certificate Geographic Information Science and Technology (GIST) 3 Core Courses and
The Cost of Transportation : Spatial Analysis of US Fuel Prices
 The Cost of Transportation : Spatial Analysis of US Fuel Prices J. Raimbault 1,2, A. Bergeaud 3 juste.raimbault@polytechnique.edu 1 UMR CNRS 8504 Géographie-cités 2 UMR-T IFSTTAR 9403 LVMT 3 Paris School
Algebra. Here are a couple of warnings to my students who may be here to get a copy of what happened on a day that you missed.
 This document was written and copyrighted by Paul Dawkins. Use of this document and its online version is governed by the Terms and Conditions of Use located at. The online version of this document is
Volatility. Gerald P. Dwyer. February Clemson University
 Volatility Gerald P. Dwyer Clemson University February 2016 Outline 1 Volatility Characteristics of Time Series Heteroskedasticity Simpler Estimation Strategies Exponentially Weighted Moving Average Use
Multivariate Time Series: VAR(p) Processes and Models
 Processes and Models") Multivariate Time Series: VAR(p) Processes and Models A VAR(p) model, for p > 0 is X t = φ 0 + Φ 1 X t 1 + + Φ p X t p + A t, where X t, φ 0, and X t i are k-vectors, Φ 1,..., Φ p are k k matrices, with
Multivariate Time Series: VAR(p) Processes and Models A VAR(p) model, for p > 0 is X t = φ 0 + Φ 1 X t 1 + + Φ p X t p + A t, where X t, φ 0, and X t i are k-vectors, Φ 1,..., Φ p are k k matrices, with
10. Alternative case influence statistics
 10. Alternative case influence statistics a. Alternative to D i : dffits i (and others) b. Alternative to studres i : externally-studentized residual c. Suggestion: use whatever is convenient with the
OLSQ. Function: Usage:
 OLSQ OLSQ (HCTYPE=robust SE type, HI, ROBUSTSE, SILENT, TERSE, UNNORM, WEIGHT=name of weighting variable, WTYPE=weight type) dependent variable list of independent variables ; Function: OLSQ is the basic
, (1) e i = ˆσ 1 h ii. c 2016, Jeffrey S. Simonoff 1
 e i = ˆσ 1 h ii. c 2016, Jeffrey S. Simonoff 1") Regression diagnostics As is true of all statistical methodologies, linear regression analysis can be a very effective way to model data, as along as the assumptions being made are true. For the regression
Regression diagnostics As is true of all statistical methodologies, linear regression analysis can be a very effective way to model data, as along as the assumptions being made are true. For the regression
Economics 536 Lecture 7. Introduction to Specification Testing in Dynamic Econometric Models
 University of Illinois Fall 2016 Department of Economics Roger Koenker Economics 536 Lecture 7 Introduction to Specification Testing in Dynamic Econometric Models In this lecture I want to briefly describe
Lecture 14: Introduction to Poisson Regression
 Lecture 14: Introduction to Poisson Regression Ani Manichaikul amanicha@jhsph.edu 8 May 2007 1 / 52 Overview Modelling counts Contingency tables Poisson regression models 2 / 52 Modelling counts I Why
Modelling counts. Lecture 14: Introduction to Poisson Regression. Overview
 Modelling counts I Lecture 14: Introduction to Poisson Regression Ani Manichaikul amanicha@jhsph.edu Why count data? Number of traffic accidents per day Mortality counts in a given neighborhood, per week
Quadratic Equations Part I
 Quadratic Equations Part I Before proceeding with this section we should note that the topic of solving quadratic equations will be covered in two sections. This is done for the benefit of those viewing
Class Notes: Week 8. Probit versus Logit Link Functions and Count Data
 Ronald Heck Class Notes: Week 8 1 Class Notes: Week 8 Probit versus Logit Link Functions and Count Data This week we ll take up a couple of issues. The first is working with a probit link function. While
SPATIAL ECONOMETRICS: METHODS AND MODELS
 SPATIAL ECONOMETRICS: METHODS AND MODELS STUDIES IN OPERATIONAL REGIONAL SCIENCE Folmer, H., Regional Economic Policy. 1986. ISBN 90-247-3308-1. Brouwer, F., Integrated Environmental Modelling: Design