Developing a Conflict Vulnerability Index
|
|
|
- Harriet Lynn Norris
- 5 years ago
- Views:
Transcription


1 ICAT Working Paper Series May 2013 Developing a Conflict Vulnerability Index Kim Fletcher, Marcus Marktanner, and Luc Noiset Kennesaw State University
2 1. INTRODUCTION The objective of the International Conflict Assessment and Transformation (ICAT) Research Initiative s Conflict Vulnerability Index (CVI) is to conceptualize and measure vulnerability to intrastate conflict. Many studies have already been conducted to explain the fragility, disintegration, and collapse of states. The explanatory variables in these studies cover a variety of social, economic, political, ecological, and security dimensions. The implicit idea of these variables is to better understand the relationship between conflict vulnerability and actual conflict. However, the concept of conflict vulnerability is often unclear. In this paper we propose a concept of conflict vulnerability between a state and its citizenry. The intuition is that conflict vulnerability can be expressed by the ratio of a state-threat to the state s response capacity. The state, in this situation, refers to both the government and the citizenry. The threat to a state can be perceived as a public bad and the state s response capacity as the available means to ameliorate the public bad. We argue in line with the literature that conflict vulnerability can have its origin in various threat dimensions. These dimensions are of an economic, ecological, social, and political nature. Our objective is to propose simple vulnerability indices that can be constructed easily from readily available data and capture the threat dimensions comprehensively. We argue that in measuring conflict vulnerability, the security dimension often included in measures of state fragility is more appropriately considered part of the dependent variable, explained by actual vulnerabilities. For example, body counts and conflict intensity can be understood as actual state failures, while vulnerability should be able to explain those failures. Therefore, we do not include a security dimension in our vulnerability index. Rather, we use conflict as the dependent variable we are attempting to explain. In Section two we discuss our understanding of conflict vulnerability. The empirical operationalization of four conflict vulnerability concepts is introduced in section three. Tables and global 2 Developing a Conflict Vulnerability Index
3 maps visualizing the geographic distribution of the various conflict vulnerabilities are presented in section four. Section five concludes with a summary of our main findings and outlook for further work of the ICAT Research Initiative. 2. THE CONCEPT OF CONFLICT VULNERABILITY BETWEEN THE STATE AND THE CITIZENRY We understand conflict vulnerability as a situation in which a transition from a state of nonviolent cooperation to a state of violent conflict is possible. The determinants behind increased conflict vulnerability can be illustrated in Figure 1, which represents a rational choice framework for explaining violent conflict. Figure 1 Framework of Violence as an Alternative Choice to Cooperation G CU T Government's Utility E D A B Response Willingness GU T C Citizens' Utility L L L Threat Effect In the figure above, solid line 1 (L 1) is a utility possibilities frontier representing the utility the government and some vulnerable segment of society could gain from a given resource through nonviolent cooperation. Line CU T is the citizens utility threshold. That is, it is the amount of utility the International Conflict Analysis and Transformation. May
4 citizenry expects it can obtain through fighting; therefore, it will not be willing to drop below this threshold in peaceful negotiations. GU T is the government utility threshold. It is the amount of utility the government expects it could obtain through fighting, and the threshold it would not drop below during peaceful negotiations. Assume that the utility of the government and the citizens begins at point A on line L 1. Neither side will fight, because they are currently gaining more utility than what they believe would be possible from fighting. Then, assume that a threat occurs, swiveling the utility possibilities frontier to L 2 and shifting the utility of the two parties to point D, where the utility of the government stays the same, but the utility of the citizenry decreases. The horizontal distance the line shifts could be considered the threat effect. That is, the threat effect is the loss of utility the citizens would experience due to the threat. At point D, the citizens believe they have more utility to gain from fighting, and would be willing to do so. However, the government is willing to negotiate, because there is still positive space between their current utility at point D, and their utility threshold. The vertical distance between the government s current utility and their utility threshold could, therefore, be considered their response willingness, which is a function of their overall response capability and their perceived utility threshold. Because the resource in this case can peacefully be allocated in a way that keeps the citizens and the government above their respective utility thresholds, non-violent cooperation is again the predicted outcome. Now, consider a threat that drops the utility possibilities frontier from L 1 to L 3, and shifts the allocation of resources from point A to point E. In this case, there is no zone of possible agreement. The government is only willing to respond to the threat down to its utility threshold. At that point, however, the citizenry would still believe they could be better off fighting. The effect of the threat, then, is greater than the government s willingness to respond to the threat, which leads to violent conflict. 4 Developing a Conflict Vulnerability Index
5 Vulnerability can, therefore, be interpreted as Vulnerability = Threat Response Capacity It is clear from this formula that if a threat level were to increase while response capacity remained steady, vulnerability would increase. In addition, an increase in response capacity while the threat remained constant would be associated with a decrease in vulnerability. This vulnerability concept distinguishes itself from other general state fragility or country risk concepts in the sense that two countries with different threat exposures and response capacities (per capita income) can be subject to the same vulnerability. This is shown in Figure 2. Figure 2 shows that the ratio of threat to response capacity is given by the angle of a trajectory line from the origin through the actual threat-response capacity observation. Figure 2 shows three examples of conflict vulnerability trajectories, representing a high, medium, and low vulnerability. The figure illustrates that each combination A and B, C and D, and E and F are on the same conflict vulnerability trajectory. In the case of the high conflict vulnerability trajectory, observation A has, compared to observation B, less threat exposure, but also less response capacity. Observation A has the same vulnerability as observation B, because observation B has off-set a greater threat by a greater response capacity, but the relative threat-response capacity ratios are the same for observations A and B. However, when comparing observations, A, C, and F, the conflict vulnerability is greatest for observation A, followed by observation C and F. Moving from A to C to F, increases the response capacity holding constant the threat. This understanding of vulnerability is similar to that posited by General Systems Theory (GST). According to GST, a system is a set of interacting elements. Open systems differ from their environment by maintaining a higher degree of order (negentropy). The environment is characterized by maximum International Conflict Analysis and Transformation. May
6 Figure 2 Comparing Conflict Vulnerabilities Threat B A High Vulnerability Trajectory E C D Medium Vulnerability Trajectory Low Vulnerability Trajectory F a b g Response Capacity (Per Capita Income) chaos (or entropy). From all the possible states in the environment, a system tolerates only a subset of these states. For example, living systems like human beings and animals function only under certain body temperatures and they die when they fail to maintain differences in temperature to changing environmental states. Social systems like a traffic system come to an end when drivers create their own rules, which is equivalent to importing states from the infinite set of possible states found in the system s environment. The more states a social system allows, the more it becomes anarchistic, and the greater the likelihood of system death. A vulnerability threat can be thought of as a state from the environment which imposes itself on the system. In the case of our social, economic, and political vulnerability indicators, each threat marginalizes groups, which is equivalent to pushing them into the system s environment. Inequality, autocracy, and lack of economic diversity each lead to social, political, and economic marginalization. Resulting threats to a social system from socioeconomic and political marginalization can be forms of crime, disease, migration, mistrust, and violent conflict. 6 Developing a Conflict Vulnerability Index
7 There are also purely exogenous events occurring in the system s natural environment. This is the case for many natural hazards like floods, droughts, earthquakes, infestations, and extreme temperatures. Therefore, just as a system creates its own environment, it is also subject to challenges imposed by factors a system does not control but to which it still needs to adapt. A system s ability to respond effectively to every single threat is known in GST as the law of requisite variety (Ashby, 1957). It says that for a system to maintain an equilibrium order difference to its environment, the variety of potential responses to external shocks must be as high as the variety of shocks. If a social system does not respond to (endogenous and exogenous) shocks from its environment, the system will inevitably come under sustainability pressure. Therefore, a state s capacity to respond to threats and the type of threats it has to contend with are important considerations in measuring conflict vulnerability. 3. MEASURING CONFLICT VULNERABILITY In line with the literature, we argue that there are at least four forms of conflict vulnerabilities: economic, ecological, social, and political. Following the logic described in section two that vulnerability can be expressed as the ratio of a state-threat to society s response capacity, we identify the four threats as follows. We define our conflict vulnerability indicator over a time frame of ten years, which is necessary for several reasons. First, time-invariant indicators such as income inequality and the economic profile are not surveyed every year, and using a wider time span is necessary to increase the number of observations. Second, spontaneous events like disasters or political change often increase vulnerability instantly and throw a long shadow into the future. In the case of a natural disaster, for example, while factors such as looting, chaos, and displacement, increase conflict vulnerability instantly, disasters also remain an ongoing source of conflict as they call for extraordinary disaster management capacities, International Conflict Analysis and Transformation. May
8 which are often not in place for many years. Similarly, political change like a democratization event does not instantly lead to a reduction of political vulnerability and needs to be consolidated first. Assessing conflict vulnerabilities in a longer time context is therefore necessary in order to incorporate the idea that conflict vulnerabilities have a history and legacy. We argue that the biggest economic conflict threat is a little diversified competitive economic profile. Having a diversified and competitive economic profile in place reduces conflict in many ways. First, competition reduces market power and spreads access to economic opportunities. Second, building a competitive productive economy relies on irreversible investments, which increase the stakes of conflict. Third, a healthy economic environment contributes to social cohesion by decreasing crime, illness, and redistributive demands. We measure economic stability and diversity as the manufacturing and services export share as a percentage of GDP averaged over the ten-year time period. We argue that if an economy is heavily involved in exporting manufactured goods and services, and passes the test of the international competitive market, then the society has made efficient use of its natural and human resources. Successful industrializing countries typically invest in human capital, health care, and technology, which diffuse grievances. This diffusion will not necessarily occur in rentier states, whose income is primarily based on the extraction of natural resources. In that case, investments that benefit the citizenry do not need to be made, because resource extraction does not require the levels of human capital and technological innovation needed in manufacturing and serviceintensive economies. Ecological threats can come in many forms. Water scarcity, wildfires, floods, and famines may all threaten citizens utility and increase the likelihood of conflict. We measure ecological conflict vulnerability by the cumulative of natural disaster deaths per 1,000,000 citizens over the tenyear time period. Natural disasters can trigger new conflicts or complicate existing conflicts. Especially slow-onset disasters such as droughts and famines may serve as catalysts for new conflict. They do so 8 Developing a Conflict Vulnerability Index
9 by deteriorating people s livelihood base, which leads to an increase in demand for public funds, and possibly lowers the stakes of the use of force. Likewise, disasters that hit one rivaling group more than another may cause existing conflict to deepen. Especially fast-onset disasters such as earthquakes or floods may lead to sudden changes in the balance of power between rivaling parties that increases conflict complexity. We approach social conflict vulnerability through the average income inequality (Gini coefficient) over the ten-year time period. Often, income inequality is a manifestation of unresolved conflict, like inherited feudal and colonial legacies. At other times, income inequality may be the result of structural breaks. For example, after the collapse of socialist regimes many countries experienced transitions from high equality of (few) economic opportunities to high inequality of (abundant) economic opportunities. These legacies and structural breaks lead to demands for redistribution. If those demands are not met through peaceful cooperation, civil violence may result. Exclusion from the political decision-making process increases the likelihood of revolutions and uprisings. Authoritarian regimes often reach the end of governability when socioeconomic development reaches levels of complexity in which people believe themselves no longer effectively represented. Social and economic modernization requires political organization mechanisms that respond to new complexities that traditional authoritarian regimes fail to provide. In addition, the political system assumes a particularly important role in coordinating the responses to all social, economic, and ecological threats. Democracies are more apt to navigate this complexity, due to their increased variety of potential responses. We measure a country s political system by the ten-year average of the so-called Polity score. In order to complete the various vulnerability indicators, we argue that the best indicator for a country s threat response capacity is per capita income, again measured as the average of the International Conflict Analysis and Transformation. May
10 2011 ten-year time period. The variable per capita income is highly correlated with indicators of public administrative and individual response capacities like access to social safety nets. Most observations contain missing values. This is a particular problem for the variable income inequality (Gini), which is not surveyed every year. An additional problem is that the Gini coefficient listed in the World Bank Development Indicator Database for the ten-year period between barely has any observations for Western European and North American countries. We, therefore, consulted a second dataset for income inequality, which is the UNU-WIDER World Income Inequality Database, Version 2.0c (May 2008). From this dataset, we collected available all observations between 2002 and 2011 that had an area coverage labeled All, and also computed the average value for this period. From the World Bank, we obtained 116 observations, and from the UNU-WIDER database only 102 observations, but greater coverage of the Western European and North American area. Both datasets are highly correlated, with a Pearson correlation coefficient of r=0.87. We then blended both datasets by regressing each Gini coefficient of one dataset on the Gini coefficient of the other, and predicting the missing values in each dataset by the available information in the other. If this way, only one predicted observation was obtained, that observation was included in our dataset. When there were two predicted observations, their average was taken. The data constraints were much less severe for all other variables. The basic structure of our various conflict vulnerability indices is calculated as the natural log ratio of an indexed threat over the indexed income, in which each index ranges from 0 to 100. Threat Index Vulnerability = ln ( Per Capita Income Index ) We use the above conflict vulnerability indicators as independent variables in logit regressions in order to determine their relevance in explaining conflict. We chose as the dependent variable, the internal armed conflict from the Uppsala UCDP/PRIO Armed Conflict Dataset. This indicator measures 10 Developing a Conflict Vulnerability Index
11 internal armed conflict between a state and opposition group without intervention from the outside, in which there were more than 25 battle deaths per year. Table 1 summarizes the data, sources, and conflict vulnerability indicators. Table 1 Data, Sources, and Formulas for Conflict Vulnerability Indicators. Indicator Variable Data Source Vulnerability Formula World Bank Development Gini Index Social Indicator Database and UNU- SocVul i = ln ( Vulnerability, Gini Index, Gini WIDER World Income Per Capita Income Index SocVul Inequality Database + 1) Economic Vulnerability, EconVul Manufactures and Services Export Share (% GDP), MSES World Bank Development Indicator Database 100 MSES Index EconVul i = ln ( Per Capita Income Index + 1) Ecological Vulnerability, EcolVul Disaster deaths per 1,000,000 from following phenomena: Volcano, storm, mass movements wet and dry, infestations, floods, extreme temperatures, epidemics, earthquake, drought, complex disasters, and wildfire, DisDeath Emergency Events Database (EM-DAT), The International Disaster Database, Centre for Research on the Epidemiology of Disasters (CRED). DisDeath Index EcolVul i = ln ( Per Capita Income Index + 1) Political Vulnerability, PolVul CivConflict Polity 2 score (-10 to 10), Polity2. 0s given for anarchy were recoded as missing data, Polity Conflict Type 3 Internal Armed Conflict Marshall, M., Jaggers, K., and Gurr, T. (2011). Polity IV Project, Political Regime Characteristics and Transitions, UCDP/PRIO Armed Conflict Dataset 100 Polity Index PolVul i = ln ( Per Capita Income Index *Where a positive score on the threat variable represented a public good (i.e., high manufacturing and services export shares and high democracy), we subtracted the good index from 100 so a higher score is associated with a higher threat. + 1) International Conflict Analysis and Transformation. May
12 4. TABLES AND MAPS Appendix Table 1 summarizes the countries for which we were able to compute at least one conflict vulnerability indicator. The following Tables 2, 3, and 4 summarize the number of observations for each conflict vulnerability indicator per geo-political region, provide descriptive statistics of our variables, and present the bivariate estimation results using logit regressions. Table 2 Observations Per Geo-Political Region Region Countries EconVul EcolVul PolVul SocVul East Asia and the Pacific (EAP) Eastern Europe and Central Asia (EECA) Western Europe (WE) Latin American and the Caribbean (LAC) Middle East and North Africa (MENA) North America (NAM) South Asia (SA) Sub-Saharan Africa (SSA) Table 3 Descriptive Statistics Variable Mean Median Minimum Maximum St. Dev. N EconVul EcolVul PolVul SocVul CivConflict* 39 No Conflict Table 4 Bivariate Logit Regression Results DV = CivConflict Economic Ecological Political Social Constant (0.69)*** (0.24)*** (0.48)*** (0.69)*** EconVul (0.14)*** EcolVul (0.37)*** 12 Developing a Conflict Vulnerability Index
13 PolVul (0.12)*** SocVul % Correct Standard errors in parentheses. *** significant at p< (0.16)*** 80.6 Table 4 shows that the conflict vulnerability indicators are individually highly significant. Graph 1 shows the likelihood function associated with each bivariate regression. Graph 1 Probabilities of Internal Armed Conflict Based on Different Conflict Vulnerabilities Graph 1 shows that the probability of Internal Armed Conflict responds differently to the various conflict vulnerability indicators. Especially, the likelihood function associated with the variable ecological conflict vulnerability is quite different from all the others. While economic, social, and political vulnerability appear to be grouped together, there are in fact also considerable variations in International Conflict Analysis and Transformation. May
14 their relationships with internal armed conflict, suggesting differences in likelihoods of up to 12 percentage points for given vulnerability scores. Our conflict vulnerability indicators suffer from high multicollinearity as can be seen from Table 5, which provides the Pearson correlation matrix of our four different conflict vulnerability indicators. Table 5 Correlation Matrix of Vulnerability Indicators EconVul EcolVul PolVul SocVul EconVul EcolVul PolVul SocVul Table 5 shows that improvements in the reduction of one conflict vulnerability dimension reduces conflict from other vulnerabilities as well. The interaction of the various vulnerabilities is highly important from a structural perspective and provides many opportunities for further research regarding possible causal relationships between the various conflict vulnerability indicators. Having four conflict vulnerability dimensions then leads to twelve different possible bilateral causal relationships, demanding for answers such as, for example: Does democratization lead to greater modernization of the manufacturing and service sector, or the other way around? Or, does greater democratization lead to more equality or is it equality that drives democratization? Similarly, is equality a precondition of economic modernization or a consequence of it? Or, is democracy good for the environment or it the environment that affects political characteristics? However, the purpose of our dataset is not to explain conflict by a combination of different conflict vulnerabilities or their structural interaction, but to identify country risk profiles along the 14 Developing a Conflict Vulnerability Index

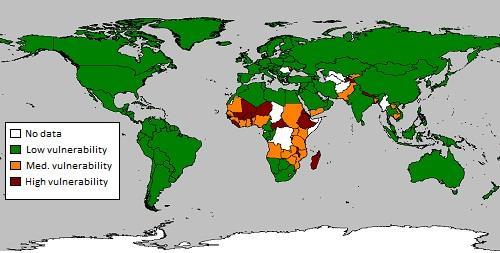
15 different conflict vulnerabilities. We want to know which countries are particularly vulnerable to any of the four dimensions. When the vulnerabilities are considered in combination, their high multicolliearity makes it difficult to discern the effect each has on the likelihood of internal armed conflict. Our individual focus makes our findings, therefore, more relevant for the identification of policy priorities and opportunities. Conflict Vulnerability World Maps The maps below provide a visual representation of the data involved in the conflict vulnerability index. An analysis of the maps suggests that the CVI is a useful tool in further understanding conflicts developing in North Africa, sub-saharan Africa, Southeast Asia, and much of the Middle East. Countries Experiencing Conflict, International Conflict Analysis and Transformation. May


16 Political Vulnerability Social Vulnerability Economic Vulnerability 16 Developing a Conflict Vulnerability Index
17 Ecological Vulnerability 5. SUMMARY AND CONCLUSIONS There are two major goals of the conflict vulnerability index. The first is to reframe the theoretical discussion of the cause of intrastate conflict, and the second is to determine the factors that most place a given state at risk to intrastate conflict. The current theory surrounding instrastate conflict suggests that risk comes from a summed combination of factors. For example, state fragility is considered a summation of various measures of legitimacy and effectiveness. The conflict vulnerability index, on the other hand, suggests that the most salient factor is not an aggregate of different capabilities, but rather the ratio of threats faced by the state to capabilities to offset those threats. A state with high capabilities may still be vulnerable if it also faces many threats. Similarly, a state with low capability may not be vulnerability if it also faces few threats. The second goal is to determine the factors that most place a given state at risk to intrastate conflict. In order to determine those risk factors, a combination of social, political, economic, and ecological threats are considered. Measuring these threats using income inequality, democracy, the trade share of manufacturing and services exports, and disaster deaths yields a useful tool in understanding recent conflicts, and provides a starting point to begin the discussion on this idea of state International Conflict Analysis and Transformation. May
18 vulnerability. It also opens the door for additional analyses of intrastate conflicts regarding policies that may affect either a state s threat or capability levels. In addition, it will be worth exploring the optimal allocation of resources when given the opportunity to apply resources toward threat reduction or capability enhancements. 18 Developing a Conflict Vulnerability Index
19 APPENDIX Table 1 Countries included in each of the vulnerability indices. Where countries are not included, it is due to data being unavailable. Country Code EconVul EcolVul PolVul SocVul Albania ALB Algeria DZA Angola AGO Antigua and Barbuda ATG Argentina ARG Armenia ARM Aruba ABW Australia AUS Austria AUT Azerbaijan AZE Bahamas, The BHS Bahrain BHR Bangladesh BGD Barbados BRB Belarus BLR Belgium BEL Belize BLZ Benin BEN Bermuda BMU Bhutan BTN Bolivia BOL Bosnia and Herzegovina BIH Botswana BWA Brazil BRA Brunei Darussalam BRN Bulgaria BGR Burkina Faso BFA Burundi BDI Cambodia KHM Cameroon CMR Canada CAN Cape Verde CPV Central African Republic CAF Chad TCD Chile CHL International Conflict Analysis and Transformation. May
20 China Colombia Comoros Congo, Rep. Costa Rica Cote d'ivoire Croatia Cuba Cyprus Czech Republic Denmark Djibouti Dominica Dominican Republic Ecuador Egypt, Arab Rep. El Salvador Equatorial Guinea Eritrea Estonia Ethiopia Fiji Finland France Gabon Gambia, The Georgia Germany Ghana Greece Greenland Grenada Guatemala Guinea Guinea-Bissau Guyana Haiti Honduras Hong Kong SAR, China Hungary Iceland India Indonesia CHN COL COM COG CRI CIV HRV CUB CYP CZE DNK DJI DMA DOM ECU EGY SLV GNQ ERI EST ETH FJI FIN FRA GAB GMB GEO DEU GHA GRC GRL GRD GTM GIN GNB GUY HTI HND HKG HUN ISL IND IDN 20 Developing a Conflict Vulnerability Index
21 Iran, Islamic Rep. Iraq Ireland Israel Italy Japan Jordan Kazakhstan Kenya Kiribati Korea, Rep. Kosovo Kuwait Kyrgyz Republic Lao PDR Latvia Lebanon Lesotho Liberia Libya Lithuania Luxembourg Macao SAR, China Macedonia, FYR Madagascar Malawi Malaysia Maldives Mali Malta Marshall Islands Mauritania Mauritius Mexico Micronesia, Fed. Sts. Moldova Mongolia Montenegro Morocco Mozambique Namibia Nepal Netherlands IRN IRQ IRL ISR ITA JPN JOR KAZ KEN KIR KOR KSV KWT KGZ LAO LVA LBN LSO LBR LBY LTU LUX MAC MKD MDG MWI MYS MDV MLI MLT MHL MRT MUS MEX FSM MDA MNG MNE MAR MOZ NAM NPL NLD International Conflict Analysis and Transformation. May
22 New Zealand Nicaragua Niger Nigeria Norway Oman Pakistan Palau Panama Papua New Guinea Paraguay Peru Philippines Poland Portugal Puerto Rico Qatar Romania Russian Federation Rwanda Samoa Saudi Arabia Senegal Serbia Seychelles Sierra Leone Singapore Slovak Republic Slovenia Solomon Islands South Africa Spain Sri Lanka St. Kitts and Nevis St. Lucia St. Vincent and the Grenadines Sudan Suriname Swaziland Sweden Switzerland Syrian Arab Republic NZL NIC NER NGA NOR OMN PAK PLW PAN PNG PRY PER PHL POL PRT PRI QAT ROM RUS RWA WSM SAU SEN SRB SYC SLE SGP SVK SVN SLB ZAF ESP LKA KNA LCA VCT SDN SUR SWZ SWE CHE SYR 22 Developing a Conflict Vulnerability Index
23 Tajikistan Tanzania Thailand Timor-Leste Togo Tonga Trinidad and Tobago Tunisia Turkey Turkmenistan Tuvalu Uganda Ukraine United Arab Emirates United Kingdom United States Uruguay Uzbekistan Vanuatu Venezuela, RB Vietnam West Bank and Gaza Yemen, Rep. Zambia Zimbabwe TJK TZA THA TMP TGO TON TTO TUN TUR TKM TUV UGA UKR ARE GBR USA URY UZB VUT VEN VNM WBG YEM ZMB ZWE International Conflict Analysis and Transformation. May
24 Table 6 Country Ranking by Political Vulnerability Score Country Vulnerability Score Likelihood of Conflict Conflict Eritrea Burundi Ethiopia Tajikistan Guinea-Bissau Togo Central African Republic Niger Malawi Chad Rwanda Nepal Uganda Zimbabwe Lao PDR Liberia Tanzania Guinea Kyrgyz Republic Vietnam Angola Gambia, The Mauritania Sudan Uzbekistan Sierra Leone Cameroon Yemen, Rep Haiti Turkmenistan Cambodia Mozambique Pakistan Iraq Madagascar Mali Bangladesh Nigeria Developing a Conflict Vulnerability Index
25 Country Vulnerability Score Likelihood of Conflict Conflict Zambia Bhutan Timor-Leste Congo, Rep Syrian Arab Republic Benin Swaziland Djibouti Azerbaijan Ghana Comoros Papua New Guinea Morocco China Egypt, Arab Rep Belarus Kazakhstan Iran, Islamic Rep Kenya Lesotho Jordan Senegal Tunisia Cuba Moldova Armenia Algeria Sri Lanka Fiji Guyana Ukraine Georgia Gabon Ecuador Serbia Indonesia Honduras Libya Thailand Saudi Arabia Equatorial Guinea International Conflict Analysis and Transformation. May
26 Country Vulnerability Score Likelihood of Conflict Conflict Solomon Islands Bolivia Russian Federation India Oman Philippines Namibia Paraguay Nicaragua Malaysia Bahrain Kosovo Venezuela, RB El Salvador Guatemala Albania Colombia Kuwait United Arab Emirates Qatar Turkey Dominican Republic Lebanon Romania Montenegro Macedonia, FYR Botswana Brazil Bulgaria Singapore Latvia Peru Mexico South Africa Argentina Croatia Panama Estonia Czech Republic Korea, Rep Chile Developing a Conflict Vulnerability Index
27 Country Vulnerability Score Likelihood of Conflict Conflict Slovak Republic France Belgium Australia Austria Canada Costa Rica Cyprus Denmark Finland Germany Greece Hungary Ireland Israel Italy Japan Lithuania Mauritius Mongolia Netherlands New Zealand Norway Poland Portugal Slovenia Spain Sweden Switzerland Trinidad and Tobago United Kingdom United States Uruguay International Conflict Analysis and Transformation. May
28 Table 7 Country Ranking by Social Vulnerability Score Country Vulnerability Score Conflict Likelihood Conflict Occurrence Burundi Malawi Guinea-Bissau Niger Central African Republic Comoros Madagascar Rwanda Liberia Nepal Sierra Leone Ethiopia Chad Burkina Faso Mozambique Ghana Uganda Mali Lesotho Zambia Kenya Togo Tajikistan Kyrgyz Republic Nigeria Guinea Tanzania Benin Gambia, The Cambodia Cote d'ivoire Timor-Leste Mauritania Senegal Moldova Developing a Conflict Vulnerability Index
29 Country Vulnerability Score Conflict Likelihood Conflict Occurrence Bolivia Lao PDR Cameroon Yemen, Rep Sudan Vietnam Bangladesh Honduras India Congo, Rep Djibouti Paraguay Nicaragua Uzbekistan Ecuador Bhutan Philippines Mongolia Swaziland Iraq Cape Verde Guatemala Namibia Georgia West Bank and Gaza Sri Lanka Pakistan Armenia South Africa Indonesia Morocco China Azerbaijan Colombia Syrian Arab Republic Ukraine El Salvador Fiji International Conflict Analysis and Transformation. May
30 Country Vulnerability Score Conflict Likelihood Conflict Occurrence Peru Serbia Iran, Islamic Rep Brazil Dominican Republic Thailand Tunisia Macedonia, FYR Russian Federation Bosnia and Herzegovina Jordan Panama Egypt, Arab Rep Kazakhstan Seychelles Costa Rica Albania Gabon Maldives Chile Romania Venezuela, RB Montenegro Mexico Turkey Malaysia Bulgaria Uruguay Argentina Belarus Latvia Lithuania Estonia Poland Puerto Rico Croatia Portugal Hungary Developing a Conflict Vulnerability Index
31 Country Vulnerability Score Conflict Likelihood Conflict Occurrence Bahamas, The Greece Qatar New Zealand Slovak Republic United States Korea, Rep Italy Spain Slovenia Cyprus Malta United Kingdom Ireland Australia Finland Germany Czech Republic Switzerland France Belgium Denmark Norway Netherlands Austria Luxembourg Iceland Sweden International Conflict Analysis and Transformation. May
32 Table 8 Country Ranking by Economic Vulnerability Score Country Vulnerability Score Likelihood of Conflict Conflict Albania Algeria Angola Antigua and Barbuda Argentina Armenia Aruba Australia Austria Azerbaijan Bahamas, The Bahrain Bangladesh Barbados Belarus Belgium Belize Benin Bhutan Bolivia Bosnia and Herzegovina Botswana Brazil Brunei Darussalam Bulgaria Burkina Faso Burundi Cambodia Cameroon Canada Cape Verde Central African Republic Chile China Colombia Developing a Conflict Vulnerability Index
33 Country Vulnerability Score Likelihood of Conflict Conflict Comoros Congo, Rep Costa Rica Cote d'ivoire Croatia Cuba Cyprus Czech republic Denmark Djibouti Dominica Dominican Republic Ecuador Egypt El Salvador Eritrea Estonia Ethiopia Fiji Finland France Gabon Gambia, The Georgia Germany Ghana Greece Greenland Grenada Guatemala Guinea Guinea-Bissau Guyana Haiti Honduras Hong Kong Hungary International Conflict Analysis and Transformation. May
34 Country Vulnerability Score Likelihood of Conflict Conflict Iceland India Indonesia Iran Iraq Ireland Israel Italy Japan Jordan Kazakhstan Kenya Kiribati Korea, Rep Kuwait Kyrgyz Republic Lao PDR Latvia Lebanon Lesotho Liberia Libya Lithuania Luxembourg Macao Macedonia, FYR Madagascar Malawi Malaysia Maldives Mali Malta Mauritania Mauritius Mexico Moldova Mongolia Developing a Conflict Vulnerability Index
35 Country Vulnerability Score Likelihood of Conflict Conflict Morocco Mozambique Namibia Nepal Netherlands New Zealand Nicaragua Niger Nigeria Norway Oman Pakistan Panama Papua New Guinea Paraguay Peru Philippines Poland Portugal Qatar Romania Russian Federation Rwanda Samoa Saudi Arabia Senegal Serbia Seychelles Sierra Leone Singapore Slovak Republic Slovenia Solomon Islands South Africa Spain Sri Lanka St. Kitts an nevis International Conflict Analysis and Transformation. May
36 Country Vulnerability Score Likelihood of Conflict Conflict St. Lucia St. Vincent and the Grenadines Sudan Suriname Swaziland Sweden Swizerland Syrian Arab Republic Tajikistan Tanzania Thailand Timor-Leste Togo Tonga Trinidad and Tobago Tunisia Turkey Tuvalu Uganda Ukraine United Arab Emirates United Kingdom United States Uruguay Vanuatu Venezuela Vietnam West Bank and Gaza Yemen, Rep Zambia Zimbabwe Developing a Conflict Vulnerability Index
37 Table 9 Country Ranking by Ecological Vulnerability Score Country Vulnerability Score Conflict Likelihood Conflict Haiti Guinea-Bissau Burkina Faso Sri Lanka Zimbabwe Niger Malawi Burundi Pakistan Indonesia Chad Madagascar Angola Nepal Samoa Sierra Leone Ethiopia Togo Tajikistan Iran, Islamic Rep Micronesia, Fed. Sts Rwanda Mozambique Comoros Sudan Bangladesh Papua New Guinea Guinea Russian Federation Zambia Solomon Islands Uganda Mali Congo, Rep Kyrgyz Republic Kenya Maldives Central African Republic International Conflict Analysis and Transformation. May
38 Country Vulnerability Score Conflict Likelihood Conflict Philippines Cameroon Timor-Leste Djibouti Cambodia Guatemala Nigeria Benin Senegal Liberia Mauritania Vietnam Grenada Ghana Mongolia Thailand Nicaragua Botswana India El Salvador Bolivia Namibia Honduras Guyana China Tonga Algeria Yemen, Rep Lao PDR Fiji Dominican Republic Peru Lesotho Bhutan Cote d'ivoire Tanzania Croatia Spain Portugal Gambia, The Ukraine Developing a Conflict Vulnerability Index
39 Country Vulnerability Score Conflict Likelihood Conflict Morocco Italy Colombia France St. Lucia Paraguay Slovenia Cape Verde Moldova Romania Hungary Belize Ecuador Belgium St. Vincent and the Grenadines Vanuatu Luxembourg Czech Republic Chile Costa Rica Oman Dominica Bulgaria Panama Macedonia, FYR Poland Latvia Germany Netherlands Seychelles Suriname Japan Syrian Arab Republic Switzerland Iraq Turkey Equatorial Guinea Slovak Republic Georgia Brazil Albania International Conflict Analysis and Transformation. May
40 Country Vulnerability Score Conflict Likelihood Conflict Kazakhstan New Zealand South Africa Bahamas, The Malaysia Swaziland Austria Tunisia Egypt, Arab Rep Venezuela, RB Bosnia and Herzegovina Hong Kong SAR, China Mexico Saudi Arabia Serbia Australia Uruguay Bermuda Cuba Mauritius Korea, Rep Uzbekistan Greece Lithuania Argentina Jordan United States Barbados Estonia Cyprus Armenia Israel Singapore Belarus Trinidad and Tobago United Kingdom Azerbaijan Gabon Puerto Rico Canada Lebanon Developing a Conflict Vulnerability Index
41 Country Vulnerability Score Conflict Likelihood Conflict Denmark Sweden Norway Ireland Antigua and Barbuda Bahrain Brunei Darussalam Eritrea Finland Iceland Kiribati Kuwait Libya Macao SAR, China Malta Marshall Islands Montenegro Palau Qatar St. Kitts and Nevis Turkmenistan Tuvalu United Arab Emirates West Bank and Gaza International Conflict Analysis and Transformation. May
Situation on the death penalty in the world. UNGA Vote 2012 Resolutio n 67/176. UNGA Vote 2010 Resolutio n 65/206. UNGA Vote 2008 Resolutio n 63/168
 Situation on the death penalty in the world Prepared by the International Commission against the Death Penalty (ICDP), as of 8 June 2014. Based on Amnesty International and Death Penalty Worldwide. Country
Appendices. Please note that Internet resources are of a time-sensitive nature and URL addresses may often change or be deleted.
 Appendices Appendix A Table of Treaties Appendix B State Trademark Registration Provisions Appendix C Resources Appendix D Forms Appendix Appendix E Selected Statutes Please note that Internet resources
GINA Children. II Global Index for humanitarian Needs Assessment (GINA 2004) Sheet N V V VI VIII IX X XI XII XII HDR2003 HDR 2003 UNDP
 Sheet N V V VI VIII IX X XI XII XII HDR2003 HDR 2003 UNDP") Human UNICEF Index Index Natural 2003 GDP per Total as % of Total Rate HDI HPI Disasters Conflicts capita Population population 5 1 Congo, Democratic Republic of the 2,80000 3 3 1 3 3 3 3 3 3 3 2 Burundi
Human UNICEF Index Index Natural 2003 GDP per Total as % of Total Rate HDI HPI Disasters Conflicts capita Population population 5 1 Congo, Democratic Republic of the 2,80000 3 3 1 3 3 3 3 3 3 3 2 Burundi
PROPOSED BUDGET FOR THE PROGRAMME OF WORK OF THE CONVENTION ON BIOLOGICAL DIVERSITY FOR THE BIENNIUM Corrigendum
 CBD Distr. GENERAL UNEP/CBD/COP/11/10/Corr.1 6 October ORIGINAL: ENGLISH CONFERENCE OF THE PARTIES TO THE CONVENTION ON BIOLOGICAL DIVERSITY Eleventh meeting Hyderabad, India, 8-19 October Item 14.2 of
Supplementary Appendix for. Version: February 3, 2014
 Supplementary Appendix for When Do Governments Resort to Election Violence? Version: February 3, 2014 This appendix provides supplementary information not included in the published draft. Supplementary
Most Recent Periodic Report Initial State Report. Next Periodic Accession/Ratification. Report Publication Publication. Report Due
 Country Signature Most Recent Periodic Report Initial State Report Next Periodic Accession/Ratification Report Publication Publication Report Due Number Date Afghanistan 4 Feb 1985 1 Apr 1987 25 Jun 1992
Country of Citizenship, College-Wide - All Students, Fall 2014
 Country of Citizenship, College-Wide - All Students, Fall 2014-49,552 (72%) students were U.S. Citizens in Fall 2014. - MDC's non-citizen students come from at least 167 countries and speak approximately
Programme budget for the biennium Programme budget for the biennium
 DRAFT TEXT on SB 46 agenda item 16(a) Administrative, financial and institutional matters Programme budget for the biennium 2018 2019 Version 1 of 13 May at 12:00 Programme budget for the biennium 2018
The Chemical Weapons Convention, Biological and Toxin Weapons Convention, Geneva Protocol
 The Chemical Weapons Convention, Biological and Toxin Weapons Convention, Geneva Afghanistan 14 Jan 93 24 Sep 03 6 Mar 75 (R) 09 Dec 86 Albania 14 Jan 93 11 May 94 03 Jun 92 20 Dec 89 Algeria 13 Jan 93
PROPOSED BUDGET FOR THE PROGRAMME OF WORK OF THE CARTAGENA PROTOCOL ON BIOSAFETY FOR THE BIENNIUM Corrigendum
 CBD CONFERENCE OF THE PARTIES TO THE CONVENTION ON BIOLOGICAL DIVERSITY SERVING AS THE MEETING OF THE PARTIES TO THE CARTAGENA PROTOCOL ON BIOSAFETY Fifth meeting, Nagoya, Japan, 11-15 October 2010 Item
Patent Cooperation Treaty (PCT) Working Group
 Working Group") E PCT/WG/7/26 ORIGINAL: ENGLISH DATE: MAY 21, 2014 Patent Cooperation Treaty (PCT) Working Group Seventh Session Geneva, June 10 to 13, 2014 FEE REDUCTIONS FOR CERTAIN APPLICANTS FROM CERTAIN COUNTRIES,
E PCT/WG/7/26 ORIGINAL: ENGLISH DATE: MAY 21, 2014 Patent Cooperation Treaty (PCT) Working Group Seventh Session Geneva, June 10 to 13, 2014 FEE REDUCTIONS FOR CERTAIN APPLICANTS FROM CERTAIN COUNTRIES,
Velocity Virtual Rate Card 2018
 Local 0.26 0.00 0.26 Local National 0.26 0.00 0.26 National Mobile 0.26 0.00 0.26 Mobile AFGHANISTAN ALBANIA 2.20 0.00 2.20 International ALGERIA 2.20 0.00 2.20 International ANDORRA 2.20 0.00 2.20 International
Does socio-economic indicator influent ICT variable? II. Method of data collection, Objective and data gathered
 Does socio-economic indicator influent ICT variable? I. Introduction This paper obtains a model of relationship between ICT indicator and macroeconomic indicator in a country. Modern economy paradigm assumes
Countries in Order of Increasing Per Capita Income, 2000
 ,400 45000,200 Population Per Capita Income 40000 35000,000 30000 Population, millions 800 600 25000 20000 Per Capita Income 5000 400 0000 200 5000 0 2 3 4 5 6 7 8 9 0 2 3 4 5 6 7 Countries in Order of
PRECURSORS. Pseudoephedrine preparations 3,4-MDP-2-P a P-2-P b. Ephedrine
 ANNEXES Annex II Annual legitimate requirements for ephedrine, pseudoephedrine, 3,4-methylenedioxyphenyl-2-propanone and 1-phenyl-2-propanone, substances frequently used in the manufacture of amphetamine-type
Mexico, Central America and the Caribbean South America
 Objective: This assignment is a way to prepare you for many different aspects of AP Human Geography. You will be held accountable for this assignment; it will be the first grade of the quarter. Failure
Immigrant Status and Period of Immigration Newfoundland and Labrador 2001 Census
 and Period of Immigration Census - Total - Place of birth of respondent 8,985 8,030 1,635 1,510 1,700 1,165 2,015 880 1,130 955 Americas 2,165 1,835 210 445 635 225 315 140 175 335 North America 1,995
About the Authors Geography and Tourism: The Attraction of Place p. 1 The Elements of Geography p. 2 Themes of Geography p. 4 Location: The Where of
 Preface p. ix About the Authors p. xi Geography and Tourism: The Attraction of Place p. 1 The Elements of Geography p. 2 Themes of Geography p. 4 Location: The Where of Geography p. 4 Place and Space:
November 2014 CL 150/LIM 2 COUNCIL. Hundred and Fiftieth Session. Rome, 1-5 December 2014
 November 2014 CL 150/LIM 2 E COUNCIL Hundred and Fiftieth Session Rome, 1-5 December 2014 Status of Current Assessments and Arrears as at 24 November 2014 Executive Summary The document presents the Status
Report by the Secretariat
 SIXTY-FIFTH WORLD HEALTH ASSEMBLY A65/30 Provisional agenda item 16.3 5 April 2012 Status of collection of assessed contributions, including Member States in arrears in the payment of their contributions
International legal instruments related to the prevention and suppression of international terrorism
 III. International legal instruments related to the prevention and suppression of international terrorism A. Status of international conventions pertaining to international terrorism 138. Currently, there
COUNCIL. Hundred and Fifty-eighth Session. Rome, 4-8 December Status of Current Assessments and Arrears as at 27 November 2017
 November 2017 CL 158/LIM/2 E COUNCIL Hundred and Fifty-eighth Session Rome, 4-8 December 2017 Status of Current Assessments and Arrears as at 27 November 2017 Executive Summary The document presents the
Hundred and Fifty-sixth Session. Rome, 3-7 November Status of Current Assessments and Arrears as at 30 June 2014
 September 2014 FC 156/INF/2 E FINANCE COMMITTEE Hundred and Fifty-sixth Session Rome, 3-7 November 2014 Status of Current Assessments and Arrears as at 30 June 2014 Queries on the substantive content of
COUNCIL. Hundred and Fifty-fifth Session. Rome, 5-9 December Status of Current Assessments and Arrears as at 29 November 2016.
 November 2016 CL 155/LIM/2 E COUNCIL Hundred and Fifty-fifth Session Rome, 5-9 December 2016 Status of Current Assessments and Arrears as at 29 November 2016 Executive Summary The document presents the
Delegations School GA Opening Speech 1 SPC Opening Speech 2 SC Total Amnesty International Agora Sant Cugat Botswana Agora Sant Cugat 1 Y 1 Y
 Amnesty International Agora Sant Cugat 1 1 0 2 Botswana Agora Sant Cugat 1 Y 1 Y 0 2 Cameroon Agora Sant Cugat 1 Y 1 Y 0 2 Cuba Agora Sant Cugat 1 Y 1 Y 0 2 Indonesia Agora Sant Cugat 1 Y 1 Y 0 2 Israel
SUGAR YEAR BOOK INTERNATIONAL SUGAR ORGANIZATION 1 CANADA SQUARE, CANARY WHARF, LONDON, E14 5AA.
 SUGAR YEAR BOOK 2017 INTERNATIONAL SUGAR ORGANIZATION 1 CANADA SQUARE, CANARY WHARF, LONDON, E14 5AA www.isosugar.org Copyright 2017 International Sugar Organization All rights reserved. No part of ISO
AT&T Phone. International Calling Rates for Phone International Plus, Phone 200 and Phone Unlimited North America
 AT&T Phone International Calling Rates for Phone International Plus, Phone 200 and Phone Unlimited North Rates do not include taxes, fees or surcharges. Call destinations and rates are subject to change.
Inferring Latent Preferences from Network Data
 Inferring Latent Preferences from Network John S. Ahlquist 1 Arturas 2 1 UC San Diego GPS 2 NYU 14 November 2015 very early stages Methodological extend latent space models (Hoff et al 2002) to partial
ProxiWorld tariffs & zones 2016
 made sent Internet zones Afghanistan 0,91 0,99 2,27 2,89 0 0,1 0,62 0,62 12 3 Albania 0,7 0,91 1,65 2,27 0 0,1 0,62 0,62 12 2 Algeria 0,7 0,91 1,65 2,27 0 0,1 0,62 0,62 12 2 Andorra 0,7 0,91 1,65 2,27
Dimensionality Reduction and Visualization
 MTTTS17 Dimensionality Reduction and Visualization Spring 2018 Jaakko Peltonen Lecture 7: Nonlinear dimensionality reduction, part 2 Two measures of faithfulness - precision and recall Faithfully? Good
Climate variability and international migration: an empirical analysis
 Climate variability and international migration: an empirical analysis NICOLA D. CONIGLIO, Corresponding author University of Bari Aldo Moro, Department of Economics, Largo Abbazia Santa Scolastica 53,
COMMITTEE ON FISHERIES
 September 2017 COFI:AQ/IX/2017/SBD.12 E COMMITTEE ON FISHERIES SUB-COMMITTEE ON AQUACULTURE Ninth Session Rome, 24 27 October 2017 REGIONAL STATISTICAL ANALYSIS OF RESPONSES BY FAO MEMBERS, REGIONAL FISHERIES
DISTILLED SPIRITS - EXPORTS BY VALUE DECEMBER 2017
 DISTILLED SPIRITS - EXPORTS BY VALUE DECEMBER 2017 U.S. COMMERCIAL EXPORTS OF DISTILLED SPIRITS - DECEMBER 2017 (U.S. DOLLARS) Da-Value-17-12 SUMMARY BY CLASS CLASS DECEMBER DECEMBER DOLLAR YTD YTD DOLLAR
Government Size and Economic Growth: A new Framework and Some Evidence from Cross-Section and Time-Series Data
 1 Government Size and Economic Growth: A new Framework and Some Evidence from Cross-Section and Time-Series Data Original Paper by Rati Ram (1986) Replication and Extension by Nicolas Lopez ECON 5341 The
Erratum to: Policies against human trafficking: the role of religion and political institutions
 Econ Gov (2016) 17:387 396 DOI 10.1007/s10101-016-0185-1 ERRATUM Erratum to: Policies against human trafficking: the role of religion and political institutions Niklas Potrafke 1,2 Published online: 16
Overview of past procurement of Solar Direct Drive (SDD) refrigeration systems and UNICEF SD support in Cold Chain
 refrigeration systems and UNICEF SD support in Cold Chain") Overview of past procurement of Solar Direct Drive (SDD) refrigeration systems and UNICEF SD support in Cold Chain 1 UNICEF Supply Does Make a Difference The overall objectives include: Shorten procurement
Overview of past procurement of Solar Direct Drive (SDD) refrigeration systems and UNICEF SD support in Cold Chain 1 UNICEF Supply Does Make a Difference The overall objectives include: Shorten procurement
Export Destinations and Input Prices. Appendix A
 Export Destinations and Input Prices Paulo Bastos Joana Silva Eric Verhoogen July 2017 Appendix A For Online Publication Figure A1. Real exchange rate, selected richer destinations relative price level
2001 Environmental Sustainability Index
 2001 Environmental Sustainability Index Annex 6: Variable Descriptions and Data An Initiative of the Global Leaders of Tomorrow Environment Task Force, World Economic Forum Annual Meeting 2001 Davos, Switzerland
Yodekoo Business Pro Tariff (Including Quickstart Out Of Bundle)
") Yodekoo Business Pro Tariff (Including Quickstart Out Of Bundle) This is the full tariff for Business Pro and any out of bundle spend using Quickstart products. All prices shown are in GBP per minute and
Yodekoo Business Pro Tariff (Including Quickstart Out Of Bundle) This is the full tariff for Business Pro and any out of bundle spend using Quickstart products. All prices shown are in GBP per minute and
Social and Economic Rights Fulfillment Index SERF Index and Substantive Rights Indices for 2015 (2017 update) Index for High Income OECD Countries
 Index for High Income OECD Countries") Social and Economic Rights Fulfillment and Substantive Rights Indices for (2017 update) for Countries Food Work Iceland ISL 1 1 93.18 42,325 83.01 99.91 98.48 91.34 Finland FIN 1 1 92.90 38,941 91.23 97.88
Social and Economic Rights Fulfillment and Substantive Rights Indices for (2017 update) for Countries Food Work Iceland ISL 1 1 93.18 42,325 83.01 99.91 98.48 91.34 Finland FIN 1 1 92.90 38,941 91.23 97.88
Human resources: update
 Human resources: update Workforce data As at 31 July 2017 Document issued 04 October 2017 Index of tables The information is as of 31 July 2017 (unless otherwise stated) and does not include data from
Swaziland Posts and Telecommunications Corporation (SPTC)---International Call Charges
---International Call Charges") Swaziland Posts and Telecommunications Corporation (SPTC)---International Call Charges INTERNATIONAL DIRECT (PER MINUTE) AND OPERATOR DIALLING (PER 3 MINUTES) CALL CHARGES Charge Letter Country Country
Swaziland Posts and Telecommunications Corporation (SPTC)---International Call Charges INTERNATIONAL DIRECT (PER MINUTE) AND OPERATOR DIALLING (PER 3 MINUTES) CALL CHARGES Charge Letter Country Country
MULTIPLE REGRESSION. part 1. Christopher Adolph. and. Department of Political Science. Center for Statistics and the Social Sciences
 CSSS/SOC/STAT 321 Case-Based Statistics I MULTIPLE REGRESSION part 1 Christopher Adolph Department of Political Science and Center for Statistics and the Social Sciences University of Washington, Seattle
04 June Dim A W V Total. Total Laser Met
 4 June 218 Member State State as on 4 June 218 Acronyms are listed in the last page of this document. AUV Mass and Related Quantities Length PR T TF EM Mass Dens Pres F Torq Visc H Grav FF Dim A W V Total
Natural Resource Management Indicators for the Least Developed Countries
 Natural Resource Management Indicators for the Least Developed Countries Alex de Sherbinin CIESIN, Columbia University 24 June 2005 Millennium Challenge Corporation workshop Brookings Institution Washington,
North-South Gap Mapping Assignment Country Classification / Statistical Analysis
 North-South Gap Mapping Assignment Country Classification / Statistical Analysis Due Date: (Total Value: 55 points) Name: Date: Learning Outcomes: By successfully completing this assignment, you will be
Fall International Student Enrollment Statistics
 International Student & Scholar Services Fall 2006 International Student Enrollment Statistics Julie Misa Director www.ips.uiuc.edu/isss Contents Summary...3 International Student Enrollment by Country...5
Marketing Report: Traffic Demographics (Monthly Comprehensive)
") Marketing Report: Traffic Demographics (Monthly Comprehensive) 06/17/2015 Search Traffic Overview Traffic Sources Marketing KPI: Visitor Behavior Audience Geo Location Audience Demographics Performance
Marketing Report: Traffic Demographics (Monthly Comprehensive) 06/17/2015 Search Traffic Overview Traffic Sources Marketing KPI: Visitor Behavior Audience Geo Location Audience Demographics Performance
Governments that have requested pre-export notifications pursuant to article 12, paragraph 10 (a), of the 1988 Convention
, of the 1988 Convention") Annex X Governments that have requested pre-export notifications pursuant to article 12, paragraph 10 (a), of the 1988 Convention 1. Governments of all exporting countries and territories are reminded
Annex X Governments that have requested pre-export notifications pursuant to article 12, paragraph 10 (a), of the 1988 Convention 1. Governments of all exporting countries and territories are reminded
Canadian Imports of Honey
 of 0409000029 - Honey, natural, in containers of a weight > 5 kg, nes (Kilogram) Argentina 236,716 663,087 2,160,216 761,990 35.27% 202.09% /0 76,819 212,038 717,834 257,569 35.88% 205.69% /0 United States
Research Exercise 1: Instructions
 Research Exercise 1: Instructions Instructions: 1. Cross-national scatter plots of trade openness and economic performance. a. Create a scatter plot with some measure of trade openness on the x-axis and
Spring 2007 International Student Enrollment by Country, Educational Level, and Gender
 Grand AFRICA 3 9 0 0 12 5 8 18 42 3 0 0 0 76 88 EASTERN AFRICA 0 0 0 0 0 2 3 7 16 1 0 0 0 29 29 Burundi 0 0 0 0 0 0 0 1 0 0 0 0 0 1 1 Eritrea 0 0 0 0 0 0 0 0 0 0 0 0 0 0 0 Ethiopia 0 0 0 0 0 0 0 1 4 0
Fall International Student Enrollment & Scholar Statistics
 International Student & Scholar Services Fall 2008 International Student Enrollment & Scholar Statistics Julie Misa Director www.ips.uiuc.edu/isss Contents Summary...2 International Student Enrollment
Tables of Results 21
 Tables of Results 21 Tables of Results 23 2005 ICP Global Results: Summary Table Price GDP per GDP per capita Gross domestic Gross domestic level capita indices indices product per capita product, billions
Appendix A. ICT Core Indicators: Definitions
 Appendix A. ICT Core Indicators: Definitions ICT indicator Fixed telephone subscriptions per 100 inhabitants Mobile cellular telephone subscriptions per 100 inhabitants Fixed (wired) Internet subscriptions
LAND INFO Worldwide Mapping, LLC 1 of 5
 Topographic Map List Country Afghanistan 1653 R 1653 0 R 447 41 R 130 0 N 63 P Albania 16 R 110 0 R 36 0 R 12 0 N 2 P Algeria 0 R 143 P 0 R 372 0 N 52 P Andorra 0 R 1 Angola 4 R 192 P 0 N 48 P? Antigua
Table 8c: Total endemic and threatened endemic species in each country (totals by taxonomic group): PLANTS
: PLANTS") IUCN Red List version 2018-1: Table 8c Last Updated: 05 July 2018 Table 8c: endemic and threatened endemic species in each country (totals by taxonomic group): PLANTS number of endemic and threatened endemic
IUCN Red List version 2018-1: Table 8c Last Updated: 05 July 2018 Table 8c: endemic and threatened endemic species in each country (totals by taxonomic group): PLANTS number of endemic and threatened endemic
University of Oklahoma, Norman Campus International Student Report Fall 2014
 International Student Report Fall 2014 Prepared by Institutional Research & Reporting June 2015 http://www.ou.edu/content/irr/data-center/annual-reports.html International Student Report Notes and Definitions
CALLS FROM HOME RESIDENTIAL TARIFFS. Prices effective from 3rd February _03/02/09_Residential_Cable _Version 2
 CALLS FROM HOME RESIDENTIAL TARIFFS Prices effective from 3rd February 2009 002261_03/02/09_Residential_Cable _Version 2 Telephone charges Phone packages (including line rental) Package Price (per month)
Travel and Diabetes Survey
 Travel and Diabetes Survey [ ] = Check all that apply, ( ) = Choose one answer, * = Required answer Which of the following best describes you? Check all that apply.* [ ] A person with type 1 diabetes (T1D)
Solow model: Convergence
 Solow model: Convergence Per capita income k(0)>k* Assume same s, δ, & n, but no technical progress y* k(0)=k* k(0) k Assume same s, δ, &
Fall International Student Enrollment Statistics
 International Student & Scholar Services Fall 2007 International Student Enrollment Statistics Julie Misa Director www.ips.uiuc.edu/isss Contents Summary...2 International Student Enrollment by Country...3
Africa, Asia and the Pacific, Latin America and the Caribbean. Africa, Asia and the Pacific, Latin America and the Caribbean
 ANNEXE I (disponible en anglais) UNESCO/POLAND CO-SPONSORED FELLOWSHIPS PROGRAMME 2017 List of Invited Member States per region and field of research as determined by the Polish authorities Project (Number
GEF Corporate Scorecard. May 2018
 GEF Corporate Scorecard May 218 GEF CORPORATE SCORECARD May 22, 218 Contributions to the Generation of Global Environment Benefits During the GEF 6 replenishment, the GEF 6 focal area strategies were
Table 8c: Total endemic and threatened endemic species in each country (totals by taxonomic group): PLANTS
: PLANTS") IUCN Red List version 2018-2: Table 8c Last Updated: 14 November 2018 Table 8c: endemic and threatened endemic species in each country (totals by taxonomic group): PLANTS number of endemic and threatened
IUCN Red List version 2018-2: Table 8c Last Updated: 14 November 2018 Table 8c: endemic and threatened endemic species in each country (totals by taxonomic group): PLANTS number of endemic and threatened
DISTILLED SPIRITS - IMPORTS BY VALUE DECEMBER 2017
 DISTILLED SPIRITS - IMPORTS BY VALUE DECEMBER 2017 U.S. DUTIABLE IMPORTS OF DISTILLED SPIRITS (U.S. DOLLARS) Ea-Value-17-12 SUMMARY: IMPORTS ENTERED FOR CONSUMPTION CLASS DECEMBER DECEMBER PERCENT JANUARY
DISTILLED SPIRITS - IMPORTS BY VOLUME DECEMBER 2017
 DISTILLED SPIRITS - IMPORTS BY VOLUME DECEMBER 2017 U.S. DUTIABLE IMPORTS OF DISTILLED SPIRITS (PROOF GALLONS) Ea-17-12 SUMMARY: IMPORTS ENTERED FOR CONSUMPTION CLASS DECEMBER DECEMBER PERCENT JANUARY
Duke Visa Services Open Doors Report on International Educational Exchange Annual Census of International Students Fall 2017
 Duke Visa Services Open Doors Report on International Educational Exchange Annual Census of International Students Fall 2017 Basic Data Total Total Enrolled International Students (excluding OPT): 3415
PTV Africa City Map 2017 (Standardmap)
") PTV Africa City Map 2017 (Standardmap) Map version name (Core) Map version name (Logistic) Release date (Logistics) Map version name (Logistics) (new) PTV_Africa_City_Map_2017 Data provider(s) Technology
PTV Africa City Map 2017 (Standardmap) Map version name (Core) Map version name (Logistic) Release date (Logistics) Map version name (Logistics) (new) PTV_Africa_City_Map_2017 Data provider(s) Technology
International Trusteeship: External Authority in Areas of Limited Statehood
 International Trusteeship: External Authority in Areas of Limited Statehood David A. Lake Christopher J. Fariss University of California San Diego, Dept. of Political Science, dlake@ucsd.edu Pennsylvania
!" #$$% & ' ' () ) * ) )) ' + ( ) + ) +( ), - ). & " '" ) / ) ' ' (' + 0 ) ' " ' ) () ( ( ' ) ' 1)
 ) * ) )) ' + ( ) + ) +( ), - ). & ' ) / ) ' ' (' + 0 ) ' ' ) () ( ( ' ) ' 1)") !" #$$% & ' ' () ) * ) )) ' + ( ) + ) +( ), - ). & " '" ) () -)( / ) ' ' (' + 0 ) ' " ' ) () ( ( ' ) ' 1) )) ) 2') 3 45$" 467" 8" 4 %" 96$ & ' 4 )" 3)" ::" ( & ) ;: < ( ) ) =)+ ( " " " $8> " ') +? @ ::
!" #$$% & ' ' () ) * ) )) ' + ( ) + ) +( ), - ). & " '" ) () -)( / ) ' ' (' + 0 ) ' " ' ) () ( ( ' ) ' 1) )) ) 2') 3 45$" 467" 8" 4 %" 96$ & ' 4 )" 3)" ::" ( & ) ;: < ( ) ) =)+ ( " " " $8> " ') +? @ ::
INTERNATIONAL TELECOMMUNICATION UNION SERIES T: TERMINALS FOR TELEMATIC SERVICES
 INTERNATIONAL TELECOMMUNICATION UNION TELECOMMUNICATION STANDARDIZATION SECTOR OF ITU T.35 (02/2000) SERIES T: TERMINALS FOR TELEMATIC SERVICES Procedure for the allocation of ITU-T defined codes for non-standard
GEODATA AVAILABILITY. 50% off. Order RegioGraph by October 31, 2018 and save 50% on maps for an additional country of your choice!
 GEODATA AVAILABILITY You can use our geomarketing software RegioGraph to visualize and analyze your company data on digital maps. In just a few steps, you can extract insights from your data that would
Annex to the ITU Operational Bulletin No III.2012 TSB TELECOMMUNICATION STANDARDIZATION BUREAU OF ITU LEGAL TIME 2012
 Annex to the ITU Operational Bulletin No. 999 1.III.2012 TSB TELECOMMUNICATION STANDARDIZATION BUREAU OF ITU LEGAL TIME 2012 Geneva, 2012 LEGAL TIME 2012 Note from TSB 1. The information contained in this
LEGAL TIME 2015 TSB TELECOMMUNICATION STANDARDIZATION BUREAU OF ITU. Annex to the ITU Operational Bulletin No IV.2015.
 Annex to the ITU Operational Bulletin No. 1073 1.IV.2015 TSB TELECOMMUNICATION STANDARDIZATION BUREAU OF ITU LEGAL TIME 2015 Geneva, 2015 Annex to ITU OB No. 1073 of 1.IV.2015 Page 1 of 9 LEGAL TIME 2015
PTV Africa City Map (Standardmap)
") PTV Africa City Map 2018.2 (Standardmap) Map version name (Core) Map version name (Logistic) Release date (Logistics) Map version name (Logistics) (new) PTV_Africa_City_Map_2018.2 Data provider(s) Technology
PTV Africa City Map 2018.2 (Standardmap) Map version name (Core) Map version name (Logistic) Release date (Logistics) Map version name (Logistics) (new) PTV_Africa_City_Map_2018.2 Data provider(s) Technology
World Bank Trustee for The Global Fund to Fight AIDS, Tuberculosis and Malaria
 World Bank Trustee for The Global Fund to Fight AIDS, Tuberculosis and Malaria Introduction Trustee Report March 2011 1. The World Bank has been the Trustee for the Trust Fund (the Trust Fund ) for the
Bilateral Labour Agreements, 2004
 Guest Austria Canada Turkey ( 64) Canada, Czech Republic, Hungary ( 98), Belgium Italy ( 46, 54), Turkey ( 64) Bulgaria ( 99), Pol (02) Germany ( 91) Bulgaria ( 99), Mongolia ( 99), Pol ( 92), Russia (
2017 Source of Foreign Income Earned By Fund
 2017 Source of Foreign Income Earned By Fund Putnam Emerging Markets Equity Fund EIN: 26-2670607 FYE: 08/31/2017 Statement Pursuant to 1.853-4: The fund is hereby electing to apply code section 853 for
International Investment Positions and Exchange Rate Dynamics: A Dynamic Panel Analysis
 International Investment Positions and Exchange Rate Dynamics: A Dynamic Panel Analysis Michael Binder 1 Christian J. Offermanns 2 1 Frankfurt and Center for Financial Studies 2 Frankfurt Motivation Empirical
Required answers: 0 Allowed answers: 0. [Code = 1] [TextBox] Required answers: 0 Allowed answers: 1. Required answers: 1 Allowed answers: 7
![Required answers: 0 Allowed answers: 0. [Code = 1] [TextBox] Required answers: 0 Allowed answers: 1. Required answers: 1 Allowed answers: 7](/thumbs/90/104467589.jpg "Required answers: 0 Allowed answers: 0. [Code = 1] [TextBox] Required answers: 0 Allowed answers: 1. Required answers: 1 Allowed answers: 7") UCC International Student Needs Assessment Description: A link will be sent out for this survey. Please give access to Nikki Jones and Lauren Weitzman. Date Created: 2/25/2011 5:24:58 PM Date Range: 3/7/2011
UCC International Student Needs Assessment Description: A link will be sent out for this survey. Please give access to Nikki Jones and Lauren Weitzman. Date Created: 2/25/2011 5:24:58 PM Date Range: 3/7/2011
Chapter 8 - Appendixes
 Chapter 8 - Appendixes Appendix 8.. Individual Preferences for Growth, Environment, and Income Distribution Funds to be invested in projects that Funds to be invested in projects to Funds to be invested
ICC Rev August 2010 Original: English. Agreement. International Coffee Council 105 th Session September 2010 London, England
 ICC 105-7 Rev. 1 31 August 2010 Original: English Agreement E International Coffee Council 105 th Session 21 24 September 2010 London, England Obstacles to consumption Background 1. In accordance with
Economic Growth: Lecture 1, Questions and Evidence
 14.452 Economic Growth: Lecture 1, Questions and Evidence Daron Acemoglu MIT October 23, 2018 Daron Acemoglu (MIT) Economic Growth Lecture 1 October 23, 2018 1 / 38 Cross-Country Income Differences Cross-Country
International Student Enrollment Fall 2018 By CIP Code, Country of Citizenship, and Education Level Harpur College of Arts and Sciences
 International Student Enrollment Fall 2018 By CIP Code, Country of Citizenship, and Education Level Harpur College of Arts and Sciences CIP Code Description Citizenship Graduate Undergrad Total 00.0000
Fertility and population policy
 Fertility and population policy ABDOULAYE OUEDRAOGO, Ph.D.* MEHMET S. TOSUN, Ph.D.* JINGJING YANG, Ph.D.* Article** JEL: H10, H59, J11, J13, J18 doi: 10.3326/pse.42.1.2 * The authors would like to thank
Effects of Business-as-usual anthropogenic emissions on air quality
 Effects of Business-as-usual anthropogenic emissions on air quality A. Pozzer 1,2, P. Zimmermann 2 U.M. Doering 3,, J. van Aardenne 3,, H. Tost 4, F. Dentener 3 G. Janssens-Maenhout 3, J. Lelieveld 2,5,6
Does Corruption Persist In Sub-Saharan Africa?
 Int Adv Econ Res (2009) 15:336 350 DOI 10.1007/s11294-009-9210-2 ORIGINAL PAPER Does Corruption Persist In Sub-Saharan Africa? Nicole Bissessar Published online: 12 June 2009 # International Atlantic Economic
A re examination of the Columbian exchange: Agriculture and Economic Development in the Long Run
 Are examinationofthecolumbianexchange: AgricultureandEconomicDevelopmentintheLongRun AlfonsoDíezMinguela MªDoloresAñónHigón UniversitatdeValéncia UniversitatdeValéncia May2012 [PRELIMINARYRESEARCH,PLEASEDONOTCITE]
natural gas World Oil and Gas Review
 natural gas Reserves Production Reserves/Production Ratio Consumption Per Capita Consumption Production/Consumption Ratio Exports Imports Traded Gas LNG - Liquefaction and Regasification Capacity Natural
 World OilReview 201 Contents List of Countries: Europe: Albania, Austria, Belarus, Belgium, Bosnia Herzegovina, Bulgaria, Croatia, Cyprus, Czech Republic, Denmark, Estonia, Finland, France, Germany,
Briefing Notes for World Hydrography Day
 Briefing Notes for World Hydrography Day - 2017 Mapping our seas, oceans and waterways - more important than ever Purpose of World Hydrography Day In 2005, the General Assembly of the United Nations (UN)
The World Trade Network
 Prelims Luca De Benedictis 1 Lucia Tajoli 2 1 Università di Macerata - Italy 2 Politecnico di Milano - Italy UC Berkeley - February 25th, 2010 Prelims The outline of the talk Introduction: World Trade
Countries, World, Universe Maps of world, continents. CSRidentity.com
 Countries, World, Universe Maps of world, continents We urge people to take a printout and see the countries, oceans in world Map of Africa continent Countries, islands in Africa continent Algeria Angola
Online APPENDIX. Further Results for: The Effects of the International Security Environment on National Military Expenditures: A Multi-Country Study
 Online APPENDIX Further Results for: The Effects of the International Security Environment on National Military Expenditures: A Multi-Country Study William Nordhaus*, John R. Oneal**, Bruce Russett***
Bahrain, Israel, Jordan, Kuwait, Saudi Arabia, United Arab Emirates, Azerbaijan, Iraq, Qatar and Sudan.
 Publication Date: 4 Dec 2012 Effective Date: 4 Dec 2012 Addendum 3 to the CRI Technical Report, (Version: 2012, Update 2) This document updates the Technical Report (Version: 2012, Update 2) and details
Annex 6. Variable Descriptions and Data
 Annex 6. Variable Descriptions and Data This section contains complete variable descriptions along with the original data used to produce the 2002 Environmental Sustainability Index. The variables are
International Rates. RATE per minute use
 Afghanistan 93 $0.54 Afghanistan Cellular 93.999 $0.55 Albania 355 $0.16 Albania Cellular 355.999 $0.41 Alberta, B AB,BC,MB,NB,NF,NS,NT,YT,ON,PE,PQ,SK,NU $0.00 Alberta, B AB,BC,MB,NB,NF,NS,NT,YT,ON,PE,PQ,SK,NU
United Nations Environment Programme
 UNITED NATIONS United Nations Environment Programme Distr. GENERAL UNEP/OzL.Pro/ExCom/67/7 18 June 2012 EP ORIGINAL: ENGLISH EXECUTIVE COMMITTEE OF THE MULTILATERAL FUND FOR THE IMPLEMENTATION OF THE MONTREAL
W o r l d O i l a n d G a s R e v i e w
 W o r l d O i l a n d G a s R e v i e w 2 0 0 8 Pro duction / Produzione In 2006 the world production of natural gas grew by 3.5%, reaching 2,929 billion cubic metres (bcm). In 2006, Russia was the leading