WV WATERSHED ASSESSMENT PILOT PROJECT
|
|
|
- Beverly Harrison
- 5 years ago
- Views:
Transcription


1 WV WATERSHED ASSESSMENT PILOT PROJECT Expert Workshop #1, Round 2 Bridgeport Conference Center, October 10 & 11, 2012 Gauley River Kent Mason
2 Outline Project Background Methodology & Model Structure Relative vs. Objective Ranking Methods Break Gauley Results Lunch Upper Guyandotte Results Objective Threshold Break-Out Groups
3 Project Background 1. Objectives 2. Study Area 3. Process & Timeline
4 Project Objectives Design and test a watershed assessment process that can be replicated in WV s remaining watersheds Find datasets & develop metrics to measure Current Condition/Function & Future Threats Rank planning units in terms of Restoration & Protection Priorities Provide a decision support tool to assist partners, stakeholders, and regulatory staff with decisions affecting aquatic resources Identify data gaps & data needs

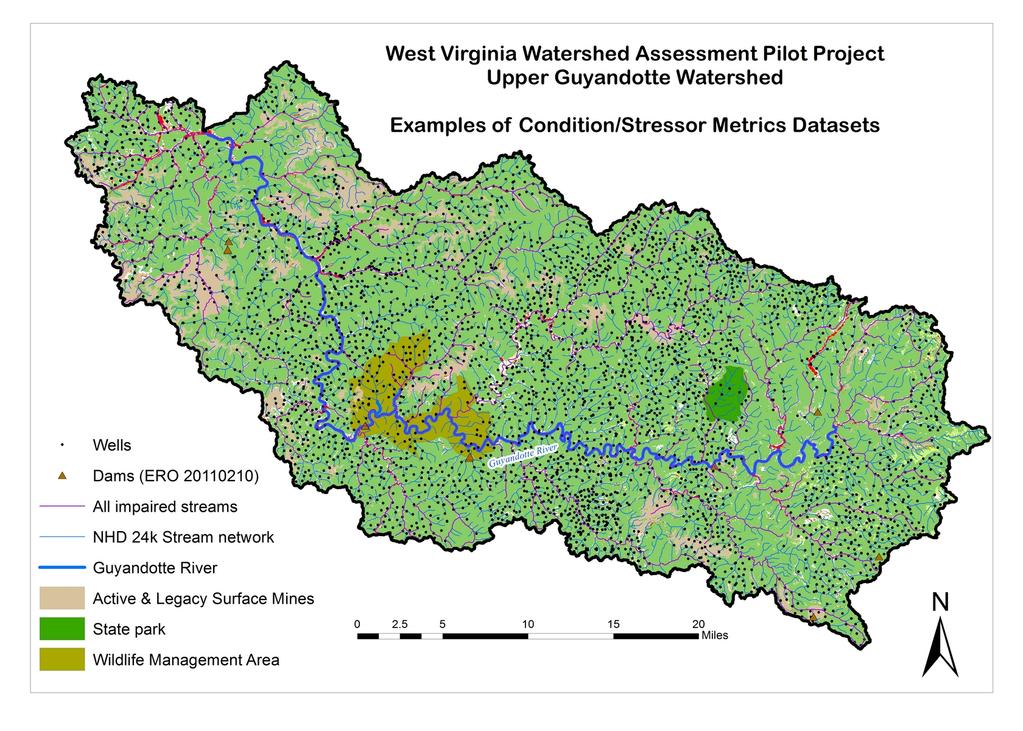
5 Project Study Area 5 HUC8 Watersheds: YEAR 1: Monongahela Elk YEAR 2: Gauley Little Kanawha Upper Guyandotte
6 Project Process & Timeline First 2 Watersheds: April 2011 Project Start: Data Compilation June 2011 Technical Advisory Team Meeting October 2011 Expert Workshop #1 January 2012 Expert Workshop #2 April 2012 Stakeholder/Partner Workshops June 2012 Draft Watershed Reports completed Final 3 Watersheds: June 2012 Start Data Compilation October Expert Workshop #1 December Expert Workshop #2 February Stakeholder/Partner Workshops April 2013 Final reports & interactive web application completed
7 Methodology 1. Planning Units 2. Watershed Characterization 3. Model Structure 4. Prioritization Methods 5. Datasets & Metrics
8 Watershed Characterization Two Scales of Planning Units: HUC-12 watersheds Catchments
9 Project HUC8 Watersheds
10 Planning Units 1: HUC12s
11 Planning Units 2: Catchments

12 NHDPlus Catchments (modified)


13 Landscape Types Stream/Riparian Areas Wetlands Uplands
14 Planning Unit Prioritization Phase I: Ranking of planning units according to current Condition/Function Phase II Consolidated Analysis: Cumulative Watershed Effects Historical and Future Conditions Evaluate target areas within planning units
15 Model Structure Hierarchical Structure: 3 Models: Streams Wetlands Uplands 2 Categories: Condition/Function Consolidated Analysis Several Indices per Category Multiple Metrics to define each index
 Public water supply Headwaters Rare species (riparian) Riparian land use (ag, graze, developed, natural) Secured lands (GAP 1, 2, 3) Water quality parameters (ph, spec cond, etc)")
16 1 of 3 Models STREAMS/RIPARIAN PRIORITY MODEL Index CONDITION/ FUNCTION Category Water Quality Water Quantity Hydrologic connectivity Biodiversity Riparian Habitat Protected Lands Impaired streams (303d, AMD, TMDL) Public water supply Headwaters Rare species (riparian) Riparian land use (ag, graze, developed, natural) Secured lands (GAP 1, 2, 3) Water quality parameters (ph, spec cond, etc) Large quantity users Local integrity score Taxa richness RBP Score Metrics Land use (ag, graze, developed, natural cover) Wastewater treatment plants Wetland area Mussels Active surface mining (riparian) Percent imperviousness Percent imperviousness Power plants Calcareous bedrock (riparian) Legacy surface mining (riparian) Road/rail density Dam drainage area Land use (forested riparian area) Non-native invasive species (riparian) Wells (riparian) Active & legacy surface mining Active & legacy surface mining Dams Road/rail density (riparian) Underground mining Underground mining Road/rail density Wells
17 Redundant Metrics Perform Correlation Analysis to find highly correlated metrics Performed on HUC12 analysis PCA Analysis: to find metrics with greatest impact on water quality Eliminated several metrics
18 Metrics in Multiple Indices Some metrics appropriate in multiple indices: Percent impervious cover Surface mining Oil and Gas wells Road/railroad density Landcover Indices are rated independently of each other Potential for double-counting of these metrics in overall model
19 Weighting Some metrics influence condition more than others need to weight accordingly Preliminary weighting based on literature review, expert opinion, and best guess Weighted both individual metrics and individual indices
20 Relative vs. Objective Classification Relative ranking compares planning units with each other, but gives no information on which are good quality and which are not Need to define Thresholds for each metric to be able to assign to a category Literature review has only yielded a handful of objective thresholds Used the DEP s reference streams and stressed points to define thresholds

21 FEEDBACK/QUESTIONS? Elk River at Birch Run, WV
22 Metrics: Condition/Function 1. Streams & Riparian Areas 2. Wetlands 3. Uplands
23 Indices: Streams CONDITION/ FUNCTION Water quality Water quantity Hydrologic Connectivity Biodiversity Riparian Habitat Protected Lands
24 Water Quality Metrics DEP s Water Quality Data GLIMPSS Surface & Underground Mining Impervious Surface Landuse/Landcover: Agricultural Grazed Natural Developed Oil and Gas Wells Road/railroad density Karst
25 Water Quantity Metrics No good direct measurements for most streams, especially headwaters, had to find surrogates: Dam drainage area Impervious surface Large Quantity users Mining: Surface & Underground
26 Hydrologic Connectivity Metrics Unimpeded Streams (stream lengths without impoundments or waterfalls) Percent riparian area with forested cover Roads/railroads Culverts Bridges Percent of stream miles that are headwaters
27 Biodiversity Metrics Rare and threatened species (includes DNR s SGNC species), including mussels, fish, crayfish, odonates Rare species index (calculated from # geology classes, elevation range, calcareous bedrock) Trout streams Non-native invasive species Mussel streams
28 Riparian Habitat Metrics Riparian land use Active surface mining Oil and gas wells Road/railroad density Pipelines, transmission lines, buildings
29 Indices: Wetlands CONDITION/ FUNCTION Water quality: Pollutant filtration/sediment retention Hydrology: Flood storage/connectivity Biodiversity Wetland Habitat Protected Lands
30 Wetland Buffer vs. Catchment Wetland buffer (50 m) Wetland catchments (delineated using contributing NHDPlus catchments)
31 Planning Units without Wetlands Several planning units did not have mapped NWI wetlands Null values for metrics dependent on presence of wetlands Only 2 indices had values for all planning units: Wetland Hydrology (presence of hydric soils) Biodiversity
32 Water Quality Metrics Forested headwater wetlands Landcover in wetland catchments (% ag, grazing, urban, forested, natural) % imperviousness in catchment Roads/railroads in catchment Mining and oil & gas wells in catchment Septic systems, landfills, timbering in catchment
33 Wetland Hydrology Metrics Wetland area and size Ratio of wetland catchment area to wetland area Distance to nearest surface water Hydric soils (potential for wetland restoration) Forested flood plain wetlands Floodplain area
34 Indices: Uplands CONDITION/ FUNCTION Habitat Connectivity Upland Habitat Biodiversity Protected Lands
35 Habitat Connectivity metrics Forest Block Sizes Active surface mining, coal production Oil & gas wells Road/railroad density Transmission lines, pipelines Wind turbines, FCC towers Buildings, landfills Timber harvests
36 Biodiversity Metrics Rare and threatened species (includes DNR s SGNC species) Non-native invasive species Number of vegetation types Calcareous bedrock Pests and Pathogens: Percent loss (basal area), hardwood decline Rare species index (calculated from # geology classes, elevation range, calcareous bedrock) Number of ecoregional subdivisions
37
38 Metrics: Consolidated Analysis 1. Priority Interest Areas 2. Future Threats

39 Priority Interest Areas USFS Forest Proclamation Boundary WV Division of Forestry priority areas TNC aquatic and terrestrial portfolios
40 Future Threats Energy Marcellus Shale thickness, proposed wells Unmined coal, permitted mines Wind potential Proposed transmission lines, pipelines Population/Development Future Growth Areas/Population projections Proposed Roads Climate Change Projected Land Use Projected Agriculture/mining/urban development
41 Index and Model Results
42 Rollup of Metrics Relative Method Standardized metrics: Set highest quality value to 1, lowest to 0 Distributed rest of values between 0 and 1 For index scores: averaged all metrics according to metric weights For model scores: averaged all Indices according to index weights Resulted in Ranks for each index and model Grouped into Equal Interval Categories Done independently at HUC12 and Catchment levels

43 Water Quality Water Quantity Biodiversity Streams: Upper Guyandotte Overall Ranking HUC12s Riparian Habitat Hydrologic Connectivity Protected Lands
44 Water Quality Hydrology Wetlands: Gauley Overall Ranking Catchments Wetland Habitat Biodiversity
45 Final Product Overview
46 Project Outputs Five watershed assessment reports Will include specific priorities and strategies, as well as detailed methodology, references and lessons learned Interactive web mapping application A spatial decision support tool to assist stakeholders in identifying target areas, strategies and actions
47 Interactive Web Mapping Application Desktop tool that will allow users to: View the various datasets in one application View results of all scores and rankings Develop customized scenarios to rank target areas for restoration and/or protection projects according to users priorities

48 Wetlands Restoration Monongahela HUC12 Level Wetlands Overall Results* (*All results presented are preliminary and currently used for illustrative purposes only)

49 Wetlands HUC12 Level Water Quality Wetlands HUC12 Level Hydrology
50 Wetlands - HUC12 Level Wetland Habitat

51 Wetlands - Catchment Level Wetland Habitat Results

52 Streams - Catchment Level Water Quality Results

53 Wetlands Catchment Level Roads, LULC, Hydric soils, (Floodplain)

54 Wetlands Catchment Level Aerial Imagery
55 Word of Caution for Users This is purely a GIS-based analysis with no field verification Suggested Strategy for selecting potential protection/restoration sites: Select several candidate planning units using the GIS tool Conduct site visits to evaluate current conditions on the ground Make final decision based on results from GIS analysis and site visits

56 Mon wetlands Dunkard Creek FEEDBACK/QUESTIONS?
57 Objective Ranking Methodology
58 Relative vs. Objective Classification Relative ranking compares planning units with each other, but gives no information on which are good quality and which are not Need to define Thresholds for each metric to be able to assign to a category Literature review has only yielded a handful of objective thresholds Used the DEP s reference streams and stressed points to define thresholds
59 Objective Analysis Categories Very Good: Ecologically desirable status; requires little intervention for maintenance Good: Indicator within acceptable range of variation; some intervention required for maintenance Restoration Threshold Fair: Outside acceptable range of variation; requires human intervention Poor: Restoration increasingly difficult; may result in extirpation of target
60 Reference Criteria Dissolved Oxygen: 6.0 mg/l ph: 6.0 and 9.0 Conductivity: <500 µmhos/cm Fecal coliform: <800 colonies/100 ml No obvious sources of non-point-source pollution RBP Epifaunal substrate score: 11 RBP Channel alteration score: 11 RBP Sediment deposition score: 11 RBP Bank disruptive score: 11 RBP Riparian vegetation zone width score: 6 RBP Total habitat score: 65% of maximum 240 Evaluation of anthropogenic activities and disturbances No known point source discharges upstream of assessment site
61 Stressed Criteria Dissolved Oxygen: <4.0 mg/l ph: <4.0 or >9.0 Conductivity: >1000 µmhos/cm Fecal coliform: >5,000 colonies/100 ml RBP Epifaunal substrate score: <7 RBP Channel alteration score: <7 RBP Sediment deposition score: <7 RBP Bank disruptive score: <7 RBP Riparian vegetation zone width score: <4 RBP Total habitat score: <120 Site was considered stressed if it met at least 2 of the criteria
62 Catchments with Reference and Stressed Streams
63 Objective Ranking Methodology Calculated metrics for stressed and reference catchments separately: Reference catchments to define very good/good and fair/good thresholds Stressed catchments to define fair/poor threshold Examined the distribution of values for each metric, considered using median, 25 th /75 th, 90 th /10 th, or 95 th /5 th percentiles Results were most consistent using the 25 th /75 th percentiles
64 Objective Ranking Methodology All Catchments POOR FAIR GOOD VERY GOOD Stressed Catchments Reference Catchments Higher Quality
65 Thresholds Definition: Reference Top 25% of reference catchments in Very Good category (ideal ecological condition) Top 75% of reference catchments in Good category (acceptable ecological condition) Positive metrics (higher values indicate higher quality): Very good/good: 75 th percentile Good/fair: 25 th percentile Negative metrics (higher values indicate lower quality): Very good/good: 25 th percentile Good/fair: 75 th percentile
66 Threshold Definition: Reference Positive Factors: Very good/good: 75 th percentile Good/fair: 25 th percentile Restoration Threshold FAIR GOOD VERY GOOD Negative Factors: Very good/good: 25 th percentile Good/fair: 75 th percentile Higher values, higher quality Restoration Threshold VERY GOOD GOOD FAIR Lower values, higher quality
67 Threshold Definition: Stressed Worst 25% of stressed catchments in Poor category Majority of stressed catchments in Fair category Positive metrics: Fair/poor: 25 th percentile Negative metrics: Fair/poor: 75 th percentile
68 Threshold Definition: Stressed Positive Factors: Fair/poor: 25 th percentile Poor/Fair Threshold POOR FAIR Negative Factors: Fair/poor: 75 th percentile Lower values, lower quality Poor/Fair Threshold FAIR POOR Higher values, lower quality
69 Objective Methodology Issues
70 Only Fair/Good Threshold Defined For some metrics some or all thresholds were 0 Assigned these to a presence/absence metric: Fair/good Threshold at 0 Positive metrics: If >0 defined as good, if =0 defined as fair Negative metrics: If >0 defined as fair, if =0 defined as good Issue: No Very Good or Poor categories, results in less variability In essence, forcing a 2-category system into 4 categories Possible solution: Assign intermediate categories for those thresholds
71 Only Two Thresholds Defined For some metrics could only define a good/fair and either fair/poor or very good/good threshold Resulted in presence being defined as: Good for positive metrics Fair for negative metrics Issue: these metrics would still have: Fair and Poor categories for positive metrics, but no Very Good Very Good and Good categories of negative metrics, but no Poor Less overall variability in results
72 Some Thresholds Very Stringent Percent Imperviousness: Very Good: <0.014% Good: <0.16% Fair: <2.7% Poor: >=2.7% Percent Natural Cover: Very Good: >99% Good: >94% Fair: >75% Poor: <=75%
73 HUC12s Show Little Variability Only Good and Fair Categories represented for many HUC12 results Full Range of Categories for catchment results

74 Model Results Show Little Variability Only Good and Fair categories represented for both catchments and HUC12s
75 Objective Vs. Relative Results
76 Use of Interactive Web Tool Possible steps to define priority areas: 1) Start at HUC12 level: a) Objective ranking: i. Good/Very Good HUC12s to identify protection candidates ii. Fair HUC12s to identify restoration candidates iii. Poor HUC12s may be too degraded for restoration b) Refine with relative ranking: i. Within candidate HUC12s, find relatively better ones 2) Zoom in to Catchment level: a) Objective ranking to identify candidate catchments b) Refine with catchment relative ranking 3) Zoom in to individual catchments to target specific sites for protection and restoration
77 Concerns Will users find lack of variability among objective results confusing? Is it confusing to have two different ranking strategies in one web tool?
78 Group Discussion After Results Presentations Are thresholds defined appropriately? Is the Very Good/Good threshold too stringent? Very difficult to attain Is the Poor/Fair threshold too stringent? Should an alternate definition (i.e., quantiles, other?) be used where thresholds don t work? How should metrics with missing thresholds be handled? Keep as presence/absence Assign intermediate very good/good and poor/fair categories instead of forcing into good and fair only Assign arbitrary/ best guess thresholds for all thresholds How should results be presented in interactive web tool? Suggest potential workflow for users
The Refugia Concept: Using Watershed Analysis to Prioritize Salmonid Habitat for Conservation and Restoration
 The Refugia Concept: Using Watershed Analysis to Prioritize Salmonid Habitat for Conservation and Restoration Christopher May Battelle & UW Cumulative Impacts of Urbanization Landscape Alterations Loss
Birch Creek Geomorphic Assessment and Action Plan
 Birch Creek Geomorphic Assessment and Action Plan Jim Webster Tim Hanrahan, PhD, CFM Jesse Schwartz, PhD Zach Hill January 22, 2015 White Eagle Grange This Project is a First Step in Strategy Planning
Summary Description Municipality of Anchorage. Anchorage Coastal Resource Atlas Project
 Summary Description Municipality of Anchorage Anchorage Coastal Resource Atlas Project By: Thede Tobish, MOA Planner; and Charlie Barnwell, MOA GIS Manager Introduction Local governments often struggle
What is a watershed or landscape perspective?
 What is a watershed or landscape perspective? -remove sediment -add sediment -add wood, riparian manipulation -alter (engineer) channel/floodplain morphology -restore/abandon roads You are here What is
Savannah District s Revised SOP: Moving Towards A Functional Approach. US Army Corps of Engineers BUILDING STRONG
 Savannah District s Revised SOP: Moving Towards A Functional Approach US Army Corps of Engineers Agenda SOP Revision Concept New Aquatic Resource Credit Types New Urban Mitigation Service Area Filter Background
Assessment. Assessment
 2001 SPRINGBROOK CREEK RESTORATION - THREE YEAR POST-CONSTRUCTION REVIEW - Presented by Bruce Henderson and Andy Harris 2005 River Restoration Northwest Symposium Skamania Lodge, Washington www.hendersonlandservices.com
Use of benthic invertebrate biological indicators in evaluating sediment deposition impairment on the Middle Truckee River, California
 Use of benthic invertebrate biological indicators in evaluating sediment deposition impairment on the Middle Truckee River, California David B. Herbst Sierra Nevada Aquatic Research Laboratory University
United States Department of the Interior NATIONAL PARK SERVICE Northeast Region
 United States Department of the Interior NATIONAL PARK SERVICE Northeast Region June 17, 2017 REQUEST FOR STATEMENTS OF INTEREST and QUALIFICATIONS Project Title: ASSESSMENT OF NATURAL RESOURCE CONDITION
George Host and Tom Hollenhorst Natural Resources Research Institute University of Minnesota Duluth
 George Host and Tom Hollenhorst Natural Resources Research Institute University of Minnesota Duluth Marc Hershfield Minnesota Pollution Control Agency Duluth, MN St. Louis River watershed Duluth-Superior
Assessing Michigan s Biological diversity. Michigan Natural Features Inventory MSU Extension
 Assessing Michigan s Biological diversity John Paskus,, Amy Derosier,, Edward Schools, and Helen Enander Michigan Natural Features Inventory MSU Extension Goal Provide scientifically based information
Welcome to NetMap Portal Tutorial
 Welcome to NetMap Portal Tutorial Potential Applications What Can you do with the Portal? At least 25 things! 1) Locate the best potential fish habitats. 2) Identify biological hotspots. 3) Map floodplain
Krešimir Žganec, doc. dr. sc. University of Zadar
 Krešimir Žganec, doc. dr. sc. University of Zadar Project aim: highlight the most outstanding freshwater/river ecosystems in Serbia Expected results: A map showing the most outstanding freshwater ecosystems
Land Use Methods & Metrics Development Outcome
 Quarterly Progress Meeting November 15, 2018 Land Use Methods & Metrics Development Outcome Peter Claggett, USGS LUWG Coordinator Through the Chesapeake Bay Watershed Agreement, the Chesapeake Bay Program
Sediment and nutrient transport and storage along the urban stream corridor
 Sediment and nutrient transport and storage along the urban stream corridor Greg Noe, Cliff Hupp, Ed Schenk, Jackie Batson, Nancy Rybicki, Allen Gellis What is the role of floodplains everywhere? Noe 2013,
Wetland & Floodplain Functional Assessments and Mapping To Protect and Restore Riverine Systems in Vermont. Mike Kline and Laura Lapierre Vermont DEC
 Wetland & Floodplain Functional Assessments and Mapping To Protect and Restore Riverine Systems in Vermont Mike Kline and Laura Lapierre Vermont DEC NWI+ Hydro-Geomorphic Characterization of Wetlands and
A Comprehensive Inventory of the Number of Modified Stream Channels in the State of Minnesota. Data, Information and Knowledge Management.
 A Comprehensive Inventory of the Number of Modified Stream Channels in the State of Minnesota Data, Information and Knowledge Management Glenn Skuta Environmental Analysis and Outcomes Division Minnesota
Why Geomorphology for Fish Passage
 Channel Morphology - Stream Crossing Interactions An Overview Michael Love Michael Love & Associates mlove@h2odesigns.com (707) 476-8938 Why Geomorphology for Fish Passage 1. Understand the Scale of the
Chesapeake Bay Program s New Land Cover Map (and some other neat stuff)
") Chesapeake Bay Program s New Land Cover Map (and some other neat stuff) Cassandra Pallai Geospatial Project Manager Chesapeake Conservancy December 6, 2016 Potomac Watershed Partnership Chesapeake Conservancy
Chesapeake Bay Program s New Land Cover Map (and some other neat stuff) Cassandra Pallai Geospatial Project Manager Chesapeake Conservancy December 6, 2016 Potomac Watershed Partnership Chesapeake Conservancy
Kootenai River Habitat Restoration Program Update
 Kootenai River Habitat Restoration Program Update Kootenai Tribe of Idaho Kootenai Valley Resource Initiative November 19, 2012 Bonners Ferry, Idaho Changes to Kootenai Basin Beaver trapping Floodplain
Stream Geomorphology. Leslie A. Morrissey UVM July 25, 2012
 Stream Geomorphology Leslie A. Morrissey UVM July 25, 2012 What Functions do Healthy Streams Provide? Flood mitigation Water supply Water quality Sediment storage and transport Habitat Recreation Transportation
Cannon River Watershed 2017 Zonation Update Clarification
 Project Name Cannon River One Watershed, One Plan Date 8-10-2017 To / Contact info Policy Committee Planning Work Group From / Contact info Regarding Meghan Funke, PhD Cannon River Watershed 2017 Zonation
Use of Remote Sensing and GIS for Wetland, Riparian, and Watershed Assessment, Restoration, and Monitoring
 Use of Remote Sensing and GIS for Wetland, Riparian, and Watershed Assessment, Restoration, and Monitoring Ralph Tiner Wetland Ecologist U.S. Fish & Wildlife Service National Wetlands Inventory Program
Appendix I: The Summit-at-Snoqualmie Master Development Plan Proposal FEIS Physical and Biological Resource Data Tables
 Appendix I: The Summit-at-Snoqualmie Master Development Plan Proposal FEIS Physical and Biological Resource Data Tables DPC Tables Rationale for DPC Analysis Parameters for 7 th Field Watersheds for The
Virginia Shoreline Mapping Tools
 Virginia Shoreline Mapping Tools December 15, 2017 Karen Duhring Center for Coastal Resources Management Virginia Institute of Marine Science College of William & Mary Virginia Shoreline Mapping Tools
Assessment and valuation of Ecosystem Services for decision-makers
 Assessment and valuation of Ecosystem Services for decision-makers An introduction to the ARIES approach Ferdinando Villa *, Ken Bagstad Gary Johnson, Marta Ceroni *Basque Center for Climate Change, Bilbao,
Conserving freshwater ecosystem values in Tasmania, Australia: identification and application of freshwater conservation management priority areas
 Conserving freshwater ecosystem values in Tasmania, Australia: identification and application of freshwater conservation management priority areas Danielle Hardie 1 and Peter Davies 2 1 Department of Primary
Lower South Fork McKenzie River Floodplain Enhancement Project
 Lower South Fork McKenzie River Floodplain Enhancement Project McKenzie River Ranger District Willamette National Forest Project Location The project is located in the South Fork McKenzie River Watershed,
Puakea, Hawaiÿi. Puakea, Hawaiÿi WATERSHED FEATURES
 Puakea, Hawaiÿi DAR Watershed Code: 85046 Puakea, Hawaiÿi WATERSHED FEATURES Puakea watershed occurs on the island of Hawaiÿi. The Hawaiian meaning of the name is white blossom. The area of the watershed
Landscape Planning and Habitat Metrics
 Landscape Planning and Habitat Metrics Frank W. Davis National Center for Ecological Analysis and Synthesis UC Santa Barbara (Tools for Landscape Biodiversity Planning) Jimmy Kagan Institute for Natural
DATABASE DEVELOPMENT & SPATIAL ANALYSES IN SUPPORT OF TENNESSEE S STATE WILDLIFE ACTION PLAN Data and Methods Update
 DATABASE DEVELOPMENT & SPATIAL ANALYSES IN SUPPORT OF TENNESSEE S STATE WILDLIFE ACTION PLAN 2012 Data and Methods Update Database Development & Spatial Analyses in Support of Tennessee s State Wildlife
Distinct landscape features with important biologic, hydrologic, geomorphic, and biogeochemical functions.
 1 Distinct landscape features with important biologic, hydrologic, geomorphic, and biogeochemical functions. Have distinguishing characteristics that include low slopes, well drained soils, intermittent
Riparian Assessment. Steps in the right direction... Drainage Basin/Watershed: Start by Thinking Big. Riparian Assessment vs.
 Riparian Assessment vs. Monitoring Riparian Assessment What is a healthy stream? Determine stream/riparian health Determine change or trend, especially in response to mgmt Classification = designation
National Fish Habitat Action Plan Data Viewer Application
 Jeff Smith Andrea Ostroff USGS NBII National Fish Habitat Action Plan Data Viewer Application Outline Overview of the NFHAP habitat assessment project. The NFHAP spatial framework. The habitat assessment
Stream Ecological Assessment in Virginia Using INSTAR. Greg Garman Leonard Smock Stephen McIninch William Shuart Virginia Commonwealth University
 Stream Ecological Assessment in Virginia Using INSTAR Greg Garman Leonard Smock Stephen McIninch William Shuart Virginia Commonwealth University Interactive Stream Assessment Resource (INSTAR( INSTAR)
How Do Human Impacts and Geomorphological Responses Vary with Spatial Scale in the Streams and Rivers of the Illinois Basin?
 How Do Human Impacts and Geomorphological Responses Vary with Spatial Scale in the Streams and Rivers of the Illinois Basin? Bruce Rhoads Department of Geography University of Illinois at Urbana-Champaign
Watershed concepts for community environmental planning
 Purpose and Objectives Watershed concepts for community environmental planning Dale Bruns, Wilkes University USDA Rural GIS Consortium May 2007 Provide background on basic concepts in watershed, stream,
Start of Presentation: No notes (Introductory Slide 1) 1) Salmonid Habitat Intrinsic Potential (IP) models are a type of habitat potential
 1) Salmonid Habitat Intrinsic Potential (IP) models are a type of habitat potential") The What and How of Salmonid Habitat Intrinsic Potential Modeling Start of Presentation: No notes (Introductory Slide 1) 1) Salmonid Habitat Intrinsic Potential (IP) models are a type of habitat potential
The What and How of Salmonid Habitat Intrinsic Potential Modeling Start of Presentation: No notes (Introductory Slide 1) 1) Salmonid Habitat Intrinsic Potential (IP) models are a type of habitat potential
Natural Shoreline Landscapes on Michigan Inland Lakes
 Natural Shoreline Landscapes on Michigan Inland Lakes Excerpts from Chapters 2 and 3 Photo Photo by Jane by Jane Herbert Herbert Did you know? Twenty-four species of amphibians, 25 species of reptiles,
Biodiversity Blueprint Overview
 Biodiversity Blueprint Overview Climate Variability Climate projections for the Glenelg Hopkins Regions suggest that the weather will be hotter and drier in the coming years which will impact on land use,
Huron Creek Watershed 2005 Land Use Map
 Huron Creek Watershed 2005 Land Use Map Created By: Linda Kersten, 12/20/06 Created For: MTU Introduction to GIS Class (FW 5550) The Huron Creek Watershed Advisory Committee Michigan Technological University,
Stream Restoration and Environmental River Mechanics. Objectives. Pierre Y. Julien. 1. Peligre Dam in Haiti (deforestation)
") Stream Restoration and Environmental River Mechanics Pierre Y. Julien Malaysia 2004 Objectives Brief overview of environmental river mechanics and stream restoration: 1. Typical problems in environmental
Stream Restoration and Environmental River Mechanics Pierre Y. Julien Malaysia 2004 Objectives Brief overview of environmental river mechanics and stream restoration: 1. Typical problems in environmental
StreamStats: Delivering Streamflow Information to the Public. By Kernell Ries
 StreamStats: Delivering Streamflow Information to the Public By Kernell Ries U.S. Department of the Interior U.S. Geological Survey MD-DE-DC District 410-238-4317 kries@usgs.gov StreamStats Web Application
Gina Hunt Chesapeake Bay Program Fish Habitat Coordinator
 Gina Hunt Chesapeake Bay Program Fish Habitat Coordinator Regional Fish Habitat Assessment User Needs A guiding principal for the assessment framework is that it should support planning and management
Multi-scale modeling of species distributions, hydrology, & gene flow
 Multi-scale modeling of species distributions, hydrology, & gene flow Douglas R. Leasure PhD. Candidate University of Arkansas Department of Biological Sciences BIG data in GIS http://www.gap.uidaho.edu/portal/datadownload.html
Ecological Land Cover Classification For a Natural Resources Inventory in the Kansas City Region, USA
 Ecological Land Cover Classification For a Natural Resources Inventory in the Kansas City Region, USA by Applied Ecological Services, Inc. In cooperation with the Mid-America Regional Council 600 Broadway,
Little Blackfoot TPA 2009 Sediment and Habitat Assessment QAQC Review March 9, 2010
 Little Blackfoot TPA 2009 Sediment and Habitat Assessment QAQC Review March 9, 2010 1.0 PROJECT OVERVIEW Sediment and habitat monitoring in the Little Blackfoot TPA was conducted in July of 2009 as outlined
Vegetation and Wildlife Habitat Mapping Study in the Upper and Middle Susitna Basin Study Plan Section 11.5
 (FERC No. 14241) Vegetation and Wildlife Habitat Mapping Study in the Upper and Middle Susitna Basin Study Plan Section 11.5 Initial Study Report Part C: Executive Summary and Section 7 Prepared for Prepared
Great Lakes Basin Riparian Opportunity Assessment. March 31, Amy K. Conley, Timothy G. Howard, and Erin L. White
 [Grab your reader s attention with a great quote from the document or use this space to emphasize a key point. To place this tex anywhere on the page, just drag it.] Great Lakes Basin Riparian Opportunity
APPENDIX PHASE 1 GREEN INFRASTRUCTURE FRAMEWORK
 APPENDIX PHASE 1 GREEN INFRASTRUCTURE FRAMEWORK KANSAS MISSOURI CONTENTS A DATA WISHLIST 4 B PRECEDENTS 7 C WORKSHOP MATERIALS 13 D ANALYSIS PROCESS 124 E ATLAS & PLAYBOOK DETAILS 156 F POLICY ANALYSIS
Potential Restorable Wetlands (PRWs):
:") ASWM Webinar Sept. 17, 2014 Potential Restorable Wetlands (PRWs): Working definition: wetland hydrology and soils minus presently mapped wetlands for the re-establishment of wetlands Hydric Soil Query
ASWM Webinar Sept. 17, 2014 Potential Restorable Wetlands (PRWs): Working definition: wetland hydrology and soils minus presently mapped wetlands for the re-establishment of wetlands Hydric Soil Query
Fluvial Erosion Impacts on Infrastructure Along Indiana Rivers and Streams
 Fluvial Erosion Impacts on Infrastructure Along Indiana Rivers and Streams Siavash Beik, Robert Barr, Brian Meunier 2017 Purdue Road School March 6-9, 2017 In June 2008, flooding damaged or destroyed
HOUSEKEEPING. Notes. Upcoming meetings related to connectivity: FTP site? Zotero
 HOUSEKEEPING Notes Upcoming meetings related to connectivity: FTP site? Zotero NJ Land Conservation Rally March 9, 2013; NJIT in Newark, NJ One-day educational conference about preserving New Jersey s
Data Collection and GIS Applications
 Data Collection and GIS Applications Governor s s Conference on the Management of the Illinois River System Jeff Jack of all Trades Boeckler, IDNR Introduction Collecting available GIS data sets Creating
GIS-Based Sediment Quality Database for the St. Louis River Area of Concern (AOC): Overview Presentations and Demonstration
: Overview Presentations and Demonstration") GIS-Based Sediment Quality Database for the St. Louis River Area of Concern (AOC): Overview Presentations and Demonstration Judy L. Crane 1 and Dawn E. Smorong 2 1 Minnesota Pollution Control Agency, St.
GIS-Based Sediment Quality Database for the St. Louis River Area of Concern (AOC): Overview Presentations and Demonstration Judy L. Crane 1 and Dawn E. Smorong 2 1 Minnesota Pollution Control Agency, St.
Wetland Mapping & Functional Assessment Canadian River Watershed New Mexico. Association of State Wetland Managers
 Wetland Mapping & Functional Assessment Canadian River Watershed New Mexico Association of State Wetland Managers November, 2012 Approach for this project based on: EPA 2006 Document: Application of Elements
Chris Lenhart, John Nieber, Ann Lewandowski, Jason Ulrich TOOLS AND STRATEGIES FOR REDUCING CHANNEL EROSION IN MINNESOTA
 Chris Lenhart, John Nieber, Ann Lewandowski, Jason Ulrich TOOLS AND STRATEGIES FOR REDUCING CHANNEL EROSION IN MINNESOTA Background and approach Channel loading major source of sediment in much of MN River
Native species (Forbes and Graminoids) Less than 5% woody plant species. Inclusions of vernal pools. High plant diversity
 Less than 5% woody plant species. Inclusions of vernal pools. High plant diversity") WILLAMETTE VALLEY WET-PRAIRIE RESTORATION MODEL WHAT IS A WILLAMETTE VALLEY WET-PRAIRIE Hot Spot s Native species (Forbes and Graminoids) Rare plant species Less than 5% woody plant species Often dominated
WILLAMETTE VALLEY WET-PRAIRIE RESTORATION MODEL WHAT IS A WILLAMETTE VALLEY WET-PRAIRIE Hot Spot s Native species (Forbes and Graminoids) Rare plant species Less than 5% woody plant species Often dominated
Mobrand to Jones and Stokes. Sustainable Fisheries Management Use of EDT
 Sustainable Fisheries Management Use of EDT Ecosystem Diagnosis and Treatment EDT EDT designed to provide a practical, science-based approach for developing and implementing watershed plans. Provides decision
Stream Simulation: A Simple Example
 Stream Simulation: A Simple Example North Thompson Creek, CO Paul T. Anderson U.S.D.A. Forest Service Here s How We Started May 2011 2-1 USDA-Forest Service Here s How We Finished Forest Service Aquatic
Fish Passage and Abundance around Grade Control Structures on Incised Streams in Western Iowa
 Fish Passage and Abundance around Grade Control Structures on Incised Streams in Western Iowa John Thomas Hungry Canyons Alliance Mary Culler Iowa State University / Missouri DNR Dimitri Dermisis IIHR
BASIS FOR RIVER RESTORATION PROJECT
 The FLUVIO FCT-Doctoral Program Hydromorphological and Habitat Restoration Course Diego García de Jalón and Marta González del Tánago, UPM Madrid BASIS FOR RIVER RESTORATION PROJECT Throughout the course,
Watershed Assessment of River Stability and Sediment Supply: Advancing the Science of Watershed Analysis
 Watershed Assessment of River Stability and Sediment Supply: Advancing the Science of Watershed Analysis 2009 MWEA Annual Conference Rob Myllyoja, CET rmyllyoja@hrc-engr.com Watershed Assessment of River
California Urban and Biodiversity Analysis (CURBA) Model
 Model") California Urban and Biodiversity Analysis (CURBA) Model Presentation Overview Model Overview Urban Growth Model Policy Simulation and Evaluation Model Habitat Fragmentation Analysis Case Study: Santa
California Urban and Biodiversity Analysis (CURBA) Model Presentation Overview Model Overview Urban Growth Model Policy Simulation and Evaluation Model Habitat Fragmentation Analysis Case Study: Santa
Nutrient and Sediment Cycling and Retention in Urban Floodplain Wetlands
 Nutrient and Sediment Cycling and Retention in Urban Floodplain Wetlands Greg Noe, Cliff Hupp, Nancy Rybicki, Ed Schenk, and Jackie Batson National Research Program, Reston VA U.S. Department of the Interior
Courtesy of Tomi Petr
 Lake Dal, rich in submerged aquatic plants, is threatened by pollution, Kashmir, India Lakes, reservoirs, rivers and streams are important habitats for inland fisheries, but they are threatened by human
RANGE AND ANIMAL SCIENCES AND RESOURCES MANAGEMENT - Vol. II - Catchment Management A Framework for Managing Rangelands - Hugh Milner
 CATCHMENT MANAGEMENT A FRAMEWORK FOR MANAGING RANGELANDS Hugh Milner International Water Management Consultant, Australia Keywords: Rangeland management; catchments and watersheds; catchment management
Development of Improved Stream Mapping for NC
 Development of Improved Stream Mapping for NC Presentation for Soil Science Society of North Carolina NC Division of Water Quality January 21, 2009 What are stream maps used for? Riparian buffer rules
Keanahalululu Gulch, Hawaiÿi
 DAR Watershed Code: 85021 WATERSHED FEATURES Keanahalululu Gulch watershed occurs on the island of Hawaiÿi. The Hawaiian meaning of the name is unknown. The area of the watershed is 4.1 square mi (10.6
Data sources and classification for ecosystem accounting g
 Data sources and classification for ecosystem accounting Ken Bagstad 23 February 2015 Wealth Accounting and the Valuation of Ecosystem Services www.wavespartnership.org Data sources and classification
Introduction Fluvial Processes in Small Southeastern Watersheds
 Introduction Fluvial Processes in Small Southeastern Watersheds L. Allan James Scott A. Lecce Lisa Davis Southeastern Geographer, Volume 50, Number 4, Winter 2010, pp. 393-396 (Article) Published by The
MISSOURI LiDAR Stakeholders Meeting
 MISSOURI LiDAR Stakeholders Meeting East-West Gateway June 18, 2010 Tim Haithcoat Missouri GIO Enhanced Elevation Data What s different about it? Business requirements are changing.fast New data collection
Opportunities to Improve Ecological Functions of Floodplains and Reduce Flood Risk along Major Rivers in the Puget Sound Basin
 Opportunities to Improve Ecological Functions of Floodplains and Reduce Flood Risk along Major Rivers in the Puget Sound Basin Christopher Konrad, US Geological Survey Tim Beechie, NOAA Fisheries Managing
Wetland and Riparian Mapping: An Overview of the Montana Program
 Wetland and Riparian Mapping: An Overview of the Montana Program Meghan Burns, Catherine McIntyre, Karen Newlon Ecology Program Montana Natural Heritage Program Helena, MT Montana Natural Heritage Program
Defining the Limit of Regulated Areas. C.1 Defining the River or Stream Flood Hazard 138. C.2 Defining the River or Stream Erosion Hazard 139
 C.1 Defining the River or Stream Flood Hazard 138 C.2 Defining the River or Stream Erosion Hazard 139 C.3 Defining Watercourses 141 C.4 Defining the Lake Ontario Shoreline Flood, Erosion and Dynamic Beach
Squaw Creek. General Information
 General Information is a tributary to the Salmon River. It enters the north side of the river about 0 miles downstream of North Fork, Idaho. The study reach is about a 30 ft length of stream about 2 miles
Chapter 6. Fundamentals of GIS-Based Data Analysis for Decision Support. Table 6.1. Spatial Data Transformations by Geospatial Data Types
 Chapter 6 Fundamentals of GIS-Based Data Analysis for Decision Support FROM: Points Lines Polygons Fields Table 6.1. Spatial Data Transformations by Geospatial Data Types TO: Points Lines Polygons Fields
Upper Truckee River Restoration Lake Tahoe, California Presented by Brendan Belby Sacramento, California
 Upper Truckee River Restoration Lake Tahoe, California Presented by Brendan Belby Sacramento, California Mike Rudd (Project Manager), Charley Miller & Chad Krofta Declines in Tahoe s Water Clarity The
1) NetMap Overview. 2) Habitat modeling HIP & Beyond. 3) What do you do with habitat models? 4) NetMap a platform for regional analysis & interactions
 NetMap Overview. 2) Habitat modeling HIP & Beyond. 3) What do you do with habitat models? 4) NetMap a platform for regional analysis & interactions") 1) NetMap Overview 2) Habitat modeling HIP & Beyond 3) What do you do with habitat models? 4) NetMap a platform for regional analysis & interactions Overview Multiple analysis tools Creates universal stream/hillslope
1) NetMap Overview 2) Habitat modeling HIP & Beyond 3) What do you do with habitat models? 4) NetMap a platform for regional analysis & interactions Overview Multiple analysis tools Creates universal stream/hillslope
Island Design. UMRS EMP Regional Workshop. Presentation for the
 Island Design Presentation for the UMRS EMP Regional Workshop by Jon Hendrickson Hydraulic Engineer Regional Technical Specialist, Water Quality and Habitat Restoration August 17 19, 2005 Project Delivery
BUREAU OF CLEAN WATER. Appendix C Biological Field Methods C1. Habitat Assessment DECEMBER 2013
 BUREAU OF CLEAN WATER Appendix C Biological Field Methods C1. Assessment DECEMBER 2013 HABITAT ASSESSMENT The Department has adopted the habitat assessment methods outlined in EPA s Rapid Bioassessment
Chapter 3 - White Oak River Subbasin Includes Bogue Sound and the Newport River
 Chapter 3 - White Oak River Subbasin 03-05-03 Includes Bogue Sound and the Newport River 3.1 Water Quality Overview Subbasin 03-05-03 at a Glance Land and Water Area (sq. mi.) Total area: 228 Land area:
Preliminary Calculation of Landscape Integrity in West Virginia Based on Distance from Weighted Disturbances
 Preliminary Calculation of Landscape Integrity in West Virginia Based on Distance from Weighted Disturbances Michael Dougherty and Elizabeth Byers Technical Support and Wildlife Diversity Units, Wildlife
Environmental Laboratory. Using a Multi-Scale Assessment of Watershed Integrity (MAWI) Approach for Establishing Baseline Conditions in Watersheds
 Approach for Establishing Baseline Conditions in Watersheds") ERDC/EL TR-08-14 System-Wide Water Resources Program (SWWRP) Using a Multi-Scale Assessment of Watershed Integrity (MAWI) Approach for Establishing Baseline Conditions in Watersheds Jeff P. Lin, Ronald
ERDC/EL TR-08-14 System-Wide Water Resources Program (SWWRP) Using a Multi-Scale Assessment of Watershed Integrity (MAWI) Approach for Establishing Baseline Conditions in Watersheds Jeff P. Lin, Ronald
1.1 What is Site Fingerprinting?
 Site Fingerprinting Utilizing GIS/GPS Technology 1.1 What is Site Fingerprinting? Site fingerprinting is a planning tool used to design communities where protection of natural resources is the primary
Southwest LRT Habitat Analysis. May 2016 Southwest LRT Project Technical Report
 Southwest LRT Habitat Analysis Southwest LRT Project Technical Report This page intentionally blank. Executive Summary This technical report describes the habitat analysis that was performed to support
SEDIMENT BENEFICIAL USE SUPPORT ASSESSMENT FOR OTTER CREEK
 SEDIMENT BENEFICIAL USE SUPPORT ASSESSMENT FOR OTTER CREEK Addresses Otter Creek Assessment Unit MT42C002_020 Prepared by: Kristy Fortman November 15, 2013 1 1.0 INTRODUCTION In the spring of 2013, the
WEBINAR AGENDA. Review of connectivity mapping progress to date. Describe draft methodology for delineating and validating core areas
 WEBINAR AGENDA Review of connectivity mapping progress to date Describe draft methodology for delineating and validating core areas Review examples of the methodology implemented in the Highlands Explain
Data Dictionary for Network of Conservation Areas Transcription Reports from the Colorado Natural Heritage Program
 Data Dictionary for Network of Conservation Areas Transcription Reports from the Colorado Natural Heritage Program This Data Dictionary defines terms used in Network of Conservation Areas (NCA) Reports
Hennepin GIS. Tree Planting Priority Areas - Analysis Methodology. GIS Services April 2018 GOAL:
 Hennepin GIS GIS Services April 2018 Tree Planting Priority Areas - Analysis Methodology GOAL: To create a GIS data layer that will aid Hennepin County Environment & Energy staff in determining where to
Stephanie J. Connolly Forest Soil Scientist
 Stephanie J. Connolly Forest Soil Scientist Approximately 1 million acres High elevation Steep slopes Rain shadow effect Hydrologically shallow soils Sedimentary geology Acidic environments Biodiversity
Development of Riparian Maps for Sonoma County Long Term Riparian Corridor Conservation. Mark Tukman & Dylan Loudon Tukman Geospatial
 L A N D F O R Development of Riparian Maps for Sonoma County Long Term Riparian Corridor Conservation Mark Tukman & Dylan Loudon Tukman Geospatial L I F E Mark Background on functional riparian mapping
The River Restoration Centre therrc.co.uk. Understanding Fluvial Processes: supporting River Restoration. Dr Jenny Mant
 The River Restoration Centre therrc.co.uk Understanding Fluvial Processes: supporting River Restoration Dr Jenny Mant Jenny@therrc.co.uk Understanding your catchment Hydrology Energy associated with the
Limitation to qualitative stability indicators. the real world is a continuum, not a dichotomy ~ 100 % 30 % ~ 100 % ~ 40 %
 Stream Stability Assessment & BEHI Surveys Joe Rathbun MDEQ Water Resources Division rathbunj@michigan.gov 517--373 517 373--8868 Stability Stream can transport its water and sediment inputs without changing
Data Dictionary Hudson River Features: Estuary shoreline Flood scenario Emergency Services: Police stations Fire stations EMS
 Data Dictionary Hudson River Features: Estuary shoreline This data layer represents the border of the Hudson River in our study area. New York State Department of Environmental Conservation. 2009. Hudson
Figure 0-18: Dendrogeomorphic analysis of streambank erosion and floodplain deposition (from Noe and others, 2015a)
") Appendix 9A: Stream to River During the development of the Phase 6 Watershed Model, multiple methods for determining coefficients were often attempted. In some cases, the methods are averaged or otherwise
Appendix 9A: Stream to River During the development of the Phase 6 Watershed Model, multiple methods for determining coefficients were often attempted. In some cases, the methods are averaged or otherwise
Elevation (ft) Slope ( ) County CONDITION CATEGORY. Parameter Natural Condition Slightly impacted Moderately Impacted Heavily Impacted
 Slope ( ) County CONDITION CATEGORY. Parameter Natural Condition Slightly impacted Moderately Impacted Heavily Impacted") Version: 8/25/14 Meadow Name Date : / / MM DD YYYY GPS Location:. N. W GPS Datum (e.g., WGS 84, NAD 27) Elevation (ft) Slope ( ) County Watershed (HUC8) Landowner USGS Quad Name Observers: 7.5 or 15 (circle
Version: 8/25/14 Meadow Name Date : / / MM DD YYYY GPS Location:. N. W GPS Datum (e.g., WGS 84, NAD 27) Elevation (ft) Slope ( ) County Watershed (HUC8) Landowner USGS Quad Name Observers: 7.5 or 15 (circle
Implementing a Project with 319 Funds: The Spring Brook Meander Project. Leslie A. Berns
 Implementing a Project with 319 Funds: The Spring Brook Meander Project Leslie A. Berns "...to acquire... and hold lands... for the purpose of protecting and preserving the flora, fauna and scenic beauties...
River Restoration and Rehabilitation. Pierre Y. Julien
 River Restoration and Rehabilitation Pierre Y. Julien Department of Civil and Environmental Engineering Colorado State University Fort Collins, Colorado River Mechanics and Sediment Transport Lima Peru
Reference status and WFD assessment of river macrophytes in Flanders (Belgium)
") Reference status and WFD assessment of river macrophytes in Flanders (Belgium) Luc Denys, Anik Schneiders Research Institute for Nature and Forest A reference is what we can only imagine The ecological
Reference status and WFD assessment of river macrophytes in Flanders (Belgium) Luc Denys, Anik Schneiders Research Institute for Nature and Forest A reference is what we can only imagine The ecological
Gully Erosion Part 1 GULLY EROSION AND ITS CAUSES. Introduction. The mechanics of gully erosion
 Gully Erosion Part 1 GULLY EROSION AND ITS CAUSES Gully erosion A complex of processes whereby the removal of soil is characterised by incised channels in the landscape. NSW Soil Conservation Service,