Lecture 2. Estimating Single Population Parameters 8-1
|
|
|
- Godfrey Elliott
- 5 years ago
- Views:
Transcription
1 Lecture 2 Estimating Single Population Parameters 8-1
2 8.1 Point and Confidence Interval Estimates for a Population Mean Point Estimate A single statistic, determined from a sample, that is used to estimate the corresponding population parameter Sampling Error The difference between a measure (a statistic) computed from a sample and the corresponding measure (a parameter) computed from the population 8-2
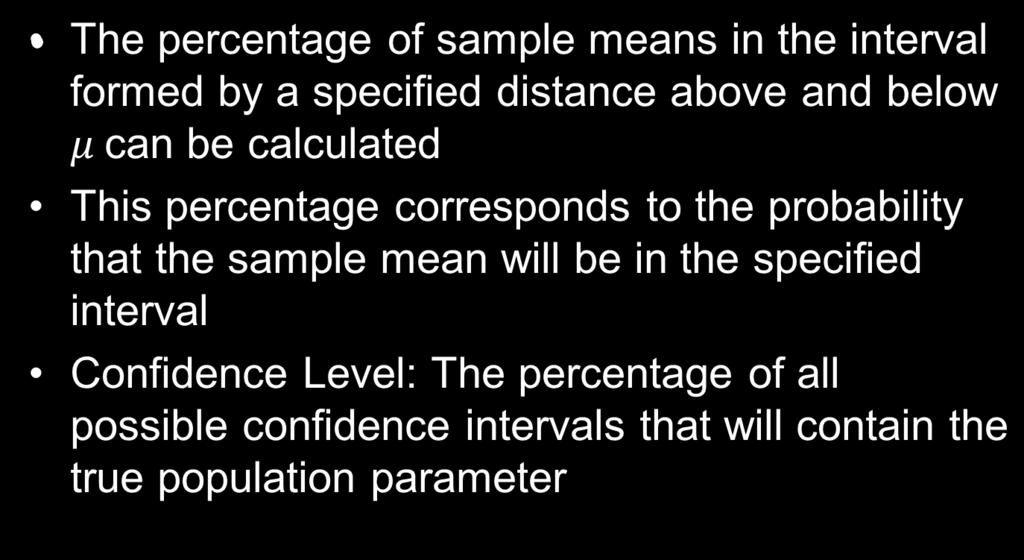
3 Confidence Interval An interval developed from sample values such that if all possible intervals of a given width were constructed, a percentage of these intervals, known as the confidence level, would include the true population parameter Lower Confidence Limit Point Estimate Upper Confidence Limit 8-3

4 Point Estimates Population parameter can be estimated with sample statistic (point estimate) 8-4
5 8-5

6 Standard Error A value that measures the spread of the sample means around the population mean The standard error is reduced when the sample size is increased 8-6
7 Confidence Level 8-7


8 Critical Value 8-8

(standard")
9 Confidence Interval Calculation Point estimate ± (Critical value)(standard error) 8-9
10 Critical Values for Confidence Levels Confidence Level Critical Value 80% Z = % Z = % Z = % Z = Critical values can be found using the standard normal table, or using Excel s NORM.S.INV function 8-10
11 Step 1: Define the population of interest and select a simple random sample of size n Step 2: Specify the confidence level Step 3: Compute the sample mean Step 4: Determine the standard error of the sampling distribution Step 5: Determine the critical value, z, from the standard normal table. Step 6: Compute the confidence interval estimate 8-11

12 Margin of Error A measure of how close we expect the point estimate to be to the population parameter with the specified level of confidence Lowering the confidence level is one way to reduce the margin of error The margin of error can be reduced by increasing the sample size. 8-12

13 Impact of Changing the Confidence Level - Example 99% 90% ± ±
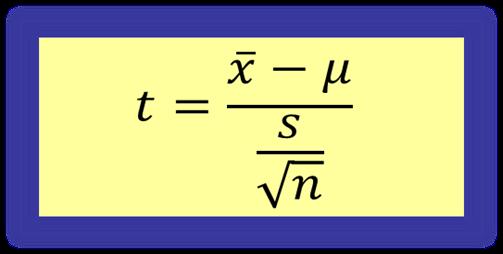
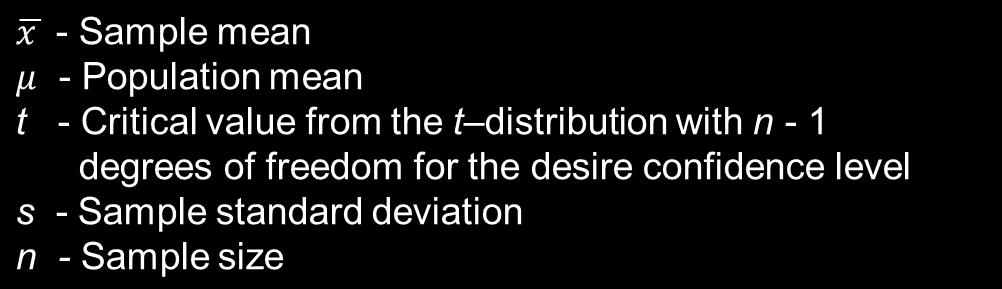
14 In most cases, if the population mean is unknown, the population standard deviation is unknown too This introduces extra uncertainty, since sample standard deviation varies from sample to sample Confidence interval estimation process needs to be modified 8-14

15 Student s t-distribution 8-15
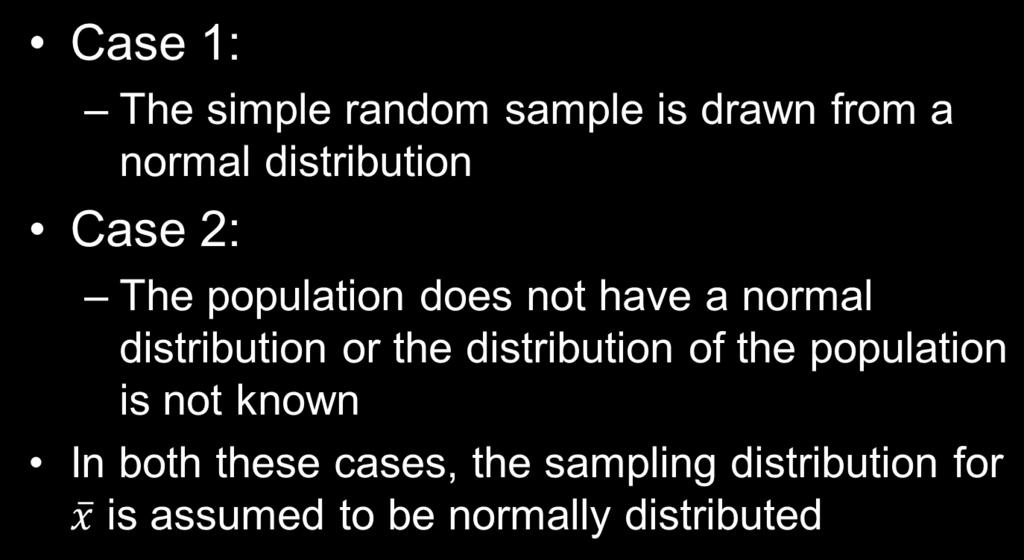
16 Student s t-distribution The t-distribution is based on the assumption that the population is normally distributed 8-16
17 Degrees of Freedom The number of independent data values available to estimate the population s standard deviation. If k parameters must be estimated before the population s standard deviation can be calculated from a sample of size n, the degrees of freedom are equal to n k For example: The sample mean is obtained from a sample of n randomly and independently chosen data values Once the sample mean has been obtained, there are only n - 1 independent pieces of data information left in the sample 8-17
18 Degrees of Freedom - Example Suppose that sample size n = 3 and sample mean is 12 It implies that the sum of the data values is 36 If x1 = 10 and x2 = 9 than x3 should be 17 You are free to choose any two of the three data values before the remaining data value should be estimated (k = 1) Degrees of freedom = 3 1 =


19 Degrees of Freedom and t-distribution t-distribution with d.f. = 13 t-distribution with d.f. = 5 0 t 8-19


20 8-20
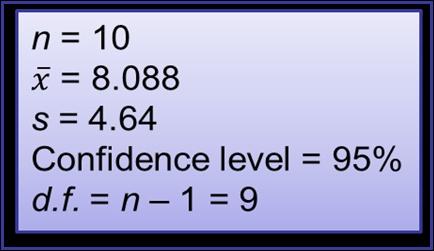
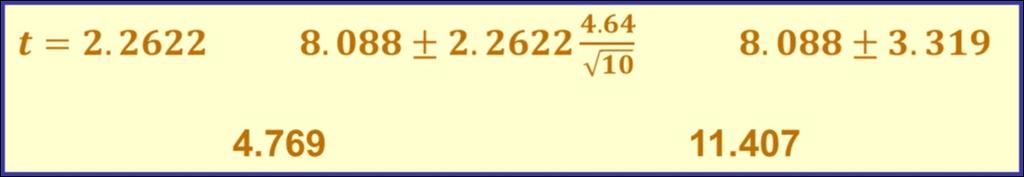
21 t-distribution Table Example 8-21

22 How to Do It in Excel? 1. Open file. 2. Select Data tab. 3. Select Data Analysis > Descriptive Statistics category. 4. Specify data range. 5. Define Output Location. 6. Check Summary Statistics. 7. Check Confidence Level for Mean: 95%. 8. Click OK. 8-22
23 8.2 Determining the Required Sample Size There are three conflicting objectives: High confidence level, a low margin of error, a small sample size: For a given sample size, a high confidence level will tend to generate a large margin of error For a given confidence level, a small sample size will result in an increased margin of error Reducing the margin of error requires either reducing the confidence level or increasing the sample size, or both 8-23
 4.Sample size =?")
24 z - Critical value for the specified confidence level e - Desired margin of error s - Population standard deviation Example: Solution: 1.Population mean should not exceed 30 2.Population standard deviation is Confidence level is 95% (z = 1.96) 4.Sample size =? 8-24
25 Step 1: Specify the desired margin of error Step 2: Determine the population standard deviation Step 3: Determine the critical value for the desired level of confidence Step 4: Compute the required sample size 8-25


26 8-26

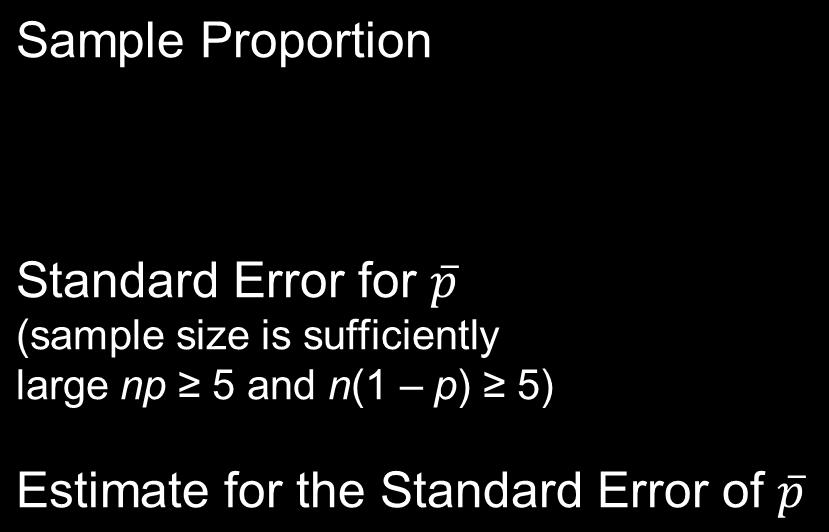
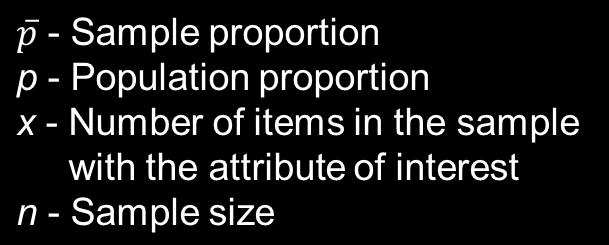
27 8.3 Estimating a Population Proportion 8-27

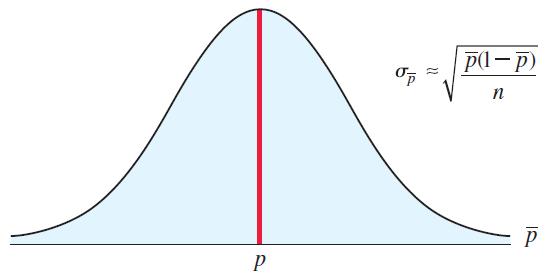

28 8-28
29 Step 1: Define the population and variable of interest for which to estimate the population proportion Step 2: Determine the sample size and select a random sample that must be large enough Step 3: Specify the level of confidence and obtain the critical value from the standard normal distribution table Step 4: Calculate the sample proportion Step 5: Construct the interval estimate 8-29


30 A random sample of 100 people shows that 25 are left-handed. Define a 95% confidence interval for the true proportion of left-handers Sample proportion z-value for 95% confidence level Confidence interval 8-30
31 Required Sample Size Changing the confidence level affects the interval width Changing the sample size will affect the interval width An increase in sample size will reduce the standard error and reduce the interval width A decrease in the sample size will have the opposite effect 8-31
32 Required Sample Size p - Population proportion z - Critical value from standard normal distribution for the desired confidence level n - Sample size 8-32

33 Sample Size Determination 8-33
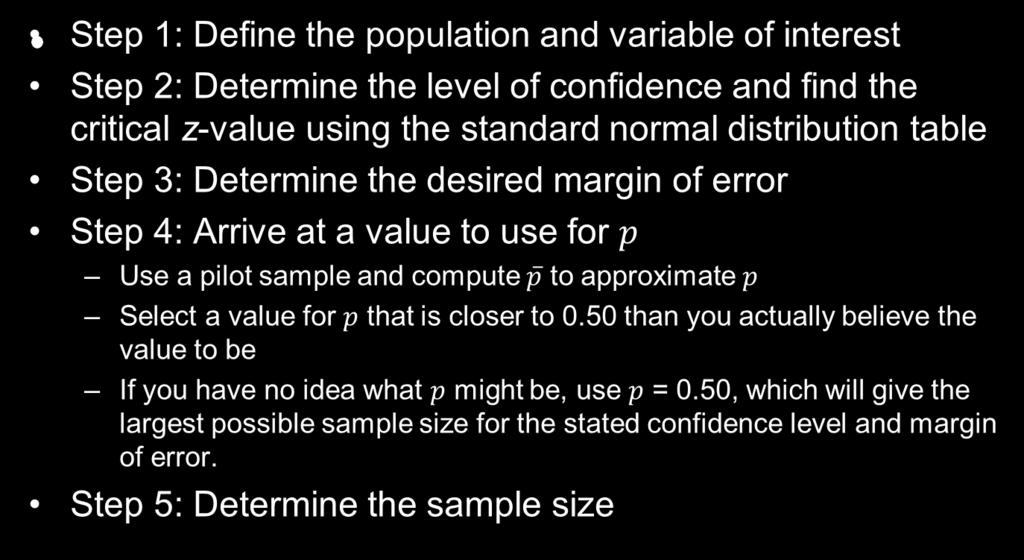
34 Sample Size Determination Example How large a sample would be necessary to estimate the true proportion defective in a large population within 3%, with 95% confidence? (Assume a pilot sample yields p = 0.12) Sample size 8-34
Statistics for Managers Using Microsoft Excel 7 th Edition
 Statistics for Managers Using Microsoft Excel 7 th Edition Chapter 8 Confidence Interval Estimation Statistics for Managers Using Microsoft Excel 7e Copyright 2014 Pearson Education, Inc. Chap 8-1 Learning
Chapter 5 Confidence Intervals
 Chapter 5 Confidence Intervals Confidence Intervals about a Population Mean, σ, Known Abbas Motamedi Tennessee Tech University A point estimate: a single number, calculated from a set of data, that is
MBA 605, Business Analytics Donald D. Conant, Ph.D. Master of Business Administration
 t-distribution Summary MBA 605, Business Analytics Donald D. Conant, Ph.D. Types of t-tests There are several types of t-test. In this course we discuss three. The single-sample t-test The two-sample t-test
Chapter 23. Inferences About Means. Monday, May 6, 13. Copyright 2009 Pearson Education, Inc.
 Chapter 23 Inferences About Means Sampling Distributions of Means Now that we know how to create confidence intervals and test hypotheses about proportions, we do the same for means. Just as we did before,
Percentage point z /2
 Chapter 8: Statistical Intervals Why? point estimate is not reliable under resampling. Interval Estimates: Bounds that represent an interval of plausible values for a parameter There are three types of
Understanding Inference: Confidence Intervals I. Questions about the Assignment. The Big Picture. Statistic vs. Parameter. Statistic vs.
 Questions about the Assignment If your answer is wrong, but you show your work you can get more partial credit. Understanding Inference: Confidence Intervals I parameter versus sample statistic Uncertainty
Factorial Independent Samples ANOVA
 Factorial Independent Samples ANOVA Liljenquist, Zhong and Galinsky (2010) found that people were more charitable when they were in a clean smelling room than in a neutral smelling room. Based on that
Hypothesis Tests and Estimation for Population Variances. Copyright 2014 Pearson Education, Inc.
 Hypothesis Tests and Estimation for Population Variances 11-1 Learning Outcomes Outcome 1. Formulate and carry out hypothesis tests for a single population variance. Outcome 2. Develop and interpret confidence
Lecture 26: Chapter 10, Section 2 Inference for Quantitative Variable Confidence Interval with t
 Lecture 26: Chapter 10, Section 2 Inference for Quantitative Variable Confidence Interval with t t Confidence Interval for Population Mean Comparing z and t Confidence Intervals When neither z nor t Applies
10.2: The Chi Square Test for Goodness of Fit
 10.2: The Chi Square Test for Goodness of Fit We can perform a hypothesis test to determine whether the distribution of a single categorical variable is following a proposed distribution. We call this
Chapter 9 Inferences from Two Samples
 Chapter 9 Inferences from Two Samples 9-1 Review and Preview 9-2 Two Proportions 9-3 Two Means: Independent Samples 9-4 Two Dependent Samples (Matched Pairs) 9-5 Two Variances or Standard Deviations Review
QUIZ 4 (CHAPTER 7) - SOLUTIONS MATH 119 SPRING 2013 KUNIYUKI 105 POINTS TOTAL, BUT 100 POINTS = 100%
 - SOLUTIONS MATH 119 SPRING 2013 KUNIYUKI 105 POINTS TOTAL, BUT 100 POINTS = 100%") QUIZ 4 (CHAPTER 7) - SOLUTIONS MATH 119 SPRING 013 KUNIYUKI 105 POINTS TOTAL, BUT 100 POINTS = 100% 1) We want to conduct a study to estimate the mean I.Q. of a pop singer s fans. We want to have 96% confidence
QUIZ 4 (CHAPTER 7) - SOLUTIONS MATH 119 SPRING 013 KUNIYUKI 105 POINTS TOTAL, BUT 100 POINTS = 100% 1) We want to conduct a study to estimate the mean I.Q. of a pop singer s fans. We want to have 96% confidence
Section 9 2B:!! Using Confidence Intervals to Estimate the Difference ( µ 1 µ 2 ) in Two Population Means using Two Independent Samples.
 in Two Population Means using Two Independent Samples.") Section 9 2B:!! Using Confidence Intervals to Estimate the Difference ( µ 1 µ 2 ) in Two Population Means using Two Independent Samples Requirements 1.A random sample of each population is taken. The sample
Section 9 2B:!! Using Confidence Intervals to Estimate the Difference ( µ 1 µ 2 ) in Two Population Means using Two Independent Samples Requirements 1.A random sample of each population is taken. The sample
HYPOTHESIS TESTING. Hypothesis Testing
 MBA 605 Business Analytics Don Conant, PhD. HYPOTHESIS TESTING Hypothesis testing involves making inferences about the nature of the population on the basis of observations of a sample drawn from the population.
Data analysis and Geostatistics - lecture VI
 Data analysis and Geostatistics - lecture VI Statistical testing with population distributions Statistical testing - the steps 1. Define a hypothesis to test in statistics only a hypothesis rejection is
Estimating a Population Mean
 Estimating a Population Mean MATH 130, Elements of Statistics I J. Robert Buchanan Department of Mathematics Fall 2017 Objectives At the end of this lesson we will be able to: obtain a point estimate for
EXPERIMENT 30A1: MEASUREMENTS. Learning Outcomes. Introduction. Experimental Value - True Value. 100 True Value
 1 Learning Outcomes EXPERIMENT 30A1: MEASUREMENTS Upon completion of this lab, the student will be able to: 1) Use various common laboratory measurement tools such as graduated cylinders, volumetric flask,
Independent Samples ANOVA
 Independent Samples ANOVA In this example students were randomly assigned to one of three mnemonics (techniques for improving memory) rehearsal (the control group; simply repeat the words), visual imagery
Chapter Eight: Assessment of Relationships 1/42
 Chapter Eight: Assessment of Relationships 1/42 8.1 Introduction 2/42 Background This chapter deals, primarily, with two topics. The Pearson product-moment correlation coefficient. The chi-square test
2011 Pearson Education, Inc
 Statistics for Business and Economics Chapter 7 Inferences Based on Two Samples: Confidence Intervals & Tests of Hypotheses Content 1. Identifying the Target Parameter 2. Comparing Two Population Means:
Stat 529 (Winter 2011) Experimental Design for the Two-Sample Problem. Motivation: Designing a new silver coins experiment
 Experimental Design for the Two-Sample Problem. Motivation: Designing a new silver coins experiment") Stat 529 (Winter 2011) Experimental Design for the Two-Sample Problem Reading: 2.4 2.6. Motivation: Designing a new silver coins experiment Sample size calculations Margin of error for the pooled two sample
Stat 529 (Winter 2011) Experimental Design for the Two-Sample Problem Reading: 2.4 2.6. Motivation: Designing a new silver coins experiment Sample size calculations Margin of error for the pooled two sample
Survey of Smoking Behavior. Survey of Smoking Behavior. Survey of Smoking Behavior
 Sample HH from Frame HH One-Stage Cluster Survey Population Frame Sample Elements N =, N =, n = population smokes Sample HH from Frame HH Elementary units are different from sampling units Sampled HH but
Hotelling s One- Sample T2
 Chapter 405 Hotelling s One- Sample T2 Introduction The one-sample Hotelling s T2 is the multivariate extension of the common one-sample or paired Student s t-test. In a one-sample t-test, the mean response
Lecture 22/Chapter 19 Part 4. Statistical Inference Ch. 19 Diversity of Sample Proportions
 Lecture 22/Chapter 19 Part 4. Statistical Inference Ch. 19 Diversity of Sample Proportions Probability versus Inference Behavior of Sample Proportions: Example Behavior of Sample Proportions: Conditions
Slides by. John Loucks. St. Edward s University. Slide South-Western, a part of Cengage Learning
 Slides by John Loucks St. Edward s University Slide 1 Chapter 10 Comparisons Involving Means Part A Inferences About the Difference Between Two Population Means: s 1 and s 2 Known Inferences About the
The independent-means t-test:
 The independent-means t-test: Answers the question: is there a "real" difference between the two conditions in my experiment? Or is the difference due to chance? Previous lecture: (a) Dependent-means t-test:
Six Sigma Black Belt Study Guides
 Six Sigma Black Belt Study Guides 1 www.pmtutor.org Powered by POeT Solvers Limited. Analyze Correlation and Regression Analysis 2 www.pmtutor.org Powered by POeT Solvers Limited. Variables and relationships
FOR 373: Forest Sampling Methods. Simple Random Sampling: What is it. Simple Random Sampling: What is it
 FOR 373: Forest Sampling Methods Simple Random Sampling What is it? How to do it? Why do we use it? Determining Sample Size Readings: Elzinga Chapter 7 Simple Random Sampling: What is it In simple random
Two-sample inference: Continuous data
 Two-sample inference: Continuous data Patrick Breheny April 6 Patrick Breheny University of Iowa to Biostatistics (BIOS 4120) 1 / 36 Our next several lectures will deal with two-sample inference for continuous
Single Sample Means. SOCY601 Alan Neustadtl
 Single Sample Means SOCY601 Alan Neustadtl The Central Limit Theorem If we have a population measured by a variable with a mean µ and a standard deviation σ, and if all possible random samples of size
1 Descriptive statistics. 2 Scores and probability distributions. 3 Hypothesis testing and one-sample t-test. 4 More on t-tests
 Overall Overview INFOWO Statistics lecture S3: Hypothesis testing Peter de Waal Department of Information and Computing Sciences Faculty of Science, Universiteit Utrecht 1 Descriptive statistics 2 Scores
Statistics Part I Introduction. Joe Nahas University of Notre Dame
 Statistics Part I Introduction Joe Nahas University of Notre Dame A Very Simple Example: A Pair of Die A pair of six sided die Values for each die: 1, 2, 3, 4, 5, 6. Values for the pair: 2, 3, 4, 5, 6,
Statistics for Managers Using Microsoft Excel
 Statistics for Managers Using Microsoft Excel 7 th Edition Chapter 1 Chi-Square Tests and Nonparametric Tests Statistics for Managers Using Microsoft Excel 7e Copyright 014 Pearson Education, Inc. Chap
LAB 5 INSTRUCTIONS LINEAR REGRESSION AND CORRELATION
 LAB 5 INSTRUCTIONS LINEAR REGRESSION AND CORRELATION In this lab you will learn how to use Excel to display the relationship between two quantitative variables, measure the strength and direction of the
 Intro to Confidence Intervals: A estimate is a single statistic based on sample data to estimate a population parameter Simplest approach But not always very precise due to variation in the sampling distribution
How to Run the Analysis: To run a principal components factor analysis, from the menus choose: Analyze Dimension Reduction Factor...
 The principal components method of extraction begins by finding a linear combination of variables that accounts for as much variation in the original variables as possible. This method is most often used
Using SPSS for One Way Analysis of Variance
 Using SPSS for One Way Analysis of Variance This tutorial will show you how to use SPSS version 12 to perform a one-way, between- subjects analysis of variance and related post-hoc tests. This tutorial
Chapter 1 - Lecture 3 Measures of Location
 Chapter 1 - Lecture 3 of Location August 31st, 2009 Chapter 1 - Lecture 3 of Location General Types of measures Median Skewness Chapter 1 - Lecture 3 of Location Outline General Types of measures What
Lecture Slides. Elementary Statistics Tenth Edition. by Mario F. Triola. and the Triola Statistics Series
 Lecture Slides Elementary Statistics Tenth Edition and the Triola Statistics Series by Mario F. Triola Slide 1 Chapter 7 Estimates and Sample Sizes 7-1 Overview 7-2 Estimating a Population Proportion 7-3
I used college textbooks because they were the only resource available to evaluate measurement uncertainty calculations.
 Introduction to Statistics By Rick Hogan Estimating uncertainty in measurement requires a good understanding of Statistics and statistical analysis. While there are many free statistics resources online,
Comparing Means from Two-Sample
 Comparing Means from Two-Sample Kwonsang Lee University of Pennsylvania kwonlee@wharton.upenn.edu April 3, 2015 Kwonsang Lee STAT111 April 3, 2015 1 / 22 Inference from One-Sample We have two options to
REPEATED TRIALS. p(e 1 ) p(e 2 )... p(e k )
 p(e 2 )... p(e k )") REPEATED TRIALS We first note a basic fact about probability and counting. Suppose E 1 and E 2 are independent events. For example, you could think of E 1 as the event of tossing two dice and getting a
REPEATED TRIALS We first note a basic fact about probability and counting. Suppose E 1 and E 2 are independent events. For example, you could think of E 1 as the event of tossing two dice and getting a
Final Exam Review (Math 1342)
") Final Exam Review (Math 1342) 1) 5.5 5.7 5.8 5.9 6.1 6.1 6.3 6.4 6.5 6.6 6.7 6.7 6.7 6.9 7.0 7.0 7.0 7.1 7.2 7.2 7.4 7.5 7.7 7.7 7.8 8.0 8.1 8.1 8.3 8.7 Min = 5.5 Q 1 = 25th percentile = middle of first
Final Exam Review (Math 1342) 1) 5.5 5.7 5.8 5.9 6.1 6.1 6.3 6.4 6.5 6.6 6.7 6.7 6.7 6.9 7.0 7.0 7.0 7.1 7.2 7.2 7.4 7.5 7.7 7.7 7.8 8.0 8.1 8.1 8.3 8.7 Min = 5.5 Q 1 = 25th percentile = middle of first
Two-Sample Inferential Statistics
 The t Test for Two Independent Samples 1 Two-Sample Inferential Statistics In an experiment there are two or more conditions One condition is often called the control condition in which the treatment is
SHORT ANSWER. Write the word or phrase that best completes each statement or answers the question.
 Chapter 7 Exam A Name 1) How do you determine whether to use the z or t distribution in computing the margin of error, E = z α/2 σn or E = t α/2 s n? 1) Use the given degree of confidence and sample data
Acceleration Due to Gravity
 Acceleration Due to Gravity You are probably familiar with the motion of a pendulum, swinging back and forth about some equilibrium position. A simple pendulum consists of a mass m suspended by a string
Didacticiel Études de cas. Parametric hypothesis testing for comparison of two or more populations. Independent and dependent samples.
 1 Subject Parametric hypothesis testing for comparison of two or more populations. Independent and dependent samples. The tests for comparison of population try to determine if K (K 2) samples come from
Content by Week Week of October 14 27
 Content by Week Week of October 14 27 Learning objectives By the end of this week, you should be able to: Understand the purpose and interpretation of confidence intervals for the mean, Calculate confidence
LOOKING FOR RELATIONSHIPS
 LOOKING FOR RELATIONSHIPS One of most common types of investigation we do is to look for relationships between variables. Variables may be nominal (categorical), for example looking at the effect of an
EC2001 Econometrics 1 Dr. Jose Olmo Room D309
 EC2001 Econometrics 1 Dr. Jose Olmo Room D309 J.Olmo@City.ac.uk 1 Revision of Statistical Inference 1.1 Sample, observations, population A sample is a number of observations drawn from a population. Population:
Accounting for Population Uncertainty in Covariance Structure Analysis
 Accounting for Population Uncertainty in Structure Analysis Boston College May 21, 2013 Joint work with: Michael W. Browne The Ohio State University matrix among observed variables are usually implied
Lecture 9. Selected material from: Ch. 12 The analysis of categorical data and goodness of fit tests
 Lecture 9 Selected material from: Ch. 12 The analysis of categorical data and goodness of fit tests Univariate categorical data Univariate categorical data are best summarized in a one way frequency table.
1 Mathematics and Statistics in Science
 1 Mathematics and Statistics in Science Overview Science students encounter mathematics and statistics in three main areas: Understanding and using theory. Carrying out experiments and analysing results.
χ L = χ R =
 Chapter 7 3C: Examples of Constructing a Confidence Interval for the true value of the Population Standard Deviation σ for a Normal Population. Example 1 Construct a 95% confidence interval for the true
Interval estimation. October 3, Basic ideas CLT and CI CI for a population mean CI for a population proportion CI for a Normal mean
 Interval estimation October 3, 2018 STAT 151 Class 7 Slide 1 Pandemic data Treatment outcome, X, from n = 100 patients in a pandemic: 1 = recovered and 0 = not recovered 1 1 1 0 0 0 1 1 1 0 0 1 0 1 0 0
Exam Empirical Methods VU University Amsterdam, Faculty of Exact Sciences h, February 12, 2015
 Exam Empirical Methods VU University Amsterdam, Faculty of Exact Sciences 18.30 21.15h, February 12, 2015 Question 1 is on this page. Always motivate your answers. Write your answers in English. Only the
Inference for the mean of a population. Testing hypotheses about a single mean (the one sample t-test). The sign test for matched pairs
. The sign test for matched pairs") Stat 528 (Autumn 2008) Inference for the mean of a population (One sample t procedures) Reading: Section 7.1. Inference for the mean of a population. The t distribution for a normal population. Small sample
Stat 528 (Autumn 2008) Inference for the mean of a population (One sample t procedures) Reading: Section 7.1. Inference for the mean of a population. The t distribution for a normal population. Small sample
Prepared by: Prof. Dr Bahaman Abu Samah Department of Professional Development and Continuing Education Faculty of Educational Studies Universiti
 Prepared by: Prof. Dr Bahaman Abu Samah Department of Professional Development and Continuing Education Faculty of Educational Studies Universiti Putra Malaysia Serdang Use in experiment, quasi-experiment
Preview from Notesale.co.uk Page 3 of 63
 Stem-and-leaf diagram - vertical numbers on far left represent the 10s, numbers right of the line represent the 1s The mean should not be used if there are extreme scores, or for ranks and categories Unbiased
Inferences for Regression
 Inferences for Regression An Example: Body Fat and Waist Size Looking at the relationship between % body fat and waist size (in inches). Here is a scatterplot of our data set: Remembering Regression In
Probability theory and inference statistics! Dr. Paola Grosso! SNE research group!! (preferred!)!!
!!") Probability theory and inference statistics Dr. Paola Grosso SNE research group p.grosso@uva.nl paola.grosso@os3.nl (preferred) Roadmap Lecture 1: Monday Sep. 22nd Collecting data Presenting data Descriptive
Probability theory and inference statistics Dr. Paola Grosso SNE research group p.grosso@uva.nl paola.grosso@os3.nl (preferred) Roadmap Lecture 1: Monday Sep. 22nd Collecting data Presenting data Descriptive
Box-Cox Transformations
 Box-Cox Transformations Revised: 10/10/2017 Summary... 1 Data Input... 3 Analysis Summary... 3 Analysis Options... 5 Plot of Fitted Model... 6 MSE Comparison Plot... 8 MSE Comparison Table... 9 Skewness
7.2 One-Sample Correlation ( = a) Introduction. Correlation analysis measures the strength and direction of association between
 Introduction. Correlation analysis measures the strength and direction of association between") 7.2 One-Sample Correlation ( = a) Introduction Correlation analysis measures the strength and direction of association between variables. In this chapter we will test whether the population correlation
7.2 One-Sample Correlation ( = a) Introduction Correlation analysis measures the strength and direction of association between variables. In this chapter we will test whether the population correlation
One-way ANOVA (Single-Factor CRD)
") One-way ANOVA (Single-Factor CRD) STAT:5201 Week 3: Lecture 3 1 / 23 One-way ANOVA We have already described a completed randomized design (CRD) where treatments are randomly assigned to EUs. There is
One-way ANOVA (Single-Factor CRD) STAT:5201 Week 3: Lecture 3 1 / 23 One-way ANOVA We have already described a completed randomized design (CRD) where treatments are randomly assigned to EUs. There is
Margin of Error for Proportions
 for Proportions Gene Quinn for Proportions p.1/8 An interval estimate for a population proportion p is often reported not as a confidence interval, but as a margin of error. for Proportions p.2/8 An interval
Chapter 8: Estimating with Confidence
 Chapter 8: Estimating with Confidence Section 8.3 The Practice of Statistics, 4 th edition For AP* STARNES, YATES, MOORE The One-Sample z Interval for a Population Mean In Section 8.1, we estimated the
Relating Graph to Matlab
 There are two related course documents on the web Probability and Statistics Review -should be read by people without statistics background and it is helpful as a review for those with prior statistics
The t-statistic. Student s t Test
 The t-statistic 1 Student s t Test When the population standard deviation is not known, you cannot use a z score hypothesis test Use Student s t test instead Student s t, or t test is, conceptually, very
Table Probabilities and Independence
 Table Probabilities and Independence Dr Tom Ilvento Department of Food and Resource Economics Overview This lecture will focus on working with categorical data and building tables It will walk you through
Module 2A Turning Multivariable Models into Interactive Animated Simulations
 Module 2A Turning Multivariable Models into Interactive Animated Simulations Using tools available in Excel, we will turn a multivariable model into an interactive animated simulation. Projectile motion,
WELCOME! Lecture 13 Thommy Perlinger
 Quantitative Methods II WELCOME! Lecture 13 Thommy Perlinger Parametrical tests (tests for the mean) Nature and number of variables One-way vs. two-way ANOVA One-way ANOVA Y X 1 1 One dependent variable
EXPERIMENT 2 Reaction Time Objectives Theory
 EXPERIMENT Reaction Time Objectives to make a series of measurements of your reaction time to make a histogram, or distribution curve, of your measured reaction times to calculate the "average" or mean
An area chart emphasizes the trend of each value over time. An area chart also shows the relationship of parts to a whole.
 Excel 2003 Creating a Chart Introduction Page 1 By the end of this lesson, learners should be able to: Identify the parts of a chart Identify different types of charts Create an Embedded Chart Create a
Review of Statistics 101
 Review of Statistics 101 We review some important themes from the course 1. Introduction Statistics- Set of methods for collecting/analyzing data (the art and science of learning from data). Provides methods
16.400/453J Human Factors Engineering. Design of Experiments II
 J Human Factors Engineering Design of Experiments II Review Experiment Design and Descriptive Statistics Research question, independent and dependent variables, histograms, box plots, etc. Inferential
AMS 7 Correlation and Regression Lecture 8
 AMS 7 Correlation and Regression Lecture 8 Department of Applied Mathematics and Statistics, University of California, Santa Cruz Suumer 2014 1 / 18 Correlation pairs of continuous observations. Correlation
Regression Analysis. BUS 735: Business Decision Making and Research
 Regression Analysis BUS 735: Business Decision Making and Research 1 Goals and Agenda Goals of this section Specific goals Learn how to detect relationships between ordinal and categorical variables. Learn
Chapter 8 - Statistical intervals for a single sample
 Chapter 8 - Statistical intervals for a single sample 8-1 Introduction In statistics, no quantity estimated from data is known for certain. All estimated quantities have probability distributions of their
Testing a Claim about the Difference in 2 Population Means Independent Samples. (there is no difference in Population Means µ 1 µ 2 = 0) against
 against") Section 9 2A Lecture Testing a Claim about the Difference i Population Means Independent Samples Test H 0 : µ 1 = µ 2 (there is no difference in Population Means µ 1 µ 2 = 0) against H 1 : µ 1 > µ 2 or
Section 9 2A Lecture Testing a Claim about the Difference i Population Means Independent Samples Test H 0 : µ 1 = µ 2 (there is no difference in Population Means µ 1 µ 2 = 0) against H 1 : µ 1 > µ 2 or
Inference for Distributions Inference for the Mean of a Population. Section 7.1
 Inference for Distributions Inference for the Mean of a Population Section 7.1 Statistical inference in practice Emphasis turns from statistical reasoning to statistical practice: Population standard deviation,
STAT Chapter 9: Two-Sample Problems. Paired Differences (Section 9.3)
") STAT 515 -- Chapter 9: Two-Sample Problems Paired Differences (Section 9.3) Examples of Paired Differences studies: Similar subjects are paired off and one of two treatments is given to each subject in
STAT 515 -- Chapter 9: Two-Sample Problems Paired Differences (Section 9.3) Examples of Paired Differences studies: Similar subjects are paired off and one of two treatments is given to each subject in
Harvard University. Rigorous Research in Engineering Education
 Statistical Inference Kari Lock Harvard University Department of Statistics Rigorous Research in Engineering Education 12/3/09 Statistical Inference You have a sample and want to use the data collected
Business Analytics and Data Mining Modeling Using R Prof. Gaurav Dixit Department of Management Studies Indian Institute of Technology, Roorkee
 Business Analytics and Data Mining Modeling Using R Prof. Gaurav Dixit Department of Management Studies Indian Institute of Technology, Roorkee Lecture - 04 Basic Statistics Part-1 (Refer Slide Time: 00:33)
Today - SPSS and standard error - End of Midterm 1 exam material - T-scores
 Today - SPSS and standard error - End of Midterm 1 exam material - T-scores Previously, on StatsClass: The standard error is a measure of the typical amount that that a sample mean will be off from the
7. Do not estimate values for y using x-values outside the limits of the data given. This is called extrapolation and is not reliable.
 AP Statistics 15 Inference for Regression I. Regression Review a. r à correlation coefficient or Pearson s coefficient: indicates strength and direction of the relationship between the explanatory variables
Chapter 26: Comparing Counts (Chi Square)
") Chapter 6: Comparing Counts (Chi Square) We ve seen that you can turn a qualitative variable into a quantitative one (by counting the number of successes and failures), but that s a compromise it forces
Chapter 6: Comparing Counts (Chi Square) We ve seen that you can turn a qualitative variable into a quantitative one (by counting the number of successes and failures), but that s a compromise it forces
Chapter 8: Estimating with Confidence
 Chapter 8: Estimating with Confidence Section 8.3 The Practice of Statistics, 4 th edition For AP* STARNES, YATES, MOORE Chapter 8 Estimating with Confidence n 8.1 Confidence Intervals: The Basics n 8.2
Module 9: Sampling IPDET. Sampling. Intro Concepts Types Confidence/ Precision? How Large? Intervention or Policy. Evaluation Questions
 IPDET Module 9: Sampling Sampling Intervention or Policy Evaluation Questions Design Approaches Data Collection Intro Concepts Types Confidence/ Precision? How Large? Introduction Introduction to Sampling
Statistical Intervals (One sample) (Chs )
 (Chs )") 7 Statistical Intervals (One sample) (Chs 8.1-8.3) Confidence Intervals The CLT tells us that as the sample size n increases, the sample mean X is close to normally distributed with expected value µ and
7 Statistical Intervals (One sample) (Chs 8.1-8.3) Confidence Intervals The CLT tells us that as the sample size n increases, the sample mean X is close to normally distributed with expected value µ and
Lecture 3. - all digits that are certain plus one which contains some uncertainty are said to be significant figures
 Lecture 3 SIGNIFICANT FIGURES e.g. - all digits that are certain plus one which contains some uncertainty are said to be significant figures 10.07 ml 0.1007 L 4 significant figures 0.10070 L 5 significant
Inferential statistics
 Inferential statistics Inference involves making a Generalization about a larger group of individuals on the basis of a subset or sample. Ahmed-Refat-ZU Null and alternative hypotheses In hypotheses testing,
FIN822 project 2 Project 2 contains part I and part II. (Due on November 10, 2008)
") FIN822 project 2 Project 2 contains part I and part II. (Due on November 10, 2008) Part I Logit Model in Bankruptcy Prediction You do not believe in Altman and you decide to estimate the bankruptcy prediction
FIN822 project 2 Project 2 contains part I and part II. (Due on November 10, 2008) Part I Logit Model in Bankruptcy Prediction You do not believe in Altman and you decide to estimate the bankruptcy prediction
Confidence intervals CE 311S
 CE 311S PREVIEW OF STATISTICS The first part of the class was about probability. P(H) = 0.5 P(T) = 0.5 HTTHHTTTTHHTHTHH If we know how a random process works, what will we see in the field? Preview of
Mock Exam - 2 hours - use of basic (non-programmable) calculator is allowed - all exercises carry the same marks - exam is strictly individual
 calculator is allowed - all exercises carry the same marks - exam is strictly individual") Mock Exam - 2 hours - use of basic (non-programmable) calculator is allowed - all exercises carry the same marks - exam is strictly individual Question 1. Suppose you want to estimate the percentage of
Mock Exam - 2 hours - use of basic (non-programmable) calculator is allowed - all exercises carry the same marks - exam is strictly individual Question 1. Suppose you want to estimate the percentage of
There are statistical tests that compare prediction of a model with reality and measures how significant the difference.
 Statistical Methods in Business Lecture 11. Chi Square, χ 2, Goodness-of-Fit Test There are statistical tests that compare prediction of a model with reality and measures how significant the difference.
DISCRETE RANDOM VARIABLES EXCEL LAB #3
 DISCRETE RANDOM VARIABLES EXCEL LAB #3 ECON/BUSN 180: Quantitative Methods for Economics and Business Department of Economics and Business Lake Forest College Lake Forest, IL 60045 Copyright, 2011 Overview
Notes for Week 13 Analysis of Variance (ANOVA) continued WEEK 13 page 1
 continued WEEK 13 page 1") Notes for Wee 13 Analysis of Variance (ANOVA) continued WEEK 13 page 1 Exam 3 is on Friday May 1. A part of one of the exam problems is on Predictiontervals : When randomly sampling from a normal population
Notes for Wee 13 Analysis of Variance (ANOVA) continued WEEK 13 page 1 Exam 3 is on Friday May 1. A part of one of the exam problems is on Predictiontervals : When randomly sampling from a normal population
Estimating a population mean
 Introductory Statistics Lectures Estimating a population mean Confidence intervals for means Department of Mathematics Pima Community College Redistribution of this material is prohibited without written
PLSC PRACTICE TEST ONE
 PLSC 724 - PRACTICE TEST ONE 1. Discuss briefly the relationship between the shape of the normal curve and the variance. 2. What is the relationship between a statistic and a parameter? 3. How is the α
Topic 16 Interval Estimation
 Topic 16 Interval Estimation Confidence Intervals for 1 / 14 Outline Overview z intervals t intervals Two Sample t intervals 2 / 14 Overview The quality of an estimator can be evaluated using its bias