Exam Empirical Methods VU University Amsterdam, Faculty of Exact Sciences h, February 12, 2015
|
|
|
- Juliet Green
- 6 years ago
- Views:
Transcription
1 Exam Empirical Methods VU University Amsterdam, Faculty of Exact Sciences h, February 12, 2015 Question 1 is on this page. Always motivate your answers. Write your answers in English. Only the use of a simple, non-graphical calculator is allowed. Programmable/graphical calculators, laptops, mobile phones, smart watches, books, own formula sheets, etc. are not allowed. On the last four pages of the exam, some formulas and tables that you may want to use can be found. The total number of points you can receive is 90: Grade = 1 + points 10. The division of points per question and subparts is as follows: Question Part a) Part b) Part c) Part d) Total If you are asked to perform a test, do not only give the conclusion of your test, but report: 1. the hypotheses in terms of the population parameter of interest; 2. the significance level; 3. the test statistic and its distribution under the null hypothesis; 4. the observed value of the test statistic; 5. the P -value or the critical value(s); 6. whether or not the null hypothesis is rejected and why; 7. finally, phrase your conclusion in terms of the context of the problem. 1. Alice throws a fair coin twice. (a) Give the sample space Ω and probability measure P for this experiment. (b) Are the events A = {First throw is Heads} and B = {Precisely one throw is Tails} independent events? (c) Alice receives 2 euros for each time she throws Heads, but she loses 1 euro for each time she throws Tails. Let X be the random variable which denotes the amount Alice earns after the two throws. What is the probability distribution of X? (d) Compute, using part (c), the expectation E(X) of X. 1
2 2. Figure 1 below shows a boxplot and a normal Q-Q plot of a sample x. (a) Describe briefly what the boxplot tells you about the location, spread and shape of the underlying distribution of the data. (b) What can you deduce from the Q-Q plot with respect to the tails of the underlying distribution of the data compared to the tails of a normal distribution? (c) For each of the histograms in Figure 2 below indicate why it could or could not be a histogram of the sample x. (d) Will the sample mean of x be larger, smaller or roughly equal to the sample median? Normal Q Q Plot Sample Quantiles Theoretical Quantiles Figure 1: Boxplot and normal Q-Q plot of a sample x. Density Density Density Figure 2: Three histograms. 3. Assume that the amount of beer in a randomly selected beer bottle has a normal distribution with mean µ = 300 ml and standard deviation σ = 5 ml. (a) What is the probability that one randomly selected beer bottle contains between 294 and 307 ml of beer? (b) What is the probability that the mean volume of beer in a random sample of n = 25 beer bottles is at least 299 ml? Now assume the amount of beer in a beer bottle from company A is normally distributed with unknown mean µ and known standard deviation σ = 5 ml. The amount of beer in n = 16 randomly selected beer bottles from company A is measured and the sample mean equals x =
3 (c) Use the P -value method for a suitable hypothesis test (motivate your choice!) to test the claim that the mean amount of beer is less than 300 ml at significance level α = (d) If a 90% confidence interval with margin of error E = 1 ml were required for the mean amount of beer in a bottle, how many bottles should be measured? 4. On a particular day, 22 out of 542 visitors to a website clicked on a certain web banner. After the banner was modified, it was found that 64 out of 601 visitors to the website on a day clicked on the web banner. (a) Give a point estimate for the difference between the proportions of people who click on the banner before and after the modification. (b) Construct a 95% confidence interval for the difference between the proportions of people who click on the banner before and after the modification. (c) What is the interpretation of the confidence interval obtained in part (b)? (d) Based on your answer of part (b), was the modification successful? 5. A researcher wants to investigate the claim that among married couples, females speak more words in a day than males. She randomly selects 71 couples and the total number of words spoken in a day is counted for both the husband (sample 1) and wife (sample 2). Some sample statistics regarding this experiment which you may or may not use in your analysis are shown below (d and s d denote the mean and standard deviation of the pairwise differences in total number of words spoken between husband and wife and s p denotes the pooled sample standard deviation): x 1 = , x 2 = , d = , s 1 = , s 2 = , s d = , s p = (a) Test with a suitable hypothesis test (motivate your choice!) the claim that among married couples, females speak more words in a day than males. Take significance level α = (b) The test you performed in part (a) should only be used if certain requirement(s) are met. What are these requirement(s) and are they met in this case? (c) What is the interpretation of the significance level α = 0.05? 6. Estimating the costs of drilling oil wells is an important consideration for the oil industry. For 16 randomly selected oil wells both their depth (km) and drilling costs (mln EUR) were measured and stored in respective datasets x and y. A linear regression analysis was carried out with explanatory variable depth and response variable drilling costs. Some sample statistics of the data that you may or may not use are: 1 r 2 x = 2.58, y = 6.35, s x = 0.80, s y = 2.80, r = 0.95, n 2 = 0.081, s b 0 = 0.77, s b1 = Furthermore, a scatterplot of the drilling costs against the depth of oil wells is shown in Figure 3 (see next page). 3
4 (a) Provide an estimate for the regression equation by eye. (b) Based on your answer of part (a), what is your prediction for the drillings costs of a well with a depth of 4.0 km? (c) Compute the coefficient of determination. What is its interpretation? (d) Test the claim that ρ = 0, i.e. that there is no linear correlation between depth and drilling costs of oil wells. Take significance level α = Scatterplot Drilling costs (mln EUR) Depth (km) Figure 3: Scatterplot of drilling costs against depth of oil wells. 7. A variety of different datasets includes numbers with leading (first) digits that follow, according to Benford s law, the following distribution: Leading digit Percentage 30.1% 17.6% 12.5% 9.7% 7.9% 6.7% 5.8% 5.1% 4.6% Since the numbers people report in tax files are among the datasets that should behave according to Benford s law, this law can be used to detect fraud: if the observed frequencies of the leading digits differ significantly from the expected frequencies according to Benford s law, then the tax file appears to result from fraud. A tax inspector checks a tax file with 377 numbers and finds the following frequencies of leading digits: Leading digit Frequency (a) Compute the expected frequency of 9 as leading digit for this tax file under the assumption that the leading digits follow the distribution specified by Benford s law. (b) Use part (a) to show that the requirements for a chi-square goodness-of-fit test are satisfied. (c) Perform a chi-square goodness-of-fit test to investigate whether the tax file appears to be legitimate. Use significance level α = The observed value for the test statistic is 19.87, so you do not have to compute this value! 4
5 Formulas and Tables for Exam Empirical Methods Probability We use the following notation: Ω sample space, P probability measure. B, A 1, A 2,..., A m events, A 1, A 2,..., A m a partition of Ω with P (A i ) > 0 for all i {1, 2,..., m}. Law of Total Probability: Bayes Theorem: P (B) = P (A r B) = m P (B A i ) = i=1 m P (B A i )P (A i ). i=1 P (A r B) m i=1 P (B A i)p (A i ) = P (B A r)p (A r ) m i=1 P (B A i)p (A i ). Two independent samples (The statements below hold if certain requirements are met.) For two independent samples, (i) if σ 1 and σ 2 are unknown and σ 1 σ 2, the test statistic T 2 = ( x 1 x 2 ) (µ 1 µ 2 ) s 2 1 /n 1 + s 2 2 /n 2 has a t-distribution with approximately ñ degrees of freedom under the null hypothesis. We use the conservative estimate ñ = min{n 1 1, n 2 1}. (ii) if σ 1 and σ 2 are unknown and σ 1 = σ 2, then the test statistic 2 = ( x 1 x 2 ) (µ 1 µ 2 ) s 2 p/n 1 + s 2 p/n 2 T eq has a t-distribution with n 1 + n 2 2 degrees of freedom under the null hypothesis. Here s p is the square root of the pooled sample variance s 2 p given by s 2 p = (n 1 1)s (n 2 1)s 2 2. n 1 + n 2 2 (iii) if σ 1 and σ 2 are known, then the test statistic Z = ( x 1 x 2 ) (µ 1 µ 2 ) σ 2 1 /n 1 + σ 2 2 /n 2 1
6 has a standard normal distribution under the null hypothesis. (iv) if p 1 = p 2, the test statistic Z = (ˆp 1 ˆp 2 ) (p 1 p 2 ) p(1 p)/n1 + p(1 p)/n 2 approximately has a standard normal distribution. Here p = (x 1 +x 2 )/(n 1 +n 2 ) is the pooled sample proportion. (v) the margin of error for a 1 α confidence interval for p 1 p 2 is given by E = z α/2 ˆp1 (1 ˆp 1 )/n 1 + ˆp 2 (1 ˆp 2 )/n 2. Correlation Under certain conditions the test statistic T cor = r ρ (1 r 2 )/(n 2) has a t-distribution with n 2 degrees of freedom. Here ρ is the population linear correlation coefficient and r is the sample linear correlation coefficient given by r = 1 n 1 n i=1 [ (xi x)(y i ȳ) ]. s x s y Linear regression Let β 0 be the unknown intercept and β 1 the unknown slope of a linear regression model with one explanatory variable, and let b 0 and b 1 be the corresponding estimators, i.e. the intercept and slope of the regression line (the best line). Then b 0 and b 1 are given by b 1 = r s y s x and b 0 = ȳ b 1 x. If certain requirements are met, then the test statistic T 1 = b 1 β 1 s b1 has a t-distribution with n 2 degrees of freedom. Here s b1 is the standard error (i.e. estimated standard deviation) of the estimator b 1. 2
7
8
Extra Exam Empirical Methods VU University Amsterdam, Faculty of Exact Sciences , July 2, 2015
 Extra Exam Empirical Methods VU University Amsterdam, Faculty of Exact Sciences 12.00 14.45, July 2, 2015 Also hand in this exam and your scrap paper. Always motivate your answers. Write your answers in
Tables Table A Table B Table C Table D Table E 675
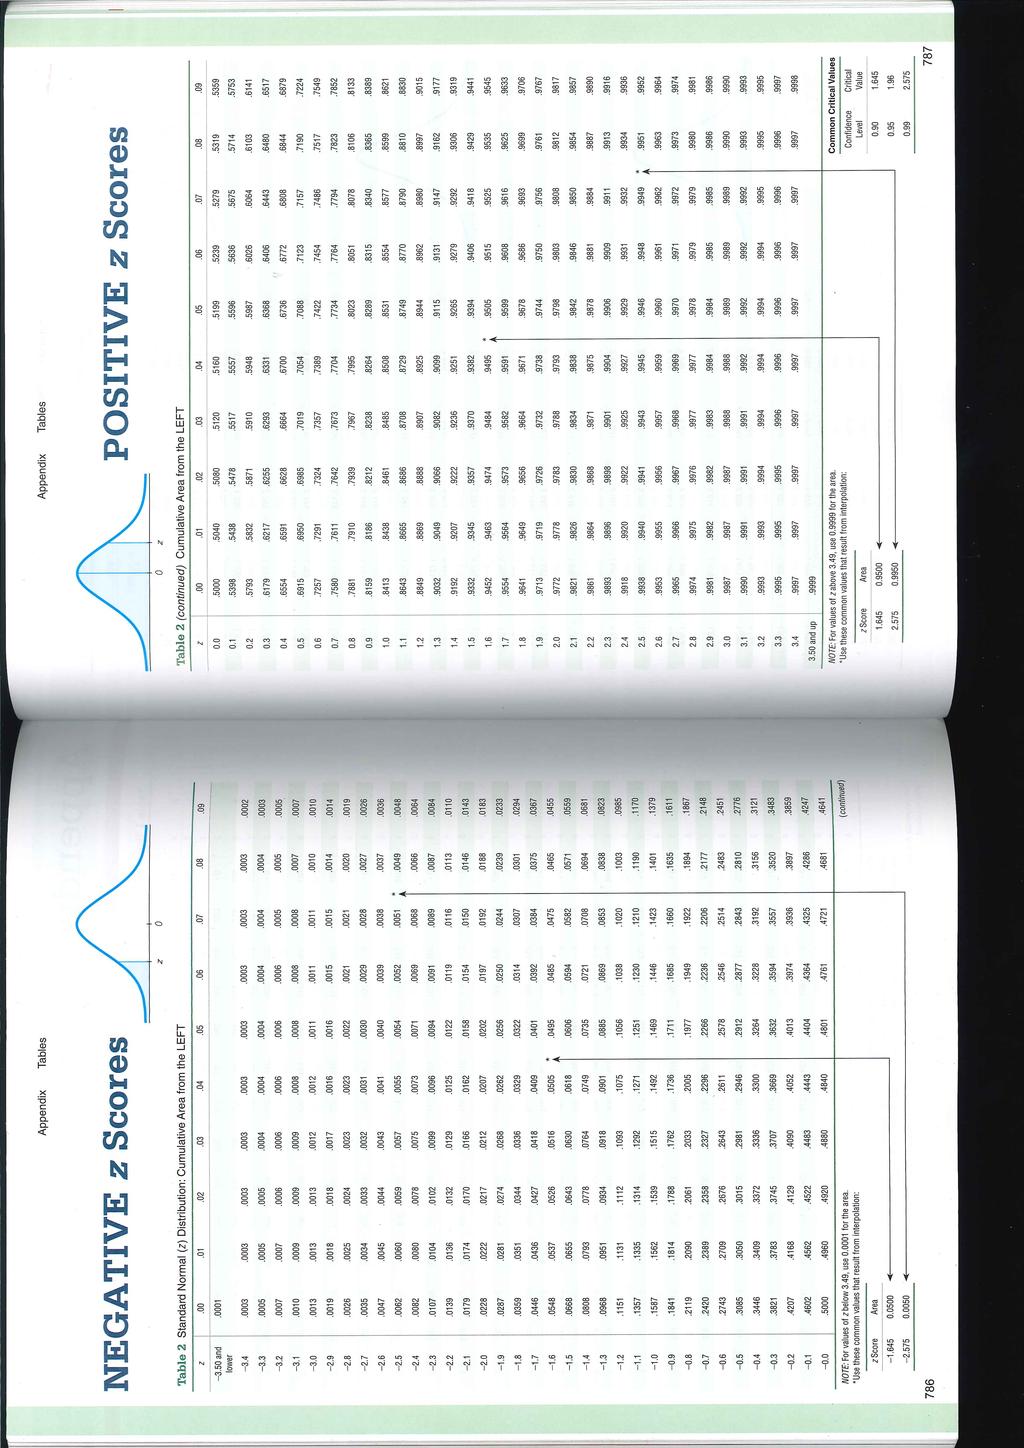
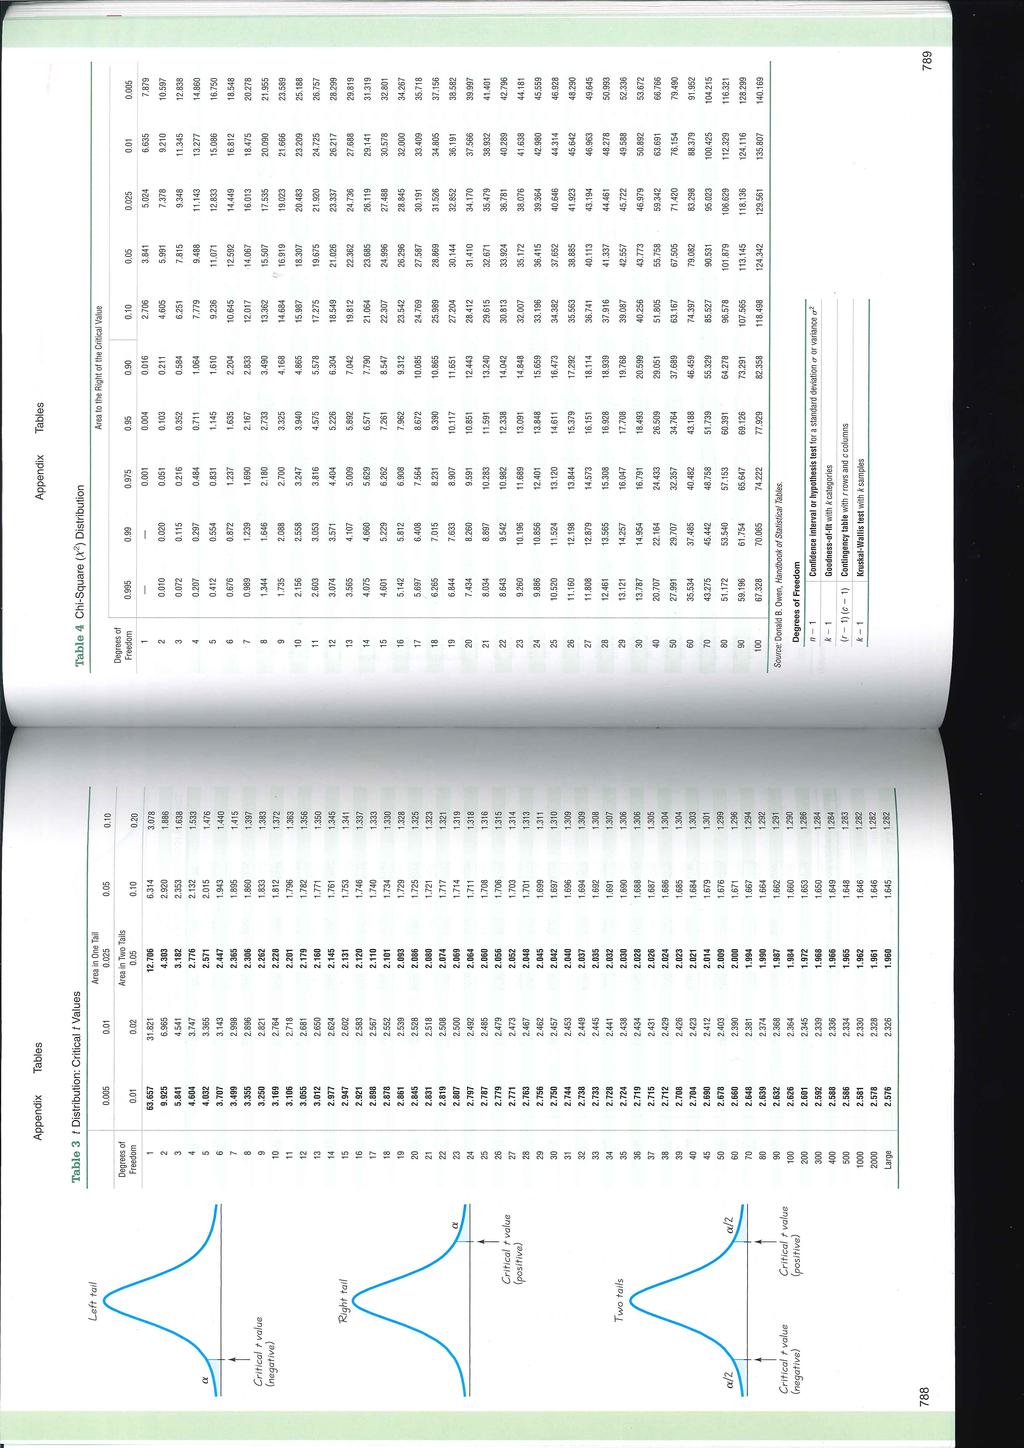
 BMTables.indd Page 675 11/15/11 4:25:16 PM user-s163 Tables Table A Standard Normal Probabilities Table B Random Digits Table C t Distribution Critical Values Table D Chi-square Distribution Critical Values
WISE MA/PhD Programs Econometrics Instructor: Brett Graham Spring Semester, Academic Year Exam Version: A
 WISE MA/PhD Programs Econometrics Instructor: Brett Graham Spring Semester, 2016-17 Academic Year Exam Version: A INSTRUCTIONS TO STUDENTS 1 The time allowed for this examination paper is 2 hours. 2 This
Review 6. n 1 = 85 n 2 = 75 x 1 = x 2 = s 1 = 38.7 s 2 = 39.2
 Review 6 Use the traditional method to test the given hypothesis. Assume that the samples are independent and that they have been randomly selected ) A researcher finds that of,000 people who said that
SCHOOL OF MATHEMATICS AND STATISTICS
 RESTRICTED OPEN BOOK EXAMINATION (Not to be removed from the examination hall) Data provided: Statistics Tables by H.R. Neave MAS5052 SCHOOL OF MATHEMATICS AND STATISTICS Basic Statistics Spring Semester
TABLES AND FORMULAS FOR MOORE Basic Practice of Statistics
 TABLES AND FORMULAS FOR MOORE Basic Practice of Statistics Exploring Data: Distributions Look for overall pattern (shape, center, spread) and deviations (outliers). Mean (use a calculator): x = x 1 + x
STA 101 Final Review
 STA 101 Final Review Statistics 101 Thomas Leininger June 24, 2013 Announcements All work (besides projects) should be returned to you and should be entered on Sakai. Office Hour: 2 3pm today (Old Chem
WISE International Masters
 WISE International Masters ECONOMETRICS Instructor: Brett Graham INSTRUCTIONS TO STUDENTS 1 The time allowed for this examination paper is 2 hours. 2 This examination paper contains 32 questions. You are
11 Correlation and Regression
 Chapter 11 Correlation and Regression August 21, 2017 1 11 Correlation and Regression When comparing two variables, sometimes one variable (the explanatory variable) can be used to help predict the value
Mock Exam - 2 hours - use of basic (non-programmable) calculator is allowed - all exercises carry the same marks - exam is strictly individual
 calculator is allowed - all exercises carry the same marks - exam is strictly individual") Mock Exam - 2 hours - use of basic (non-programmable) calculator is allowed - all exercises carry the same marks - exam is strictly individual Question 1. Suppose you want to estimate the percentage of
Mock Exam - 2 hours - use of basic (non-programmable) calculator is allowed - all exercises carry the same marks - exam is strictly individual Question 1. Suppose you want to estimate the percentage of
Business Statistics. Lecture 10: Course Review
 Business Statistics Lecture 10: Course Review 1 Descriptive Statistics for Continuous Data Numerical Summaries Location: mean, median Spread or variability: variance, standard deviation, range, percentiles,
Inference for Regression Simple Linear Regression
 Inference for Regression Simple Linear Regression IPS Chapter 10.1 2009 W.H. Freeman and Company Objectives (IPS Chapter 10.1) Simple linear regression p Statistical model for linear regression p Estimating
Stat 101 Exam 1 Important Formulas and Concepts 1
 1 Chapter 1 1.1 Definitions Stat 101 Exam 1 Important Formulas and Concepts 1 1. Data Any collection of numbers, characters, images, or other items that provide information about something. 2. Categorical/Qualitative
WISE MA/PhD Programs Econometrics Instructor: Brett Graham Spring Semester, Academic Year Exam Version: A
 WISE MA/PhD Programs Econometrics Instructor: Brett Graham Spring Semester, 2016-17 Academic Year Exam Version: A INSTRUCTIONS TO STUDENTS 1 The time allowed for this examination paper is 2 hours. 2 This
Confidence Intervals, Testing and ANOVA Summary
 Confidence Intervals, Testing and ANOVA Summary 1 One Sample Tests 1.1 One Sample z test: Mean (σ known) Let X 1,, X n a r.s. from N(µ, σ) or n > 30. Let The test statistic is H 0 : µ = µ 0. z = x µ 0
This exam contains 13 pages (including this cover page) and 10 questions. A Formulae sheet is provided with the exam.
 and 10 questions. A Formulae sheet is provided with the exam.") Probability and Statistics FS 2017 Session Exam 22.08.2017 Time Limit: 180 Minutes Name: Student ID: This exam contains 13 pages (including this cover page) and 10 questions. A Formulae sheet is provided
Probability and Statistics FS 2017 Session Exam 22.08.2017 Time Limit: 180 Minutes Name: Student ID: This exam contains 13 pages (including this cover page) and 10 questions. A Formulae sheet is provided
Inference for Regression Inference about the Regression Model and Using the Regression Line
 Inference for Regression Inference about the Regression Model and Using the Regression Line PBS Chapter 10.1 and 10.2 2009 W.H. Freeman and Company Objectives (PBS Chapter 10.1 and 10.2) Inference about
MATH c UNIVERSITY OF LEEDS Examination for the Module MATH1725 (May-June 2009) INTRODUCTION TO STATISTICS. Time allowed: 2 hours
 INTRODUCTION TO STATISTICS. Time allowed: 2 hours") 01 This question paper consists of 11 printed pages, each of which is identified by the reference. Only approved basic scientific calculators may be used. Statistical tables are provided at the end of
01 This question paper consists of 11 printed pages, each of which is identified by the reference. Only approved basic scientific calculators may be used. Statistical tables are provided at the end of
STATISTICS 141 Final Review
 STATISTICS 141 Final Review Bin Zou bzou@ualberta.ca Department of Mathematical & Statistical Sciences University of Alberta Winter 2015 Bin Zou (bzou@ualberta.ca) STAT 141 Final Review Winter 2015 1 /
Harvard University. Rigorous Research in Engineering Education
 Statistical Inference Kari Lock Harvard University Department of Statistics Rigorous Research in Engineering Education 12/3/09 Statistical Inference You have a sample and want to use the data collected
MATH 1150 Chapter 2 Notation and Terminology
 MATH 1150 Chapter 2 Notation and Terminology Categorical Data The following is a dataset for 30 randomly selected adults in the U.S., showing the values of two categorical variables: whether or not the
Inferences for Regression
 Inferences for Regression An Example: Body Fat and Waist Size Looking at the relationship between % body fat and waist size (in inches). Here is a scatterplot of our data set: Remembering Regression In
Chapter 27 Summary Inferences for Regression
 Chapter 7 Summary Inferences for Regression What have we learned? We have now applied inference to regression models. Like in all inference situations, there are conditions that we must check. We can test
DSST Principles of Statistics
 DSST Principles of Statistics Time 10 Minutes 98 Questions Each incomplete statement is followed by four suggested completions. Select the one that is best in each case. 1. Which of the following variables
This document contains 3 sets of practice problems.
 P RACTICE PROBLEMS This document contains 3 sets of practice problems. Correlation: 3 problems Regression: 4 problems ANOVA: 8 problems You should print a copy of these practice problems and bring them
Inference for the Regression Coefficient
 Inference for the Regression Coefficient Recall, b 0 and b 1 are the estimates of the slope β 1 and intercept β 0 of population regression line. We can shows that b 0 and b 1 are the unbiased estimates
FinalExamReview. Sta Fall Provided: Z, t and χ 2 tables
 Final Exam FinalExamReview Sta 101 - Fall 2017 Duke University, Department of Statistical Science When: Wednesday, December 13 from 9:00am-12:00pm What to bring: Scientific calculator (graphing calculator
2011 Pearson Education, Inc
 Statistics for Business and Economics Chapter 7 Inferences Based on Two Samples: Confidence Intervals & Tests of Hypotheses Content 1. Identifying the Target Parameter 2. Comparing Two Population Means:
CBA4 is live in practice mode this week exam mode from Saturday!
 Announcements CBA4 is live in practice mode this week exam mode from Saturday! Material covered: Confidence intervals (both cases) 1 sample hypothesis tests (both cases) Hypothesis tests for 2 means as
SLR output RLS. Refer to slr (code) on the Lecture Page of the class website.
 on the Lecture Page of the class website.") SLR output RLS Refer to slr (code) on the Lecture Page of the class website. Old Faithful at Yellowstone National Park, WY: Simple Linear Regression (SLR) Analysis SLR analysis explores the linear association
SLR output RLS Refer to slr (code) on the Lecture Page of the class website. Old Faithful at Yellowstone National Park, WY: Simple Linear Regression (SLR) Analysis SLR analysis explores the linear association
Review: General Approach to Hypothesis Testing. 1. Define the research question and formulate the appropriate null and alternative hypotheses.
 1 Review: Let X 1, X,..., X n denote n independent random variables sampled from some distribution might not be normal!) with mean µ) and standard deviation σ). Then X µ σ n In other words, X is approximately
The scatterplot is the basic tool for graphically displaying bivariate quantitative data.
 Bivariate Data: Graphical Display The scatterplot is the basic tool for graphically displaying bivariate quantitative data. Example: Some investors think that the performance of the stock market in January
# of 6s # of times Test the null hypthesis that the dice are fair at α =.01 significance
 Practice Final Exam Statistical Methods and Models - Math 410, Fall 2011 December 4, 2011 You may use a calculator, and you may bring in one sheet (8.5 by 11 or A4) of notes. Otherwise closed book. The
Swarthmore Honors Exam 2012: Statistics
 Swarthmore Honors Exam 2012: Statistics 1 Swarthmore Honors Exam 2012: Statistics John W. Emerson, Yale University NAME: Instructions: This is a closed-book three-hour exam having six questions. You may
appstats27.notebook April 06, 2017
 Chapter 27 Objective Students will conduct inference on regression and analyze data to write a conclusion. Inferences for Regression An Example: Body Fat and Waist Size pg 634 Our chapter example revolves
STAT Exam Jam Solutions. Contents
 s Contents 1 First Day 2 Question 1: PDFs, CDFs, and Finding E(X), V (X).......................... 2 Question 2: Bayesian Inference...................................... 3 Question 3: Binomial to Normal
This gives us an upper and lower bound that capture our population mean.
 Confidence Intervals Critical Values Practice Problems 1 Estimation 1.1 Confidence Intervals Definition 1.1 Margin of error. The margin of error of a distribution is the amount of error we predict when
Chapter 9 Inferences from Two Samples
 Chapter 9 Inferences from Two Samples 9-1 Review and Preview 9-2 Two Proportions 9-3 Two Means: Independent Samples 9-4 Two Dependent Samples (Matched Pairs) 9-5 Two Variances or Standard Deviations Review
CHAPTER 1. Introduction
 CHAPTER 1 Introduction Engineers and scientists are constantly exposed to collections of facts, or data. The discipline of statistics provides methods for organizing and summarizing data, and for drawing
Quiz 1. Name: Instructions: Closed book, notes, and no electronic devices.
 Quiz 1. Name: Instructions: Closed book, notes, and no electronic devices. 1.(10) What is usually true about a parameter of a model? A. It is a known number B. It is determined by the data C. It is an
Scatter plot of data from the study. Linear Regression
 1 2 Linear Regression Scatter plot of data from the study. Consider a study to relate birthweight to the estriol level of pregnant women. The data is below. i Weight (g / 100) i Weight (g / 100) 1 7 25
Hypothesis Tests and Estimation for Population Variances. Copyright 2014 Pearson Education, Inc.
 Hypothesis Tests and Estimation for Population Variances 11-1 Learning Outcomes Outcome 1. Formulate and carry out hypothesis tests for a single population variance. Outcome 2. Develop and interpret confidence
Midterm 2 - Solutions
 Ecn 102 - Analysis of Economic Data University of California - Davis February 23, 2010 Instructor: John Parman Midterm 2 - Solutions You have until 10:20am to complete this exam. Please remember to put
STAT 350 Final (new Material) Review Problems Key Spring 2016
 Review Problems Key Spring 2016") 1. The editor of a statistics textbook would like to plan for the next edition. A key variable is the number of pages that will be in the final version. Text files are prepared by the authors using LaTeX,
1. The editor of a statistics textbook would like to plan for the next edition. A key variable is the number of pages that will be in the final version. Text files are prepared by the authors using LaTeX,
Nature vs. nurture? Lecture 18 - Regression: Inference, Outliers, and Intervals. Regression Output. Conditions for inference.
 Understanding regression output from software Nature vs. nurture? Lecture 18 - Regression: Inference, Outliers, and Intervals In 1966 Cyril Burt published a paper called The genetic determination of differences
CHAPTER 10. Regression and Correlation
 CHAPTER 10 Regression and Correlation In this Chapter we assess the strength of the linear relationship between two continuous variables. If a significant linear relationship is found, the next step would
GROUPED DATA E.G. FOR SAMPLE OF RAW DATA (E.G. 4, 12, 7, 5, MEAN G x / n STANDARD DEVIATION MEDIAN AND QUARTILES STANDARD DEVIATION
 FOR SAMPLE OF RAW DATA (E.G. 4, 1, 7, 5, 11, 6, 9, 7, 11, 5, 4, 7) BE ABLE TO COMPUTE MEAN G / STANDARD DEVIATION MEDIAN AND QUARTILES Σ ( Σ) / 1 GROUPED DATA E.G. AGE FREQ. 0-9 53 10-19 4...... 80-89
ASSIGNMENT 3 SIMPLE LINEAR REGRESSION. Old Faithful
 ASSIGNMENT 3 SIMPLE LINEAR REGRESSION In the simple linear regression model, the mean of a response variable is a linear function of an explanatory variable. The model and associated inferential tools
Summer Review for Mathematical Studies Rising 12 th graders
 Summer Review for Mathematical Studies Rising 12 th graders Due the first day of school in August 2017. Please show all work and round to 3 significant digits. A graphing calculator is required for these
Announcements. Lecture 10: Relationship between Measurement Variables. Poverty vs. HS graduate rate. Response vs. explanatory
 Announcements Announcements Lecture : Relationship between Measurement Variables Statistics Colin Rundel February, 20 In class Quiz #2 at the end of class Midterm #1 on Friday, in class review Wednesday
WISE MA/PhD Programs Econometrics Instructor: Brett Graham Spring Semester, Academic Year Exam Version: A
 WISE MA/PhD Programs Econometrics Instructor: Brett Graham Spring Semester, 2015-16 Academic Year Exam Version: A INSTRUCTIONS TO STUDENTS 1 The time allowed for this examination paper is 2 hours. 2 This
Inference for Proportions, Variance and Standard Deviation
 Inference for Proportions, Variance and Standard Deviation Sections 7.10 & 7.6 Cathy Poliak, Ph.D. cathy@math.uh.edu Office Fleming 11c Department of Mathematics University of Houston Lecture 12 Cathy
Scatter plot of data from the study. Linear Regression
 1 2 Linear Regression Scatter plot of data from the study. Consider a study to relate birthweight to the estriol level of pregnant women. The data is below. i Weight (g / 100) i Weight (g / 100) 1 7 25
Lecture 9 Two-Sample Test. Fall 2013 Prof. Yao Xie, H. Milton Stewart School of Industrial Systems & Engineering Georgia Tech
 Lecture 9 Two-Sample Test Fall 2013 Prof. Yao Xie, yao.xie@isye.gatech.edu H. Milton Stewart School of Industrial Systems & Engineering Georgia Tech Computer exam 1 18 Histogram 14 Frequency 9 5 0 75 83.33333333
Ch. 1: Data and Distributions
 Ch. 1: Data and Distributions Populations vs. Samples How to graphically display data Histograms, dot plots, stem plots, etc Helps to show how samples are distributed Distributions of both continuous and
Final Exam STAT On a Pareto chart, the frequency should be represented on the A) X-axis B) regression C) Y-axis D) none of the above
 X-axis B) regression C) Y-axis D) none of the above") King Abdul Aziz University Faculty of Sciences Statistics Department Final Exam STAT 0 First Term 49-430 A 40 Name No ID: Section: You have 40 questions in 9 pages. You have 90 minutes to solve the exam.
King Abdul Aziz University Faculty of Sciences Statistics Department Final Exam STAT 0 First Term 49-430 A 40 Name No ID: Section: You have 40 questions in 9 pages. You have 90 minutes to solve the exam.
CIVL /8904 T R A F F I C F L O W T H E O R Y L E C T U R E - 8
 CIVL - 7904/8904 T R A F F I C F L O W T H E O R Y L E C T U R E - 8 Chi-square Test How to determine the interval from a continuous distribution I = Range 1 + 3.322(logN) I-> Range of the class interval
Inferences About Two Population Proportions
 Inferences About Two Population Proportions MATH 130, Elements of Statistics I J. Robert Buchanan Department of Mathematics Fall 2018 Background Recall: for a single population the sampling proportion
Warm-up Using the given data Create a scatterplot Find the regression line
 Time at the lunch table Caloric intake 21.4 472 30.8 498 37.7 335 32.8 423 39.5 437 22.8 508 34.1 431 33.9 479 43.8 454 42.4 450 43.1 410 29.2 504 31.3 437 28.6 489 32.9 436 30.6 480 35.1 439 33.0 444
Contents. Acknowledgments. xix
 Table of Preface Acknowledgments page xv xix 1 Introduction 1 The Role of the Computer in Data Analysis 1 Statistics: Descriptive and Inferential 2 Variables and Constants 3 The Measurement of Variables
Linear Regression. In this lecture we will study a particular type of regression model: the linear regression model
 1 Linear Regression 2 Linear Regression In this lecture we will study a particular type of regression model: the linear regression model We will first consider the case of the model with one predictor
Sociology 6Z03 Review I
 Sociology 6Z03 Review I John Fox McMaster University Fall 2016 John Fox (McMaster University) Sociology 6Z03 Review I Fall 2016 1 / 19 Outline: Review I Introduction Displaying Distributions Describing
Section 4.6 Simple Linear Regression
 Section 4.6 Simple Linear Regression Objectives ˆ Basic philosophy of SLR and the regression assumptions ˆ Point & interval estimation of the model parameters, and how to make predictions ˆ Point and interval
MAT 2377C FINAL EXAM PRACTICE
 Department of Mathematics and Statistics University of Ottawa MAT 2377C FINAL EXAM PRACTICE 10 December 2015 Professor: Rafal Kulik Time: 180 minutes Student Number: Family Name: First Name: This is a
1 Introduction to Minitab
 1 Introduction to Minitab Minitab is a statistical analysis software package. The software is freely available to all students and is downloadable through the Technology Tab at my.calpoly.edu. When you
Final Exam - Solutions
 Ecn 102 - Analysis of Economic Data University of California - Davis March 19, 2010 Instructor: John Parman Final Exam - Solutions You have until 5:30pm to complete this exam. Please remember to put your
Simple Linear Regression for the Climate Data
 Prediction Prediction Interval Temperature 0.2 0.0 0.2 0.4 0.6 0.8 320 340 360 380 CO 2 Simple Linear Regression for the Climate Data What do we do with the data? y i = Temperature of i th Year x i =CO
Inference for Regression
 Inference for Regression Section 9.4 Cathy Poliak, Ph.D. cathy@math.uh.edu Office in Fleming 11c Department of Mathematics University of Houston Lecture 13b - 3339 Cathy Poliak, Ph.D. cathy@math.uh.edu
23. Inference for regression
 23. Inference for regression The Practice of Statistics in the Life Sciences Third Edition 2014 W. H. Freeman and Company Objectives (PSLS Chapter 23) Inference for regression The regression model Confidence
Assumptions, Diagnostics, and Inferences for the Simple Linear Regression Model with Normal Residuals
 Assumptions, Diagnostics, and Inferences for the Simple Linear Regression Model with Normal Residuals 4 December 2018 1 The Simple Linear Regression Model with Normal Residuals In previous class sessions,
Simple Linear Regression
 Simple Linear Regression ST 370 Regression models are used to study the relationship of a response variable and one or more predictors. The response is also called the dependent variable, and the predictors
Stats Review Chapter 14. Mary Stangler Center for Academic Success Revised 8/16
 Stats Review Chapter 14 Revised 8/16 Note: This review is meant to highlight basic concepts from the course. It does not cover all concepts presented by your instructor. Refer back to your notes, unit
1 A Review of Correlation and Regression
 1 A Review of Correlation and Regression SW, Chapter 12 Suppose we select n = 10 persons from the population of college seniors who plan to take the MCAT exam. Each takes the test, is coached, and then
df=degrees of freedom = n - 1
 One sample t-test test of the mean Assumptions: Independent, random samples Approximately normal distribution (from intro class: σ is unknown, need to calculate and use s (sample standard deviation)) Hypotheses:
Statistics and Sampling distributions
 Statistics and Sampling distributions a statistic is a numerical summary of sample data. It is a rv. The distribution of a statistic is called its sampling distribution. The rv s X 1, X 2,, X n are said
LECTURE 6. Introduction to Econometrics. Hypothesis testing & Goodness of fit
 LECTURE 6 Introduction to Econometrics Hypothesis testing & Goodness of fit October 25, 2016 1 / 23 ON TODAY S LECTURE We will explain how multiple hypotheses are tested in a regression model We will define
10.2: The Chi Square Test for Goodness of Fit
 10.2: The Chi Square Test for Goodness of Fit We can perform a hypothesis test to determine whether the distribution of a single categorical variable is following a proposed distribution. We call this
y = a + bx 12.1: Inference for Linear Regression Review: General Form of Linear Regression Equation Review: Interpreting Computer Regression Output
 12.1: Inference for Linear Regression Review: General Form of Linear Regression Equation y = a + bx y = dependent variable a = intercept b = slope x = independent variable Section 12.1 Inference for Linear
Hypothesis Tests Solutions COR1-GB.1305 Statistics and Data Analysis
 Hypothesis Tests Solutions COR1-GB.1305 Statistics and Data Analysis Introduction 1. An analyst claims to have a reliable model for Twitter s quarterly revenues. His model predicted that the most recent
Basic Probability Reference Sheet
 February 27, 2001 Basic Probability Reference Sheet 17.846, 2001 This is intended to be used in addition to, not as a substitute for, a textbook. X is a random variable. This means that X is a variable
WELCOME! Lecture 13 Thommy Perlinger
 Quantitative Methods II WELCOME! Lecture 13 Thommy Perlinger Parametrical tests (tests for the mean) Nature and number of variables One-way vs. two-way ANOVA One-way ANOVA Y X 1 1 One dependent variable
McGill University. Faculty of Science. Department of Mathematics and Statistics. Part A Examination. Statistics: Theory Paper
 McGill University Faculty of Science Department of Mathematics and Statistics Part A Examination Statistics: Theory Paper Date: 10th May 2015 Instructions Time: 1pm-5pm Answer only two questions from Section
Statistics I Exercises Lesson 3 Academic year 2015/16
 Statistics I Exercises Lesson 3 Academic year 2015/16 1. The following table represents the joint (relative) frequency distribution of two variables: semester grade in Estadística I course and # of hours
UNIVERSITY OF TORONTO. Faculty of Arts and Science APRIL - MAY 2005 EXAMINATIONS STA 248 H1S. Duration - 3 hours. Aids Allowed: Calculator
 UNIVERSITY OF TORONTO Faculty of Arts and Science APRIL - MAY 2005 EXAMINATIONS STA 248 H1S Duration - 3 hours Aids Allowed: Calculator LAST NAME: FIRST NAME: STUDENT NUMBER: There are 17 pages including
Test 3 Practice Test A. NOTE: Ignore Q10 (not covered)
") Test 3 Practice Test A NOTE: Ignore Q10 (not covered) MA 180/418 Midterm Test 3, Version A Fall 2010 Student Name (PRINT):............................................. Student Signature:...................................................
Test 3 Practice Test A NOTE: Ignore Q10 (not covered) MA 180/418 Midterm Test 3, Version A Fall 2010 Student Name (PRINT):............................................. Student Signature:...................................................
Review of Statistics 101
 Review of Statistics 101 We review some important themes from the course 1. Introduction Statistics- Set of methods for collecting/analyzing data (the art and science of learning from data). Provides methods
WISE International Masters
 WISE International Masters ECONOMETRICS Instructor: Brett Graham INSTRUCTIONS TO STUDENTS 1 The time allowed for this examination paper is 2 hours. 2 This examination paper contains 32 questions. You are
Review of Statistics
 Review of Statistics Topics Descriptive Statistics Mean, Variance Probability Union event, joint event Random Variables Discrete and Continuous Distributions, Moments Two Random Variables Covariance and
CAS MA575 Linear Models
 CAS MA575 Linear Models Boston University, Fall 2013 Midterm Exam (Correction) Instructor: Cedric Ginestet Date: 22 Oct 2013. Maximal Score: 200pts. Please Note: You will only be graded on work and answers
Ecn Analysis of Economic Data University of California - Davis February 23, 2010 Instructor: John Parman. Midterm 2. Name: ID Number: Section:
 Ecn 102 - Analysis of Economic Data University of California - Davis February 23, 2010 Instructor: John Parman Midterm 2 You have until 10:20am to complete this exam. Please remember to put your name,
Quantitative Introduction ro Risk and Uncertainty in Business Module 5: Hypothesis Testing
 Quantitative Introduction ro Risk and Uncertainty in Business Module 5: Hypothesis Testing M. Vidyasagar Cecil & Ida Green Chair The University of Texas at Dallas Email: M.Vidyasagar@utdallas.edu October
Correlation Analysis
 Simple Regression Correlation Analysis Correlation analysis is used to measure strength of the association (linear relationship) between two variables Correlation is only concerned with strength of the
Lecture 14. Analysis of Variance * Correlation and Regression. The McGraw-Hill Companies, Inc., 2000
 Lecture 14 Analysis of Variance * Correlation and Regression Outline Analysis of Variance (ANOVA) 11-1 Introduction 11-2 Scatter Plots 11-3 Correlation 11-4 Regression Outline 11-5 Coefficient of Determination
Lecture 14. Outline. Outline. Analysis of Variance * Correlation and Regression Analysis of Variance (ANOVA)
") Outline Lecture 14 Analysis of Variance * Correlation and Regression Analysis of Variance (ANOVA) 11-1 Introduction 11- Scatter Plots 11-3 Correlation 11-4 Regression Outline 11-5 Coefficient of Determination
Outline Lecture 14 Analysis of Variance * Correlation and Regression Analysis of Variance (ANOVA) 11-1 Introduction 11- Scatter Plots 11-3 Correlation 11-4 Regression Outline 11-5 Coefficient of Determination
Final Exam. Name: Solution:
 Final Exam. Name: Instructions. Answer all questions on the exam. Open books, open notes, but no electronic devices. The first 13 problems are worth 5 points each. The rest are worth 1 point each. HW1.
Unit 6 - Simple linear regression
 Sta 101: Data Analysis and Statistical Inference Dr. Çetinkaya-Rundel Unit 6 - Simple linear regression LO 1. Define the explanatory variable as the independent variable (predictor), and the response variable
This does not cover everything on the final. Look at the posted practice problems for other topics.
 Class 7: Review Problems for Final Exam 8.5 Spring 7 This does not cover everything on the final. Look at the posted practice problems for other topics. To save time in class: set up, but do not carry
10.4 Hypothesis Testing: Two Independent Samples Proportion
 10.4 Hypothesis Testing: Two Independent Samples Proportion Example 3: Smoking cigarettes has been known to cause cancer and other ailments. One politician believes that a higher tax should be imposed
CHI SQUARE ANALYSIS 8/18/2011 HYPOTHESIS TESTS SO FAR PARAMETRIC VS. NON-PARAMETRIC
 CHI SQUARE ANALYSIS I N T R O D U C T I O N T O N O N - P A R A M E T R I C A N A L Y S E S HYPOTHESIS TESTS SO FAR We ve discussed One-sample t-test Dependent Sample t-tests Independent Samples t-tests
Chapter 15: Nonparametric Statistics Section 15.1: An Overview of Nonparametric Statistics
 Section 15.1: An Overview of Nonparametric Statistics Understand Difference between Parametric and Nonparametric Statistical Procedures Parametric statistical procedures inferential procedures that rely