Probability theory and inference statistics! Dr. Paola Grosso! SNE research group!! (preferred!)!!
|
|
|
- Alexia Barber
- 6 years ago
- Views:
Transcription
1 Probability theory and inference statistics Dr. Paola Grosso SNE research group (preferred)
2 Roadmap Lecture 1: Monday Sep. 22nd Collecting data Presenting data Descriptive statistics Basic probability theory Lecture 2: Thursday Sep. 25th Probability distributions (cont) Parameter estimation Confidence intervals, limits, significance Hypothesis testing
3 Last time
4 Last time What I think you learned: How to present data How to make simple statement about your data Basic of probability theory Discrete variable distributions What you really have learned/ remember:
5 The binomial distribution A discrete random variable R follows the binomial distribution if: P(R = r) = p r (1 p) n r n r(n r) Probability of a specific outcome Number of equivalent permutations for that outcome There is a fixed number of trials n; Only two outcomes (success or failure), are possible at each trial; The trials are independent; There is a constant probability p of success at each trial; The random variable r is the number of successes in n trials.

6 Hands-on #5 Five percent of the switches produced by a company are defective or do not operate. What is the probability that out of thirty switches you have to install, one will be defective? And the probability that at most one is defective? Hint: look at dbinom and pbinom and qbinom
7 Probability distributions (continued)
8 The Poisson distribution It determines the probability of a specified event occurring during a specific period of time (or volume or distance or length) The events occur with a known average rate and independently of the time since the last event λ is the expected number of occurrences in this interval P(r;λ) = e λ λ r r
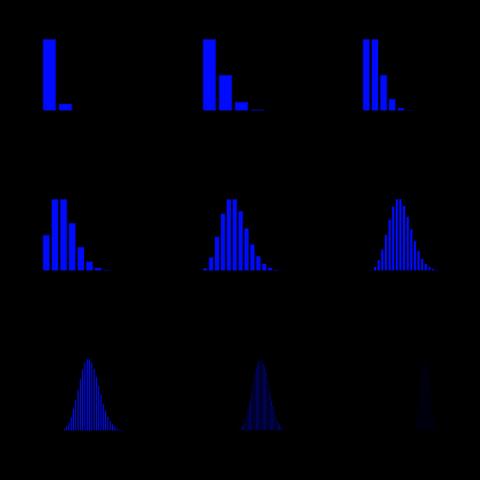
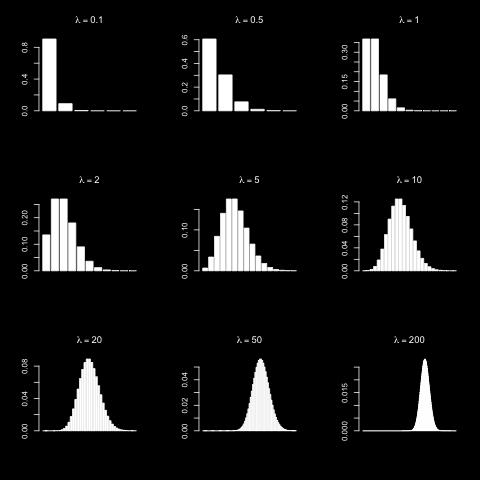
9 Properties of the Poisson distribution
10 More properties of the Poisson distribution Mean, r = λ Variance: V (r) = λ σ = λ e P( r; λ) = r λ r λ
11 Hands-on #6 The annual failure rate of two year old hard disks is 8%. You maintain a pool of 100 nodes with these two year old hard disk installed. What is the probability that one will fail today? And the probability one will fail this week?
12 Continuous random variable PDFs
 is the area under the curve: Pr(a x b) = b a f (x)dx")
13 Probability of continuous random variable The probability Pr (2 x 4) is the area under the curve: Pr(a x b) = b a f (x)dx

,type='l',col='red',lwd=3) P( x; µ, σ")
14 The Gaussian distribution Look at Poisson distribution in limit of large N Familiar Gaussian distribution, (approximation reasonable for N>10) plot(x,dnorm(x,25,5),type='l',col='red',lwd=3) P( x; µ, σ ) = 1 e 2πσ ( x µ ) 2 / 2 σ 2
15 Properties of the Gaussian distribution Mean Variance Standard deviation + x = xp(x;µ,σ )dx = µ + V(x) = (x µ) 2 P(x;µ,σ )dx = σ 2 σ = σ The mother of all distributions: The binomial distribution B(n, p) is approximately normal N(np, np(1 p)) for large n and for p not too close to zero or one. The Poisson(λ) distribution is approximately normal N(λ, λ) for large values of λ. The chi-squared distribution χ2(k) is approximately normal N(k, 2k) for large ks. The Student s t-distribution t(ν) is approximately normal N(0, 1) when ν is large.
16 Hands-on #7 Run the script you find online: par(mfrow = c(3,3)) prob <- seq(0,1,0.01) x1 <- seq(-5,5,0.01) plot(x1,dnorm(x1),type='l') plot(x1,pnorm(x1),type='l') plot(prob,qnorm(prob),type='l') What have you done? What are you looking at? x2 <- seq(5,15,0.01) plot(x2,dnorm(x2,12,0.5),type='l') plot(x2,pnorm(x2,12,0.5),type='l') plot(prob,qnorm(prob,12,0.5),type='l') x3 <- seq((5-12)/0.5,(15-12)/0.5,0.01) plot(x3,dnorm(x3),type="l") plot(x3,pnorm(x3),type='l') plot(prob,qnorm(prob),type='l')

17 PDF, CDF and Quantile function Choose x. PDF returns the probability that we will observe a value x during one observation of the random variable X. Choose x. CDF returns the probability that we will observe a value equal or lower than x during one observation of the random variable X. Choose a probability p. The quantile function returns the value which the random variable will be at, or below, with that probability.

18 Intervals Can you show this with R? 68.27% within 1σ 90% à 1.645σ 95.43% within 2σ 95% à 1.96σ 99.73% within 3σ 99% à 2.58σ 99.9% à 3.29σ
19 Pause
20 Estimates and confidence intervals
21 Estimation Estimation is the process of using an estimator obtained from a sample to produce an estimate of a parameter. There are two types of estimates: a point estimate which is a single number or value used to estimate a population parameter; for example, x for µ and an interval estimate which is a spread of values used to estimate a population parameter. For example, a < x < b

22 Confidence intervals Three components in a confidence interval: 1. A confidence level describes the uncertainty of a sampling method. 1. A sample statistics a characteristic of a sample. Generally, a statistic is used to estimate the value of a population parameter. 1. A margin of error the range of values above and below the sample statistic. If we select different samples and compute different interval estimates using the same sampling method, the true population mean would fall within a range defined by: "sample statistic ± margin of error <confidence-level>% of the time.
23 Population Populations and samples N: Number of observations in the population Sample n: Number of observations in the sample P: Proportion of successes in population p: Proportion of successes in sample P i : Proportion of successes in population i p i : Proportion of successes in sample i μ: Population mean : Sample estimate of population mean σ: Population standard deviation s: Sample estimate of σ σ p : Standard deviation of p SE p : Standard error of p σ: Standard deviation of x SE : Standard error of x x x x
24 Standard deviation and standard error To calculate the confidence interval of the statistics you need to know either the standard deviation or the standard error of the statistics. Let s say you have measured a mean x or a probability p: The standard deviations are: σ x = σ n σ p = P(1 P) n Note, you need to know σ and P from the population The standard errors are: SE x = SE p = s n p(1 p) n
25 Margin of error In a confidence interval, the range of values above and below the sample statistic is called the margin of error: Margin of error = Critical value x S.D statistics Margin of error = Critical value x S.E statistics
26 Confidence level and critical value 1. You chose a confidence level (99%, 95%). 2. You calculate the parameters α and p *: α = 1 (confidence level /100) p * =1 α 2 The critical value is the value of z (z score ) or t (t score ) whose cumulative probability (from the CDF) is equal to p *. z is the random variable that follows a standard normal distribution (µ=0,σ=1) t is the random variable that follows t-student distribution with DF = n-1
27 z score and t score Confidence level α p* z score t score 80% 1-(80/100) = (0.2/2) = qt(0.9-n-1) 90% 1-(90/100) = (0.1/2) = qt(0.95,n-1) 95% 1-(95/100) = (0.05/2) = qt(0.975,n-1) 98% 1-(98/100)= (0.02/2)= qt(0.99,n-1) 99% 1-(99/100) = (0.01/2) = qt(0.995,n-1)
28 Hands-on #7 A sample of 200 elements has mean x of 34 and a sample standard deviation s of 3. What is the 99% confidence interval for the mean? 34±??? è??? < x<??? Margin of error = Critical value x S.D statistics Margin of error = Critical value x S.E statistics σ x = σ n SE x = s n z score t score σ p = P(1 P) n SE p = p(1 p) n 1.28 qt(0.9, n-1) 1.64 qt(0.95,n-1) 1.96 qt(0.975,n-1) 2.33 qt(0.99,n-1) 2.57 qt(0.995,n-1)
29 Example A sample of 200 elements has mean x of 34 and a sample standard deviation s of 3. What is the 99% confidence interval for the mean? SE = 3/sqrt(200)=0.21 α = 1-(99/100) p*= /2=0.995 z score =qnorm(0.995)=2.57 Margin error = 2.57 x 0.21= ±0.54 è < µ <34.54 Note, with 90% confidence: 34±0.34 è < µ < With a sample of 400 (and 99% confidence): SE =0.15 è 34±0.38
30 Statistical hypothesis

31 Statistical hypothesis A statistical hypothesis is an assumption about a population parameter. H 0 = the null hypothesis. H a = the alternative hypothesis. If sample data are not consistent with the statistical hypothesis H 0, the hypothesis is rejected. And the alternative is accepted. Examples: Are data from two samples belonging to the same population? Are the data following a poissonian distribution?

32 Hypothesis testing A statistical hypothesis test is a method of making decisions using experimental data. You measure statistical significance Four steps: State the hypothesis Proof by contradiction H 0 is usually the hypothesis that sample observations result purely from chance: H 0 parameter Formulate an analysis plan: Find a statistic that takes on extreme values when assumed hypothesis is false Analyze the sample data. Calculate the value of this statistic in the collected data Interpret the result Reject or fail to reject the null hypothesis.
33 Test statistics and P-value During the analysis phase you will define a test statistics (assuming that your data is normally distributed): Test statistics = (Statistic - Parameter from H 0 ) Standard deviation of statistic Test statistics = (Statistic - Parameter from H 0 ) Standard error of statistic
34 Significance level (p-value) The P-value is the probability of observing a sample statistic as extreme as the test statistic, assuming the null hypothesis is true. p-value Evidence against H0 < 0.01-ish Very strong >.01-ish and <.05-ish Moderate >.05-ish and <.10-ish Weak >.10 ish Practically none
/ (0.25(1-0.25)/1050=-6.0689 P-value: pnorm(-6.0689)=6.43674e-10 The p-value is approximately 0, we reject the null hypothesis.")
35 An example 25%of eligible jurors are black. In a random sample of 1050 people 177 were black. Is there sign of discrimination? H0: P=0.25 Ha: P <0.25 Sample proportion: p=177/1050= Test statistic: z=( )/ (0.25(1-0.25)/1050= P-value: pnorm( )= e-10 The p-value is approximately 0, we reject the null hypothesis. It is very unlikely that we would observe a sample percentage of 16.89% or smaller if the true percentage was The data suggest that black jurors were indeed selected less frequently than would have been expected. The data provide some evidence of discrimination.

36 Statistical significance You can use strict cut-off for the p-value: the significance levels. The significance letter is denoted with the letter α. For example: α =0.05 Reject the null hypothesis when the p-value less is than Otherwise, do not reject it. Cannot rely blindly on cut-offs. Unsignificant unimportant Statistical significance practical significance
37 Common critical values Significance Two-tail One-tail
38 Type I and type II error Type I error (false positive) when the researcher rejects H 0 when H 0 is true. The probability of committing a Type I error is the significance level α. Type II error (false negative) when the researcher accepts H 0 when H a is true. The probability of committing a Type II error isβ. The probability of not committing a Type II error is called the Power of the test 1-β The chance of a making a Type I error does not depend on sample size. (Sample sizes incorporated into test statistics). The chance of making a Type II error decreases as sample size increases (power analysis).
 2.")
39 Summary You have learned a lot. I have two hopes: 1. You can use this in your RP project, future projects, research. (R as open-source alternative) 2. You are now curious about statistics and are eager to learn more by yourself.
AMS7: WEEK 7. CLASS 1. More on Hypothesis Testing Monday May 11th, 2015
 AMS7: WEEK 7. CLASS 1 More on Hypothesis Testing Monday May 11th, 2015 Testing a Claim about a Standard Deviation or a Variance We want to test claims about or 2 Example: Newborn babies from mothers taking
A Probability Primer. A random walk down a probabilistic path leading to some stochastic thoughts on chance events and uncertain outcomes.
 A Probability Primer A random walk down a probabilistic path leading to some stochastic thoughts on chance events and uncertain outcomes. Are you holding all the cards?? Random Events A random event, E,
Probability and Probability Distributions. Dr. Mohammed Alahmed
 Probability and Probability Distributions 1 Probability and Probability Distributions Usually we want to do more with data than just describing them! We might want to test certain specific inferences about
The t-test: A z-score for a sample mean tells us where in the distribution the particular mean lies
 The t-test: So Far: Sampling distribution benefit is that even if the original population is not normal, a sampling distribution based on this population will be normal (for sample size > 30). Benefit
Probability Methods in Civil Engineering Prof. Dr. Rajib Maity Department of Civil Engineering Indian Institution of Technology, Kharagpur
 Probability Methods in Civil Engineering Prof. Dr. Rajib Maity Department of Civil Engineering Indian Institution of Technology, Kharagpur Lecture No. # 36 Sampling Distribution and Parameter Estimation
1 Probability Distributions
 1 Probability Distributions A probability distribution describes how the values of a random variable are distributed. For example, the collection of all possible outcomes of a sequence of coin tossing
Math Review Sheet, Fall 2008
 1 Descriptive Statistics Math 3070-5 Review Sheet, Fall 2008 First we need to know about the relationship among Population Samples Objects The distribution of the population can be given in one of the
Chapter 9 Inferences from Two Samples
 Chapter 9 Inferences from Two Samples 9-1 Review and Preview 9-2 Two Proportions 9-3 Two Means: Independent Samples 9-4 Two Dependent Samples (Matched Pairs) 9-5 Two Variances or Standard Deviations Review
CONTINUOUS RANDOM VARIABLES
 the Further Mathematics network www.fmnetwork.org.uk V 07 REVISION SHEET STATISTICS (AQA) CONTINUOUS RANDOM VARIABLES The main ideas are: Properties of Continuous Random Variables Mean, Median and Mode
Hypothesis Testing. ECE 3530 Spring Antonio Paiva
 Hypothesis Testing ECE 3530 Spring 2010 Antonio Paiva What is hypothesis testing? A statistical hypothesis is an assertion or conjecture concerning one or more populations. To prove that a hypothesis is
Inference for Single Proportions and Means T.Scofield
 Inference for Single Proportions and Means TScofield Confidence Intervals for Single Proportions and Means A CI gives upper and lower bounds between which we hope to capture the (fixed) population parameter
1 Descriptive statistics. 2 Scores and probability distributions. 3 Hypothesis testing and one-sample t-test. 4 More on t-tests
 Overall Overview INFOWO Statistics lecture S3: Hypothesis testing Peter de Waal Department of Information and Computing Sciences Faculty of Science, Universiteit Utrecht 1 Descriptive statistics 2 Scores
Statistics for IT Managers
 Statistics for IT Managers 95-796, Fall 2012 Module 2: Hypothesis Testing and Statistical Inference (5 lectures) Reading: Statistics for Business and Economics, Ch. 5-7 Confidence intervals Given the sample
Confidence Intervals with σ unknown
 STAT 141 Confidence Intervals and Hypothesis Testing 10/26/04 Today (Chapter 7): CI with σ unknown, t-distribution CI for proportions Two sample CI with σ known or unknown Hypothesis Testing, z-test Confidence
Lecture 3. Biostatistics in Veterinary Science. Feb 2, Jung-Jin Lee Drexel University. Biostatistics in Veterinary Science Lecture 3
 Lecture 3 Biostatistics in Veterinary Science Jung-Jin Lee Drexel University Feb 2, 2015 Review Let S be the sample space and A, B be events. Then 1 P (S) = 1, P ( ) = 0. 2 If A B, then P (A) P (B). In
Special Discrete RV s. Then X = the number of successes is a binomial RV. X ~ Bin(n,p).
.") Sect 3.4: Binomial RV Special Discrete RV s 1. Assumptions and definition i. Experiment consists of n repeated trials ii. iii. iv. There are only two possible outcomes on each trial: success (S) or failure
Sect 3.4: Binomial RV Special Discrete RV s 1. Assumptions and definition i. Experiment consists of n repeated trials ii. iii. iv. There are only two possible outcomes on each trial: success (S) or failure
Exponential, Gamma and Normal Distribuions
 Exponential, Gamma and Normal Distribuions Sections 5.4, 5.5 & 6.5 Cathy Poliak, Ph.D. cathy@math.uh.edu Office in Fleming 11c Department of Mathematics University of Houston Lecture 9-3339 Cathy Poliak,
STAT 4385 Topic 01: Introduction & Review
 STAT 4385 Topic 01: Introduction & Review Xiaogang Su, Ph.D. Department of Mathematical Science University of Texas at El Paso xsu@utep.edu Spring, 2016 Outline Welcome What is Regression Analysis? Basics
HYPOTHESIS TESTING. Hypothesis Testing
 MBA 605 Business Analytics Don Conant, PhD. HYPOTHESIS TESTING Hypothesis testing involves making inferences about the nature of the population on the basis of observations of a sample drawn from the population.
Practice Problems Section Problems
 Practice Problems Section 4-4-3 4-4 4-5 4-6 4-7 4-8 4-10 Supplemental Problems 4-1 to 4-9 4-13, 14, 15, 17, 19, 0 4-3, 34, 36, 38 4-47, 49, 5, 54, 55 4-59, 60, 63 4-66, 68, 69, 70, 74 4-79, 81, 84 4-85,
CIVL /8904 T R A F F I C F L O W T H E O R Y L E C T U R E - 8
 CIVL - 7904/8904 T R A F F I C F L O W T H E O R Y L E C T U R E - 8 Chi-square Test How to determine the interval from a continuous distribution I = Range 1 + 3.322(logN) I-> Range of the class interval
STA 2101/442 Assignment 2 1
 STA 2101/442 Assignment 2 1 These questions are practice for the midterm and final exam, and are not to be handed in. 1. A polling firm plans to ask a random sample of registered voters in Quebec whether
INTERVAL ESTIMATION AND HYPOTHESES TESTING
 INTERVAL ESTIMATION AND HYPOTHESES TESTING 1. IDEA An interval rather than a point estimate is often of interest. Confidence intervals are thus important in empirical work. To construct interval estimates,
The t-distribution. Patrick Breheny. October 13. z tests The χ 2 -distribution The t-distribution Summary
 Patrick Breheny October 13 Patrick Breheny Biostatistical Methods I (BIOS 5710) 1/25 Introduction Introduction What s wrong with z-tests? So far we ve (thoroughly!) discussed how to carry out hypothesis
Stat 5421 Lecture Notes Fuzzy P-Values and Confidence Intervals Charles J. Geyer March 12, Discreteness versus Hypothesis Tests
 Stat 5421 Lecture Notes Fuzzy P-Values and Confidence Intervals Charles J. Geyer March 12, 2016 1 Discreteness versus Hypothesis Tests You cannot do an exact level α test for any α when the data are discrete.
How do we compare the relative performance among competing models?
 How do we compare the relative performance among competing models? 1 Comparing Data Mining Methods Frequent problem: we want to know which of the two learning techniques is better How to reliably say Model
Statistics Primer. ORC Staff: Jayme Palka Peter Boedeker Marcus Fagan Trey Dejong
 Statistics Primer ORC Staff: Jayme Palka Peter Boedeker Marcus Fagan Trey Dejong 1 Quick Overview of Statistics 2 Descriptive vs. Inferential Statistics Descriptive Statistics: summarize and describe data
One-sample categorical data: approximate inference
 One-sample categorical data: approximate inference Patrick Breheny October 6 Patrick Breheny Biostatistical Methods I (BIOS 5710) 1/25 Introduction It is relatively easy to think about the distribution
Sociology 6Z03 Review II
 Sociology 6Z03 Review II John Fox McMaster University Fall 2016 John Fox (McMaster University) Sociology 6Z03 Review II Fall 2016 1 / 35 Outline: Review II Probability Part I Sampling Distributions Probability
Lecture 4: Random Variables and Distributions
 Lecture 4: Random Variables and Distributions Goals Random Variables Overview of discrete and continuous distributions important in genetics/genomics Working with distributions in R Random Variables A
EC2001 Econometrics 1 Dr. Jose Olmo Room D309
 EC2001 Econometrics 1 Dr. Jose Olmo Room D309 J.Olmo@City.ac.uk 1 Revision of Statistical Inference 1.1 Sample, observations, population A sample is a number of observations drawn from a population. Population:
PHP2510: Principles of Biostatistics & Data Analysis. Lecture X: Hypothesis testing. PHP 2510 Lec 10: Hypothesis testing 1
 PHP2510: Principles of Biostatistics & Data Analysis Lecture X: Hypothesis testing PHP 2510 Lec 10: Hypothesis testing 1 In previous lectures we have encountered problems of estimating an unknown population
BIO5312 Biostatistics Lecture 6: Statistical hypothesis testings
 BIO5312 Biostatistics Lecture 6: Statistical hypothesis testings Yujin Chung October 4th, 2016 Fall 2016 Yujin Chung Lec6: Statistical hypothesis testings Fall 2016 1/30 Previous Two types of statistical
16.400/453J Human Factors Engineering. Design of Experiments II
 J Human Factors Engineering Design of Experiments II Review Experiment Design and Descriptive Statistics Research question, independent and dependent variables, histograms, box plots, etc. Inferential
Chapter 4 - Lecture 3 The Normal Distribution
 Chapter 4 - Lecture 3 The October 28th, 2009 Chapter 4 - Lecture 3 The Standard Chapter 4 - Lecture 3 The Standard Normal distribution is a statistical unicorn It is the most important distribution in
Lecture on Null Hypothesis Testing & Temporal Correlation
 Lecture on Null Hypothesis Testing & Temporal Correlation CS 590.21 Analysis and Modeling of Brain Networks Department of Computer Science University of Crete Acknowledgement Resources used in the slides
Stat 135, Fall 2006 A. Adhikari HOMEWORK 6 SOLUTIONS
 Stat 135, Fall 2006 A. Adhikari HOMEWORK 6 SOLUTIONS 1a. Under the null hypothesis X has the binomial (100,.5) distribution with E(X) = 50 and SE(X) = 5. So P ( X 50 > 10) is (approximately) two tails
The Chi-Square Distributions
 MATH 03 The Chi-Square Distributions Dr. Neal, Spring 009 The chi-square distributions can be used in statistics to analyze the standard deviation of a normally distributed measurement and to test the
This does not cover everything on the final. Look at the posted practice problems for other topics.
 Class 7: Review Problems for Final Exam 8.5 Spring 7 This does not cover everything on the final. Look at the posted practice problems for other topics. To save time in class: set up, but do not carry
LECTURE 5. Introduction to Econometrics. Hypothesis testing
 LECTURE 5 Introduction to Econometrics Hypothesis testing October 18, 2016 1 / 26 ON TODAY S LECTURE We are going to discuss how hypotheses about coefficients can be tested in regression models We will
Statistical Inference: Estimation and Confidence Intervals Hypothesis Testing
 Statistical Inference: Estimation and Confidence Intervals Hypothesis Testing 1 In most statistics problems, we assume that the data have been generated from some unknown probability distribution. We desire
Harvard University. Rigorous Research in Engineering Education
 Statistical Inference Kari Lock Harvard University Department of Statistics Rigorous Research in Engineering Education 12/3/09 Statistical Inference You have a sample and want to use the data collected
The Chi-Square Distributions
 MATH 183 The Chi-Square Distributions Dr. Neal, WKU The chi-square distributions can be used in statistics to analyze the standard deviation σ of a normally distributed measurement and to test the goodness
Brief Review of Probability
 Maura Department of Economics and Finance Università Tor Vergata Outline 1 Distribution Functions Quantiles and Modes of a Distribution 2 Example 3 Example 4 Distributions Outline Distribution Functions
The Normal Distribuions
 The Normal Distribuions Sections 5.4 & 5.5 Cathy Poliak, Ph.D. cathy@math.uh.edu Office in Fleming 11c Department of Mathematics University of Houston Lecture 15-3339 Cathy Poliak, Ph.D. cathy@math.uh.edu
ECO220Y Review and Introduction to Hypothesis Testing Readings: Chapter 12
 ECO220Y Review and Introduction to Hypothesis Testing Readings: Chapter 12 Winter 2012 Lecture 13 (Winter 2011) Estimation Lecture 13 1 / 33 Review of Main Concepts Sampling Distribution of Sample Mean
z and t tests for the mean of a normal distribution Confidence intervals for the mean Binomial tests
 z and t tests for the mean of a normal distribution Confidence intervals for the mean Binomial tests Chapters 3.5.1 3.5.2, 3.3.2 Prof. Tesler Math 283 Fall 2018 Prof. Tesler z and t tests for mean Math
GEOMETRIC -discrete A discrete random variable R counts number of times needed before an event occurs
 STATISTICS 4 Summary Notes. Geometric and Exponential Distributions GEOMETRIC -discrete A discrete random variable R counts number of times needed before an event occurs P(X = x) = ( p) x p x =,, 3,...
CS 160: Lecture 16. Quantitative Studies. Outline. Random variables and trials. Random variables. Qualitative vs. Quantitative Studies
 Qualitative vs. Quantitative Studies CS 160: Lecture 16 Professor John Canny Qualitative: What we ve been doing so far: * Contextual Inquiry: trying to understand user s tasks and their conceptual model.
Class 24. Daniel B. Rowe, Ph.D. Department of Mathematics, Statistics, and Computer Science. Marquette University MATH 1700
 Class 4 Daniel B. Rowe, Ph.D. Department of Mathematics, Statistics, and Computer Science Copyright 013 by D.B. Rowe 1 Agenda: Recap Chapter 9. and 9.3 Lecture Chapter 10.1-10.3 Review Exam 6 Problem Solving
Probability and Distributions
 Probability and Distributions What is a statistical model? A statistical model is a set of assumptions by which the hypothetical population distribution of data is inferred. It is typically postulated
Stat Lecture 20. Last class we introduced the covariance and correlation between two jointly distributed random variables.
 Stat 260 - Lecture 20 Recap of Last Class Last class we introduced the covariance and correlation between two jointly distributed random variables. Today: We will introduce the idea of a statistic and
Last week: Sample, population and sampling distributions finished with estimation & confidence intervals
 Past weeks: Measures of central tendency (mean, mode, median) Measures of dispersion (standard deviation, variance, range, etc). Working with the normal curve Last week: Sample, population and sampling
Statistical Methods for Astronomy
 Statistical Methods for Astronomy Probability (Lecture 1) Statistics (Lecture 2) Why do we need statistics? Useful Statistics Definitions Error Analysis Probability distributions Error Propagation Binomial
Dr. Junchao Xia Center of Biophysics and Computational Biology. Fall /13/2016 1/33
 BIO5312 Biostatistics Lecture 03: Discrete and Continuous Probability Distributions Dr. Junchao Xia Center of Biophysics and Computational Biology Fall 2016 9/13/2016 1/33 Introduction In this lecture,
STAT 513 fa 2018 Lec 02
 STAT 513 fa 2018 Lec 02 Inference about the mean and variance of a Normal population Karl B. Gregory Fall 2018 Inference about the mean and variance of a Normal population Here we consider the case in
Gov 2000: 6. Hypothesis Testing
 Gov 2000: 6. Hypothesis Testing Matthew Blackwell October 11, 2016 1 / 55 1. Hypothesis Testing Examples 2. Hypothesis Test Nomenclature 3. Conducting Hypothesis Tests 4. p-values 5. Power Analyses 6.
Data analysis and Geostatistics - lecture VII
 Data analysis and Geostatistics - lecture VII t-tests, ANOVA and goodness-of-fit Statistical testing - significance of r Testing the significance of the correlation coefficient: t = r n - 2 1 - r 2 with
Null Hypothesis Significance Testing p-values, significance level, power, t-tests Spring 2017
 Null Hypothesis Significance Testing p-values, significance level, power, t-tests 18.05 Spring 2017 Understand this figure f(x H 0 ) x reject H 0 don t reject H 0 reject H 0 x = test statistic f (x H 0
Estimating the accuracy of a hypothesis Setting. Assume a binary classification setting
 Estimating the accuracy of a hypothesis Setting Assume a binary classification setting Assume input/output pairs (x, y) are sampled from an unknown probability distribution D = p(x, y) Train a binary classifier
Last two weeks: Sample, population and sampling distributions finished with estimation & confidence intervals
 Past weeks: Measures of central tendency (mean, mode, median) Measures of dispersion (standard deviation, variance, range, etc). Working with the normal curve Last two weeks: Sample, population and sampling
Smoking Habits. Moderate Smokers Heavy Smokers Total. Hypertension No Hypertension Total
 Math 3070. Treibergs Final Exam Name: December 7, 00. In an experiment to see how hypertension is related to smoking habits, the following data was taken on individuals. Test the hypothesis that the proportions
Confidence Intervals. Confidence interval for sample mean. Confidence interval for sample mean. Confidence interval for sample mean
 Confidence Intervals Confidence interval for sample mean The CLT tells us: as the sample size n increases, the sample mean is approximately Normal with mean and standard deviation Thus, we have a standard
STA Module 10 Comparing Two Proportions
 STA 2023 Module 10 Comparing Two Proportions Learning Objectives Upon completing this module, you should be able to: 1. Perform large-sample inferences (hypothesis test and confidence intervals) to compare
Class 19. Daniel B. Rowe, Ph.D. Department of Mathematics, Statistics, and Computer Science. Marquette University MATH 1700
 Class 19 Daniel B. Rowe, Ph.D. Department of Mathematics, Statistics, and Computer Science Copyright 2017 by D.B. Rowe 1 Agenda: Recap Chapter 8.3-8.4 Lecture Chapter 8.5 Go over Exam. Problem Solving
2.3 Analysis of Categorical Data
 90 CHAPTER 2. ESTIMATION AND HYPOTHESIS TESTING 2.3 Analysis of Categorical Data 2.3.1 The Multinomial Probability Distribution A mulinomial random variable is a generalization of the binomial rv. It results
The t-test Pivots Summary. Pivots and t-tests. Patrick Breheny. October 15. Patrick Breheny Biostatistical Methods I (BIOS 5710) 1/18
 1/18") and t-tests Patrick Breheny October 15 Patrick Breheny Biostatistical Methods I (BIOS 5710) 1/18 Introduction The t-test As we discussed previously, W.S. Gossett derived the t-distribution as a way of
and t-tests Patrick Breheny October 15 Patrick Breheny Biostatistical Methods I (BIOS 5710) 1/18 Introduction The t-test As we discussed previously, W.S. Gossett derived the t-distribution as a way of
Introduction to Statistical Data Analysis Lecture 3: Probability Distributions
 Introduction to Statistical Data Analysis Lecture 3: Probability Distributions James V. Lambers Department of Mathematics The University of Southern Mississippi James V. Lambers Statistical Data Analysis
Frequency table: Var2 (Spreadsheet1) Count Cumulative Percent Cumulative From To. Percent <x<=
 Count Cumulative Percent Cumulative From To. Percent <x<=") A frequency distribution is a kind of probability distribution. It gives the frequency or relative frequency at which given values have been observed among the data collected. For example, for age, Frequency
A frequency distribution is a kind of probability distribution. It gives the frequency or relative frequency at which given values have been observed among the data collected. For example, for age, Frequency
Statistical Inference. Why Use Statistical Inference. Point Estimates. Point Estimates. Greg C Elvers
 Statistical Inference Greg C Elvers 1 Why Use Statistical Inference Whenever we collect data, we want our results to be true for the entire population and not just the sample that we used But our sample
Statistical distributions: Synopsis
 Statistical distributions: Synopsis Basics of Distributions Special Distributions: Binomial, Exponential, Poisson, Gamma, Chi-Square, F, Extreme-value etc Uniform Distribution Empirical Distributions Quantile
Chapter 7: Theoretical Probability Distributions Variable - Measured/Categorized characteristic
 BSTT523: Pagano & Gavreau, Chapter 7 1 Chapter 7: Theoretical Probability Distributions Variable - Measured/Categorized characteristic Random Variable (R.V.) X Assumes values (x) by chance Discrete R.V.
Chapter 3 Common Families of Distributions
 Lecture 9 on BST 631: Statistical Theory I Kui Zhang, 9/3/8 and 9/5/8 Review for the previous lecture Definition: Several commonly used discrete distributions, including discrete uniform, hypergeometric,
GOV 2001/ 1002/ E-2001 Section 3 Theories of Inference
 GOV 2001/ 1002/ E-2001 Section 3 Theories of Inference Solé Prillaman Harvard University February 11, 2015 1 / 48 LOGISTICS Reading Assignment- Unifying Political Methodology chs 2 and 4. Problem Set 3-
Purposes of Data Analysis. Variables and Samples. Parameters and Statistics. Part 1: Probability Distributions
 Part 1: Probability Distributions Purposes of Data Analysis True Distributions or Relationships in the Earths System Probability Distribution Normal Distribution Student-t Distribution Chi Square Distribution
As an example, consider the Bond Strength data in Table 2.1, atop page 26 of y1 y 1j/ n , S 1 (y1j y 1) 0.
 0.") INSY 7300 6 F01 Reference: Chapter of Montgomery s 8 th Edition Point Estimation As an example, consider the Bond Strength data in Table.1, atop page 6 of By S. Maghsoodloo Montgomery s 8 th edition, on
INSY 7300 6 F01 Reference: Chapter of Montgomery s 8 th Edition Point Estimation As an example, consider the Bond Strength data in Table.1, atop page 6 of By S. Maghsoodloo Montgomery s 8 th edition, on
Introduction to Statistical Data Analysis Lecture 5: Confidence Intervals
 Introduction to Statistical Data Analysis Lecture 5: Confidence Intervals James V. Lambers Department of Mathematics The University of Southern Mississippi James V. Lambers Statistical Data Analysis 1
Inference for Proportions, Variance and Standard Deviation
 Inference for Proportions, Variance and Standard Deviation Sections 7.10 & 7.6 Cathy Poliak, Ph.D. cathy@math.uh.edu Office Fleming 11c Department of Mathematics University of Houston Lecture 12 Cathy
Normal (Gaussian) distribution The normal distribution is often relevant because of the Central Limit Theorem (CLT):
 distribution The normal distribution is often relevant because of the Central Limit Theorem (CLT):") Lecture Three Normal theory null distributions Normal (Gaussian) distribution The normal distribution is often relevant because of the Central Limit Theorem (CLT): A random variable which is a sum of many
Lecture Three Normal theory null distributions Normal (Gaussian) distribution The normal distribution is often relevant because of the Central Limit Theorem (CLT): A random variable which is a sum of many
Chapter 3. Discrete Random Variables and Their Probability Distributions
 Chapter 3. Discrete Random Variables and Their Probability Distributions 1 3.4-3 The Binomial random variable The Binomial random variable is related to binomial experiments (Def 3.6) 1. The experiment
STAT509: Discrete Random Variable
 University of South Carolina September 16, 2014 Motivation So far, we have already known how to calculate probabilities of events. Suppose we toss a fair coin three times, we know that the probability
STT 315 Problem Set #3
 1. A student is asked to calculate the probability that x = 3.5 when x is chosen from a normal distribution with the following parameters: mean=3, sd=5. To calculate the answer, he uses this command: >
Probability Distribution
 Economic Risk and Decision Analysis for Oil and Gas Industry CE81.98 School of Engineering and Technology Asian Institute of Technology January Semester Presented by Dr. Thitisak Boonpramote Department
Courtesy of Jes Jørgensen
 Courtesy of Jes Jørgensen Testing Models 3 May 2016 Science is all about models Use physical mechanisms to predict outcomes Test the outcomes in order to test our understanding of the physics Science is
FYST17 Lecture 8 Statistics and hypothesis testing. Thanks to T. Petersen, S. Maschiocci, G. Cowan, L. Lyons
 FYST17 Lecture 8 Statistics and hypothesis testing Thanks to T. Petersen, S. Maschiocci, G. Cowan, L. Lyons 1 Plan for today: Introduction to concepts The Gaussian distribution Likelihood functions Hypothesis
Review for the previous lecture
 Lecture 1 and 13 on BST 631: Statistical Theory I Kui Zhang, 09/8/006 Review for the previous lecture Definition: Several discrete distributions, including discrete uniform, hypergeometric, Bernoulli,
This gives us an upper and lower bound that capture our population mean.
 Confidence Intervals Critical Values Practice Problems 1 Estimation 1.1 Confidence Intervals Definition 1.1 Margin of error. The margin of error of a distribution is the amount of error we predict when
Power Analysis. Introduction to Power
 Power Analysis Dr. J. Kyle Roberts Southern Methodist University Simmons School of Education and Human Development Department of Teaching and Learning When testing a specific null hypothesis (H 0 ), we
Calculus with Algebra and Trigonometry II Lecture 21 Probability applications
 Calculus with Algebra and Trigonometry II Lecture 21 Probability applications Apr 16, 215 Calculus with Algebra and Trigonometry II Lecture 21Probability Apr applications 16, 215 1 / 1 Histograms The distribution
Visual interpretation with normal approximation
 Visual interpretation with normal approximation H 0 is true: H 1 is true: p =0.06 25 33 Reject H 0 α =0.05 (Type I error rate) Fail to reject H 0 β =0.6468 (Type II error rate) 30 Accept H 1 Visual interpretation
Two Sample Problems. Two sample problems
 Two Sample Problems Two sample problems The goal of inference is to compare the responses in two groups. Each group is a sample from a different population. The responses in each group are independent
Multivariate Distributions
 Copyright Cosma Rohilla Shalizi; do not distribute without permission updates at http://www.stat.cmu.edu/~cshalizi/adafaepov/ Appendix E Multivariate Distributions E.1 Review of Definitions Let s review
STAT Chapter 9: Two-Sample Problems. Paired Differences (Section 9.3)
") STAT 515 -- Chapter 9: Two-Sample Problems Paired Differences (Section 9.3) Examples of Paired Differences studies: Similar subjects are paired off and one of two treatments is given to each subject in
STAT 515 -- Chapter 9: Two-Sample Problems Paired Differences (Section 9.3) Examples of Paired Differences studies: Similar subjects are paired off and one of two treatments is given to each subject in
T.I.H.E. IT 233 Statistics and Probability: Sem. 1: 2013 ESTIMATION AND HYPOTHESIS TESTING OF TWO POPULATIONS
 ESTIMATION AND HYPOTHESIS TESTING OF TWO POPULATIONS In our work on hypothesis testing, we used the value of a sample statistic to challenge an accepted value of a population parameter. We focused only
Null Hypothesis Significance Testing p-values, significance level, power, t-tests
 Null Hypothesis Significance Testing p-values, significance level, power, t-tests 18.05 Spring 2014 January 1, 2017 1 /22 Understand this figure f(x H 0 ) x reject H 0 don t reject H 0 reject H 0 x = test
Chapter 1 Statistical Reasoning Why statistics? Section 1.1 Basics of Probability Theory
 Chapter 1 Statistical Reasoning Why statistics? Uncertainty of nature (weather, earth movement, etc. ) Uncertainty in observation/sampling/measurement Variability of human operation/error imperfection
Discrete Probability distribution Discrete Probability distribution
 438//9.4.. Discrete Probability distribution.4.. Binomial P.D. The outcomes belong to either of two relevant categories. A binomial experiment requirements: o There is a fixed number of trials (n). o On
Given a experiment with outcomes in sample space: Ω Probability measure applied to subsets of Ω: P[A] 0 P[A B] = P[A] + P[B] P[AB] = P(AB)
![Given a experiment with outcomes in sample space: Ω Probability measure applied to subsets of Ω: P[A] 0 P[A B] = P[A] + P[B] P[AB] = P(AB)](/thumbs/85/93046753.jpg "Given a experiment with outcomes in sample space: Ω Probability measure applied to subsets of Ω: P[A] 0 P[A B] = P[A] + P[B] P[AB] = P(AB)") 1 16.584: Lecture 2 : REVIEW Given a experiment with outcomes in sample space: Ω Probability measure applied to subsets of Ω: P[A] 0 P[A B] = P[A] + P[B] if AB = P[A B] = P[A] + P[B] P[AB] P[A] = 1 P[A
1 16.584: Lecture 2 : REVIEW Given a experiment with outcomes in sample space: Ω Probability measure applied to subsets of Ω: P[A] 0 P[A B] = P[A] + P[B] if AB = P[A B] = P[A] + P[B] P[AB] P[A] = 1 P[A
Are data normally normally distributed?
 Standard Normal Image source Are data normally normally distributed? Sample mean: 66.78 Sample standard deviation: 3.37 (66.78-1 x 3.37, 66.78 + 1 x 3.37) (66.78-2 x 3.37, 66.78 + 2 x 3.37) (66.78-3 x
Binomial random variable
 Binomial random variable Toss a coin with prob p of Heads n times X: # Heads in n tosses X is a Binomial random variable with parameter n,p. X is Bin(n, p) An X that counts the number of successes in many