Luminescence characterization of a sodium rich feldspar
|
|
|
- Vincent Lane
- 6 years ago
- Views:
Transcription
1 Luminescence characterization of a sodium rich feldspar V.Correcher*, J.Garcia-Guinea, L.Sanchez-Muñoz and T. Rivera CIEMAT,Av. Complutense 22, 28040, Madrid, Spain. MNCN-CSIC, c/ J. Gutierrez Abascal 2 Madrid 28006, Spain. CICATA-IPN. Av Legaria 694, Mexico City, DF Mexico Corresponding Author: V. Correcher. v.correcher@ciemat.es We herein report on the radioluminescence and thermoluminescence properties of a Sodium rich feldspar ((Na,K)[AlSi 3 O 8 ]) with a mean molecular composition of orthoclase (Or) and Albite (Ab) of Or 1 Ab 99. Despite the complexity of the luminescence emissions of the sample, it is possible to determine six different emission bands at about 300, 380, 420, 460, 550 and 680 nm. The 300 nm emission can be associated to structural defects related to the recombination process in which the diffusion of Na ions is involved. The UV-blue emission bands have the following features: (i) the 380 nm, typical of mineral phases containing SiO 4 groups, is related to intrinsic defects in the lattice; (ii) the 420 nm band is associated to the presence of Cu (II) ions close to the hole traps or the recombination on a centre formed from a hole-oxygen atom adjacent to two Aluminium atoms (Al-O-Al) and (iii) the 460 nm waveband is due to the presence of Ti 4+. The green and red emissions are respectively associated to the presence of Mn 2+ and Fe 3+ ions. The ratio between the relative intensities, peaked at 290 (the more intense waveband) and 550 nm is about 10 for both TL and RL, which implies that the efficiency of recombination centres does not change regardless of the type of the process. Keywords: Radioluminescence, Thermoluminescence, Na-rich feldspar, spectral emission. 1
2 1. Introduction Both radioluminescence (RL) and thermoluminescence (TL) emissions from mineral phases are usually employed in luminescence dating [1,2], retrospective dosimetry [3], material characterization [4] and detection of irradiated food [5]. Among them, quartz and feldspars are suitable materials since they exhibit (i) sensitivity to radiation, (ii) high reproducibility of the luminescence response, (iii) good dose-luminescence linearity in the ranges of interest (up to 100 Gy) and (iv) high stability of the luminescence signal after long time of storage [3]. In addition, they are ubiquitous not only in nature, but also as a part of man-made objects (e.g. electrode coatings [6]) and appear as a reasonable alternative to the conventional dosimetric systems, if necessary. Basically, TL provides information about the trapped charge recombination sites related to metastable defects inside the lattice that depend on the trapping-detrapping processes during the heating readout. For this purpose, one assumes that the lattice structure and the luminescence spectrum do not change significantly in the temperature range where the charge is released from a particular deep trapping level [1]. RL with x-rays is a sensitive method for obtaining information about the efficiency of recombination centres rather than shallow traps [7]. All the properties involved in the luminescence phenomena (i.e. lifetime, efficiency, emission spectra, etc.) depend directly on the crystalline phase, which is mainly influenced by pressure and temperature. Thus, small changes in the lattice structure due to the presence of inclusions, impurities, substituted ions or surface defects in ppm concentrations reveal changes in the intensity and wavelength position of the emission spectra. This research focuses on the study of the RL and TL spectra of a well-characterised Sodium rich feldspar in the range of nm. 2
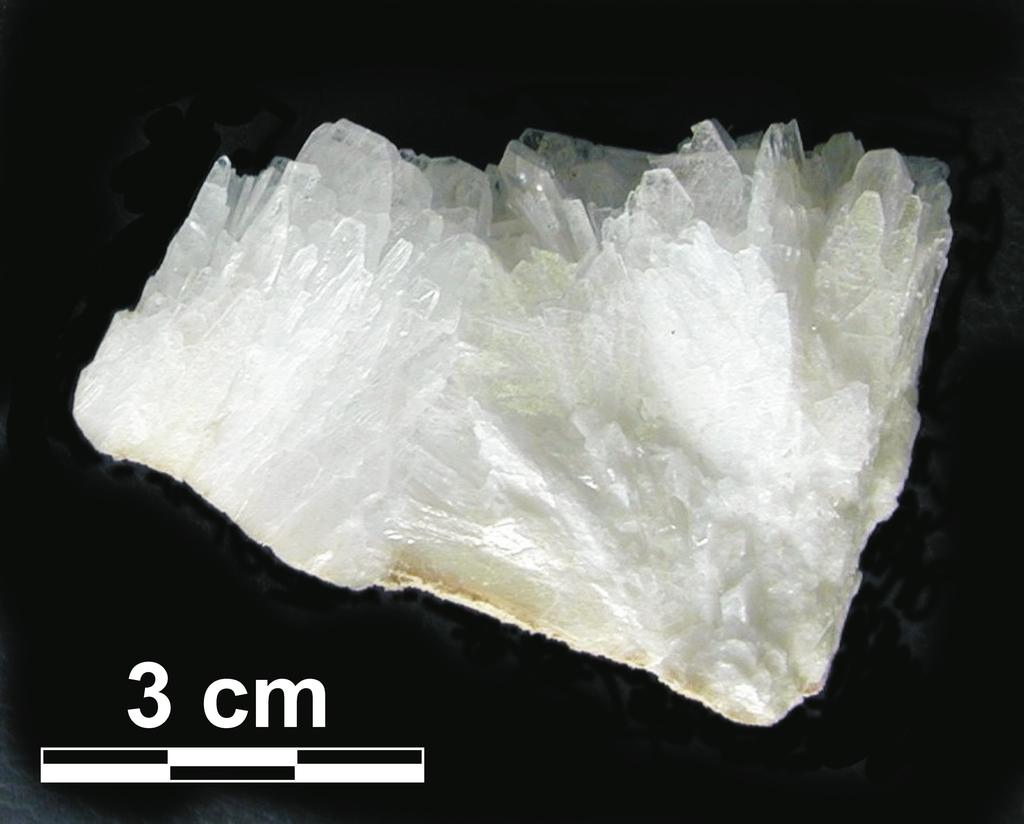
3 2. Materials and Methods a) Sample characterization Measurements were carried out on a natural Albite sample collected in Minas Gerais, Brazil (Fig 1). The sample, a Sodium rich feldspar ((Na,K)[AlSi 3 O 8 ]) with a mean molecular composition of Orthoclase (Or) and Albite (Ab) of Or 1 Ab 99, has been elementary analysed by x-ray fluorescence (XRF) using a PHILIPS PW-1404 with an Sc-Mo tube with analyser crystals of Ge, LIF220, LIF200, PE and TLAP. A Super-Q manager (Panalytical-Spain) was used as the analytical software (Table 1). Three pellets of 8 g of milled sample with 0.1 g of an acryl type resin (Elbacite 2045, produced by E.I. Dupont de Nemours Co., Ltd.) were pressed under kg (about 2000 kg/cm 2 ) and dried at 40ºC in an atmospheric chamber. Trace elements were analyzed by a Finnigan MAT SOLA (Finnigan MAT, Bremen, Germany) plasma source mass spectrometer (ICP-MS). Each sample was introduced into MHz argon plasma using a Meinhard concentric nebulizer and a Gilson Minipuls 2 peristaltic pump. The instrument was calibrated using pure NIST traceable single-element stock solutions, supplied by Alfa Products Ltd., (Karlsruhe, Germany) (Table 2). b) Luminescence measurements Luminescence spectra were obtained from cleaved chips of 3x3x2 mm 3 ( 5 mg) of eight aliquots of the Albite sample mounted with silicone oil onto Aluminium discs using the spectrometer of Sussex University. The samples were not mechanically treated to avoid triboluminescence processes [8]. Signals were recorded over the nm wavelength range, with a resolution of 5 nm for 100 channel spectra, and 3 nm for 200 channel spectra. All signals were corrected for the spectral response of the system. The RL was obtained during excitation of the samples with 50Gy of x-rays employing a Phillips MG MCN 101 x- ray tube with a current of 15 ma and a voltage of 25 kv delivering a dose rate of 10 Gy min -1 to the sample. TL measurements of mineral coatings were made in the Sussex (UK) TL 3
4 spectrometer. High sensitivity results from the use of wavelength multiplied detection via a pair of spectrometers, with gratings blazed for the UV-blue (200nm-450nm) and blue-greenred (400nm-800nm) parts of the spectrum, and a pair of position-sensitive photomultiplier tubes [9]. Signals were recorded over the wavelength range 200nm to 800nm, with a resolution of 5nm for 100 channel spectra, and 3nm for 200 channel spectra, and all signals were corrected for the spectral response of the system. Because of second order diffraction, signals beyond 780nm are artifacts of the apparatus if there are also strong signals near 390nm. Sample processing and measurements were made under red light to avoid the transfer of the trapped electrons from the semi-stable sites into hole centres (including luminescence centres) due to light sensitivity. The experimental spectral data of the RL and TL analyses were fitted with six multiparameter gaussian functions using the Peak Fit program (supplied by Jandel Scientific Software). 3. Results and Discussion As illustrated in Fig 2 and 3, the TL and RL spectra obtained from the Albite samples in the range of UV-IR exhibits a very complex structure that can be deconvoluted into six overlapping Gaussian peaks. The number of peaks has been chosen based on the following three criteria: (i) the first derivatives of the intensity with respect to the wavelength (di/dλ) are zero, (ii) the value of the correlation coefficient that mathematically indicates the quality of fitting (Table 3) is a maximum, and (iii) it is possible to assign to a given emission a physical meaning. In this sense, it is possible to identify six emission bands peaked at 300, 380, 420, 460, 550 and 680 nm in both TL and RL, which indicate that regardless of the luminescence process involved, they have a common origin. 4
5 The TL and RL spectra of all the analysed samples (four spectra each) displays a similar behaviour, namely the emission peaked at 300 nm is the more intense waveband. The intensity of this maximum is ten times higher than that of the green emission, the second waveband in intensity and is more than 80% of the relative intensity. This fact can be appreciated in Table 3, where the parameters for the fitting procedure, peak numbers, energy values (in ev) and the corresponding standard deviations 1σ (SD) are shown. The uncertainties represent the precision (1σ) of the mean value of the luminescence response of four replicates each and all the analysed parameters (i.e. position, width, integrated area and relative intensity of the peaks) were refined to a confidence limit of 95% accuracy using an iterative process. This UV band is related to defect-sites associated with the presence of the Sodium atoms in the Potassium aluminosilicate lattice [10, 11]. This maximum is the most important signal in Na-rich feldspars and is potentially useful for retrospective dosimetry [12]. The 380nm UV emission band is characteristic of mineral phases containing SiO 4 groups (quartz and silicates) and can be related to intrinsic defects in the lattice [10,13]. This waveband is a well-studied emission and is observed when interstitial alkalis lay in adjacent positions to aluminium ions; it can be also employed in the fields of UV-dosimetry [14,15] and retrospective dosimetry [12]. The 430nm emission (common to several feldspars with different chemical compositions and variable Al/Si order) can be due to either to the recombination on a centre formed from a hole-oxygen atom adjacent to two Al atoms (Al-O- Al) [16] or to the presence of Cu (II) ions placed next to the hole traps [17], detected in this sample in amounts of ppm (6 ppm). Finally, the 480nm band can be assigned to the presence of Ti 4+ [13] (0.09% in this sample). In the first case, the minor changes detected can be mainly associated with the modifications in other peaks, rather than to structural changes (displacements of the atoms due to the presence of vacancies or impurities) in recombination centres (Al-O-Al). The green band at 550nm is quite common in all strain-free alkali K- 5
6 aluminosilicates; being attributed to Mn 2+ substitutions in Calcium sites in the lattice, both in natural and synthesized feldspars. This band seems to be characteristic of a d 5 electronic configuration [18]. According to the chemical analysis, the content of Mn 2+ is 0.02% in the sample here studied. The 680nm waveband is produced when the irradiation reduces some Fe 3+ into Fe 2+ impurities [19]. In the aluminosilicate lattice, some Si (tetrahedrally coordinated) or Al sites can be substituted for Fe 3+, acting as recombination sites either for holes or electrons. When Fe 3+ is placed on the T 1 site (in ordered feldspars) the emission is produced in the visible red region, but if it is included in a disordered lattice the emission is in the IR region [20]. T 1 is one of the four-membered rings of tetrahedra parallel to the (100) plane in an Albite structure. For this reason, it should be possible to associate the position of this emission band with the structural state of feldspar. 4. Conclusions Similarly as in other alkali feldspars, the emission spectra bands of a well-characterised Narich feldspar here studied exhibit emission bands at 300, 380, 420, 460, 550 and 680 nm that can be attributed to structural and point defects. Thus, the emission peaked at lower wavelengths (290nm) is associated to structural defects located in the twin-domain boundaries related to the recombination process in which the diffusion of Na ions is involved. The UV-blue emission waveband have these properties: (i) the 380 nm is characteristic of mineral phases containing SiO 4 tetrahedral and is related to intrinsic defects in the lattice; (ii) the 420 nm band is linked to the presence of Cu (II) ions placed next to the hole traps or the recombination on a centre formed from a hole-oxygen atom adjacent to two Al atoms (Al-O- Al) and (iii) the 460 nm waveband is due to the presence of Ti 4+. The low intensity green and red emissions are associated, respectively, to the presence of Mn 2+ and Fe 3+ ions. The 6
7 multiple emission spectra described by six dominant wavebands for Albite show that the same recombination centers are active independently of the applied process: TL or RL. 5. Acknowledgements We are grateful to Prof. Dr. P.D. Townsend for the analyses in the high sensitivity spectrometer of Sussex (UK). This work has been supported by the C.I.C.Y.T. CGL /BTE and Comunidad Autonoma de Madrid (CAM) MATERNAS (S- 0505/MAT/0094) projects. Thanks are also given to Paul Giblin for the critical review of the manuscript. 6. References [1] McKeever S. W. S., (1985) Thermoluminescence of solids. Cambridge University Press, New York. [2] M.R. Krbetschek, J. Gotze, A. Dietrich and T. Trautmann, Radiat. Meas. 27, 695 (1997). [3] V. Correcher, J.M. Gomez-Ros and J. Garcia-Guinea, Radiat. Meas. 38(4-6) 689 (2004) [4] V. Correcher, J. Garcia-Guinea, P. Lopez-Arce and J.M. Gomez-Ros, Spectrochim. Acta A. 60(7) 1431 (2004) [5] V. Correcher, J.L. Muñiz and J.M. Gomez-Ros, J. Sci. Food Agric. 76(2) 149 (1998). 7
8 [6] J. Garcia-Guinea, V. Correcher, M. Lombardero and R. Gonzalez-Martin, Int. J. Environ. Heal. Res. 14(4) 285 (2004). [7] V. Correcher and J. Garcia-Guinea. J. Lumin., 93(4) 303 (2001). [8] J. Garcia-Guinea and V. Correcher, Spectrosc. Lett. 33(1) 103 (2000). [9] B.J. Luff and P.D. Townsend, Meas. Sci. Technol (1993) [10] J. Garcia-Guinea, P.D. Townsend, L. Sanchez-Muñoz and J.M. Rojo, Phys. Chem. Miner (1999). [11] L. Sanchez-Munoz, J. Garcia-Guinea, J. Sanz, V. Correcher and A. Delgado, Chem. Mater. 18 (14) 3336 (2006 ) [12] V.Correcher, J.M. Gomez-Ros and A. Delgado, Radiat. Prot. Dosim. 84(1-4) 547 (1999). [13] M.L. Clarke and H.M. Rendell, Radiat. Meas. 27(2), 221 (1997) [14] J. Garcia-Guinea, V. Correcher and A. Delgado, J. Mater. Sci. Lett. 18(15) 1263 (1999). [15] J. Garcia-Guinea, F. Pitalua, V. Correcher, L. Sanchez-Munoz, F.J. Valle-Fuentes and P. Lopez-Arce, Bol. Soc. Esp. Ceram. V. 43(2) 115 (2004) 8
9 [16] B. Speit and G. Lehmann, J. Lumin., 27, 127 (1982) [17] H.M. Rendell, M.R. Khanlary, P.D. Townsend, T. Calderon and B.J. Luff. Miner. Magaz (1993). [18] J.R. Prescott and P.J. Fox, J. Phys. D: Appl. Phys. 26, 2245 (1993). [19] Y. Kirsh and P.D. Townsend, Nucl. Tracks. Radiat. Meas. 14(1-2) 43 (1988). [20] A.A. Finch and J. Klein, Contrib. Mineral. Petr. 135(2-3) 234 (1999). 9
10 Table 1. Chemical composition of the analysed albite by x-ray fluorescence. Measurement is expressed in terms of oxide since the sample is prepared in oxidizing atmosphere. SiO 2 TiO 2 Al 2 O 3 MnO MgO CaO Na 2 O K 2 O P 2 O 5 Fe 2 O 3t Lost Ignition > Table 2. Concentration of the impurities (in ppm) in the albite sample measured by ICP-MS. Rb Ba Sr La Ce Y Th Cu Cr Mn Ni Table 3. Physical parameters estimated from TL and RL spectra obtained from the analyzed Na-rich feldspar. The curves were fitted by a sum of six Gaussian curves. Peak Number TL r Position (nm) 295±6 371±8 417±9 460±9 556±5 693±10 E (ev) 4.21± ± ± ± ± ±0.03 Intensity (a.u.) 466±21 19±2 12±3 6±2 24±3 8±2 Intensity (%) 87±2 3.6± ± ± ± ± Area 17822± ±91 532±69 237± ± ±113 Area (%) 78±3 5.6± ± ± ± ±0.5 FWHM * 36±3 62±4 41±6 36±4 75±9 125±10 RL Position (nm) 297±8 372±9 419±9 459±16 552±6 681±10 E (ev) 4.18± ± ± ± ± ±0.03 Intensity (a.u.) 353±11 24±3 16±3 9±3 30±3 7±3 Intensity (%) 80±2 5.5± ± ± ± ± Area 13819± ± ± ± ± ±98 Area(%) 71±3 7±1 4±1 1.9±0.6 12±1 4.3±0.5 FWHM * 37±2 51±4 44±6 37±5 74±10 104±10 * FWHM means Full Width at Half Maximum and r is the correlation coefficient of fitting of the sum of six Gaussian curves. 10
11 Figure 1.- Natural albite ((Na,K)[AlSi 3 O 8 ]) sample. Figure 2.- TL emission of albite fitted with six multiparameter gaussian functions. The dashed lines correspond to the calculated fitted gaussian peaks, which make up the calculated fitted solid line. The encircling line is directly compared with the experimental dotted line that corresponds to the mean value of the experimental results. Figure 3.- RL of the analysed Na-rich feldspar fitted with six multiparameter gaussian functions. The dashed lines correspond to the calculated fitted gaussian peaks, which make up the calculated fitted solid line. The encircling line is directly compared with the experimental dotted line that corresponds to the mean value of the experimental results. 11
12
13
14
OES - Optical Emission Spectrometer 2000
 OES - Optical Emission Spectrometer 2000 OES-2000 is used to detect the presence of trace metals in an analyte. The analyte sample is introduced into the OES-2000 as an aerosol that is carried into the
Thermoluminescence Properties of Local Feldspar from Gattar Mountain Area
 Thermoluminescence Properties of Local Feldspar from Gattar Mountain Area W. E. Madcour 1, M. A. El-Kolaly 1 and S.Y. Afifi 2 1 Radiation Protection Department, Nuclear Research Center, Atomic Energy Authority,
Thermoluminescent properties studies of spodumene lilac sample to dosimetric applications
 Journal of Physics: Conference Series Thermoluminescent properties studies of spodumene lilac sample to dosimetric applications To cite this article: L L Lima et al 21 J. Phys.: Conf. Ser. 249 1213 View
THERMOLUMINESCENCE PROPERTIES OF OLIVINE
 2011 International Nuclear Atlantic Conference - INAC 2011 Belo Horizonte,MG, Brazil, October 24-28, 2011 ASSOCIAÇÃO BRASILEIRA DE ENERGIA NUCLEAR - ABEN ISBN: 978-85-99141-04-5 THERMOLUMINESCENCE PROPERTIES
SIMULATION OF COMPETING FADING AND IRRADIATION EFFECTS IN THERMOLUMINESCENCE (TL) DOSIMETRY: 1 st ORDER KINETICS
 DOSIMETRY: 1 st ORDER KINETICS") IMULATION OF COMPETING FADING AND IRRADIATION EFFECT IN THERMOLUMINECENCE (TL) DOIMETRY: 1 st ORDER KINETIC C.Furetta 1, J.Azorin 1, T.Rivera 1, G.Kitis 2 1. Dep.to de Fisica, Edif. T, cub. 331 Universidad
IMULATION OF COMPETING FADING AND IRRADIATION EFFECT IN THERMOLUMINECENCE (TL) DOIMETRY: 1 st ORDER KINETIC C.Furetta 1, J.Azorin 1, T.Rivera 1, G.Kitis 2 1. Dep.to de Fisica, Edif. T, cub. 331 Universidad
A4 CAI COMPOSITION: DIVALENT ELEMENT PARTITIONING AND CATHODOLUMINESCENCE. A4.1 Anorthite and Melt compositions for Synthetic CAI Composition 224SAM
 147 A4 CAI COMPOSITION: DIVALENT ELEMENT PARTITIONING AND CATHODOLUMINESCENCE A4.1 Anorthite and Melt compositions for Synthetic CAI Composition 224SAM Anorthite-melt partitioning of divalent elements
ICP-3000 Inductively Coupled Plasma Optical Emission Spectrometer
 Inductively Coupled Plasma Optical Emission Spectrometer Inductively Coupled Plasma Optical Emission Spectrometer Inductively Coupled Plasma Optical Emission Spectrometer is powerful simultaneous full
The Villalbeto de la Pefia Meteorite: Raman Spectroscopy and Cathodoluminescence of Feldspar
 The Villalbeto de la Pefia Meteorite: Raman Spectroscopy and Cathodoluminescence of Feldspar Garcia-Guineaa, J., L. Sanchez-Munoz b, J. L. Tormoa, E. Crespo-Feoa, J. Ruiz-Perezc, AI. Martin-Herrero d,
A quantitative kinetic model foral 2 O 3 :C: TL response to ionizing radiation
 Radiation Measurements 42 (2007) 198 204 www.elsevier.com/locate/radmeas A quantitative kinetic model foral 2 O 3 :C: TL response to ionizing radiation V. Pagonis a,, R. Chen b, J.L. Lawless c a Physics
The Investigation of the Thermoluminescence Emission Bands of LiF:Mg,Ti (TLD-100) by a Simple Developed Model
 by a Simple Developed Model") Turk J Phys 25 (2001), 333 343. c TÜBİTAK The Investigation of the Thermoluminescence Emission Bands of LiF:Mg,Ti (TLD-100) by a Simple Developed Model A. N. YAZICI, Z. ÖZTÜRK, M. BEDİR University of Gaziantep,
Turk J Phys 25 (2001), 333 343. c TÜBİTAK The Investigation of the Thermoluminescence Emission Bands of LiF:Mg,Ti (TLD-100) by a Simple Developed Model A. N. YAZICI, Z. ÖZTÜRK, M. BEDİR University of Gaziantep,
Analysis Repeatability of Trace and Major Elements in a Water Sample
 Analysis Repeatability of Trace and Major Elements in a Water Sample Agnès COSNIER HORIBA Scientific Longjumeau, France Keywords: environment Elements: Al, As, B, Ba, Ca, Cd, Co, Cr, Cu, Fe, Hg, K, Li,
APPENDIX TABLES. Table A2. XRF analytical results for samples from drill hole AP5 (Areachap)
") APPENDIX TABLES Table A2. XRF analytical results for samples from drill hole AP5 (Areachap) Sample No. AP5/19 AP5/20 AP5/21 AP5/22 AP5/23 AP5/24 AP5/25AP5/26AP5/27AP5/28AP5/29AP5/30AP5/31AP5/32 AP5/33
APPENDIX TABLES Table A2. XRF analytical results for samples from drill hole AP5 (Areachap) Sample No. AP5/19 AP5/20 AP5/21 AP5/22 AP5/23 AP5/24 AP5/25AP5/26AP5/27AP5/28AP5/29AP5/30AP5/31AP5/32 AP5/33
XUV 773: X-Ray Fluorescence Analysis of Gemstones
 Fischer Application report vr118 HELM UT FISCHER GMBH + CO. KG Institut für Elektronik und Messtechnik Industriestrasse 21-7169 Sindelfingen, Germany Tel.: (+49) 731 33- - Fax: (+49) 731 33-79 E-Mail:
PUBLISHED VERSION.
 PUBLISHED VERSION Kalnins, Christopher Andris Gregory; Spooner, Nigel Antony; Ebendorff-Heidepriem, Heike; Monro, Tanya Mary Luminescent properties of fluoride phosphate glass for radiation dosimetry Optical
A quantitative kinetic model for Al 2 O 3 :C: TL response to UV-illumination
 Radiation Measurements 43 (2008) 175 179 www.elsevier.com/locate/radmeas A quantitative kinetic model for Al 2 O 3 :C: TL response to UV-illumination V. Pagonis a,, R. Chen b, J.L. Lawless c a Physics
Partial Energy Level Diagrams
 Partial Energy Level Diagrams 460 nm 323 nm 610 nm 330 nm 819 nm 404 nm 694 nm 671 nm 589 / 590 nm 767 / 769 nm Lithium Sodium Potassium Gas Mixtures Maximum Temperatures, C Air-Coal Gas 1825 Air-Propane
Summary of test results for Daya Bay rock samples. by Patrick Dobson Celia Tiemi Onishi Seiji Nakagawa
 Summary of test results for Daya Bay rock samples by Patrick Dobson Celia Tiemi Onishi Seiji Nakagawa October 2004 Summary A series of analytical tests were conducted on a suite of granitic rock samples
AC CONDUCTIVITY AND DIELECTRIC RELAXATION STUDIES OF SANDSTONE- A CORRELATION WITH ITS THERMOLUMINESCENCE
 Journal of Ovonic Research Vol. 4, No. 2, April 2008, p. 35-42 AC CONDUCTIVITY AND DIELECTRIC RELAXATION STUDIES OF SANDSTONE- A CORRELATION WITH ITS THERMOLUMINESCENCE Tanmoy Roy Choudhury *, Amitabha
In-Situ Analysis of Traces, Minor and Major Elements in Rocks and Soils with a Portable XRF Spectrometer*
 In-Situ Analysis of Traces, Minor and Major Elements in Rocks and Soils with a Portable XRF Spectrometer* Anthony Thomas 1, Joachim Heckel 1, and Dirk Wissmann 1 Search and Discovery Article #41836 (2016)
Optically stimulated luminescence from quartz measured using the linear modulation technique
 Radiation Measurements 32 (2000) 407±411 www.elsevier.com/locate/radmeas Optically stimulated luminescence from quartz measured using the linear modulation technique E. Bulur a, L. Bùtter-Jensen a, *,
CALCULATION OF THE DETECTOR-CONTRIBUTION TO ZIRCONIUM PEAKS IN EDXRF SPECTRA OBTAINED WITH A SI-DRIFT DETECTOR
 CALCULATION OF THE DETECTOR-CONTRIBUTION TO ZIRCONIUM PEAKS IN EDXRF SPECTRA OBTAINED WITH A SI-DRIFT DETECTOR A. C. Neiva 1, J. N. Dron 1, L. B. Lopes 1 1 Escola Politécnica da Universidade de São Paulo
Quartz glow-peaks lifetime analysis : Tl glow-curve deconvolution functions for first order of kinetic compared to Initial Rise Method
 1 Quartz glow-peaks lifetime analysis : Tl glow-curve deconvolution functions for first order of kinetic compared to Initial Rise Method A. J. F. RATOVONJANAHARY, R. RABOANARY, RAOELINA ANDRIAMBOLOLONA
PFC/JA Precision Measurements of the Wavelengths of Emission Lines of Mg-like and Na-like Kv in Alcator C Plasmas
 PFC/JA-86-43 Precision Measurements of the Wavelengths of Emission Lines of Mg-like and Na-like Kv in Alcator C Plasmas K. Kondo, J.L. Terry, J. E. Rice, E. S. Marmar Plasma Fusion Center Massachusetts
Modelling thermal activation characteristics of the sensitization of thermoluminescence in quartz
 INSTITUTE OF PHYSICS PUBLISHING JOURNAL OF PHYSICS D: APPLIED PHYSICS J. Phys. D: Appl. Phys. () 1 PII: S-77()879- Modelling thermal activation characteristics of the sensitization of thermoluminescence
February 20, Joe Cerniglia The International Group for Historic Aircraft Recovery (TIGHAR) Job Number: S0CHG688. Dear Joe:
 Job Number: S0CHG688. Dear Joe:") February 20, 2012 Joe Cerniglia The International Group for Historic Aircraft Recovery (TIGHAR) Subject: ICP-MS Report Job Number: S0CHG688 Dear Joe: Please find enclosed the procedure report for the analysis
February 20, 2012 Joe Cerniglia The International Group for Historic Aircraft Recovery (TIGHAR) Subject: ICP-MS Report Job Number: S0CHG688 Dear Joe: Please find enclosed the procedure report for the analysis
Fast Analysis of Water Samples Comparing Axially-and Radially- Viewed CCD Simultaneous ICP-OES
 Fast Analysis of Water Samples Comparing Axially-and Radially- Viewed CCD Simultaneous ICP-OES Application Note Inductively Coupled Plasma-Optical Emission Spectrometers Author Tran T. Nham Introduction
Multi Analyte Custom Grade Solution. Aluminum, Potassium, Magnesium, ANALYTE CERTIFIED VALUE ANALYTE CERTIFIED VALUE
 1.0 ACCREDITATION / REGISTRATION INORGANIC VENTURES is accredited to ISO Guide 34, "General Requirements for the Competence of Reference Material Producers" and ISO/IEC 17025, "General Requirements for
Breeding et al., Data Repository Material Figure DR1. Athens. Study Area
 Breeding, Ague, and Brocker 1 Figure DR1 21 o 24 Greece o A 38 o Athens Tinos 37 o Syros Attic-Cycladic Blueschist Belt Syros Kampos B Study Area Ermoupoli N Vari Unit Cycladic HP-LT Unit Marble horizons
Earth and Planetary Materials
 Earth and Planetary Materials Spring 2013 Lecture 4 2013.01.16 Example Beryl Be 3 Al 2 (SiO 3 ) 6 Goshenite Aquamarine Emerald Heliodor Red beryl Morganite pure Fe 2+ & Fe 3+ Cr 3+ Fe 3+ Mn 3+ Mn 2+ Rules
Earth Materials I Crystal Structures
 Earth Materials I Crystal Structures Isotopes same atomic number, different numbers of neutrons, different atomic mass. Ta ble 1-1. Su mmar y of quantu m num bers Name Symbol Values Principal n 1, 2,
ICP-OES Application Note Number 35
 ICP-OES Application Note Number 35 Rapid measurement of major, minor and trace levels in soils using the Varian 730-ES Vincent Calderon Varian, Inc. Introduction As part of the global strategy for sustainable
MT Electron microscopy Scanning electron microscopy and electron probe microanalysis
 MT-0.6026 Electron microscopy Scanning electron microscopy and electron probe microanalysis Eero Haimi Research Manager Outline 1. Introduction Basics of scanning electron microscopy (SEM) and electron
Imperfections (Defects)
") TLD simplistic Model TLD is an Inorganic Crystal. The added trace impurities (Mg, Ti ) create discrete levels in the band-gap region, and thus play very important role. e Radiation Partially Full Heat
TLD simplistic Model TLD is an Inorganic Crystal. The added trace impurities (Mg, Ti ) create discrete levels in the band-gap region, and thus play very important role. e Radiation Partially Full Heat
A COMPUTER PROGRAM FOR THE DECONVOLUTION OF THERMOLUMINESCENCE GLOW CURVES K. S. Chung 1,, H. S. Choe 1, J. I. Lee 2, J. L. Kim 2 and S. Y.
 Radiation Protection Dosimetry (200), Vol. 11, No. 1, pp. 3 39 doi:10.1093/rpd/nci073 A COMPUTER PROGRAM FOR THE DECONVOLUTION OF THERMOLUMINESCENCE GLOW CURVES K. S. Chung 1,, H. S. Choe 1, J. I. Lee
FUNDAMENTAL PARAMETER METHOD FOR THE LOW ENERGY REGION INCLUDING CASCADE EFFECT AND PHOTOELECTRON EXCITATION
 Copyright (c)jcpds-international Centre for Diffraction Data 2002, Advances in X-ray Analysis, Volume 45. 511 FUNDAMENTAL PARAMETER METHOD FOR THE LOW ENERGY REGION INCLUDING CASCADE EFFECT AND PHOTOELECTRON
TIME-RESOLVED LUMINESCENCE SPECTRA IN COLORLESS ANATASE TiO 2 SINGLE CRYSTAL
 TIME-RESOLVED LUMINESCENCE SPECTRA IN COLORLESS ANATASE TiO 2 SINGLE CRYSTAL K. Wakabayashi, Y. Yamaguchi, T. Sekiya, S. Kurita Department of Physics, Faculty of Engineering, Yokohama National University
Ziessel a* Supporting Information (75 pages) Table of Contents. 1) General Methods S2
 Table of Contents. 1) General Methods S2") S1 Chemistry at Boron: Synthesis and Properties of Red to Near-IR Fluorescent Dyes based on Boron Substituted Diisoindolomethene Frameworks Gilles Ulrich, a, * Sebastien Goeb a, Antoinette De Nicola a,
S1 Chemistry at Boron: Synthesis and Properties of Red to Near-IR Fluorescent Dyes based on Boron Substituted Diisoindolomethene Frameworks Gilles Ulrich, a, * Sebastien Goeb a, Antoinette De Nicola a,
Direct Analysis of Trace Metal Impurities in High Purity Nitric Acid Using ICP-QQQ
 Application Note Semiconductor Direct Analysis of Trace Metal Impurities in High Purity Nitric Acid Using ICP-QQQ Authors Kazuo Yamanaka and Kazuhiro Sakai Agilent Technologies, Tokyo, Japan Introduction
Unique phenomena of tungsten associated with fusion reactor: uncertainties of stable hydrogen configuration tapped in tungsten vacancy
 Unique phenomena of tungsten associated with fusion reactor: uncertainties of stable hydrogen configuration tapped in tungsten vacancy Kyushu University Kazuhito Ohsawa Technical Meeting of the International
Supplementary information (SI)
") Optical dating in a new light: A direct, non-destructive probe of trapped electrons Amit Kumar Prasad *, Nigel R. J. Poolton,, Myungho Kook, Mayank Jain Center for Nuclear Technologies, Technical University
Optical dating in a new light: A direct, non-destructive probe of trapped electrons Amit Kumar Prasad *, Nigel R. J. Poolton,, Myungho Kook, Mayank Jain Center for Nuclear Technologies, Technical University
TRACE ELEMENT ANALYSIS OF DIAMOND BY LAM ICPMS: STANDARDISATION, RESULTS AND DIRECTIONS
 TRACE ELEMENT ANALYSIS OF DIAMOND BY LAM ICPMS: STANDARDISATION, RESULTS AND DIRECTIONS W.L. Griffin 1, 3, Sonal Rege 1, Rondi M. Davies 1, 2, Simon Jackson 1, Suzanne Y. O Reilly 1 1.ARC National Key
Activation Energy of Modified Peak Shape Equations
 World Journal of Nuclear Science and Technology, 017, 7, 74-83 http://www.scirp.org/journal/wjnst ISSN Online: 161-6809 ISSN Print: 161-6795 Energy of odified Peak Shape Equations Hugo A. Borbón-Nuñez
Geochemical analysis unveils frictional melting process in a
 GSA Data Repository 219116 1 2 3 Geochemical analysis unveils frictional melting process in a subduction zone fault Tsuyoshi Ishikawa and Kohtaro Ujiie 4 Supplemental Material 6 7 8 9 METHOD TABLES (Tables
100% ionic compounds do not exist but predominantly ionic compounds are formed when metals combine with non-metals.
 2.21 Ionic Bonding 100% ionic compounds do not exist but predominantly ionic compounds are formed when metals combine with non-metals. Forming ions Metal atoms lose electrons to form +ve ions. Non-metal
TRACE ELEMENT ANALYSIS USING A BENCHTOP TXRF- SPECTROMETER
 Copyright JCPDS - International Centre for Diffraction Data 2005, Advances in X-ray Analysis, Volume 48. 236 ABSTRACT TRACE ELEMENT ANALYSIS USING A BENCHTOP TXRF- SPECTROMETER Hagen Stosnach Röntec GmbH,
Bound small hole polarons in oxides and related materials: strong colorations and high ionization energies
 Bound small hole polarons in oxides and related materials: strong colorations and high ionization energies O. F. Schirmer Universität Osnabrück central example: acceptor Li + Zn in ZnO O O 2 Small polaron:
A N Singh, S N Singh & L L Singh
 Analysis of thermoluminescence of Li 2 B 4 O 7 :Cu, Ag, P phosphor by simplified General one Trap differential equation A N Singh, S N Singh & L L Singh Indian Journal of Physics ISSN 0973-1458 Volume
EPSC 233. Compositional variation in minerals. Recommended reading: PERKINS, p. 286, 41 (Box 2-4).
.") EPSC 233 Compositional variation in minerals Recommended reading: PERKINS, p. 286, 41 (Box 2-4). Some minerals are nearly pure elements. These are grouped under the category of native elements. This includes
EPSC 233 Compositional variation in minerals Recommended reading: PERKINS, p. 286, 41 (Box 2-4). Some minerals are nearly pure elements. These are grouped under the category of native elements. This includes
Ultra-fast determination of base metals in geochemical samples using the 5100 SVDV ICP-OES
 Ultra-fast determination of base metals in geochemical samples using the 5100 SVDV ICP-OES Application note Geochemistry, metals, mining Authors John Cauduro Agilent Technologies, Mulgrave, Australia Introduction
The effect of point defects in zircon
 aterials for nuclear waste immobilization: The effect of point defects in zircon iguel Pruneda Department of Earth Sciences University of Centre for Ceramic Immobilisation Radiation damage process α-decay
Portable type TXRF analyzer: Ourstex 200TX
 Excerpted from Adv. X-Ray. Chem. Anal., Japan: 42, pp. 115-123 (2011) H. Nagai, Y. Nakajima, S. Kunimura, J. Kawai Improvement in Sensitivity and Quantification by Using a Portable Total Reflection X-Ray
One-dimensional thermoluminescence kinetics
 Radiation Measurements 33 (2001) 745 749 www.elsevier.com/locate/radmeas One-dimensional thermoluminescence kinetics Arkadiusz Mandowski Institute of Physics, Pedagogical University, ul. Armii Krajowej
Steady-state diffusion is diffusion in which the concentration of the diffusing atoms at
 Chapter 7 What is steady state diffusion? Steady-state diffusion is diffusion in which the concentration of the diffusing atoms at any point, x, and hence the concentration gradient at x, in the solid,
EFFECT OF CALIBRATION SPECIMEN PREPARATION TECHNIQUES ON NARROW RANGE X-RAY FLUORESCENCE CALIBRATION ACCURACY
 Copyright(c)JCPDS-International Centre for Diffraction Data 2000,Advances in X-ray Analysis,Vol.43 424 EFFECT OF CALIBRATION SPECIMEN PREPARATION TECHNIQUES ON NARROW RANGE X-RAY FLUORESCENCE CALIBRATION
The trap states in the Sr 2 MgSi 2 O 7 and (Sr,Ca)MgSi 2 O 7 long afterglow phosphor activated by Eu 2+ and Dy 3+
MgSi 2 O 7 long afterglow phosphor activated by Eu 2+ and Dy 3+") Journal of Alloys and Compounds 387 (2005) 65 69 The trap states in the Sr 2 MgSi 2 O 7 and (Sr,Ca)MgSi 2 O 7 long afterglow phosphor activated by Eu 2+ and Dy 3+ Bo Liu a,, Chaoshu Shi a,b, Min Yin a,
Journal of Alloys and Compounds 387 (2005) 65 69 The trap states in the Sr 2 MgSi 2 O 7 and (Sr,Ca)MgSi 2 O 7 long afterglow phosphor activated by Eu 2+ and Dy 3+ Bo Liu a,, Chaoshu Shi a,b, Min Yin a,
Nuclear Instruments and Methods in Physics Research B
 Nuclear Instruments and Methods in Physics Research B 359 (2015) 89 98 Contents lists available at ScienceDirect Nuclear Instruments and Methods in Physics Research B journal homepage: www.elsevier.com/locate/nimb
Application of total reflection X-ray fluorescence spectrometry for trace elemental analysis of rainwater
 PRAMANA c Indian Academy of Sciences Vol. 76, No. 2 journal of February 2011 physics pp. 361 366 Application of total reflection X-ray fluorescence spectrometry for trace elemental analysis of rainwater
Introduction to LIBS COMMUNITY USER WORKSHOP ON PLANETARY LIBS (CHEMCAM) DATA. Sam Clegg and the ChemCam team
 DATA. Sam Clegg and the ChemCam team") Lunar and Planetary Science Conference, March 18 th, 2015 NASA/JPL-Caltech/MSSS COMMUNITY USER WORKSHOP ON PLANETARY LIBS (CHEMCAM) DATA Introduction to LIBS Sam Clegg and the ChemCam team Creating LIBS
Lunar and Planetary Science Conference, March 18 th, 2015 NASA/JPL-Caltech/MSSS COMMUNITY USER WORKSHOP ON PLANETARY LIBS (CHEMCAM) DATA Introduction to LIBS Sam Clegg and the ChemCam team Creating LIBS
Preliminary Progress Report. Mineralogy and Geochemistry of Well Cuttings. Prepared for: Gastem USA. Colgate University Department of Geology
 Preliminary Progress Report Mineralogy and Geochemistry of Well Cuttings Prepared for: Gastem USA By: Jaclyn Baughman Alison MacNamee Bruce Selleck Colgate University Department of Geology July 30, 2010
Supporting Information
 Supporting Information Polyoxometalate-based crystalline tubular microreactor: redox-active inorganic-organic hybrid materials producing gold nanoparticles and catalytic properties Dong-Ying Du, Jun-Sheng
COMPARATIVE STUDY OF PIGE, PIXE AND NAA ANALYTICAL TECHNIQUES FOR THE DETERMINATION OF MINOR ELEMENTS IN STEELS
 COMPARATIVE STUDY OF PIGE, PIXE AND NAA ANALYTICAL TECHNIQUES FOR THE DETERMINATION OF MINOR ELEMENTS IN STEELS ANTOANETA ENE 1, I. V. POPESCU 2, T. BÃDICÃ 3, C. BEªLIU 4 1 Department of Physics, Faculty
Radiation Measurements
 Radiation Measurements 100 (2017) 27e36 Contents lists available at ScienceDirect Radiation Measurements journal homepage: www.elsevier.com/locate/radmeas The influence of competition effects on the initial
PRINCIPLE OF ICP- AES
 INTRODUCTION Non- flame atomic emission techniques, which use electrothermal means to atomize and excite the analyte, include inductively coupled plasma and arc spark. It has been 30 years since Inductively
ED(P)XRF: SCREENING ANALYSIS AND QUANTITATIVE ANALYSIS with POLARIZED
XRF: SCREENING ANALYSIS AND QUANTITATIVE ANALYSIS with POLARIZED") 384 ED(P)XRF: SCREENING ANALYSIS AND QUANTITATIVE ANALYSIS with POLARIZED X-RAYS R. Schramm, J. Heckel, K. Molt 2 Spectra Analytical Instruments, Kleve, Germany. 2Gerhard-Mercator- University Duisburg,
384 ED(P)XRF: SCREENING ANALYSIS AND QUANTITATIVE ANALYSIS with POLARIZED X-RAYS R. Schramm, J. Heckel, K. Molt 2 Spectra Analytical Instruments, Kleve, Germany. 2Gerhard-Mercator- University Duisburg,
Overview of X-Ray Fluorescence Analysis
 Overview of X-Ray Fluorescence Analysis AMPTEK, INC., Bedford, MA 01730 Ph: +1 781 275 2242 Fax: +1 781 275 3470 sales@amptek.com 1 What is X-Ray Fluorescence (XRF)? A physical process: Emission of characteristic
Instantaneous reduction of graphene oxide at room temperature
 Instantaneous reduction of graphene oxide at room temperature Barun Kuma Burman, Pitamber Mahanandia and Karuna Kar Nanda Materials Research Centre, Indian Institute of Science, Bangalore-560012, India
Study of semiconductors with positrons. Outlook:
 Study of semiconductors with positrons V. Bondarenko, R. Krause-Rehberg Martin-Luther-University Halle-Wittenberg, Halle, Germany Introduction Positron trapping into defects Methods of positron annihilation
Cathodolumiescence Studies of the Density of States of Disordered Silicon Dioxide
 Utah State University DigitalCommons@USU Presentations Materials Physics Fall 2014 Cathodolumiescence Studies of the Density of States of Disordered Silicon Dioxide JR Dennison Utah State Univesity Amberly
Optical and THz investigations of mid-ir materials exposed
 Optical and THz investigations of mid-ir materials exposed to alpha particle irradiation Dan Sporea 1*, Laura Mihai 1, Adelina Sporea 1, Ion Vâţã 2 1 National Institute for Laser, Plasma and Radiation
Quantitative XRF Analysis. algorithms and their practical use
 Joint ICTP-IAEA School on Novel Experimental Methodologies for Synchrotron Radiation Applications in Nano-science and Environmental Monitoring Quantitative XRF Analysis algorithms and their practical use
Geos 306, Mineralogy Final Exam, Dec 12, pts
 Name: Geos 306, Mineralogy Final Exam, Dec 12, 2014 200 pts 1. (9 pts) What are the 4 most abundant elements found in the Earth and what are their atomic abundances? Create a reasonable hypothetical charge-balanced
Multi-Element Analysis of Petroleum Crude Oils using an Agilent 7900 ICP-MS
 Multi-Element Analysis of Petroleum Crude Oils using an Agilent 7900 ICP-MS Application note Energy and fuels Authors Jenny Nelson, Agilent Technologies, USA Ed McCurdy, Agilent Technologies, UK Introduction
[YOUR NAME] [GROUP PARTNER NAMES IF APPLICABLE] [DATE] [COURSE ID] for [CLIENT NAME] [CLIENT CONTACT INFORMATION]
![[YOUR NAME] [GROUP PARTNER NAMES IF APPLICABLE] [DATE] [COURSE ID] for [CLIENT NAME] [CLIENT CONTACT INFORMATION]](/thumbs/94/119688806.jpg "[YOUR NAME] [GROUP PARTNER NAMES IF APPLICABLE] [DATE] [COURSE ID] for [CLIENT NAME] [CLIENT CONTACT INFORMATION]") Department of Earth & Atmospheric Sciences Minerals Lab; Attn: Dr. Kackstaetter Campus Box 22, P.O.Box 173362 Denver, CO 80217-3362 [PROJECT TITLE] [Your title should summarize the purpose of the paper
Department of Earth & Atmospheric Sciences Minerals Lab; Attn: Dr. Kackstaetter Campus Box 22, P.O.Box 173362 Denver, CO 80217-3362 [PROJECT TITLE] [Your title should summarize the purpose of the paper
The predose effect in thermoluminescent dosimetry
 INSTITUTE OF PHYSICS PUBLISHING JOURNAL OF PHYSICS: CONDENSED MATTER J. Phys.: Condens. Matter 13 (2001) 2201 2209 www.iop.org/journals/cm PII: S0953-8984(01)17739-8 The predose effect in thermoluminescent
VERY SHORT ANSWER TYPE QUESTIONS (1 Mark)
") UNIT I 10 Chemistry-XII THE SOLID STATE VERY SHORT ANSWER TYPE QUESTIONS (1 Mark) Q. 1. What do you mean by paramagnetic substance? Ans. Weakly attracted by magnetic eld and these substances are made of
UNIT I 10 Chemistry-XII THE SOLID STATE VERY SHORT ANSWER TYPE QUESTIONS (1 Mark) Q. 1. What do you mean by paramagnetic substance? Ans. Weakly attracted by magnetic eld and these substances are made of
Optical effects of ion implantation
 Optical effects of ion implantation P. D. TOWNSEND, P. J. CHANDLER and L. ZHANG School of Mathematical and Physical Sciences University of Sussex 1 CAMBRIDGE UNIVERSITY PRESS Preface 1 An overview of ion
Study Some of Optical and Thermoluminescence Properties of Muscovite Mica Exposed to Ultraviolet Radiation
 Study Some of Optical and Thermoluminescence Properties of Muscovite Mica Exposed to Ultraviolet Radiation H.A.AlBuraih 1, 2 * C.Soliman 1, 2, 3 K.M. EL-Shokrofy 2, 4 1. Department of Physics, Faculty
X Rays & Crystals. Characterizing Mineral Chemistry & Structure. J.D. Price
 X Rays & Crystals Characterizing Mineral Chemistry & Structure J.D. Price Light - electromagnetic spectrum Wave behavior vs. particle behavior If atoms are on the 10-10 m scale, we need to use sufficiently
Electron probe microanalysis - Electron microprobe analysis EPMA (EMPA) What s EPMA all about? What can you learn?
 What s EPMA all about? What can you learn?") Electron probe microanalysis - Electron microprobe analysis EPMA (EMPA) What s EPMA all about? What can you learn? EPMA - what is it? Precise and accurate quantitative chemical analyses of micron-size
Electron probe microanalysis - Electron microprobe analysis EPMA (EMPA) What s EPMA all about? What can you learn? EPMA - what is it? Precise and accurate quantitative chemical analyses of micron-size
Determination of Impurities in Silica Wafers with the NexION 300S/350S ICP-MS
 APPLICATION NOTE ICP - Mass Spectrometry Author Kenneth Ong PerkinElmer, Inc. Singapore Determination of Impurities in Silica Wafers with the NexION 300S/350S ICP-MS Introduction The control of impurity
Direct Measurement of Metallic Impurities in 20% Ammonium Hydroxide by 7700s/7900 ICP-MS
 Direct Measurement of Metallic Impurities in 20% Ammonium Hydroxide by 7700s/7900 ICP-MS Application Note Semiconductor Authors Junichi Takahashi Agilent Technologies Tokyo, Japan Abstract Ammonium hydroxide
Name: SCH3U Worksheet-Trends
 PERIODIC TRENDS WORKSHEET 1. Choose which statement about the alkali metals lithium and cesium is correct. a) as the atomic number increases, the Electronegativity of the elements increases b) as the atomic
Study of the distribution of actinides in human tissues using synchrotron radiation micro X-ray fluorescence spectrometry
 Analytical and Bioanalytical Chemistry Electronic Supplementary Material Study of the distribution of actinides in human tissues using synchrotron radiation micro X-ray fluorescence spectrometry Eva Vergucht,
of numerous north-south trending Miocene and volcanic centres and lava flows. For
 DATA REPOSITORY DR009071 Duggen et al. SAMPLES AND ANALYTICAL METHODS Lavas were collected from a ca. 10 km by 100 km volcanic field consisting of numerous north-south trending Miocene and volcanic centres
Thermoluminescence (TL) characterization of the perovskite-like KMgF 3, activated by Lu impurity
 characterization of the perovskite-like KMgF 3, activated by Lu impurity") JOURNAL OF MATERIALS SCIENCE 39 (2 004)1601 1607 Thermoluminescence (TL) characterization of the perovskite-like KMgF 3, activated by Lu impurity P. R. GONZÁLEZ Instituto Nacional de Investigaciones Nucleares,
JOURNAL OF MATERIALS SCIENCE 39 (2 004)1601 1607 Thermoluminescence (TL) characterization of the perovskite-like KMgF 3, activated by Lu impurity P. R. GONZÁLEZ Instituto Nacional de Investigaciones Nucleares,
Thermo Scientific icap RQ ICP-MS: Typical limits of detection
 TECHNICAL NOTE 43427 Thermo Scientific icap RQ ICP-MS: Typical limits of detection Author Tomoko Vincent Keywords BEC, interference removal, KED, LOD Introduction Inductively Coupled Plasma Mass Spectrometry
Engineering electronic structure of Two-Dimensional Subnanopore. nanosheet by Molecular Titanium-oxide Incorporation for Enhanced
 Electronic Supplementary Material (ESI) for Chemical Science. This journal is The Royal Society of Chemistry 2015 Electronic Supplementary Information for Engineering electronic structure of Two-Dimensional
AN INTRODUCTION TO ATOMIC SPECTROSCOPY
 AN INTRODUCTION TO ATOMIC SPECTROSCOPY Atomic spectroscopy deals with the absorption, emission, or fluorescence by atom or elementary ions. Two regions of the spectrum yield atomic information- the UV-visible
Q1. The periodic table on the Data Sheet may help you to answer this question.
 Q1. The periodic table on the Data Sheet may help you to answer this question. (a) Newlands and Mendeleev both designed periodic tables in which the elements were put in the order of their relative atomic
IRSAR A single-aliquot regenerative-dose dating protocol applied to the infrared radiofluorescence (IR-RF) of coarsegrain
 of coarsegrain") Ancient TL Vol. 21 No. 1 2003 35 IRSAR A single-aliquot regenerative-dose dating protocol applied to the infrared radiofluorescence (IR-RF) of coarsegrain K-feldspar G. Erfurt * and M.R. Krbetschek Sächsische
Ancient TL Vol. 21 No. 1 2003 35 IRSAR A single-aliquot regenerative-dose dating protocol applied to the infrared radiofluorescence (IR-RF) of coarsegrain K-feldspar G. Erfurt * and M.R. Krbetschek Sächsische
Peter L Warren, Pamela Y Shadforth ICI Technology, Wilton, Middlesbrough, U.K.
 783 SCOPE AND LIMITATIONS XRF ANALYSIS FOR SEMI-QUANTITATIVE Introduction Peter L Warren, Pamela Y Shadforth ICI Technology, Wilton, Middlesbrough, U.K. Historically x-ray fluorescence spectrometry has
Chapter 12: Structures & Properties of Ceramics
 Chapter 12: Structures & Properties of Ceramics ISSUES TO ADDRESS... Bonding and structure of ceramic materials as compared with metals Chapter 12-1 Atomic Bonding in Ceramics Bonding: -- Can be ionic
Photoluminescence and persistent luminescence properties of non-doped and Ti 4+ -doped Mg 2 SnO 4 phosphors
 Photoluminescence and persistent luminescence properties of non-doped and Ti 4+ -doped Mg 2 SnO 4 phosphors Zhang Jia-Chi( ), Qin Qing-Song( ), Yu Ming-Hui( ), Zhou Hong-Liang( ), and Zhou Mei-Jiao( )
Chemistry Instrumental Analysis Lecture 17. Chem 4631
 Chemistry 4631 Instrumental Analysis Lecture 17 Introduction to Optical Atomic Spectrometry From molecular to elemental analysis there are three major techniques used for elemental analysis: Optical spectrometry
Temperature-dependent spectroscopic analysis of F 2 + ** and F 2 + **-like color centers in LiF
 Journal of Luminescence 91 (2000) 147 153 Temperature-dependent spectroscopic analysis of F 2 + ** and F 2 + **-like color centers in LiF Neil W. Jenkins a, *, Sergey B. Mirov a, Vladimir V. Fedorov b
Determination of trace elements in ultrapure semiconductor grade sulfuric acid using the Agilent 8900 ICP-QQQ in MS/MS mode
 Determination of trace elements in ultrapure semiconductor grade sulfuric acid using the Agilent 8900 ICP-QQQ in MS/MS mode Application note Semiconductor Authors Michiko Yamanaka, Kazuo Yamanaka and Naoki
Key Analytical Issues: Sample Preparation, Interferences and Variability. Tim Shelbourn, Eli Lilly and Company
 Key Analytical Issues: Sample Preparation, Interferences and Variability Tim Shelbourn, Eli Lilly and Company Presentation Outline Sample preparation objectives and challenges Some common interferences
PART 1 Introduction to Theory of Solids
 Elsevier UK Job code: MIOC Ch01-I044647 9-3-2007 3:03p.m. Page:1 Trim:165 240MM TS: Integra, India PART 1 Introduction to Theory of Solids Elsevier UK Job code: MIOC Ch01-I044647 9-3-2007 3:03p.m. Page:2
Determination of major, minor and trace elements in rice fl our using the 4200 Microwave Plasma- Atomic Emission Spectrometer (MP-AES) Authors
 Authors") Determination of major, minor and trace elements in rice flour using the 4200 Microwave Plasma- Atomic Emission Spectrometer (MP-AES) Application note Food testing Authors John Cauduro Agilent Technologies,
Determination of major, minor and trace elements in rice flour using the 4200 Microwave Plasma- Atomic Emission Spectrometer (MP-AES) Application note Food testing Authors John Cauduro Agilent Technologies,
Charge recombination processes in minerals studied using optically stimulated luminescence and time-resolved exo-electrons
 IOP PUBLISHING JOURNAL OF PHYSICS D: APPLIED PHYSICS J. Phys. D: Appl. Phys. 43 (21) 32552 (9pp) doi:1.188/22-3727/43/32/32552 Charge recombination processes in minerals studied using optically stimulated