Importance of Composition and Hygroscopicity of BC Particles to the Effect of BC Mitigation on Cloud Properties: Application to California Conditions
|
|
|
- Ashlyn Stewart
- 5 years ago
- Views:
Transcription
1 Importance of Composition and Hygroscopicity of BC Particles to the Effect of BC Mitigation on Cloud Properties: Application to California Conditions Ranjit Bahadur 1, Lynn M. Russell 1, Mark Z. Jacobson 2, Kimberly Prather 1,3, Athanasios Nenes 4, Peter Adams 5, and John H. Seinfeld 6 1 Scripps Institution of Oceanography, University of California San Diego, La Jolla CA Department of Civil and Environmental Engineering, Stanford University, Stanford, CA Department of Chemistry and Biochemistry, University of California San Diego, La Jolla CA Schools of Earth and Atmospheric Sciences, and Chemistry and Biomolecular Engineering, Georgia Institute of Technology, Atlanta, GA Departments of Civil and Environmental Engineering, and Engineering and Public Policy, Carnegie Mellon University, Pittsburgh, PA Departments of Civil and Environmental Engineering, and Chemical Engineering, California Institute of Technology, Pasadena, CA Abstract Black carbon (BC) has many effects on climate including the direct effect on atmospheric absorption, indirect and semi-direct effects on clouds, snow effects, and others. While most of these are positive (warming), the first indirect effect is negative and quantifying its magnitude in addition to other BC feedbacks is important for supporting policies that mitigate BC. We use the detailed aerosol chemistry parcel model of Russell and Seinfeld, [1998], observationally-constrained by initial measured aerosol concentrations from five California sites, to provide simulated cloud drop number (CDN) concentrations against which two GCM calculations one run at the global scale [Chen et al., 2010b] and one nested from the global-to-regional scale [Jacobson, 2010] are compared. The GCM
2 results reflect the combined effects of their emission inventories, advection schemes, and cloud parameterizations. BC-type particles contributed between 16 and 20% of cloud droplets at all sites even in the presence of more hygroscopic particles. While this chemically-detailed parcel model result is based on simplified cloud dynamics and does not consider semi-direct or cloud absorption effects, the cloud drop number concentrations are similar to the simulations of both Chen et al., [2010b] and Jacobson, [2010] for the average cloud conditions in California. Reducing BC particle concentration by 50% decreased the cloud droplet concentration by between 6% and 9% resulting in the formation of fewer, larger cloud droplets that correspond to a lower cloud albedo. This trend is similar to Chen et al., [2010b] and Jacobson, [2010] when BC particles were modeled as hygroscopic. This reduction in CDN in California due to the decrease in activated BC particles supports the concern raised by Chen et al., [2010a] that the cloud albedo effect of BC particles partially offsets the direct forcing reduction. These results suggests that for regions like the California sites studied here, where BC mitigation targets fossil fuel sources, a critical aspect of the modeled reduction is the chemical composition and associated hygroscopicity of the BC particles removed as well as their relative contribution to the atmospheric particle concentrations I. Introduction Black Carbon (BC) is a ubiquitous and major component of aerosol particles generally related to combustion sources such as automobile exhaust, domestic exhausts, and biomass burning [Andreae and Merlet, 2001; Bond et al., 2007; Yan et al., 2011]. Recent studies in polluted urban environments show that as much as 80% of the submicron
3 particle number size distribution contains some BC [Moffet et al., 2008], which can contribute a large part of particle mass (as seen in some primary aerosols) or only a small core (as seen in some secondary particles). BC is strongly absorbing in both the visible and near-infrared spectrum, and its direct aerosol effect is estimated to be a principal contributor to global atmospheric warming [Ramanathan and Carmichael, 2008]. BC aerosol particles have an atmospheric lifetime of the order of one week [Ogren and Charlson, 1983; Stier et al., 2007], orders of magnitude shorter than most greenhouse gases. Aerosol particles are not well mixed in the atmosphere but are instead geographically and temporally correlated to emission sources. Because their short atmospheric lifetime means immediate regional impacts on climate, reducing BC emissions has been proposed as a control strategy to offset short-term climate changes [Jacobson, 2002]. Aggressive control policies for diesel emissions in California have produced a near 50% decrease in BC concentrations (while non-absorbing particles have remained nearly constant), resulting in an estimated change in the direct radiative forcing of -1.4 W m -2 over the State [Bahadur et al., 2011] In addition to warming the atmosphere through absorption of incoming shortwave radiation, BC particles also impact the climate in a series of feedbacks through their interaction with clouds and temperature [Jacobson, 2002; Koch and Del Genio, 2010]. BC particles internally mixed with or coated by hygroscopic species serve as efficient cloud condensation nuclei (CCN) for both warm and mixed-phase clouds [Andreae and Rosenfeld, 2008; Dusek et al., 2006; Koehler et al., 2009; Lammel and Novakov, 1995]. Perturbations to the BC concentration can therefore change the cloud droplet number
4 (CDN) concentration and droplet size [Roberts et al., 2003], which in turn influence both the cloud optical properties and cloud lifetime. Depending on the vertical distribution of aerosols, their mixing to the cloud deck, and meteorological conditions, these two socalled aerosol indirect effects tend to increase the cloud reflectance and cloud liquidwater path, respectively, and are thought to have a net cooling effect on the atmosphere [Lohmann and Feichter, 2005]. Competing semi-direct effects are found to decrease the cloud cover by stabilizing the atmosphere through warming [Hansen et al., 1997] and to increase absorption by the cloud, helping to burn it off [Jacobson, 2006]. In contrast to the direct aerosol effect, the net climate forcing due to these cloud feedbacks and semidirect effects is highly uncertain [Forster et al., 2007] and may be either a significant offset, or addition, to the direct effect. An assessment of the degree to which the indirect effects of reducing BC offset or enhance the direct effects is needed to quantify the overall mitigation of climate change by BC on which policies can be constructed General circulation models (GCMs) with explicit aerosol cloud interactions are the principal tools for estimating global climatic impacts of the aerosol cloud interactions. Recent GCM studies that have investigated the indirect effects of BC on CDN concentrations differ not only in magnitude, but also in the sign of the change in cloud droplet concentrations depending on the chemical properties of BC particles as well as the extent to which other indirect effects are explicitly modeled [Bauer et al., 2010; Chen et al., 2010b; Koch et al., 2009; Kristjansson et al., 2005; Spracklen et al., 2011]. A recent multi-model comparison [Koch et al., 2011] investigating the effect of soot mitigation on liquid clouds concluded that soot removal could either increase or decrease
5 the cloud droplet number with the final response depending on a combination of factors including the composition and size of the soot particles, the magnitude of soot change caused by emissions reduction, as well as the non-linear response of the indirect effect itself. Although some generalized trends were found among the GCMs investigated, there was no consensus on the sign or magnitude of the cloud response in isolation to soot emission mitigation. In this work, we address this uncertainty by focusing on two models that account for different processes thus have produced different responses. Chen et al., [2010a] estimated that a 50% reduction in fossil fuel emissions would result in a 6% decrease in the globally-averaged CDN concentration as a consequence of the first indirect effect; Jacobson, [2010], who performed climate response simulations, reported a 1% increase in cloud droplet number concentration for complete removal (100% decrease) of fossil fuel soot emissions (but a 10% decrease when both fossil fuel and biomass burning emissions were removed). The increased drop concentration of Jacobson, [2010] in the no fossil soot (NFS) simulation was the combined result of the modeled hydrophobicity of fossil fuel BC particles and the changes in cloud dynamics from semi-direct and cloud absorption effects of BC on temperature. The explicit treatment of feedbacks by Jacobson, [2010] provides the more complete calculation of climate impacts between the two GCMs compared here. The scope of the present work focuses only on the change in CDN concentration from reducing BC particles. In this way, we can evaluate one part of the climate benefit of a BC reduction One source of uncertainty in calculating CDN changes is the simplifications of cloud droplet activation schemes that are used in GCM parameterizations to reduce
6 computational time [Meskhidze et al., 2005]. To assess this difference in modeling approaches, we employ a parcel model that connects detailed cloud chemistry and microphysics with a calculated supersaturation profile [Guibert et al., 2003; Snider et al., 2003]. Since the parcel model does not include the feedback of BC on the temperature profile, the semi-direct effects are not assessed in this study. Here, we use the Russell and Seinfeld, [1998] parcel model Another source of uncertainty in GCM predictions of BC indirect effects on CDN is the representation of aerosol composition, size, and concentration. To address this uncertainty, we assume internally and externally-mixed BC particles, constrained by single particle measurements (using the Aerosol Time of Flight Mass Spectrometer, ATOFMS) at five California field sites in initializing the chemically-detailed parcel model. California provides an ideal test case for this work due to the ready availability of high-resolution aerosol measurements that represent different emission conditions The combined approach uses CDN concentrations calculated from chemically-detailed size distributions, initialized with measured aerosol concentrations. The impact of reducing BC is determined by repeating our model simulations for 50% reduction in BC compared with the base case, the results of which are also compared with GCM results from Chen et al., [2010a] and Jacobson, [2010]. These comparisons allow us to address the following questions: (1) Does BC contribute significantly to cloud droplets in representative aerosol populations? (2) How do the aerosol and cloud number size distributions determined in GCMs compare with results from a detailed parcel model? (3)
7 151 How does BC mitigation impact the total cloud droplet concentration? II. Aerosol Case Studies To calculate the contribution of BC-containing particles to CDN concentrations, we initialized the parcel model with external mixtures of aerosol particle compositions measured in California. A number of ATOFMS field studies have been conducted to characterize external mixtures of aerosol particles in California, and here we use five studies to represent a range of chemical mixtures found in California aerosol populations. ATOFMS enables online size-resolved chemical characterization of ambient aerosol samples through information about the chemical fingerprints associated with each particle type [Silva and Prather, 1997; Silva et al., 1999; Suess and Prather, 1999]. Specific details for the selected field studies used in this work are summarized in Table 1. The chemical characteristics of submicron carbonaceous aerosol particles have been established based on a comparative study [Bahadur et al., 2010], and here we use a similar methodology to describe the aerosol observed at different field sites as an external mixture of four major particle types: (a) The Black Carbon (BC) type is characterized by a positive ion mass spectrum that is dominated by carbon atom clusters (C n ) with smaller signal contributions from organic carbon, nitrate, sulfate, and ammonium tracer fragments. The mass spectra are similar to spectra of particles sampled during source tests from vehicular exhaust [Sodeman et al., 2005], suggesting that these particles are produced from primary sources of fossil fuel combustion and correspond most closely to atmospheric black carbon.
8 (b) The Organic Carbon (OC) type is characterized by major OC peaks at +27 (C 2 H 3 ) and +43 (C 2 H 3 O), a peak at +39 (K) associated with organics produced during biomass combustion, and positive ion fragments up to and beyond +150 indicative of high mass compounds that may be formed via atmospheric processing [Silva et al., 1999]. (c) Sulfate-type particles are characterized by a large peak at -97 (HSO 4 ) in the negative spectra. (d) Nitrate-type particles contain a large peak at -62 (NO 3 ) in the negative spectra. The nitrate and sulfate particles are often internally mixed; in these cases the particle is classified as either sulfate or nitrate according to the larger peak. The sulfate and nitrate particle types typically do not produce positive ion spectra but are still likely to contain a carbonaceous core [Pratt et al., 2010]. Even though all four of these particle types could contain nuclei and mass from combustion sources, we classify them here using their mass spectral signal as a signature for those particles that are most uniquely associated with fossil fuel emissions by vehicles. Spectra containing sea salt peaks are found in the coastal sites typically mixed with the sulfate and nitrate classes, and pure sea salt particles do not make up a significant fraction of the total detected submicron particles at these sites. Approximately 5-10% of particles do not fall into any of these categories and are classified as other and not further chemically-resolved. The relative concentrations of each of these particle types can be determined by analyzing the ATOFMS measurements (using a nozzle inlet with a cutoff of 3 m), but since the instrument detects larger particles with higher efficiency than smaller particles, unscaled number counts can be misleading [Allen et al., 2000; Bhave et al., 2002]. We
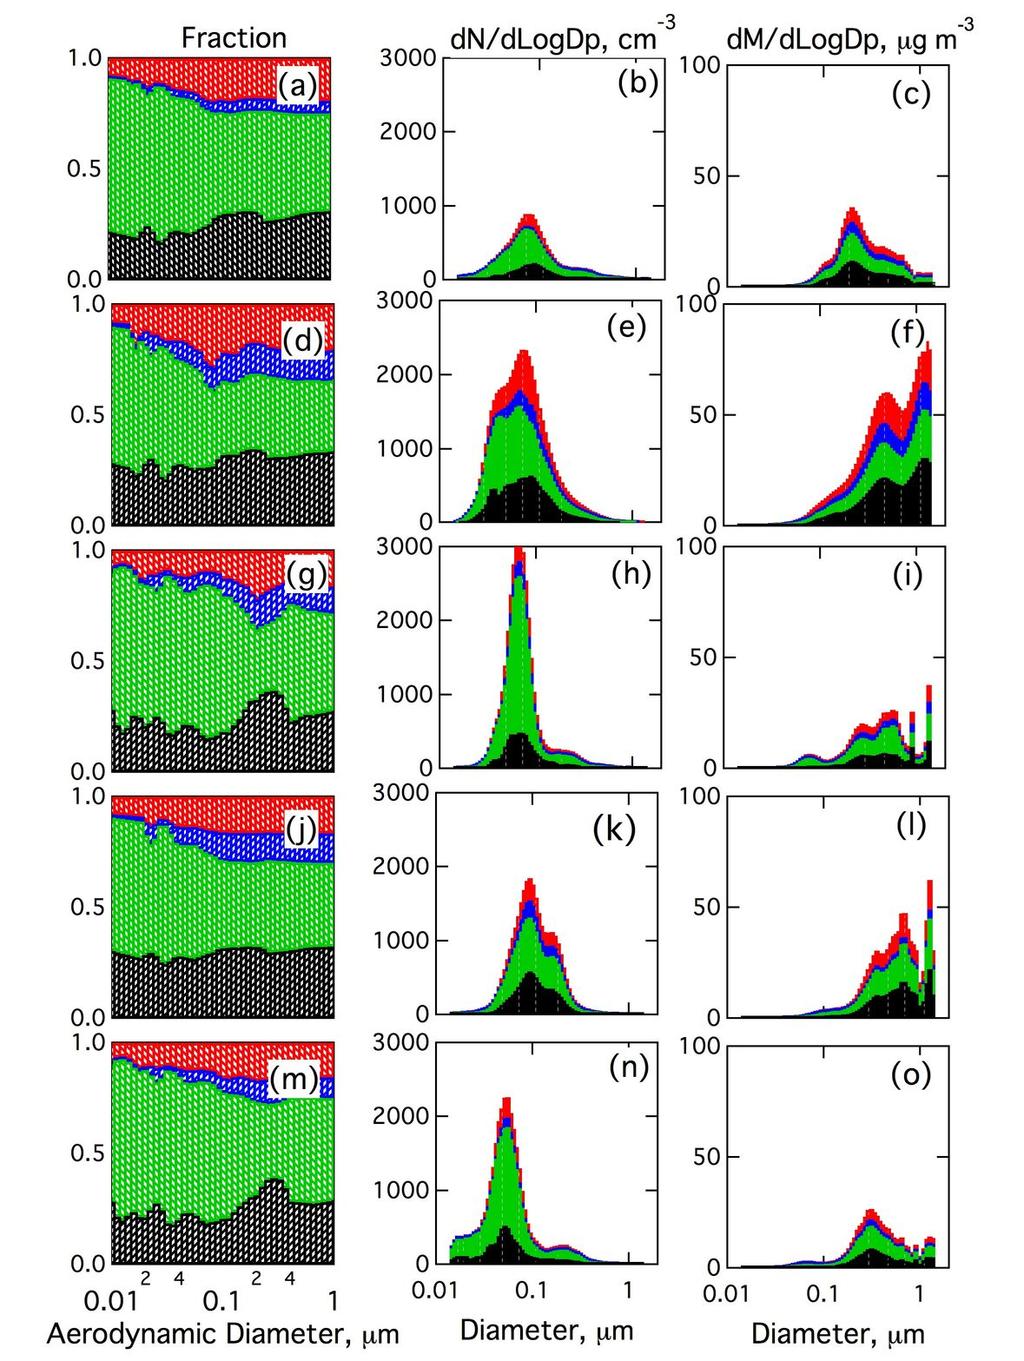
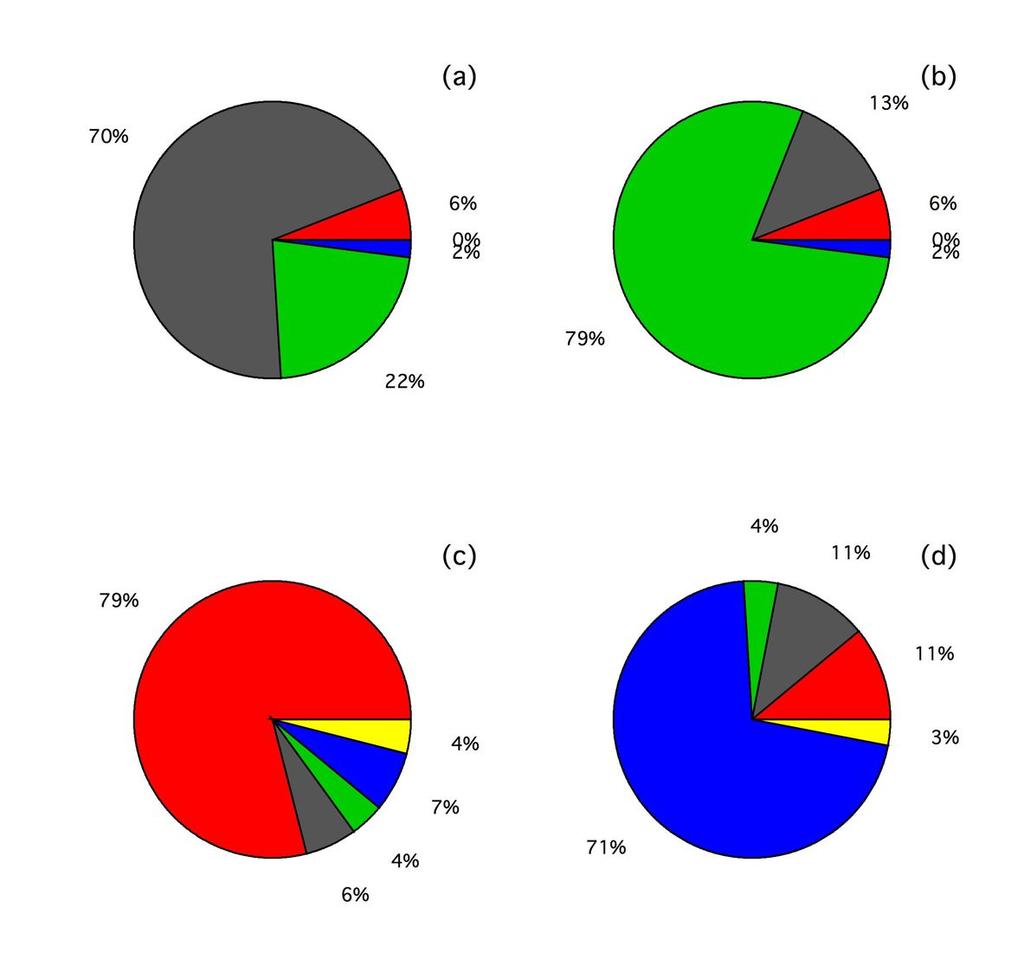
9 assume that the relative fraction of each particle type within each size bin is statistically similar to the ambient particles allowing us to construct a relative size distribution (independent of absolute particle counts) for the different particle types., We use measurements from the co-located sizing instruments Scanning Mobility Particle Sizer (SMPS, m), Optical Particle Counter (OPC, m), and Aerodynamic Particle Sizer (APS 1-25 m) to determine the absolute aerosol number concentration between 0.01 and 2.5 m, which in turn is multiplied by the ATOFMS particle fractions to reconstruct atmospheric number size distributions for each particle type. The sizedependent relative ATOFMS particle fraction and corresponding reconstructed number size distributions are illustrated in Fig. 1 for the five sites Characteristic densities for each of these particle types have been measured [Qin et al., 2006] and are used to convert the number size distributions into mass size distributions. Finally, each particle type is treated as an internal mixture of five species ammonium sulfate, ammonium nitrate, BC (represented as elemental carbon), OC (represented as a long chain carboxylic acid [Russell et al., 2011]), and sea salt (represented as sodium chloride), allowing for the representation of carbonaceous cores in the sulfate and nitrate types and deposition of secondary species onto the BC and OC types. We use a volumetric mixing rule with the densities of these pure species to constrain the relative mixing ratio to the observed density. Since multiple solutions are possible, the internal mixing state represents a possible composition rather than a unique one. Figure 2 illustrates the calculated composition of each of the four particle types that are used to represent the particle populations observed in the five case studies. The validity of these
10 inferred mass-based internal mixing states for the four particle types can be examined by comparing the predicted total EC, OC, Sulfate, and Nitrate mass with measurements. We use filter-based measurements from nearly-collocated monitoring sites operated as part of the IMPROVE network. Figure 3 shows the comparisons of PM2.5 mass monthly averages measured from the IMPROVE sites, combined ATOFMS and particle number measurements, and calculated values from the GCMs of [Chen et al., 2010b] (who do not explicitly report nitrate mass) and [Jacobson, 2010]. We find relatively good agreement between the four mass measurements, with the GCMs also successfully reproducing the annual cycles in EC, OC, and Sulfate. Compared to the IMPROVE measurements, the single-particle-based measurements for the parcel model under-predict the EC and Nitrate mass by between 10-15% and over-predict the OC and Sulfate mass by between 5-15%. This discrepancy is reasonable considering the variability associated with using nearby measurements, monthly averaged values, and the uncertainties associated with the measurements For the 50% BC reduction cases, we decrease the number concentration of the BC-type particles by half while preserving the shape of the size distribution the underlying assumption being that a reduction in BC emissions reduces the number concentration of BC-type particles by half but does not alter the mean size. The size distributions and mass of the other particle types are preserved as measured (including the small BC mass component). The overall effect on the aerosol is a loss in mass between 0.16 g m -3 (TH) and 0.50 g m -3 (RV), which corresponds to a reduction of between 5% and 7% in particle mass or between 7% and 11% in particle number concentration. Since BC is co-
11 emitted with many other particle components, it is likely that an actual reduction of BC emissions would also reduce the OC, nitrate, and sulfate particle types that constitute the other particle types. In fact, all three of these particle types may have BC cores, but, as a first approximation, we remove half of only the BC particle types III. Microphysics Modeling Approach The aerosol dynamics model [Russell and Seinfeld, 1998] used in this study is based on a fixed-sectional approach that represents the detailed chemical composition of particles as both internally-mixed components and externally-mixed particle types (or populations). Each particle type is described by size-dependent internal mixtures of five chemical components: Ammonium Sulfate, Ammonium Nitrate, long chain carboxylic acids, Elemental Carbon (EC), and Sodium Chloride. The model tracks the aerosol microphysics accounting for particle growth, coagulation, evaporation, condensation, nucleation, and cloud droplet activation mechanisms. The gas phase and heterogeneous sulfur chemistry are also described explicitly but are negligible in the short simulations conducted here. Water is treated in a moving section representation allowing for the accurate calculation of evaporation and condensation depending on the relative humidity, and both the aerosol mass and particle number concentration are tracked using a dual moment method. The maximum supersaturation, CDN concentration, and equivalent cloud droplet radius are calculated kinetically based on the detailed chemical composition of each particle type and size rather than from equilibrium Köhler theory, providing a more flexible treatment of warm stratus clouds where the time scale for change of supersaturation can be comparable to or smaller than the time scale for particle growth.
12 The parcel model captures the dynamical variability in the supersaturation and applies It to the particle size distribution, while GCMs apply a single average velocity or a probability distribution of velocities (prescribed or diagnosed from large scale dynamics) to describe changes in cloud droplet number [Morales and Nenes, 2010] To provide a simple yet relevant cloud thermodynamic structure that can be used for all five cases, we use a continentally-influenced marine stratus cloud as a model cloud. Profiles of meteorological variables that were collected on a flight of the Monterey Area Ship Track (MAST) experiment on JDT 178 [Durkee et al., 2000] in a continentallyinfluenced cloud layer from 173 to 405 m above sea level are used to describe the temperature profile, humidity profile, and total amount of available liquid water. The total available water vapor in the cloud is 0.35 g m -3 and the cloud base temperature is K. The frequent presence of low lying stratocumulus clouds off the coast of California, particularly in the spring and summer months [Lu et al., 2007], suggests that this is a reasonable and relevant set of meteorological conditions for offshore flow, despite being a simplification over GCMs that include all cloud regimes, including mixed-phase clouds The parcel updraft velocity was calculated in two modes: (1) the fixed updraft mode with a constant updraft velocity for an observed range of values of 0.2 and 2.0 m s -1 [Nicholls and Leighton, 1986] is used to establish representative values for maximum supersaturation, cloud droplet number concentration, and typical duration of a single cloud cycle, as in Russell et al.[2000]; and (2) the calculated updraft mode initialized by a
13 surface temperature difference of +1.0 K relative to the ambient at sea level [Lucas et al., 1994]. The calculated updraft mode follows the treatment of Pruppacher and Klett, [2003] developed for convective clouds, calculating the updraft velocity at each time step while allowing the adiabatic cooling of the aerosol parcel and entrainment of humid air. The changes in temperature and updraft velocity that are evaluated simultaneously are dt ( gudt L w [L w c p (T T a )] c p ) (1) du [ 2g 3 (T T a T a w) 2 3 U2 ]dt (2) where T is the parcel temperature, T a is the ambient temperature, g is the acceleration due to gravity, w is the liquid water mixing ratio, L is the latent heat of condensation of water, 301 c p is the specific heat of water, is a dimensionless entrainment parameter computed based on the liquid water profile determined using a fixed updraft velocity, t is time, and U is the updraft velocity Figure 4 illustrates the simulated parcel altitude, relative humidity, liquid water content, and updraft velocity for the five case studies using both the measured aerosol concentrations and similar cases but with BC reduced by 50% BC. The simulation is initialized with the aerosol parcel at rest (U=0) at sea level with a potential temperature that is 1K in excess of the measured surface temperature in the sounding of the
14 atmosphere. This 1K excess means that, in the first stage of the simulation, the parcel is warmer than the surrounding air and accelerates upwards. As the air parcel ascends it is cooled by expansion, reaching a temperature first equal to, and then less than the surrounding air. Therefore it attains a maximum updraft velocity (U=1.4 m s -1 for the conditions simulated here) before starting to decelerate. In the second stage of the simulation (starting at approximately 150 s), the parcel enters the supersaturated region and the available water vapor starts to condense onto the cloud condensation nuclei (CCN). The supersaturation reaches a maximum value (between 0.24 % at RV and 0.38 % at TH) and then starts to drop as the water vapor condenses. In the third stage of the simulation (starting at approximately 220 s), the aerosol has a negative velocity and starts to descend, eventually leaving the cloud. In the final stage of the simulation (starting at approximately 310 s), the aerosol parcel descends through the unsaturated layer below the cloud, and rapidly loses all condensed water. For the cloud used in this study, a single cloud cycle typically lasts 300 seconds after which the simulation is terminated, i.e. the downdraft leg outside the cloud is neglected. This time is sufficient for the parcel to achieve the maximum supersaturation, to condense the available liquid water, and to start to descend in the subsequent downdraft. The 50% BC cases result in a higher maximum supersaturation relative to the base case (for example, 0.42% compared to 0.40% at TH, and 0.25% compared to 0.24% at RV) and the condensation of liquid water is slightly slower. The updraft velocity profiles are identical in all cases, indicating that the small differences in the rate of water condensation in the different cases do not have an appreciable effect on the updraft velocity, since the difference in amount of latent heat released is relatively small.
15 Figure 5 illustrates the evolution of the BC particle size distribution at the start of the simulation, in-cloud, before maximum supersaturation, and in-cloud, after maximum supersaturation. In addition to the change in modal diameter as a result of growth of all particles due to cloud processing, a secondary mode at approximately 10 m and larger is seen, which we define to be the activated mode [Cantrell et al., 1999; Erlick et al., 2001] that can be integrated to determine the total number of cloud droplets formed and mean cloud droplet diameter. The cut-off diameter for this mode is identified from the number size distribution for each particle population following activation The impact of varying the updraft velocity in the constant updraft mode (and variations in the prescribed surface temperature difference and entrainment in the calculated updraft mode) on the maximum supersaturation and CDN concentration is illustrated in Fig. 6. For the calculated updraft, both the updraft velocity at the point of maximum supersaturation and the mean updraft velocity up to that point are shown. Prescribing a surface temperature difference between 0.5 and 1.5K produces mean updraft velocities between 0.3 and 0.9 m s -1 that are consistent with field measurements in clouds [Emanuel and Bister, 1996; Nicholls and Leighton, 1986]. Faster updrafts allow for a higher maximum supersaturation (0.3% and 0.5% respectively), and the trend is consistent with the constant updraft mode, where fixed updraft velocities between 0.2 and 1.6 m s -1 produce maximum supersaturation varying between 0.3 and 1.0%. The CDN concentration varies by a small amount between 312 cm -3 and 283 cm -3 over this range of velocities, indicating that activation determined kinetically by integrating the largest size
16 mode is limited by the total amount of available water vapor and aerosol concentration rather than updraft conditions IV. Case Studies The number concentration of aerosol particles, the number concentration of activated cloud droplets, the maximum supersaturation, and the mean cloud droplet diameter are summarized in Table 2 for the base case and the 50% BC reduction case for each of our case studies. We find that several consistent trends are observed across sites for both the base case and the 50% BC reduction case. First, the number concentration of cloud droplets (between 160 cm -3 at TH and 301 cm -3 at RV) is directly correlated to the number concentration of aerosol particles (7287 cm -3 at TH and cm -3 at RV), while the average droplet diameter is inversely related. This indicates that a large number of potential CCN compete with each other under these polluted conditions. The total liquid water in the parcel in each simulation reaches the maximum available water from the cloud. Secondly, a higher maximum supersaturation (0.38% at TH) is attained with a corresponding higher updraft velocity (0.92 m s -1 at TH) at lower aerosol concentrations indicating that the maximum supersaturation is limited by the size of the CCN sink, and the faster condensation in the more polluted cases releases latent heat more quickly, balancing the available buoyant force and resulting in slower updraft velocities A more interesting trend is observed when comparing the reduction in cloud droplet number concentrations in the 50% BC case to the base case. Since the BC particle type typically comprises between 20% and 30% by number of the total particles, the 50% BC
17 reduction causes between 7% (at TH) and 11% (at LB) reduction in the particle number concentration. The decrease in particle number concentration of cloud drops however is only between 5% (at TH and RV) and 9% (at LB). This implies that in addition to the total size distribution, the differences in aerosol chemical composition between the TH and LB cases are also a contributing factor to the differences in activation of cloud droplets. The particle number concentration and fraction of particles activated for each case study are illustrated in Figure 7 resolved by the four externally mixed particle types. The OC particles comprise the largest fraction of the total droplets (between 42% at RV and 55% at TH) and the nitrate particles comprise the smallest fraction (between 8% at TH and 16% at LB) consistent with the relative abundance of these particle types. Activated BC particles make up between 16% (at LB) and 20% (at TH) of the total cloud droplets. A much larger fraction (between 4% and 8%) of the more hygroscopic nitrate and sulfate particles activate compared to the less hygroscopic OC and BC particles (between 1% and 3%). In the 50% BC case, the total number concentration of activated BC droplets decreases, however this decrease is balanced to a certain extent by an increase in the number concentration of activated particles from the other three species. The climate implication of this result is that if only BC particles are reduced (in polluted environments), the many CCN that do not contain BC still activate in place of the BC aerosol particles preserving the cloud droplet populations and mean diameters. Even though the decrease in CDN is much less than proportional to the BC reduction (due to an associated increase in the number of activated non-bc particles), the net effect of BC reduction is a small decrease in the total CDN concentration. 401
18 V. Comparison with GCM simulations The total number concentration, composition, and mean size of the cloud droplets determine the cloud optical properties that, in turn, contribute to the quantitative radiative impact on the climate. Since the primary goal of this study is to understand the impact of BC mitigation on the aerosol indirect effect we can compare the CDN concentrations determined in this study with those from two state-of-the-art GCM simulations to evaluate the magnitude and trend in the change in cloud droplet concentration. In this work, we compare with the global model runs of GISS-TOMAS (a combination of Goddard Institute for Space Studies and Two Moment Aerosol Sectional models) [Adams and Seinfeld, 2002; Chen et al., 2010b] and GATOR-GCMOM (Gas, Aerosol, Transport, Radiation, General Circulation Mesoscale and Ocean Model) [Jacobson, 2010] models. We chose these models for comparison because they had completed BC-reduction experiments. In brief, the [Chen et al., 2010b] model tracks the size-resolved mass and number aerosol concentrations that are used to calculate cloud droplet concentrations using the parameterization of Nenes and Seinfeld, [2003] with the kinetic modification introduced by Fountoukis and Nenes, [2005], and a geographical resolution of 4 latitude x 5 longitude. For evaluating the aerosol indirect effect, changes to the cloud albedo and lifetime are calculated. Jacobson, [2010] used a global-to-regional scale nested model in which two domains were explicitly treated: a global and a California domain. The California domain was resolved at 0.15 degrees (~13 km) west-east x 0.2 degrees (~22.2 km) south-north. Cloud microphysics (liquid, ice, and graupel) were solved explicitly with size and composition resolution, while cloud thermodynamics were considered to be at quasi-equilibrium. In making this comparison between GCM results and these five
19 detailed case studies, we note the following differences that will necessarily make the comparison indirect: (1) GCM aerosol concentrations are constrained by emission inventories, while the parcel model is initialized by month-long intensive observations of ambient concentrations, (2) GCM values represent a grid-cell average around the sampling site as opposed to a point measurement, and (3) GCM cloud droplets are based on predictive meteorological fields whereas the detailed chemical model uses a single thermodynamic profile of a polluted stratocumulus cloud. For all of these reasons, we expect some variability between the parcel model and the GCM calculations of CDN Figures 8(a-c) compares the total aerosol size distributions at the five California sites. The GCM-simulated size distributions agree well with the measured size distributions in the 0.05 to 1 m size range but are higher by a factor of approximately 5 in the ultrafine size range (below 0.1 m diameter). Since the number size distribution can be dominated by a large number of very small particles in a polluted environment, this difference can be explained by the difference in the smallest size bins used across the models; these smallest particles however are unlikely to impact significantly the total aerosol mass and rarely activate to cloud droplets. The difference in size distributions between this work and the Jacobson, [2010] model is more pronounced at larger sizes relative to the Chen et al., [2010b] model, particularly the supermicron size range. This difference is likely due to the omission of large mineral dust in the parcel model. The absolute number of these particles, however, is small compared with the submicron particles so that they do not significantly impact CDN concentrations. 447
20 The total and BC-type particle number size distributions are illustrated in Figures 8(d-f). Here the difference is more pronounced, with the BC particles in the Jacobson, [2010] model being slightly larger compared to the other two distributions. This difference arises primarily from the differences in the simulation of BC particles from biomass burning. Both Chen et al., [2010a] and Jacobson, [2010] find a larger decrease in the BC burden when the biomass burning emissions are reduced in addition to fossil fuel emissions consistent with BC in biomass burning processes. In this work, we classify particles dominated by secondary and biomass tracers in the OC category. Thus the BC particles are more representative of fresh fossil fuel emissions and are smaller compared with the GCMs. Finally, Fig. 8(g-i) compare the size distribution of the total activated droplets (which are not computed in the Chen et al., [2010b] model that tracks the total water content and droplet number only). We find that both the modal diameter and total number concentration of cloud droplets agree well given the variety of differing assumptions in the three models, with particularly good agreement at the pristine TH location. The larger number concentration of droplets from the GCM can be attributed to the higher particle number concentrations discussed above Figure 9 compares the number concentrations of particles and cloud droplets from the GCMs and the parcel model. For the purposes of constraining the BC effect, the halffossil fuel BC case is used from Chen et al., [2010b] and the no fossil soot (NFS) case is used from Jacobson, [2010] (but the latter is only available from the global run as a Northern Hemisphere average). The primary trend that is observed is the direct correlation in the number concentrations for both total aerosol particles and total CDN
21 concentrations of the three models, i.e. all three models predict a higher concentration in the more polluted cases. Relative to this study, both GCMs have a larger absolute concentration by between 20 and 25% as discussed in the previous section. Both GCMs also predict a larger total concentration for the CDN concentrations, by between 17% and 22%. This comparison represents quite good agreement for the base case given that the GCMs predict aerosol concentrations from emission inventories, transport, and removal processes whereas the parcel model used five sets of short-term observations Slightly larger differences are observed in the relative changes between the base cases and the BC mitigation cases among the GCMs and the parcel model. Compared with the 7% to 11% decrease in particle number concentration from the parcel model, Chen et al., [2010b] find a larger decrease of between 18% and 20%. This larger reduction in particle number concentration by the Chen et al., [2010b] model is the result of their estimated decrease in the number concentrations of sulfate and organic particles from secondary particle formation associated with the reduced BC emissions (which are not identified by the ATOFMS characterization used in this study). Jacobson, [2010] removed all fossil soot emissions and found a decrease slightly smaller than the observationally-constrained particle concentrations in the parcel model of between 3% and 8% The change in CDN concentration for the reduced-bc cases largely tracked the reductions in BC aerosol concentration, with the Chen et al., [2010b] model finding the largest reduction, the Jacobson, [2010] model finding the smallest magnitude change, and the chemically detailed, observationally-constrained parcel model in between. The parcel
22 model found that the 50% BC case decreased CDN concentrations between 6% and 9%, which is comparable to the 9% to 12% decrease found by Chen et al., [2010b]. The larger decrease of Chen et al., [2010b] tracks the larger decrease in BC particle number concentration, as shown in Fig. 9. On the other hand, Jacobson, [2010], whose model included climate feedback and semi-direct effects, reported an increase in CDN concentration of 1% when fossil fuel emissions were eliminated. This increase was consistent for both the northern hemisphere and the global average in that study, but was not calculated for the nested-domain California studies discussed here BC particles in the Chen et al., [2010b] GCM and the parcel model are internally mixed with soluble species (such as organic acids, Ammonium Sulfate, and Ammonium Nitrate), making them somewhat hygroscopic. The Jacobson, [2010] GCM treated fossilfuel soot as evolving from externally-mixed to internally mixed. It was emitted into its own size distribution and could internally mix by coagulating into a separate size distribution containing other chemicals or by condensation of gases onto its own distribution. As a result, it was initially mostly hydrophobic but became more hygroscopic with aging. Biofuel soot, on the other hand, was more hygroscopic upon emissions because it was coated with more soluble chemicals and organic carbon. The no-fossil-soot case of that model then corresponds to the removal of particles that were not so effective in acting as CDN, producing no significant corresponding reduction in the CDN concentration for the northern hemisphere or the global average. A better comparison for California BC particles may be to the case that removes both fossil soot and biofuel burning soot, since the biofuel burning BC particles were modeled as more
23 hygroscopic (which is consistent with the BC measured in California) and because the larger overall BC reduction represents a larger fraction of the average concentration (which is more similar to reducing only fossil fuel BC in California, since fossil fuel BC is a large fraction of the atmospheric concentration). Two other reasons that the Jacobson, [2010] model has a smaller change in CDN in the no-fossil-soot only case are that it included the semi-direct effect [Hansen et al., 1997] and the cloud absorption effect [Jacobson, 2006] and precipitation changes, all of which can affect cloud droplet concentration. These climate feedback effects are not included in the Chen et al., [2010b] GCM or the parcel model calculations VI. Resolving Model Differences Although the parcel model and GCMs described in this work show some agreement in the total aerosol and CDN concentrations for California, the models have significantly different treatments, including of the aerosol microphysical state, cloud processes, activation mechanisms, and climate feedbacks. Further, they test a different set of mitigation scenarios with the GCMs using an emissions-up approach and the parcel model relying on modifying measured aerosols. In this section we attempt to isolate and resolve some of these differences by performing additional calculations that extend the case studies described in Sections III and IV Figure 10(a) compares the CDN determined by applying the parcel model in conjunction with the marine stratocumulus cloud described in this work with the available GCM
24 aerosol size distributions of Chen et al., [2010b] for both the base case and BC mitigation case, and Jacobson, [2010] for the base case (since detailed aerosol information for the mitigation case in California is not available). The different aerosol species (sulfate, EC, OC, and nitrate) are treated here as externally mixed. This comparison preserves the aerosol microphysical properties and therefore isolates the combined effect of the activation mechanisms and meteorology between the parcel model and the GCMs. In general, applying the parcel model produces CDNs that are between 2% (LB) and 16% (RV) higher than calculated by the GCMs for the base cases. For the corresponding BC reduction cases, the corresponding increase is between 2% (LB) and 11% (RV), indicating that the enhancement is higher for cases with a larger fraction of hygroscopic (non-bc) particles. Figure 10(b) compares the fraction of total particles activated into cloud droplets for the corresponding cases. The trend is reproduced consistently, and a higher fraction of particles is seen to activate when the relative fraction of BC type particles is reduced The effect of the internal mixing states for the aerosol population types described in Section II is examined by comparing the total number of CDNs determined by allowing internal mixing as described, and by treating each species as being only externally mixed i.e. the nitrate type particles are only nitrate and the BC type particles are only BC. The number size distributions for each particle type are unchanged, conserving the total number of aerosol particles. This experiment preserves the aerosol size and number, meteorology, and activation mechanisms, and isolates the effect of chemical composition. The change in CDN concentrations is illustrated in Figure 11 for ten simulation cases.
25 The number of activated sulfate and nitrate particles are found to increase in each case, but typically by less than 5%. This is consistent with the bulk of these particles with internal mixing being composed of highly hygroscopic species that dominate the solution equilibrium. For the OC particle types, the number of activated particles is found to decrease by between 5% and 8%. This decrease is consistent with the reduction in hygroscopicity for this particle type when the sulfate and nitrate mass is replaced by OC. The biggest change is seen for the BC particle type, where the number of activating particles is reduced by between 70% and 80% compared to the case with internal mixing. Due to the relatively high supersaturation, some of the hydrophobic BC particles still activate, but this number is small compared to when some internal mixing with hygroscopic species is allowed. These trends support the result that the CDN change is more sensitive to change in BC concentration when the BC is at least partially hygroscopic A recent study [Ghan et al., 2011] compared a number of complex cloud activation parameterizations and found significant differences in the maximum supersaturation and critical droplet diameters depending on the aerosol properties and updraft conditions. To isolate specifically the differences in activation between the parameterizations used in GCM studies and the explicit kinetic activation calculated by the parcel model, we have applied the parameterization of Nenes and Seinfeld, [2003] to the measured aerosol size distributions in this work. The temperature, pressure, and updraft conditions at the cloud base are used to determine the maximum supersaturation and corresponding cloud droplet number in a series of simplified offline calculations. The maximum supersaturation and
26 CDN calculated using the parameterization are compared to the full parcel model results in Figure 12, and summarized in Table 2. For the California case studies, the parameterization calculations determine a slightly higher maximum supersaturation, which results in a slightly larger number of cloud droplets activating. There are a number of factors that contribute to this difference. First, slight differences in the value of the enthalpy of phase change of water, and thermal conductivity lead to slightly different moist adiabats. Second, the simplified shape of the Köhler curves and supersaturation profile assumed by the parameterization to obtain a closed solution for the condensation integral (at the point of maximum supersaturation in the cloudy updraft) leads to slightly different growth rates of the droplet distribution. Third, the parameterization uses the temperature, pressure, and vertical velocity at the cloud base to approximate their values at the maximum supersaturation level, but it does not take into account how these evolve as the parcel travels upward in the cloud. Finally, any droplet reduction through the deactivation mechanism of Nenes et al., [2001] above the point of maximum supersaturation is not accounted for by the parameterization, and may (under conditions of very high CCN) lead to some overprediction in droplet number compared to the parcel model. Overall however, the evaluation here suggests that the parameterization captures droplet number well VII. Conclusion We have used a chemically-detailed microphysical parcel model to quantify activation of BC-type particles to cloud droplets in California. The aerosol particles are modeled as external mixtures of internally mixed chemical components constrained by observations
27 at five field sites that are representative of different regions in California. We have assessed one aspect of GCM predictions of the aerosol indirect effect of BC mitigation (namely their representation of the cloud albedo effect) by comparing their CDN predictions to the detailed chemical simulations of changing BC concentration on the cloud droplets. The chemically-detailed particle distributions from field campaigns were very comparable to the emission inventory-based particle concentrations used in GCMs. The particle number size distributions agree well for the three model types. BC particles in the parcel model are smaller than the GCMs possibly because the locations and seasons of the field campaigns did not represent all of the particle sources included in the GCMs The parcel model simulated a simple cloud layer that was consistent with typical stratocumulus observations, while incorporating accurate kinetic activation of chemically-resolved particle distributions to cloud droplets. In the polluted California environment, BC-type particles contribute between 14% and 18% of the total cloud droplets. The CDN concentrations from the chemically-detailed microphysical calculation agree reasonably well with GCM predictions for California. The parcel model predicted that BC mitigation reduces the droplet population in clouds by between 5% and 9%, with a corresponding increase in mean droplet size. This result agrees well with predictions for the half fossil fuel case from the Chen et al., [2010b] model (with a smaller relative magnitude). The predicted decrease in CDN by these two models differs from the Jacobson, [2010] model which found that fossil soot mitigation (in isolation from biomass burning soot) caused a 1% increase in CDN concentration. This difference
28 was likely the result of that model s treatment of fossil fuel BC particles as initially hydrophobic, although its inclusion of semi-direct and cloud absorption feedbacks could have also reduced CDN by reducing cloud supersaturation The reduction in CDN in California due to the decrease in activated BC particles supports the concern raised by Chen et al., [2010a] that the cloud albedo effect of BC particles partially offsets the direct forcing reduction. This effect was in fact also evident in the Jacobson, [2010] results when the larger number of more hygroscopic biomass burning particles was removed and CDN decreased by 10%. This result suggests that for regions like the California sites studied here, where BC mitigation targets fossil fuel sources, a critical aspect of the modeled reduction is the hygroscopicity of the BC particles removed as well as their relative contribution to particle concentrations. Nonetheless, a complete understanding of the BC mitigation in California and the rest of the world (including processes such as the impact on sea ice and land glaciers) requires further work to better constrain the other effects of BC on climate Acknowledgements This work was supported by the California Air Resources Board (CARB), under contract The statements and conclusions in this paper are those of the researchers (contractor) and not necessarily those of CARB. The mention of commercial products, their source, or their use in connection with material reported herein is not to be construed as actual or implied endorsement of such products. 655
29
30 659 Table 1. Summary of ATOFMS field campaigns used in this analysis. Location Campaig n Dates Coords. (N, W) Environment Refs. IMPRO VE Stn. Coords. (N, W) Trinidad Head (TH) CIFEX Apr , Clean marine, long-range pollution Holecek et al., [2005] LAVO 40.5, Riverside, (RV) SOAR I Aug , Highly polluted urban and regional transport Shields et al., [2008] SAGO 34.1, La Jolla (LJ) Dec , Polluted urban and biomass burning JOSH 33.3, Long Beach (LB) Aug , Polluted marine and urban mix Ault et al., [2009] AGTI 33.4, Sacramento (SA) CARES Jun , Polluted urban and long range transport BLIS 38.9, 121.1
31 Table 2. The number concentration of the total aerosol particles (N a ), black carbon particles (N b ), cloud droplets (N c ), black carbon cloud droplets (N bc ), total and percent difference in aerosol mass ( m), average cloud droplet diameter (D c ), maximum supersaturation (S max ), and corresponding updraft velocity (U). The maximum supersaturation (S par ) and droplet concentration (N par ) calculated using the Nenes and Seinfeld, [2003] parameterization are also listed. Location N a cm -3 N b cm -3 N c cm -3 N bc cm -3 - m g m -3 (%) S max % D c m U (at S max ) ms -1 S par % N p cm -3 Base Case TH RV LJ LB SA % BC Case TH (6%) RV (7%) LJ (5%) LB (6%) SA (7%)
32 References Adams, P. J., and J. H. Seinfeld (2002), Predicting global aerosol size distributions in general circulation models, Journal of Geophysical Research-Atmospheres, 107(D19), 23. Allen, J. O., et al. (2000), Particle detection efficiencies of aerosol time of flight mass spectrometers under ambient sampling conditions, Environ Sci Technol, 34(1), Andreae, M. O., and P. Merlet (2001), Emission of trace gases and aerosols from biomass burning, Global Biogeochemical Cycles, 15(4), Andreae, M. O., and D. Rosenfeld (2008), Aerosol-cloud-precipitation interactions. Part 1. The nature and sources of cloud-active aerosols, Earth-Sci. Rev., 89(1-2), Ault, A. P., et al. (2009), Impact of Emissions from the Los Angeles Port Region on San Diego Air Quality during Regional Transport Events, Environmental Science & Technology, 43(10), Bahadur, R., et al. (2010), Composition and Morphology of Individual Combustion, Biomass Burning, and Secondary Organic Particle Types Obtained Using Urban and Coastal ATOFMS and STXM-NEXAFS Measurements, Aerosol Science and Technology, 44(7), Bahadur, R., et al. (2011), Impact of California's air pollution laws on black carbon and their implications for direct radiative forcing, Atmospheric Environment, 45(5), Bauer, S. E., et al. (2010), A global modeling study on carbonaceous aerosol microphysical characteristics and radiative effects, Atmospheric Chemistry and Physics, 10(15), Bhave, P. V., et al. (2002), A field-based approach for determining ATOFMS instrument sensitivities to ammonium and nitrate, Environ Sci Technol, 36(22), Bond, T. C., et al. (2007), Historical emissions of black and organic carbon aerosol from energy-related combustion, , Global Biogeochemical Cycles, 21(2), 16. Cantrell, W., et al. (1999), Cloud properties inferred from bimodal aerosol number distributions, Journal of Geophysical Research-Atmospheres, 104(D22), Chen, W. T., et al. (2010a), Will black carbon mitigation dampen aerosol indirect forcing?, Geophysical Research Letters, 37. Chen, W. T., et al. (2010b), Global climate response to anthropogenic aerosol indirect effects: Present day and year 2100, Journal of Geophysical Research-Atmospheres, 115.
33 Durkee, P. A., et al. (2000), The Monterey Area Ship Track experiment, Journal of the Atmospheric Sciences, 57(16), Dusek, U., et al. (2006), CCN Activation of Pure and Coated Carbon Black Particles, Environmental Science & Technology, 40(4), Emanuel, K. A., and M. Bister (1996), Moist convective velocity and buoyancy scales, Journal of the Atmospheric Sciences, 53(22), Erlick, C., et al. (2001), A microphysics-based investigation of the radiative effects of aerosol-cloud interactions for two MAST Experiment case studies, Journal of Geophysical Research-Atmospheres, 106(D1), Forster, P., et al. (2007), Changes in Atmospheric Constituents and in Radiative Forcing, in Climate Change 2007 : The physical Science Basis. Contribution of Working Group I to the Fourth Assessment Report of the Intergovernmental Panel on Climate Change, edited by S. Solomon, et al., Cambridge University Press, Cambridge, UK and New York, USA. Fountoukis, C., and A. Nenes (2005), Continued development of a cloud droplet formation parameterization for global climate models, Journal of Geophysical Research- Atmospheres, 110(D11). Ghan, S. J., et al. (2011), Droplet Nucleation: Physically-based parameterizations and comparative evaluation, Journal of Advances in Modeling Earth Systems, 3, M Guibert, S., et al. (2003), Aerosol activation in marine stratocumulus clouds: 1. Measurement validation for a closure study, Journal of Geophysical Research- Atmospheres, 108(D15), 17. Hansen, J., et al. (1997), The missing climate forcing, Philos. Trans. R. Soc. B-Biol. Sci., 352(1350), Holecek, J. C., et al. (2005), Single particle chemical analysis of aerosols generated from rain water collected at trinidad head, CA during the cloud indirect effects experiment (CIFEX), Abstr. Pap. Am. Chem. Soc., 229, U127-U127. Jacobson, M. Z. (2002), Control of fossil-fuel particulate black carbon and organic matter, possibly the most effective method of slowing global warming, Journal of Geophysical Research-Atmospheres, 107(D19), 22. Jacobson, M. Z. (2006), Effects of externally-through-internally-mixed soot inclusions within clouds and precipitation on global climate, Journal of Physical Chemistry A, 110(21), Jacobson, M. Z. (2010), Short-term effects of Controlling Fossil-Fuel Soot, Biofuel Soot and Gases, and Methane on Climate, Arctic Ice, and Air Pollution Health, Journal of Geophysical Research-Atmospheres, 115(D14).
34 Koch, D., et al. (2009), Distinguishing Aerosol Impacts on Climate over the Past Century, Journal of Climate, 22(10), Koch, D., and A. D. Del Genio (2010), Black carbon semi-direct effects on cloud cover: review and synthesis, Atmospheric Chemistry and Physics, 10(16), Koch, D., et al. (2011), Soot microphysical effects on liquid clouds, a multi-model investigation, Atmospheric Chemistry and Physics, 11(3), Koehler, K. A., et al. (2009), Cloud condensation nuclei and ice nucleation activity of hydrophobic and hydrophilic soot particles, Phys. Chem. Chem. Phys., 11(36), Kristjansson, J. E., et al. (2005), Response of the climate system to aerosol direct and indirect forcing: Role of cloud feedbacks, Journal of Geophysical Research- Atmospheres, 110(D24). Lammel, G., and T. Novakov (1995), Water nucleation properties of carbon black and diesel soot particles, Atmospheric Environment, 29(7), Lohmann, U., and J. Feichter (2005), Global indirect aerosol effects: a review, Atmospheric Chemistry and Physics, 5, Lu, M. L., et al. (2007), The Marine Stratus/Stratocumulus Experiment (MASE): Aerosol-cloud relationships in marine stratocumulus, J Geophys Res-Atmos, 112(D10). Lucas, C., et al. (1994), Convective Available Potential-Energy in the Environment of Oceanic and Continental Clouds - Correction and Comments, Journal of the Atmospheric Sciences, 51(24), Meskhidze, N., et al. (2005), Evaluation of a new cloud droplet activation parameterization with in situ data from CRYSTAL-FACE and CSTRIPE, J Geophys Res- Atmos, 110(D16). Moffet, R. C., et al. (2008), Measurement of ambient aerosols in northern Mexico City by single particle mass spectrometry, Atmospheric Chemistry and Physics, 8(16), Morales, R., and A. Nenes (2010), Characteristic updrafts for computing distributionaveraged cloud droplet number and stratocumulus cloud properties, Journal of Geophysical Research-Atmospheres, 115. Nenes, A., et al. (2001), Kinetic limitations on cloud droplet formation and impact on cloud albedo, Tellus Series B-Chemical and Physical Meteorology, 53(2), Nenes, A., and J. H. Seinfeld (2003), Parameterization of cloud droplet formation in global climate models, Journal of Geophysical Research, 108(D14), 4415.
35 Nicholls, S., and J. Leighton (1986), An Observational Study of the Structure of Stratiform Cloud Sheets.1. Structure, Quarterly Journal of the Royal Meteorological Society, 112(472), Ogren, J. A., and R. J. Charlson (1983), Elemental Carbon in the Atmosphere - Cycle and Lifetime, Tellus Series B-Chemical and Physical Meteorology, 35(4), Pratt, K. A., et al. (2010), In Situ Chemical Characterization of Aged Biomass-Burning Aerosols Impacting Cold Wave Clouds, Journal of the Atmospheric Sciences, 67(8), Pruppacher, H. R., and J. D. Klett (2003), Microphysics of Clouds and Precipitation, Kluwer Academic, Norwell, MA. Qin, X. Y., et al. (2006), Comparison of two methods for obtaining quantitative mass concentrations from aerosol time-of-flight mass spectrometry measurements, Analytical Chemistry, 78(17), Ramanathan, V., and G. Carmichael (2008), Global and regional climate changes due to black carbon, Nature Geoscience, 1(4), Roberts, G. C., et al. (2003), Impact of biomass burning on cloud properties in the Amazon Basin, Journal of Geophysical Research-Atmospheres, 108(D2). Russell, L. M., and J. H. Seinfeld (1998), Size- and composition-resolved externally mixed aerosol model, Aerosol Science and Technology, 28(5), Russell, L. M., et al. (2011), Identifying organic aerosol sources by comparing functional group composition in chamber and atmospheric particles, Proc. Natl. Acad. Sci. U. S. A., 108(9), Shields, L. G., et al. (2008), Detection of ambient ultrafine aerosols by single particle techniques during the SOAR 2005 campaign, Aerosol Science and Technology, 42(8), Silva, P. J., and K. A. Prather (1997), On-line characterization of individual particles from automobile emissions, Environmental Science & Technology, 31(11), Silva, P. J., et al. (1999), Size and chemical characterization of individual particles resulting from biomass burning of local Southern California species, Environmental Science & Technology, 33(18), Snider, J. R., et al. (2003), Aerosol activation in marine stratocumulus clouds: 2. Kohler and parcel theory closure studies, Journal of Geophysical Research-Atmospheres, 108(D15), 23. Sodeman, D. A., et al. (2005), Determination of single particle mass spectral signatures from light-duty vehicle emissions, Environ Sci Technol, 39(12),
36 Spracklen, D. V., et al. (2011), Global cloud condensation nuclei influenced by carbonaceous combustion aerosol, Atmospheric Chemistry and Physics, 11(17), Stier, P., et al. (2007), Aerosol absorption and radiative forcing, Atmospheric Chemistry and Physics, 7(19), Suess, D. T., and K. A. Prather (1999), Mass spectrometry of aerosols, Chemical Reviews, 99(10), Yan, F., et al. (2011), Global emission projections of particulate matter (PM): I. Exhaust emissions from on-road vehicles, Atmospheric Environment, 45(28),
37 Figure 1: Size dependent population for the BC-type (black), OC-type (green), Sulfatetype (red), and Nitrate-type (blue) particle types described in Sec. II at (a-c) TH, (d-f) RV, (g-i) LJ, (j-l) LB, and (m-o) SA field sites. Panels (a), (d), (g), (j), and (m) illustrate the relative number fraction measured using the ATOFMS, panels (b), (e), (h), (k), and (n) illustrate the number size distribution of each particle type (reconstructed from ATOFMS, SMPS, and APS measurements) in cm -3, and panels (c), (f), (i), (l), and (o) illustrate the corresponding mass distribution in g m -3
38 Figure 2: Calculated composition of each of the four types of particles used in the chemically-detailed parcel model: (a) BC-type, (b) OC-type, (c) Sulfate-type, and (d) Nitrate-type externally mixed particles. Chemical species are Ammonium Sulfate (red), Ammonium Nitrate (blue), long chain carboxylic acids (green), EC (grey), and Sodium Chloride (yellow).
 EC, (f-j) OC, (k-o) Sulfate, and (p-t) Nitrate at the TH (blue), RV (red), LJ (green), LB (black), and SA (orange) sites.")
39 Figure 3: Monthly averages for the total PM2.5 mass concentration of (a-e) EC, (f-j) OC, (k-o) Sulfate, and (p-t) Nitrate at the TH (blue), RV (red), LJ (green), LB (black), and SA (orange) sites. Solid lines are filter based measurements from nearly collocated IMPROVE network sites at LAVO (blue), SAGO (red), JOSH (green), AGTI (black) and BLIS (orange). Dashed lines are from Jacobson, [2010] and dotted lines are from Chen et al., [2010b]. Squares show monthly averages based on ATOFMS and particle size measurements used for initializing the parcel model. IMPROVE data is illustrated for 2006, with bars showing the 10 year variability from
40 Figure 4: Parcel model simulations of the (a) Altitude, (b) RH, (c) liquid water content, and (d) updraft velocity for TH (blue), RV(red), LJ (green), LB (black), and SA (orange) over a single cloud cycle. Solid lines show the base case and dashed lines show the 50%BC case.
41 Figure 5: Parcel model simulations of the BC particle size distribution from (a) TH, (b) SA, (c) LB, (d) LJ, and (e) RV cases. Dotted lines are below cloud (t=50 s), dashed lines are in-cloud before max RH (t=150 s), and solid lines are in-cloud after max RH (t=250 s). Particles in the secondary mode around 10 μm are considered activated.
42 Figure 6: Parcel model simulations of the dependence on the updraft velocity operating in fixed updraft (triangles) and energy conservation (circles) mode: (a) maximum supersaturation and (b) cloud droplet number concentration. Empty circles indicate updraft at maximum supersaturation and filled circles indicate mean updraft velocity up to the maximum supersaturation.
, OC-type (green), Sulfate-type (red), and Nitrate-type (blue) particles for a single cloud processing cycle.")
43 Figure 7: Parcel model simulations of the (a-e) cloud droplet number concentration and (f-j) fraction of particles activated for externally mixed particle populations corresponding to BC-type (black), OC-type (green), Sulfate-type (red), and Nitrate-type (blue) particles for a single cloud processing cycle. The base (solid lines) and 50%BC (dashed lines) cases are illustrated for (a),(f) TH, (b),(g) RV, (c),(h) LJ, (d),(i) LB, and (e),(j) SA.
44 Figure 8: Comparison of the number size distribution of the (a-c) total particles, (d-f) BC type particles, and (g-i) Cloud droplets. Line colors indicate the sites: TH (blue), SA (orange), LB (black), LJ (green), and RV (red). Solid lines show results from the parcel model, dashed lines are from Jacobson, [2010], and dotted lines are from Chen et al., [2010b].
45 Figure 9: Comparison of (a) total particles, (b) activated cloud droplet number, (c) change in the droplet concentration (defined as base case-bc mitigation case), and (d) dependence of change in droplet number on change in BC-type particle number from this study at TH (blue), SA (orange), LB (black), LJ (green), and RV (red) with the GISS [Chen et al., 2010b] (squares) and GATOR-GCMOM [Jacobson, 2010] (triangles) GCMs. Empty squares represent the half-fossil case from Chen et al., [2010b] and empty triangles show the range of the no fossil soot and no fossil/biomass soot values averaged for the Northern Hemisphere.
46 Figure 10. Comparison of the (a) total CDN and (b) CDN/Particle ratio determined from the GCMs using a full climate simulation, and by applying the parcel model and meteorology described in this work to the aerosol concentrations determined from the GCMs. The symbols used are the same as Figure 9.
47 Figure 11. The total number of particles activated for (a) Sulfate, (b) Nitrate, (c) OC, and (d) EC type particles when no internal mixing is allowed, compared to the internal mixing states illustrated in Figure 2.
48 Figure 12. Comparison of the (a) maximum supersaturation and (b) cloud droplet number determined using measured aerosol size distributions by application of the Nenes and Seinfeld, [2003] parameterization and the parcel model for the cloud conditions described in this study.
49
50
Implications of Sulfate Aerosols on Clouds, Precipitation and Hydrological Cycle
 Implications of Sulfate Aerosols on Clouds, Precipitation and Hydrological Cycle Source: Sulfate aerosols are produced by chemical reactions in the atmosphere from gaseous precursors (with the exception
CHAPTER 8. AEROSOLS 8.1 SOURCES AND SINKS OF AEROSOLS
 1 CHAPTER 8 AEROSOLS Aerosols in the atmosphere have several important environmental effects They are a respiratory health hazard at the high concentrations found in urban environments They scatter and
Aerosol Effects on Water and Ice Clouds
 Aerosol Effects on Water and Ice Clouds Ulrike Lohmann Department of Physics and Atmospheric Science, Dalhousie University, Halifax, N. S., Canada Contributions from Johann Feichter, Johannes Hendricks,
Aerosol Basics: Definitions, size distributions, structure
 Aerosol Basics: Definitions, size distributions, structure Antti Lauri NetFAM Summer School Zelenogorsk, 9 July 2008 Department of Physics, Division of Atmospheric Sciences and Geophysics, University of
Aerosols AP sizes AP types Sources Sinks Amount and lifetime Aerosol radiative effects. Aerosols. Trude Storelvmo Aerosols 1 / 21
 Aerosols Trude Storelvmo Aerosols 1 / 21 Aerosols: Definition Definition of an aerosol: disperse system with air as carrier gas and a solid or liquid or a mixture of both as disperse phases. Aerosol particles
Atmospheric Aerosol in High Latitudes: Linkages to Radiative Energy Balance and Hydrological Cycle
 Atmospheric Aerosol in High Latitudes: Linkages to Radiative Energy Balance and Hydrological Cycle Irina N. Sokolik School of Earth and Atmospheric Sciences Georgia Institute of Technology Atlanta, GA,
Clouds, Haze, and Climate Change
 Clouds, Haze, and Climate Change Jim Coakley College of Oceanic and Atmospheric Sciences Earth s Energy Budget and Global Temperature Incident Sunlight 340 Wm -2 Reflected Sunlight 100 Wm -2 Emitted Terrestrial
Black carbon radiative heating effects on cloud microphysics and implications for the aerosol indirect effect: 2. Cloud microphysics
 Black carbon radiative heating effects on cloud microphysics and implications for the aerosol indirect effect: 2. Cloud microphysics Athanasios Nenes, William C. Conant and John H. Seinfeld Departments
Black carbon radiative heating effects on cloud microphysics and implications for the aerosol indirect effect 2. Cloud microphysics
 JOURNAL OF GEOPHYSICAL RESEARCH, VOL. 107, NO. D21, 4605, doi:10.1029/2002jd002101, 2002 Black carbon radiative heating effects on cloud microphysics and implications for the aerosol indirect effect 2.
Parameterization of the nitric acid effect on CCN activation
 Atmos. Chem. Phys., 5, 879 885, 25 SRef-ID: 168-7324/acp/25-5-879 European Geosciences Union Atmospheric Chemistry and Physics Parameterization of the nitric acid effect on CCN activation S. Romakkaniemi,
Chapter Eight: Conclusions and Future Work
 2004 PhD Thesis 202 Chapter Eight: Conclusions and Future Work 8.1 Conclusions The Aerodyne aerosol mass spectrometer is capable of providing quantitative information on the chemical composition of the
Introduction. Effect of aerosols on precipitation: - challenging problem - no agreement between the results (quantitative and qualitative)
") Introduction Atmospheric aerosols affect the cloud mycrophysical structure & formation (observations, numerical studies) An increase of the aerosol particles: - increases CCN concentrations - decreases
Introduction Atmospheric aerosols affect the cloud mycrophysical structure & formation (observations, numerical studies) An increase of the aerosol particles: - increases CCN concentrations - decreases
Cloud Condensation Nuclei Hygroscopic Parameter Kappa
 Cloud Condensation Nuclei Hygroscopic Parameter Kappa Covers Reading Material in Chapter 17.5 Atmospheric Sciences 5200 Physical Meteorology III: Cloud Physics Cloud Condensation Nuclei (CCN) Form a cloud
5. General Circulation Models
 5. General Circulation Models I. 3-D Climate Models (General Circulation Models) To include the full three-dimensional aspect of climate, including the calculation of the dynamical transports, requires
Slides partly by Antti Lauri and Hannele Korhonen. Liquid or solid particles suspended in a carrier gas Described by their
 Atmospheric Aerosols Slides partly by Antti Lauri and Hannele Korhonen Aerosol particles Liquid or solid particles suspended in a carrier gas Described by their Size Concentration - Number - Surface -
Diagnosis of Relative Humidity Changes in a Warmer Climate Using Tracers of Last Saturation
 Diagnosis of Relative Humidity Changes in a Warmer Climate Using Tracers of Last Saturation 8 March, 2011 Jonathon Wright Department of Applied Mathematics & Theoretical Physics University of Cambridge
Aerosol-Cloud-Radiation Interactions in Atmospheric Forecast Models
 Aerosol-Cloud-Radiation Interactions in Atmospheric Forecast Models John H. Seinfeld, Principal Investigator California Institute of Technology 1200 E. California Blvd., M/C 210-41 Pasadena, CA 91125 (626)
Measurements of isoprene-derived organosulfates in ambient aerosols by aerosol time-offlight
 Supporting Information Measurements of isoprene-derived organosulfates in ambient aerosols by aerosol time-offlight mass spectrometry- Part 1: Single particle atmospheric observations in Atlanta Lindsay
Final Exam: Monday March 17 3:00-6:00 pm (here in Center 113) Slides from Review Sessions are posted on course website:
 Slides from Review Sessions are posted on course website:") Final Exam: Monday March 17 3:00-6:00 pm (here in Center 113) 35% of total grade Format will be all multiple choice (~70 questions) Final exam will cover entire course - material since 2 nd midterm weighted
Final Exam: Monday March 17 3:00-6:00 pm (here in Center 113) 35% of total grade Format will be all multiple choice (~70 questions) Final exam will cover entire course - material since 2 nd midterm weighted
Importance of vertical velocity variations in the cloud droplet nucleation process of marine stratus clouds
 JOURNAL OF GEOPHYSICAL RESEARCH, VOL. 110,, doi:10.1029/2004jd004922, 2005 Importance of vertical velocity variations in the cloud droplet nucleation process of marine stratus clouds Yiran Peng, 1,2 Ulrike
Warm Rain Precipitation Processes
 Warm Rain Precipitation Processes Cloud and Precipitation Systems November 16, 2005 Jonathan Wolfe 1. Introduction Warm and cold precipitation formation processes are fundamentally different in a variety
Progress on Application of Modal Aerosol Dynamics to CAM
 Progress on Application of Modal Aerosol Dynamics to CAM Xiaohong Liu, Steve Ghan, Richard Easter, Rahul Zaveri, Yun Qian (Pacific Northwest National Laboratory) Jean-Francois Lamarque, Peter Hess, Natalie
climate change Contents CO 2 (ppm)
") climate change CO 2 (ppm) 2007 Joachim Curtius Institut für Physik der Atmosphäre Universität Mainz Contents 1. Summary 2. Background 3. Climate change: observations 4. CO 2 5. OtherGreenhouse Gases (GHGs):
climate change CO 2 (ppm) 2007 Joachim Curtius Institut für Physik der Atmosphäre Universität Mainz Contents 1. Summary 2. Background 3. Climate change: observations 4. CO 2 5. OtherGreenhouse Gases (GHGs):
Aerosols and climate. Rob Wood, Atmospheric Sciences
 Aerosols and climate Rob Wood, Atmospheric Sciences What are aerosols? Solid or liquid particles suspended in air Sizes range from a few nm to a few thousand nm Huge range of masses Where do aerosols come
Modelling aerosol-cloud interations in GCMs
 Modelling aerosol-cloud interations in GCMs Ulrike Lohmann ETH Zurich Institute for Atmospheric and Climate Science Reading, 13.11.2006 Acknowledgements: Sylvaine Ferrachat, Corinna Hoose, Erich Roeckner,
Kinetic Limitations on Cloud Droplet Formation and Impact on Cloud Albedo
 1 Appeared in Tellus B, 53, 133 149, 2001. Kinetic Limitations on Cloud Droplet Formation and Impact on Cloud Albedo Athanasios Nenes Department of Chemical Engineering,Mail Code 210-41, California Institute
The Structure and Motion of the Atmosphere OCEA 101
 The Structure and Motion of the Atmosphere OCEA 101 Why should you care? - the atmosphere is the primary driving force for the ocean circulation. - the atmosphere controls geographical variations in ocean
Aerosol. Challenge: Global Warming. Observed warming during 20 th century, Tapio. 1910s. 1950s. 1990s T [Kelvin]
![Aerosol. Challenge: Global Warming. Observed warming during 20 th century, Tapio. 1910s. 1950s. 1990s T [Kelvin]](/thumbs/86/93830655.jpg "Aerosol. Challenge: Global Warming. Observed warming during 20 th century, Tapio. 1910s. 1950s. 1990s T [Kelvin]") Aerosol Challenge: Global Warming 1910s 1950s 1990s 2 1 0 +1 +2 T [Kelvin] Observed warming during 20 th century, Tapio Schneider, J. Climate, 2001 1 Aerosols are liquid or solid particles suspended in
Aerosol Challenge: Global Warming 1910s 1950s 1990s 2 1 0 +1 +2 T [Kelvin] Observed warming during 20 th century, Tapio Schneider, J. Climate, 2001 1 Aerosols are liquid or solid particles suspended in
Role of atmospheric aerosol concentration on deep convective precipitation: Cloud-resolving model simulations
 Role of atmospheric aerosol concentration on deep convective precipitation: Cloud-resolving model simulations Wei-Kuo Tao,1 Xiaowen Li,1,2 Alexander Khain,3 Toshihisa Matsui,1,2 Stephen Lang,4 and Joanne
Direct radiative forcing due to aerosols in Asia during March 2002
 Direct radiative forcing due to aerosols in Asia during March 2002 Soon-Ung Park, Jae-In Jeong* Center for Atmospheric and Environmental Modeling *School of Earth and Environmental Sciences, Seoul National
2. Fargo, North Dakota receives more snow than Charleston, South Carolina.
 2015 National Tournament Division B Meteorology Section 1: Weather versus Climate Chose the answer that best answers the question 1. The sky is partly cloudy this morning in Lincoln, Nebraska. 2. Fargo,
1. describe the two methods by which cloud droplets can grow to produce precipitation (pp );
;") 10 Precipitation Learning Goals After studying this chapter, students should be able to: 1. describe the two methods by which cloud droplets can grow to produce precipitation (pp. 232 236); 2. distinguish
10 Precipitation Learning Goals After studying this chapter, students should be able to: 1. describe the two methods by which cloud droplets can grow to produce precipitation (pp. 232 236); 2. distinguish
Thermodynamics of Atmospheres and Oceans
 Thermodynamics of Atmospheres and Oceans Judith A. Curry and Peter J. Webster PROGRAM IN ATMOSPHERIC AND OCEANIC SCIENCES DEPARTMENT OF AEROSPACE ENGINEERING UNIVERSITY OF COLORADO BOULDER, COLORADO USA
9 Condensation. Learning Goals. After studying this chapter, students should be able to:
 9 Condensation Learning Goals After studying this chapter, students should be able to: 1. explain the microphysical processes that operate in clouds to influence the formation and growth of cloud droplets
Parametrizing cloud and precipitation in today s NWP and climate models. Richard Forbes
 Parametrizing cloud and precipitation in today s NWP and climate models Richard Forbes (ECMWF) with thanks to Peter Bechtold and Martin Köhler RMetS National Meeting on Clouds and Precipitation, 16 Nov
Aerosol Dynamics. Antti Lauri NetFAM Summer School Zelenogorsk, 9 July 2008
 Aerosol Dynamics Antti Lauri NetFAM Summer School Zelenogorsk, 9 July 2008 Department of Physics, Division of Atmospheric Sciences and Geophysics, University of Helsinki Aerosol Dynamics: What? A way to
Arctic climate: Unique vulnerability and complex response to aerosols
 Arctic climate: Unique vulnerability and complex response to aerosols Mark Flanner November 2, 2011 Santa Fe Conference on Global and Regional Climate Change 1 / 18 Arctic: Unique vulnerability to positive
AEROSOL-CLOUD INTERACTIONS AND PRECIPITATION IN A GLOBAL SCALE. SAHEL Conference April 2007 CILSS Ouagadougou, Burkina Faso
 AEROSOL-CLOUD INTERACTIONS AND PRECIPITATION IN A GLOBAL SCALE SAHEL Conference 2007 2-6 April 2007 CILSS Ouagadougou, Burkina Faso The aerosol/precipitation connection Aerosol environment has changed
Can a change of single scattering albedo in Amami-Oshima in a low pressure condition be explained by GCM simulations?
 Can a change of single scattering albedo in Amami-Oshima in a low pressure condition be explained by GCM simulations? Daisuke Goto 1, Toshihiko Takemura 2, Nick Schutgens 1, Haruo Tsuruta 1, and Teruyuki
Polar regions Temperate Regions Tropics High ( cirro ) 3-8 km 5-13 km 6-18 km Middle ( alto ) 2-4 km 2-7 km 2-8 km Low ( strato ) 0-2 km 0-2 km 0-2 km
 3-8 km 5-13 km 6-18 km Middle ( alto ) 2-4 km 2-7 km 2-8 km Low ( strato ) 0-2 km 0-2 km 0-2 km") Clouds and Climate Clouds (along with rain, snow, fog, haze, etc.) are wet atmospheric aerosols. They are made up of tiny spheres of water from 2-100 m which fall with terminal velocities of a few cm/sec.
Clouds and Climate Clouds (along with rain, snow, fog, haze, etc.) are wet atmospheric aerosols. They are made up of tiny spheres of water from 2-100 m which fall with terminal velocities of a few cm/sec.
Chemical and Dynamical Effects on Cloud Droplet Number: Implications for Estimates of the Aerosol Indirect Effect
 Chemical and Dynamical Effects on Cloud Droplet Number: Implications for Estimates of the Aerosol Indirect Effect SARA LANCE 1, A. NENES 1,2*, T. RISSMAN 3 1 School of Earth and Atmospheric Sciences and
Evaluation of a new Cloud Droplet Activation Parameterization with In Situ Data from CRYSTAL-FACE and CSTRIPE
 Evaluation of a new Cloud Droplet Activation Parameterization with In Situ Data from CRYSTAL-FACE and CSTRIPE Nicholas Meskhidze 1, Athanasios Nenes 1,2*, William C. Conant 3, John H. Seinfeld 3,4 1 School
Assessment Schedule 2017 Earth and Space Science: Demonstrate understanding of processes in the atmosphere system (91414)
") NCEA Level 3 Earth and Space Science (91414) 2017 page 1 of 6 Assessment Schedule 2017 Earth and Space Science: Demonstrate understanding of processes in the atmosphere system (91414) Evidence Statement
NCEA Level 3 Earth and Space Science (91414) 2017 page 1 of 6 Assessment Schedule 2017 Earth and Space Science: Demonstrate understanding of processes in the atmosphere system (91414) Evidence Statement
Satellite analysis of aerosol indirect effect on stratocumulus clouds over South-East Atlantic
 1/23 Remote sensing of atmospheric aerosol, clouds and aerosol-cloud interactions. Bremen, 16-19 December 2013 Satellite analysis of aerosol indirect effect on stratocumulus clouds over South-East Atlantic
Response to Reviewer s comments
 Response to Reviewer s comments (MS Ref. No.: acp-2010-98): Long-term record of aerosol optical properties and chemical composition from a high-altitude site (Manora Peak) in Central Himalaya by K. Ram
Response to Referee 2
 Response to Referee 2 S. Metzger et al. 10 August 2018 We thank the referee for the manuscript review. Please find our pointby-point reply below. Accordingly, the revised MS will include clarifications.
Chapter 7 Precipitation Processes
 Chapter 7 Precipitation Processes Chapter overview: Supersaturation and water availability Nucleation of liquid droplets and ice crystals Liquid droplet and ice growth by diffusion Collision and collection
AT350 EXAM #1 September 23, 2003
 AT350 EXAM #1 September 23, 2003 Name and ID: Enter your name and student ID number on the answer sheet and on this exam. Record your answers to the questions by using a No. 2 pencil to completely fill
Modeling of cloud microphysics: from simple concepts to sophisticated parameterizations. Part I: warm-rain microphysics
 Modeling of cloud microphysics: from simple concepts to sophisticated parameterizations. Part I: warm-rain microphysics Wojciech Grabowski National Center for Atmospheric Research, Boulder, Colorado parameterization
Ch22&23 Test. Multiple Choice Identify the choice that best completes the statement or answers the question.
 Ch22&23 Test Multiple Choice Identify the choice that best completes the statement or answers the question. 1. The two most abundant compounds in the atmosphere are carbon dioxide and a. particulates.
The Sensitivity of Global Nucleation, CCN and Climate to SO2 and Criegee-Intermediate Chemistry
 The Sensitivity of Global Nucleation, CCN and Climate to SO2 and Criegee-Intermediate Chemistry Jeff Pierce, Mat Evans, Cat Scott, Steve D'Andrea, Delphine Farmer, Erik Swietlicki and Dom Spracklen Pierce,
Predicting cloud droplet number concentration in Community Atmosphere Model (CAM)-Oslo
-Oslo") JOURNAL OF GEOPHYSICAL RESEARCH, VOL. 111,, doi:10.1029/2005jd006300, 2006 Predicting cloud droplet number concentration in Community Atmosphere Model (CAM)-Oslo Trude Storelvmo, 1 Jon Egill Kristjánsson,
JOURNAL OF GEOPHYSICAL RESEARCH, VOL. 111,, doi:10.1029/2005jd006300, 2006 Predicting cloud droplet number concentration in Community Atmosphere Model (CAM)-Oslo Trude Storelvmo, 1 Jon Egill Kristjánsson,
Weather Forecasts and Climate AOSC 200 Tim Canty. Class Web Site: Lecture 27 Dec
 Weather Forecasts and Climate AOSC 200 Tim Canty Class Web Site: http://www.atmos.umd.edu/~tcanty/aosc200 Topics for today: Climate Natural Variations Feedback Mechanisms Lecture 27 Dec 4 2018 1 Climate
Lecture 8: Climate Modeling
 Lecture 8: Climate Modeling How to Build a Climate Model The climate is governed by many complex physical, chemical, and biological processes and their interactions. Building a climate model needs to consider
The PRECIS Regional Climate Model
 The PRECIS Regional Climate Model General overview (1) The regional climate model (RCM) within PRECIS is a model of the atmosphere and land surface, of limited area and high resolution and locatable over
Clouds and Rain Unit (3 pts)
") Name: Section: Clouds and Rain Unit (Topic 8A-2) page 1 Clouds and Rain Unit (3 pts) As air rises, it cools due to the reduction in atmospheric pressure Air mainly consists of oxygen molecules and nitrogen
Name: Section: Clouds and Rain Unit (Topic 8A-2) page 1 Clouds and Rain Unit (3 pts) As air rises, it cools due to the reduction in atmospheric pressure Air mainly consists of oxygen molecules and nitrogen
ATMOSPHERIC ENERGY and GLOBAL TEMPERATURES. Physical Geography (Geog. 300) Prof. Hugh Howard American River College
 Prof. Hugh Howard American River College") ATMOSPHERIC ENERGY and GLOBAL TEMPERATURES Physical Geography (Geog. 300) Prof. Hugh Howard American River College RADIATION FROM the SUN SOLAR RADIATION Primarily shortwave (UV-SIR) Insolation Incoming
ATMOSPHERIC ENERGY and GLOBAL TEMPERATURES Physical Geography (Geog. 300) Prof. Hugh Howard American River College RADIATION FROM the SUN SOLAR RADIATION Primarily shortwave (UV-SIR) Insolation Incoming
Why is it difficult to predict climate? Understanding current scientific challenges
 Why is it difficult to predict climate? Understanding current scientific challenges Akua Asa-Awuku October 22, 2009 Global Climate Change (GCC) Workshop University of California - Riverside Bourns College
Mid High Latitude Cirrus Precipitation Processes. Jon Sauer, Dan Crocker, Yanice Benitez
 Mid High Latitude Cirrus Precipitation Processes Jon Sauer, Dan Crocker, Yanice Benitez Department of Chemistry and Biochemistry, University of California, San Diego, CA 92093, USA *To whom correspondence
Aerosol Composition and Radiative Properties
 Aerosol Composition and Radiative Properties Urs Baltensperger Laboratory of Atmospheric Chemistry Paul Scherrer Institut, 5232 Villigen PSI, Switzerland WMO-BIPM Workshop Geneva, 30 March 1 April 2010
Lecture 07 February 10, 2010 Water in the Atmosphere: Part 1
 Lecture 07 February 10, 2010 Water in the Atmosphere: Part 1 About Water on the Earth: The Hydrological Cycle Review 3-states of water, phase change and Latent Heat Indices of Water Vapor Content in the
Climate Dynamics (PCC 587): Feedbacks & Clouds
: Feedbacks & Clouds") Climate Dynamics (PCC 587): Feedbacks & Clouds DARGAN M. W. FRIERSON UNIVERSITY OF WASHINGTON, DEPARTMENT OF ATMOSPHERIC SCIENCES DAY 6: 10-14-13 Feedbacks Climate forcings change global temperatures directly
Climate Dynamics (PCC 587): Feedbacks & Clouds DARGAN M. W. FRIERSON UNIVERSITY OF WASHINGTON, DEPARTMENT OF ATMOSPHERIC SCIENCES DAY 6: 10-14-13 Feedbacks Climate forcings change global temperatures directly
THE EFFECTS OF GIANT CCN ON CLOUDS AND PRECIPITATION: A CASE STUDY FROM THE SAUDI ARABIA PROGRAM FOR THE ASSESSMENT OF RAINFALL AUGMENTATION
 J12.2 THE EFFECTS OF GIANT CCN ON CLOUDS AND PRECIPITATION: A CASE STUDY FROM THE SAUDI ARABIA PROGRAM FOR THE ASSESSMENT OF RAINFALL AUGMENTATION Amit Teller*, Duncan Axisa, Daniel Breed, and Roelof Bruintjes
Physio-chemical and Optical Characterization of Anthropogenic and Natural Aerosol: Implications for Assessing Global Effects
 Physio-chemical and Optical Characterization of Anthropogenic and Natural Aerosol: Implications for Assessing Global Effects GLOBE Pollution Southern Japan TRACE-P, 2001 Dust Antony Clarke, University
Cloud Brightening and Climate Change
 Cloud Brightening and Climate Change 89 Hannele Korhonen and Antti-Ilari Partanen Contents Definitions... 778 Aerosols and Cloud Albedo... 778 Cloud Brightening with Sea-Salt Aerosol... 779 Climate Effects
Effect of aging on cloud nucleating properties of atmospheric aerosols
 Effect of aging on cloud nucleating properties of atmospheric aerosols Yan Ma Nanjing University of Information Science & Technology The 1st Regional GEOS-Chem Asia Meeting 2015 年 5 月 8 日 Indirect effect
Arctic Chemistry And Climate
 21 July 2016 Connaught Summer Institute 1 Arctic Chemistry And Climate Connaught Summer Institute 2016 William (Bill) Simpson Geophysical Institute and Department of Chemistry, University of Alaska Fairbanks
Atmospheric Radiation
 Atmospheric Radiation NASA photo gallery Introduction The major source of earth is the sun. The sun transfer energy through the earth by radiated electromagnetic wave. In vacuum, electromagnetic waves
Energy Systems, Structures and Processes Essential Standard: Analyze patterns of global climate change over time Learning Objective: Differentiate
 Energy Systems, Structures and Processes Essential Standard: Analyze patterns of global climate change over time Learning Objective: Differentiate between weather and climate Global Climate Focus Question
2/18/2013 Estimating Climate Sensitivity From Past Climates Outline
 Estimating Climate Sensitivity From Past Climates Outline Zero-dimensional model of climate system Climate sensitivity Climate feedbacks Forcings vs. feedbacks Paleocalibration vs. paleoclimate modeling
Chapter 10 Planetary Atmospheres: Earth and the Other Terrestrial Worlds. What is an atmosphere? About 10 km thick
 Chapter 10 Planetary Atmospheres: Earth and the Other Terrestrial Worlds What is an atmosphere? Sources of Gas Losses of Gas Thermal Escape Earth s Atmosphere About 10 km thick Consists mostly of molecular
Parameterization of cloud droplet formation in global climate models
 1 Parameterization of cloud droplet formation in global climate models ATHANASIOS NENES 1 and JOHN H. SEINFELD Department of Chemical Engineering, Mail Code 210-41, California Institute of Technology,
Global climate response to anthropogenic aerosol indirect effects: Present day and year 2100
 Click Here for Full Article JOURNAL OF GEOPHYSICAL RESEARCH, VOL. 115,, doi:10.1029/2008jd011619, 2010 Global climate response to anthropogenic aerosol indirect effects: Present day and year 2100 Wei Ting
Climate impacts of ice nucleation
 JOURNAL OF GEOPHYSICAL RESEARCH, VOL. 117,, doi:10.1029/2012jd017950, 2012 Climate impacts of ice nucleation A. Gettelman, 1,2 X. Liu, 3 D. Barahona, 4,5 U. Lohmann, 2 and C. Chen 1 Received 16 April 2012;
Klimaänderung. Robert Sausen Deutsches Zentrum für Luft- und Raumfahrt Institut für Physik der Atmosphäre Oberpfaffenhofen
 Klimaänderung Robert Sausen Deutsches Zentrum für Luft- und Raumfahrt Institut für Physik der Atmosphäre Oberpfaffenhofen Vorlesung WS 2017/18 LMU München 7. Wolken und Aerosole Contents of IPCC 2013 Working
AEROCOM-Workshop,Paris, June 2-3, model. Øyvind Seland; Alf Kirkevåg
 An AGCM operated at University of Oslo (UiO) Norway Øyvind Seland; Alf Kirkevåg AEROCOM-Workshop,Paris, June 2-3, 2003 by Kirkevåg; Jón Egill Kristjánsson; ; Trond Iversen Basic: NCAR-CCM3.2 CCM3.2 (Kiehl,et
Sensitivity of climate forcing and response to dust optical properties in an idealized model
 Click Here for Full Article JOURNAL OF GEOPHYSICAL RESEARCH, VOL. 112,, doi:10.1029/2006jd007198, 2007 Sensitivity of climate forcing and response to dust optical properties in an idealized model Karen
P1.61 Impact of the mass-accomodation coefficient on cirrus
 P1.61 Impact of the mass-accomodation coefficient on cirrus Robert W. Carver and Jerry Y. Harrington Department of Meteorology, Pennsylvania State University, University Park, PA 1. Introduction Recent
Modeling Challenges At High Latitudes. Judith Curry Georgia Institute of Technology
 Modeling Challenges At High Latitudes Judith Curry Georgia Institute of Technology Physical Process Parameterizations Radiative transfer Surface turbulent fluxes Cloudy boundary layer Cloud microphysics
Lecture 10: Climate Sensitivity and Feedback
 Lecture 10: Climate Sensitivity and Feedback Human Activities Climate Sensitivity Climate Feedback 1 Climate Sensitivity and Feedback (from Earth s Climate: Past and Future) 2 Definition and Mathematic
Lecture 9: Climate Sensitivity and Feedback Mechanisms
 Lecture 9: Climate Sensitivity and Feedback Mechanisms Basic radiative feedbacks (Plank, Water Vapor, Lapse-Rate Feedbacks) Ice albedo & Vegetation-Climate feedback Cloud feedback Biogeochemical feedbacks
A FROZEN DROP PRECIPITATION MECHANISM OVER AN OPEN OCEAN AND ITS EFFECT ON RAIN, CLOUD PATTERN, AND HEATING
 A FROZEN DROP PRECIPITATION MECHANISM OVER AN OPEN OCEAN AND ITS EFFECT ON RAIN, CLOUD PATTERN, AND HEATING 13.6 Tsutomu Takahashi* University of Hawaii, Honolulu, Hawaii Kazunori Shimura JFE Techno-Research
Prentice Hall EARTH SCIENCE. Tarbuck Lutgens
 Prentice Hall EARTH SCIENCE Tarbuck Lutgens Chapter 17 The Atmosphere: Structure and Temperature 17.1 Atmosphere Characteristics Composition of the Atmosphere Weather is constantly changing, and it refers
SUPPLEMENTARY INFORMATION
 SUPPLEMENTARY INFORMATION DOI: 10.1038/NGEO1854 Anthropogenic aerosol forcing of Atlantic tropical storms N. J. Dunstone 1, D. S. Smith 1, B. B. B. Booth 1, L. Hermanson 1, R. Eade 1 Supplementary information
VOCALS REx: Aerosol Physics at the Ocean Surface On the NOAA RV Ronald H. Brown October, November 2008
 VOCALS REx: Aerosol Physics at the Ocean Surface On the NOAA RV Ronald H. Brown October, November 8 Catherine Hoyle, NOAA PMEL Derek Coffman, NOAA PMEL Tim Bates, NOAA PMEL Trish Quinn, NOAA PMEL Lelia
A. Parodi 1, (1) CIMA Research Foundation, Italy. in cooperation with: K. A. Emanuel 2, and E. Foufoula-Georgiou 3 (2) EAPS, MIT, USA
 CIMA Research Foundation, Italy. in cooperation with: K. A. Emanuel 2, and E. Foufoula-Georgiou 3 (2) EAPS, MIT, USA") Spatial and temporal evolution of deep moist convective processes: the role of microphysics A. Parodi 1, (1) CIMA Research Foundation, Italy in cooperation with: K. A. Emanuel 2, and E. Foufoula-Georgiou
Spatial and temporal evolution of deep moist convective processes: the role of microphysics A. Parodi 1, (1) CIMA Research Foundation, Italy in cooperation with: K. A. Emanuel 2, and E. Foufoula-Georgiou
Why is the air cooler at higher altitudes? Short answer lapse rate troposphere
 Why is the air cooler at higher altitudes? This vertical temperature trend is a consequence of 1) lower atmospheric pressure at higher altitude and 2) heating that takes place at the bottom of the troposphere
Warm Cloud Processes. Some definitions. Two ways to make big drops: Effects of cloud condensation nuclei
 Warm Cloud Processes Dr. Christopher M. Godfrey University of North Carolina at Asheville Warm clouds lie completely below the 0 isotherm 0 o C Some definitions Liquid water content (LWC) Amount of liquid
Interactions between aerosol absorption, thermodynamics, dynamics, and microphysics and their impacts on a multiplecloud
 Clim Dyn (2017) 49:3905 3921 DOI 10.1007/s00382-017-3552-x Interactions between aerosol absorption, thermodynamics, dynamics, and microphysics and their impacts on a multiplecloud system Seoung Soo Lee
APPLICATION OF KOHLER THEORY: MODELING CLOUD CONDENSATION NUCLEI ACTIVITY
 1 2 3 4 5 6 7 8 9 10 11 12 13 14 15 16 17 18 19 APPLICATION OF KOHLER THEORY: MODELING CLOUD CONDENSATION NUCLEI ACTIVITY Gavin Cornwell, Katherine Nadler, Alex Nguyen, and Steven Schill Department of
PRECIPITATION PROCESSES
 PRECIPITATION PROCESSES Loknath Adhikari This summary deals with the mechanisms of warm rain processes and tries to summarize the factors affecting the rapid growth of hydrometeors in clouds from (sub)
Climate Dynamics (PCC 587): Clouds and Feedbacks
: Clouds and Feedbacks") Climate Dynamics (PCC 587): Clouds and Feedbacks D A R G A N M. W. F R I E R S O N U N I V E R S I T Y O F W A S H I N G T O N, D E P A R T M E N T O F A T M O S P H E R I C S C I E N C E S D A Y 7 : 1
Climate Dynamics (PCC 587): Clouds and Feedbacks D A R G A N M. W. F R I E R S O N U N I V E R S I T Y O F W A S H I N G T O N, D E P A R T M E N T O F A T M O S P H E R I C S C I E N C E S D A Y 7 : 1
Influence of Organic-Containing Aerosols on Marine Boundary Layer Processes
 DISTRIBUTION STATEMENT A. Approved for public release; distribution is unlimited. Influence of Organic-Containing Aerosols on Marine Boundary Layer Processes John H. Seinfeld California Institute of Technology,
Updated H 2 SO 4 -H 2 O binary homogeneous nucleation look-up tables
 Click Here for Full Article JOURNAL OF GEOPHYSICAL RESEARCH, VOL. 113,, doi:10.1029/2008jd010527, 2008 Updated H 2 SO 4 -H 2 O binary homogeneous nucleation look-up tables Fangqun Yu 1 Received 2 June
Name(s) Period Date. Earth s Energy Budget: How Is the Temperature of Earth Controlled?
 Period Date. Earth s Energy Budget: How Is the Temperature of Earth Controlled?") Name(s) Period Date 1 Introduction Earth s Energy Budget: How Is the Temperature of Earth Controlled? As you learned from the reading, the balance between incoming energy from the sun and outgoing energy
Name(s) Period Date 1 Introduction Earth s Energy Budget: How Is the Temperature of Earth Controlled? As you learned from the reading, the balance between incoming energy from the sun and outgoing energy
1. INTRODUCTION. investigating the differences in actual cloud microphysics.
 MICROPHYSICAL PROPERTIES OF DEVELOPING VERSUS NON-DEVELOPING CLOUD CLUSTERS DURING TROPICAL CYCLOGENESIS 4B.5 Nathan D. Johnson,* William C. Conant, and Elizabeth A. Ritchie Department of Atmospheric Sciences,
Global Change and Air Pollution (EPA-STAR GCAP) Daniel J. Jacob
 Daniel J. Jacob") Global Change and Air Pollution (EPA-STAR GCAP) and some more recent work on climate-aq interactions Daniel J. Jacob (djacob@fas.harvard.edu) with Eric M. Leibensperger, Shiliang Wu, Amos Tai, and Loretta
Global Change and Air Pollution (EPA-STAR GCAP) and some more recent work on climate-aq interactions Daniel J. Jacob (djacob@fas.harvard.edu) with Eric M. Leibensperger, Shiliang Wu, Amos Tai, and Loretta
Collision and Coalescence 3/3/2010. ATS 351 Lab 7 Precipitation. Droplet Growth by Collision and Coalescence. March 7, 2006
 ATS 351 Lab 7 Precipitation March 7, 2006 Droplet Growth by Collision and Coalescence Growth by condensation alone takes too long ( 15 C -) Occurs in clouds with tops warmer than 5 F Greater the speed
An investigation into the aerosol dispersion effect through the activation process in marine stratus clouds
 1 An investigation into the aerosol dispersion effect through the activation process in marine stratus clouds Yiran Peng, 1, Ulrike Lohmann, 2 Richard Leaitch 3 and Markku Kulmala 4 Short title: 1 Max
Unit 2 Meteorology Test **Please do not write on this test** 5. El Nino & La Nina 6. Photosynthesis 7. Coriolis Effect 8.
 Matching (2 points each) 1. weather 2. climate 3. Greenhouse Effect 4. Convection Unit 2 Meteorology Test **Please do not write on this test** 5. El Nino & La Nina 6. Photosynthesis 7. Coriolis Effect