Electronic Theses and Dissertations
|
|
|
- Paulina Dorsey
- 5 years ago
- Views:
Transcription
1 University of New Mexico UNM Digital Repository Biology ETDs Electronic Theses and Dissertations EXPLORING SIGNALS OF HISTORICAL DEMOGRAPHY IN BOREAL MAMMALS THROUGH INTEGRATION OF STATISTICAL CONSERVATION PHYLOGENETICS, TAXONOMY, AND COMPARATIVE PHYLOGEOGRAPHY Jason Malaney Follow this and additional works at: Recommended Citation Malaney, Jason. "EXPLORING SIGNALS OF HISTORICAL DEMOGRAPHY IN BOREAL MAMMALS THROUGH INTEGRATION OF STATISTICAL CONSERVATION PHYLOGENETICS, TAXONOMY, AND COMPARATIVE PHYLOGEOGRAPHY." (2013). This Dissertation is brought to you for free and open access by the Electronic Theses and Dissertations at UNM Digital Repository. It has been accepted for inclusion in Biology ETDs by an authorized administrator of UNM Digital Repository. For more information, please contact
2 Jason L. Malaney Candidate Department of Biology Department This dissertation is approved, and it is acceptable in quality and form for publication: Approved by the Dissertation Committee: Dr. Joseph A. Cook, Chairperson Dr. Steve Poe Dr. Tom Turner Dr. Rob Guralnick
3 EXPLORING SIGNALS OF HISTORICAL DEMOGRAPHY IN BOREAL MAMMALS THROUGH INTEGRATION OF STATISTICAL CONSERVATION PHYLOGENETICS, TAXONOMY, AND COMPARATIVE PHYLOGEOGRAPHY by JASON L. MALANEY B.S., Wildlife and Fisheries Sciences, ENMU, 2000 M.S., Applied Ecology, ENMU, 2003 DISSERTATION Submitted in Partial Fulfillment of the Requirements for the Degree of Doctor of Philosophy Biology The University of New Mexico Albuquerque, New Mexico May 2013
4 ACKNOWLEDGMENTS Dr. Joseph A. Cook supported all phases of my research and demonstrated a consistent zeal as a colleague. I thank him for this and providing unparalleled guidance and wisdom as my research adviser, dissertation committee chair, and friend. You have provided proper encouragement and I have benefited greatly from your tutelage. I thank my committee members, Dr. Steve Poe, Dr. Tom Turner, and Dr. Robert Guralnick, for their patience and guidance throughout my professional development. Each has contributed unique but significant perspectives that have enhanced this work. I acknowledge and appreciate the assistance of several individuals directly associated with this research. Fellow graduate students Andrew G. Hope, and Yadeeh Sawyer (Escobedo), and UnO (Undergraduate Opportunities) scholars Hiyatsi Bassett, Alys Jones, Randle McCain, Elisha K. Song, and Sophia Thompson helped with field work (2007 and 2010). Lab work was aided by Lena Moffitt and Ashley Montoya. Lab mates in the CUERVO lab have provided many thoughtful discussions. Special appreciation is extended to the curators and collections managers from several institutions that loaned valuable vouchers, including John Demboski, Jennifer Frey, Larry Heaney, Jim Kenagy, Link Olson, Eric Rickart, but especially Jim Patton. Most importantly, I thank the many natural history collectors over the years. Without your efforts, much of our understanding of the natural world would be absent. A special note of appreciation is extended my loved ones, especially my parents Jack and Evelyn Malaney for providing the necessary tools to realize and accomplish my goals. Finally, to Analiese, you have provided the truest inspiration hopefully, one day, you will recognize your contributions. iii
5 EXPLORING SIGNALS OF HISTORICAL DEMOGRAPHY IN BOREAL MAMMALS THROUGH INTEGRATION OF STATISTICAL CONSERVATION PHYLOGENETICS, TAXONOMY, AND COMPARATIVE PHYLOGEOGRAPHY by Jason L. Malaney B.S., Wildlife and Fisheries Sciences, Eastern New Mexico University M.S., Applied Ecology, Eastern New Mexico University Ph.D., Biology, University of New Mexico ABSTRACT Understanding how diversity is partitioned across the landscape can provide perspectives related to the environmental processes that have influenced the evolutionary history of organisms. This main idea, often termed phylogeography, serves as the backdrop to my research where I explore three broad concepts including historical biogeography, cryptic diversity and ecology, and conservation phylogenetics. I address various questions in each of these concepts by using a set of mammals that are associated with montane and mesic environments of North America. More specifically, I focus on the jumping mice (Zapodidae) to test hypotheses that scale to the broader community. This approach allows for a more refined understanding and interpretation of how species have responded to geophysical changes of the past that may be useful for predicting how future environmental pressures may influence geographically oriented lineages. By integrating across multiple disciplines of population genetics, phylogenetics, phylogeography, distribution modeling, and paleoclimatology, I assess how environmental change has left an imprint on the genetics and ecology of various organisms. Signatures of the past are useful to forecast conservation issues of the future. iv
6 TABLE OF CONTENTS Introduction...1 Literature Cited...7 Chapter 1: The biogeographic legacy of an imperilled taxon provides a foundation for assessing lineage diversification, demography, and conservation genetics...12 Abstract...13 Introduction...15 Methods...21 Results...28 Discussion...32 Acknowledgments...38 Literature Cited...39 Appendix...56 Figures...67 Tables...73 Chapter 2: Phylogeography of the Western Jumping Mouse (Zapus princeps) detects deep and persistent allopatry with expansion...75 Abstract...76 v
7 Introduction...77 Methods...80 Results...87 Discussion...91 Acknowledgments...97 Literature Cited...98 Appendix Figures Tables Chapter 3: Using biogeographic history to inform conservation: the case of Preble s meadow jumping mouse Abstract Introduction Methods Results Discussion Acknowledgments Literature Cited vi
8 Figures Tables Supplementary Information Conclusions Summary Taxonomic implications Comparative Phylogeography Literature Cited Figures vii
9 INTRODUCTION Systematics is undergoing a burgeoning resurgence (Wiley and Lieberman 2011) largely due to advancements in molecular sequencing technologies and novel phylogenetic reconstruction techniques that have provided unprecedented resolution in the study of evolutionary relationships (Edwards 2009; Hillis and Bull 1991; Knowles 2009; Knowles and Maddison 2002; Maddison 1997; Moritz and Hillis 1996). Consequently, intraspecific diversification, set within a broad geographic context, can now be explored in finer detail through phylogeographic studies (Avise 2000; Avise 2009; Hickerson et al. 2010). Frequently, historical biogeographic models are explored which are central to understanding how diversity is partitioned across the landscape (Riddle and Hafner 2007; Smith 2007; Wiens and Donoghue 2004). Increasingly integration of multiple forms of evidence (e.g. molecular phylogenies, fossils, and species distribution models SDMs) are used to more finely delineate among alternative models (Carstens and Richards 2007) by explicitly testing phylogeographic hypotheses via statistical phylogeography (Knowles 2009), an approach developed over the last decade, but not without controversy (Beaumont et al. 2010; Templeton 2010). Statistical phylogeography, which is rooted in coalescent-based frameworks (Wakeley 2008), offers the necessary context to develop and test models of diversification and more clearly delineate among alternative evolutionary relationships. Another emerging set of ideas focuses on the delimitation of species boundaries based largely on genetic information (Fujita et al. 2012), but bolstered by multiple forms of evidence within a general lineage context (de Queiroz 1998, 2007). Using only genetic information to describe geographic variation has been contentious (e.g., (Bauer et 1
10 al. 2010; Fujita and Leache 2010; Leache and Fujita 2010), but approaches that integrate across genetic, morphological and ecological niche datasets may provide the most powerful means of assessing species boundaries (Fujita et al. 2012; Zhang et al. 2011) and developing a fully integrated taxonomy (Padial et al. 2010). An integrated taxonomy enhances our ability to explore processes of incipient diversification, rather than relying on the end products of diversification (e.g., identifying pre- and post-zygotic isolation mechanisms). Multiple, independently evolving loci, coupled with innovative methods of species-tree inference has fostered the identification of novel or cryptic species. Often lineages of organisms diverge at both genes and niches but may fail to be recognized by a morphologically-based taxonomy. Consequently, the general increase in the number of species has reinvigorated the call for consistency in taxonomy (Agapow et al. 2004; Isaac et al. 2004). However, others have argued that taxonomic consistency cannot be based on inaccurate phylogenetic understanding and can only be stabilized within an integrative context (Fujita et al. 2012; Padial et al. 2010). In this dissertation, I test phylogenetic and phylogeographic hypotheses related to the evolution of North American zapodids. More specifically I assess historical biogeography, cryptic diversity and ecology, conservation phylogenetics within a broader phylogeographic and systematics context to better understand speciation within this group. Zapodids are widely distributed across North America and tend to inhabit regions characterized as cool and mesic or humid continental (Köppen climate type D - (Frey and Malaney 2009; Peel et al. 2007). Jumping mice habitats often coincide with riparian corridors, and especially mesic areas in montane regions in the dry climates of the interior west. Consequently, due to the isolation of montane regions and patchy 2
11 distribution of riparian habitats, allopatric divergence is predicted to be common in jumping mice. Mammalian taxonomists (Holden and Musser 2005) recognize 4 species, the Woodland Jumping Mouse (Napaeozapus insignis), the Meadow Jumping Mouse (Zapus hudsonius), the Western Jumping Mouse (Z. princeps), and the Pacific Jumping Mouse (Z. trinotatus). Within the 4 species, 32 subspecies (Hall 1981; Krutzsch 1954) are recognized suggesting substantial geographic variation that can be assessed using phylogeographic hypothesis testing and, more broadly, an ideal system to better understand the roles of climate fluctuations in evolutionary diversification. My dissertation presents three intergrated studies of zapodids that are based within an historical phylogenetic context to better explore the processes of diversification in a western North American montane associated mammal. Specifically, I use a statistical framework to assess alternative modes of incipient speciation by contrasting recent (Chapter 1) versus deep and persistent (Chapter 2) histories. In Chapter 3, I explore whether conservation practices for zapodids are based on a robust assessment of extant diversity and if they protect important processes and products of diversification. With these goals as background, I focus on assessing if the taxonomy accurately reflects phylogeographic variation within a multi-locus coalescent-based context using a speciestree. In the conclusions chapter, I propose an updated taxonomy using a hierarchical approach to species delimitation. Finally, jumping mice relationships are set within the broader context of North American boreal mammal biogeographic history using a comparative phylogeographic approach. 3
12 Overview In the first chapter of my dissertation (Malaney et al. 2012), I tested alternative historical biogeographic hypotheses related to the diversification of a montane mammal endemic to the American Southwest. Specifically I used the parametric bootstrap based on sequence variation in two mitochondrial genes (cytb and control region) to test alternative models of ancient vicariance, sequential colonization, or recent fragmentation as the most plausible scenario of regional divergence. Each scenario had been proposed as historical-biogeographic hypotheses for several southwestern montane-associated species, but with conflicting evidence for each. When coupled with SDMs and the fossil record, I revealed that the New Mexico meadow jumping mouse (Zapus hudsonius luteus) represents a neo-endemic that colonized eastward from the Edwards Plateau since the Late Pleistocene followed by recent fragmentation since the LGM. Further these efforts highlighted four conservation implications for this taxon: (1) Z. h. luteus is a monophyletic lineage on an independent evolutionary trajectory; (2) Z. h. luteus shared a recent common ancestor with Z. h. pallidus (not Z. h. preblei); (3) mtdna does not reflect recent population declines; and (4) coalescent simulations and species distribution models reflect Holocene fragmentation. In the second chapter, I focus on the montane regions of western North America and explore historical signals of persistent allopatric versus recent admixture (Knowles and Carstens 2007). Understanding how diversity is partitioned across the landscape can provide perspectives related to the environmental process that may have influenced evolutionary history and also provides an essential framework for conservation. Western North America has a diverse biota that is the product of complex evolutionary and 4
13 environmental processes (Lomolino et al. 2006) and this region has experienced fluctuations tied to glacial cycling that may have left genetic imprints (Riddle and Hafner 2006). Significant intraspecific genetic variation in mammals across the west is also hypothesized to have been shaped by extreme topographic heterogeneity. Previous molecular investigations of western mammals provided novel views related to diversification, occasionally revealing unexpected genetic architectures (Alvarez- Castañeda and Patton 2004; Galbreath et al. 2010; Hornsby and Matocq 2011; Matocq 2002; Riddle et al. 2000). Documentation of geographic molecular variation in organisms, when combined with assessments of demography, historical biogeography, and niche variation, can provide insight into key questions related to climate change, post-pleistocene colonization, habitat fragmentation, and possible future response to changing environments (Avise 2000; Avise 2009; Hickerson et al. 2010). In this chapter, I explore phylogeographic structure in the western jumping mouse (Zapus princeps) as a window into the biogeographic history of western North America. Specifically, I test alternative models of evolutionary history and then analyze spatial demography and niche divergence in this group. The third chapter of my dissertation shifts from single marker (mtdna) hypothesis tests into multi-locus coalescent-based assessments, but with a direct conservation application. This study points to the value of shifting conservation assessment from piecemeal appraisals of limited phylogenetic components (e.g. geographically proximal subspecies) to an expanded lineage-based assessment that places ecological and evolutionary divergence within a broader comparative framework. By using comprehensive sampling of taxonomic units across the geographic range of taxa, 5
14 multiple genetic loci and the fossil record coupled with niche and population demographic assessments, I am better able assess conservation status. This assessment of zapodids highlights that conservation is often predicated on a weak understanding of taxonomic relationships and systematics coupled with biogeographic history should play a more central role in management actions. 6
15 LITERATURE CITED AGAPOW, P. M., et al The impact of species concept on biodiversity studies, Quarterly Review of Biology 79: ALVAREZ-CASTAÑEDA, S. T., and J. L. PATTON Geographic genetic architecture of pocket gopher (Thomomys bottae) populations in Baja California, Mexico, Molecular Ecology 13: AVISE, J. C Phylogeography. The history and formation of species. Harvard University Press, Cambridge, Massachusetts. AVISE, J. C Phylogeography: retrospect and prospect, Journal of Biogeography 36:3-15. BAUER, A. M., et al Availability of new Bayesian-delimited gecko names and the importance of character-based species descriptions, Proceedings of the Royal Society B-Biological Sciences 278: BEAUMONT, M. A., et al In defence of model-based inference in phylogeography REPLY, Molecular Ecology 19: CARSTENS, B. C., and C. L. RICHARDS Integrating coalescent and ecological niche modeling in comparative phylogeography, Evolution 61: DE QUEIROZ, K The general lineage concept of species, species criteria, and the process of speciation: a conceptual unification and terminological recommendations, Pp in Endless Forms: Species and Speciation (D. J. Howard and S. H. Berlocher, eds.). Oxford University Press, New York. DE QUEIROZ, K Species concepts and species delimitation, Systematic Biology 56:
16 EDWARDS, S. V Is a new and general theory of molecular systematics emerging?, Evolution 63:1-19. FREY, J. K., and J. L. MALANEY Decline of the meadow jumping mouse (Zapus hudsonius luteus) in two mountain ranges in New Mexico, Southwestern Naturalist 54: FUJITA, M. K., and A. D. LEACHE A coalescent perspective on delimiting and naming species: a reply to Bauer et al., Proceedings of the Royal Society B- Biological Sciences 278: FUJITA, M. K., A. D. LEACHE, F. T. BURBRINK, J. A. MCGUIRE, and C. MORITZ Coalescent-based species delimitaiton in an integrative taxonomy, Trends in Ecology & Evolution 27: GALBREATH, K. E., D. J. HAFNER, K. R. ZAMUDIO, and K. AGNEW Isolation and introgression in the Intermountain West: contrasting gene genealogies reveal the complex biogeographic history of the American pika (Ochotona princeps), Journal of Biogeography 37: HALL, E. R The mammals of North America. Vol. 2, 2nd ed. John Wiley & Sons, New York, New York. HICKERSON, M. J., et al Phylogeography's past, present, and future: 10 years after Avise, 2000, Molecular Phylogenetics and Evolution 54: HILLIS, D. M., and J. J. BULL Of genes and genomes., Science 254: HOLDEN, M. E., and G. G. MUSSER Family Dipodidae, Pp in Mammal Species of the World (D. E. Wilson and D. M. Reeder, eds.). The Johns Hopkins University Press, Baltimore, Maryland. 8
17 HORNSBY, A. D., and M. D. MATOCQ Differential regional response of the bushytailed woodrat (Neotoma cinerea) to late Quaternary climate change, Journal of Biogeography 38:1-17. ISAAC, N. J. B., J. MALLET, and G. M. MACE Taxonomic inflation: its influence on macroecology and conservation, Trends in Ecology & Evolution 19: KNOWLES, L. L Statistical phylogeography, Annual Review of Ecology Evolution and Systematics 40: KNOWLES, L. L., and B. C. CARSTENS Estimating a geographically explicit model of population divergence, Evolution 61: KNOWLES, L. L., and W. P. MADDISON Statistical phylogeography, Molecular Ecology 11: KRUTZSCH, P. H North American jumping mice (genus Zapus), University of Kansas Publications, Museum of Natural History 7: LEACHE, A. D., and M. K. FUJITA Bayesian species delimitation in west African forest geckos (Hemidactylus fasciatus), Proceedings of the Royal Society B- Biological Sciences 277: LOMOLINO, M. V., B. R. RIDDLE, and J. H. BROWN Biogeography, 3rd ed. Sinauer Associates, Sunderland, Massachusetts. MADDISON, W. P Gene trees in species trees, Systematic Biology 46: MALANEY, J. L., J. K. FREY, and J. A. COOK The biogeographic legacy of an imperilled taxon provides a foundation for assessing lineage diversification, demography, and conservation genetics, Diversity and Distributions 18:
18 MATOCQ, M. D Phylogeographical structure and regional history of the duskyfooted woodrat, Neotoma fuscipes, Molecular Ecology 11: MORITZ, C., and D. M. HILLIS Molecular systematics: Context and controversies, Molecular systematics, Second edition:1-13. PADIAL, J. M., A. MIRALLES, I. DE LA RIVA, and M. VENCES The integrative future of taxonomy, Frontiers in Zoology 7:1-14. PEEL, M. C., B. L. FINLAYSON, and T. A. MCMAHON Updated world map of the Köppen-Geiger climate classification, Hydrology and Earth System Sciences 11: RIDDLE, B. R., and D. J. HAFNER A step-wise approach to integrating phylogeographic and phylogenetic biogeographic perspectives on the history of a core North American warm deserts biota, Journal of Arid Environments 66: RIDDLE, B. R., and D. J. HAFNER Phylogeography in historical biogeography: Investigating the biogeographic histories of populations, species, and young biotas, Biogeography in a Changing World: RIDDLE, B. R., D. J. HAFNER, L. F. ALEXANDER, and J. R. JAEGER Cryptic vicariance in the historical assembly of a Baja California Peninsular Desert biota, Proceedings of the National Academy of Sciences of the United States of America 97: SMITH, C. I Historical biogeography: The new synthesis, Current Biology 17:R598-R
19 TEMPLETON, A. R Statistical hypothesis testing in intraspecific phylogeography: nested clade phylogeographical analysis vs. approximate Bayesian computation, Molecular Ecology 18: WAKELEY, J Coalescent Theory: An Introduction. Roberts and Company Publishers, Greenwood Village, Colorado. WIENS, J. J., and M. J. DONOGHUE Historical biogeography, ecology and species richness, Trends in Ecology & Evolution 19: WILEY, E. O., and B. S. LIEBERMAN Phylogenetics: theory and practive of phylogenetic systematics. John Wiley & Sons, Inc., Hoboken, New Jersey. ZHANG, C., D. X. ZHANG, T. ZHU, and Z. YANG Evaluation of a Bayesian coalescent method of species delimitation, Systematic Biology 60:
20 CHAPTER 1 THE BIOGEOGRAPHIC LEGACY OF AN IMPERILLED TAXON PROVIDES A FOUNDATION FOR ASSESSING LINEAGE DIVERSIFICATION, DEMOGRAPHY AND CONSERVATION GENETICS Jason L. Malaney 1, Jennifer K. Frey 2, Joseph A. Cook 1 1 Museum of Southwestern Biology and Department of Biology, University of New Mexico, Albuquerque, New Mexico, Department of Fish, Wildlife, and Conservation Ecology, New Mexico State University, Las Cruces, New Mexico, 88003; Frey Biological Research, P.O. Box 294 Radium Springs, New Mexico Short running title Phylogeography of a southwestern endemic Article type Biodiversity Research and Reviews 12
21 ABSTRACT Aim To test alternative biogeographic hypotheses related to the diversification of a montane mammal (Zapus hudsonius luteus) endemic to the American Southwest. Location Southwestern United States. Methods We used statistical phylogeographic analyses of mitochondrial DNA (1512 bp; two genes) from 93 individuals from 6 geographic regions to test diversification hypotheses. Species distribution models of climate and fossil records were integrated to assess contemporary and historical distributions and barriers to gene flow. We calculated dates of divergence and examined historical demography using coalescent simulations. Results We documented monophyly of Z. h. luteus represented by 19 segregated haplotypes. Predicted current distribution generally coincided with known localities while predicted paleodistributions suggested that this lineage was widespread throughout lower elevations of the American Southwest and on the Edwards Plateau (as documented by the fossil record). Population size did not change substantially during a westward shift in range that occurred in the last 100k generations. Results supported fragmentation of a common ancestor during the Holocene as the most plausible explanation for genetic structure. 13
22 Main conclusions Monophyletic Z. h. luteus reflects fragmentation of a common ancestor with recent (Holocene) upslope colonization of disjunct montane areas. We refute the hypotheses of in situ divergence or origins from a Colorado Piedmont ancestor. Instead, westward colonization from the Edwards Plateau during the Wisconsin followed by Holocene fragmentation which serves as a generalized biogeographic hypothesis for species associated with mesic graminoid habitats in the American Southwest. Further exploration of these signatures using independent nuclear DNA is warranted. Key conservation implications: 1) Z. h. luteus is a monophyletic lineage on an independent evolutionary trajectory; 2) Z. h. luteus shared a recent common ancestor with Z. h. pallidus (not Z. h. preblei); 3) mtdna does not reflect recent population declines; 4) coalescent simulations and species distribution models reflect Holocene fragmentation. Keywords American Southwest, coalescent parametric bootstrap, species distribution modelling, fossils, montane biogeography, Zapus hudsonius luteus. 14
23 INTRODUCTION Climate oscillations that change local environmental conditions often cause species distributions to shift, expand or contract along latitudinal or elevational gradients (Hewitt, 2001, 2004). Whenever species track fluctuating environmental conditions, populations may experience alternating periods of either isolation or connectivity (Hewitt, 1996; Wiens, 2004; Wiens & Graham, 2005). Genetic signatures often reflect the response of organisms to changing environments. These signatures may reveal episodes of range shifts (e.g. expansion), admixture of previously isolated populations, or range contraction sustaining population divergence. Teasing apart the influence of complex historical processes has proven difficult, but statistical phylogeography enhances our ability to test specific hypotheses related to the evolution and biogeography of organisms (Knowles, 2009). Climate change during the Pleistocene is hypothesized to have shaped the distributions, divergence patterns, and historical demography of species in western North America. Cooler, mesic conditions extended to lower elevations and latitudes during glacial periods, but subsequently retreated upslope and to higher latitudes during warmer and more xeric interglacial periods. Cyclic glacial/inter-glacial episodes were repeated >20 times during the Pleistocene culminating in the diversification of North American terrestrial mammals via the Rancholabrean faunal events (Bell et al., 2004). These processes sequentially led to complex historical patterns revealed by distinctive genetic signatures. For example, longhorn beetles (genus Moneilema) and jumping spiders (genus Habronattus) exhibit a genetic signature of divergence on isolated Madrean sky islands in the Southwest (Maddison & McMahon, 2000; Masta, 2000; Smith & Farrell, 15
24 2005). Southwestern canyon tree frogs (Hyla arenicolor) have deep divergence but repeated episodes of hybridization with closely related taxa (Barber, 1999; Bryson et al., 2010; Klymus et al., 2010). Mountain snails (Oreohelix sp.) show signatures of longterm isolation, possibly through multiple glacial cycles (Weaver et al., 2006), while montane salamanders (Plethodon ouachitae) show structure developed through a stepping stone dispersal along an east-west axis (Shepard & Burbrink, 2008). Finally, montane grasshoppers (Melanoplus sp.) were isolated on mountains but subsequent expansion during interglacials led to complex, admixed signatures (Knowles, 2001b, a; Knowles et al., 2007). Thus, genetic signatures reflect diverse histories ranging from deep and structured to ephemeral and stochastic. An alternative possibility is that populations persisted in isolation during glacial cooling and then tracked changing environments into new regions with warming and drying conditions. This alternative vicariance hypothesis for the American Southwest (Findley, 1969; Patterson, 1980; Frey et al., 2007) has yet to be empirically tested using phylogeographic methods. The sky islands of the North American Southwest are rich reservoirs of biological diversity (Merriam, 1890), that long have been the focus of naturalists and served as the empirical foundation for various hypotheses on origins, diversification, and biogeographic history of the biota of the region (Brown, 1971). This system is ideal for exploring population genetic variation within the context of paleo-environmental fragmentation. The mammalian fauna of the mountains of the American Southwest is an assemblage of primarily Cordilleran and Boreo-Cordilleran species of northern origins (Armstrong, 1972), although a minority of the assemblage also includes representatives from elsewhere (Patterson, 1989). There has been debate whether the processes that 16
25 produced these assemblages were the result of vicariance (isolation) of prior widespread pluvial communities (Findley, 1969; Patterson, 1980; Sullivan, 1994; Ditto & Frey, 2007; Frey et al., 2007) or postglacial colonization (immigration and mixing, Davis et al., 1988; Lomolino et al., 1989; Lomolino & Davis, 1997). Not previously considered is the possibility that mesic grasslands to the east of this region provided a source for colonization of high elevation mesic sites during the Holocene. These scenarios form the basis of three alternative hypotheses of historical biogeography that are expected to produce unique demographic signatures reflected in the DNA as detected using calculations of the coalescent. Integration of information from current and historical distributions based on independent data, such as fossils and species distribution models (SDMs), can further support alternative hypotheses. The first hypothesis (i.e., ancient vicariance - AV) of long-term isolation of communities reflects sustained segregation through alternating climate cycles associated with multiple pluvial and interglacial periods (Findley, 1969; Brunsfeld et al., 2001). The second hypothesis (i.e., sequential colonization - SC) is colonization via a stepping stone process from a northern source (Davis et al., 1988; Lomolino et al., 1989; Lomolino & Davis, 1997). The third hypothesis (i.e., recent fragmentation - RF) is a single recent vicariant event corresponding to the current interglacial in which fragmentation of more widespread pluvial communities has occurred since the Wisconsin (McDonald & Brown, 1992; Hafner, 1993; Patterson, 1999; Smith & Brown, 2002; Frey et al., 2007). Ample fossil evidence suggests that several species that today are associated with mesic grasslands in the eastern US, had a wider distribution further west during the Pleistocene (Harris & Findley, 1964; Harris, 1970; Findley et al., 1975; Harris, 1990; 17
26 Hafner, 1993; Harris, 1993; Lear & Harris, 2007). Fossils provide an important direct link (albeit often incomplete) to historical distributions. New approaches in phylogeography that combine coalescent-based analyses of historical demography with species distribution modelling and direct fossil evidence allow formal tests regarding how contemporary faunas were assembled including rates of migration, divergence history (timing and patterns), and demographic changes. Genetic signatures thus allow tests among three alternative historical biogeographic hypotheses. The New Mexico meadow jumping mouse (Zapus hudsonius luteus) is a morphologically and genetically distinctive mammal restricted to riparian habitats in the southwestern United States (Miller, 1911; Hafner et al., 1981; Morrison, 1992; King et al., 2006; Frey & Malaney, 2009). Originally described as a distinct species, Z. luteus, based on unique pelage and cranial morphology (Miller, 1911), it was reclassified as a subspecies of Z. princeps (Krutzsch, 1954) and later as a subspecies of Z. hudsonius (Hafner et al., 1981). Genetic studies identified three fixed allozyme alleles in comparisons with other subspecies of Z. hudsonius (Hafner et al., 1981). Reciprocal monophyly of mtdna haplotypes (Ramey et al., 2005; King et al., 2006; Vignieri et al., 2006) further suggests that Z. h. luteus may warrant status as an independent species. Zapus h. luteus has been extirpated from most historical locations due to degradation of riparian habitats primarily as a function of livestock grazing (Frey & Malaney, 2009) and in December 2007, was listed as a candidate for protection under the federal Endangered Species Act. Current conservation status for the subspecies includes Endangered on the state list for New Mexico and Threatened in Arizona. The species has a Natural Heritage conservation status of Globally Rare and "Critically Imperiled 18
27 (S1) in Arizona, Colorado, and New Mexico. Although the IUCN Red List of Threatened Species ( lists Z. h. luteus as Lower Risk, Near Threatened (LR, NT), that listing was based on an earlier assessment that recommended further study (Yensen et al., 1998). Subsequently, molecular genetic analyses have led to a better appreciation of genetic distinctiveness of the taxon (Ramey et al., 2005; King et al., 2006; Vignieri et al., 2006). Further, comprehensive field surveys and ecological studies have revealed dramatic declines in distribution and abundance of the taxon due to ongoing severe threats of drought, catastrophic wildfires, and harmful land management practices, which together warrant a change in listing to "Critically Endangered (CR)" (IUCN, 2001; Frey & Malaney, 2009). In general, Z. hudsonius (Findley et al., 1975; Hall, 1981; Frey & Malaney, 2009) is found in habitats identified as humid continental (Köppen climate type D)(Peel et al., 2007; Frey & Malaney, 2009) but these habitats are highly restricted in the dry climates of the interior west. Consequently, at its southwestern margin this species is restricted to riparian corridors with cool, mesic habitats. Disjunct populations of Z. h. luteus are known from the San Juan, Jemez, Sangre de Cristo, Sacramento, and White mountains. However, unlike other montane specialists in the region Z. h. luteus also occurs in lowelevation riparian habitats along major rivers (Fig. 1), including the Rio Grande and principal tributaries of the San Juan River (Findley et al., 1975; Hoffmeister, 1986; Hafner, 1993; Frey & Malaney, 2009). Hafner and colleagues (Hafner et al., 1981; Hafner, 1993) hypothesized that Z. hudsonius colonized the American Southwest either southward from the Colorado 19
28 Piedmont or westward from the Edwards Plateau, during glacial maxima when cool, mesic grasslands existed across central and southern New Mexico and further northeast and east. Westward colonization is supported by late Wisconsin fossils of Z. hudsonius from central Texas (Dalquest et al., 1969; Hafner, 1993) and early Holocene subfossils in southwestern New Mexico (Scarbrough, 1986), indicating a broad potential distribution throughout the lowlands east of current Z. h. luteus distribution. Our goal is to test alternative biogeographic hypotheses of diversification with statistical phylogeography by integrating coalescent-based modelling (Richards et al., 2007; Buckley, 2009; Franklin, 2010), fossil evidence, and SDMs. Specifically, we test models of spatiotemporal diversification for Z. h. luteus linking low elevation populations with montane congeners of the American Southwest. First, we test whether each geographically isolated population is a distinct evolutionary unit. Second, we assess whether contemporary or historical barriers to gene flow can be identified based on SDMs. We estimate dates of divergence and then use coalescent simulations to test if divergence is consistent with paleodistribution models and Late Pleistocene fossils. Fourth, we use coalescent simulations to test three alternative hypotheses of historical biogeography. Finally, we explore historical demography for Z. h. luteus to tease apart the effects of fluctuating climate on historical population size (N E ) and to assess landscape genetic diversity. We conclude by summarizing empirical and simulated data that refute alternative colonization or in situ diversification hypotheses and establish a management framework for the conservation of Z. h. luteus (Richardson & Whittaker, 2010; Scoble & Lowe, 2010). 20
29 METHODS DNA extraction, PCR and sequencing We obtained mitochondrial DNA sequences from 93 Z. h. luteus representing 22 localities and 6 spatially distinct geographic regions (Fig. 1, Appendix S1) to address phylogeographic questions and explore historical demographic parameters that influence conservation efforts. We sequenced a fragment of the mitochondrial control region (CR 372 bp) and the complete cytochrome b gene (cyt b 1140 bp). Genomic DNA was extracted from frozen (-80ºC) or ethanol (95% EtoH) preserved heart or liver tissue using Qiagen DNeasy Kit extraction protocols (QIAGEN, Inc.). We used CR primers L15926 and H16498 and cyt b primers L14398A and H15634A (King et al., 2006) for all PCR reactions which contained 2 µl of ~50ng/µl of template DNA, 1.25 µl of primer (10mM), 0.5 µl of dntp's (10 mm), 2 µl MgCl 2 (25 mm), 2 µl of 10x polymerase reaction buffer, 0.08 µl of Taq polymerase (Applied Biosystems, Foster City, CA) and adjusted to a final volume of 25 µl with ddh20. Thermal-cycling profile followed: 180 s at 94ºC; 30 cycles of 60 s at 94ºC, 60 s at 50ºC, and 120 s at 72ºC. Bi-directional sequencing reactions used the BIGDYE Terminator v3.1 Cycle Sequencing Kit (Applied Biosystems, Foster City, CA) and with an automated sequencer (Model 3130, Applied Biosystems, Inc., Foster City, California) using the original primers plus cytbif2 and cytbir2 internal primers for the cyt b gene (King et al., 2006). Sequences were cleaned with ethanol precipitation and edited with SEQUENCHER ver. 4.5 (GeneCodes) and compared to a reference sequence (GenBank No. AF119262; Z. trinotatus). Sequences were aligned using MUSCLE ver. 3.7 (Edgar, 2004) available at the 21
30 European Bioinformatics Institute web services ( and validated by eye. Individual genes were deposited in GenBank (JN JN546538; Appendix 1). Sixteen Z. h. luteus and 8 individuals from related subspecies (two of each: Z. h. campestris, Z. h. intermedius, Z. h. pallidus, Z. h. preblei) were obtained from GenBank (Appendix S1). Phylogeography We evaluated phylogenetic heterogeneity using the partition homogeneity test in PAUP* ver. 4.0b10 (Swofford, 2002). Given the lack of significant differences between these linked markers, all subsequent phylogeographic analyses were completed with a concatenated dataset with two non-independent data partitions (CR non-coding and cyt b coding). Phylogenies for Z. h. luteus were compared to closely related subspecies to identify the most recent common ancestor (MRCA, Appendix S1, Fig. 2; (Ramey et al., 2005; King et al., 2006). Phylogenetic inference was based on Maximum Parsimony (MP), Maximum Likelihood (ML), and Bayesian inference (Posterior probability - PP). MODELTEST ver. 3.7 (Posada & Crandall, 1998) estimated the best-fit model of nucleotide substitution by the Akaike Information Criterion (AIC) resulting in a general-time reversible plus gamma (GTR + Γ) used in character state analyses. All phylogeny reconstructions were conducted using the University of Alaska Fairbanks Life Science Informatics Portal ( Trees from MP, ML, and PP were comparable with the most credible inferences of relationships confined to nodes of nonparametric bootstrap support (MP, ML) or posterior probability (PP) values (Hillis & Bull, 1993; Felsenstein, 2004). 22
31 For phylogeny reconstruction, we performed maximum parsimony analyses using PAUP* ver. 4.0b10 (Swofford, 2002), through heuristic searches using 1,000 random addition sequence replicates involving tree bisection-reconnection (TBR) branch swapping. Transitions and transversions were treated equally and gaps were treated as a 5 th state. We assessed statistical support for clades with nonparametric bootstrap analysis (Felsenstein, 1985) using 1,000 bootstrap replicates, each with 100 random addition sequence replicates and TBR branch swapping. Maximum likelihood topologies and associated support were obtained with GARLI ver (Zwickl, 2006) using parameter estimates from MODELTEST. Support was evaluated using 1,000 bootstrap replicates (Felsenstein, 1985). Bayesian inference was implemented in MRBAYES ver (Huelsenbeck & Ronquist, 2005). Metropoliscoupled Markov chain Monte Carlo (MCMCMC) sampling was performed using four chains run for 1,000,000 generations, with default parameters and sampling every 1000 th generation. Three independent searches were performed to ensure convergence for each analysis. NETWORK ver. 4.2 ( was used to generate a median joining network representing the genealogical relationships among haplotypes of Z. h. luteus because incipient speciation may violate methods used in phylogenetic reconstructions (Posada & Crandall, 2002). Haplotype (h) and nucleotide (π) diversity and mean pairwise nucleotide differences (K) were calculated in DNASP ver (Librado & Rozas, 2009). We used Analysis of Molecular Variance (AMOVA) to identify variation within and between distinct geographic regions of Z. h. luteus. Results of AMOVA were compared to original geographic regions (Fig. 1). 23
32 Species Distribution Modelling We downloaded raster coverage s for 19 bioclimatic variables from the WorldClim database (http// for contemporary and last glacial maximum (LGM) at 30 arc-seconds resolution (Hijmans et al., 2005). We followed modelling procedures from previous studies (Waltari et al., 2007; Waltari & Guralnick, 2009), and reduced the dataset to the eleven most biologically meaningful and uncorrelated coverages for North America (Rissler & Apodaca, 2007). Localities for Z. h. luteus were obtained from original field-collected GPS coordinates or georeferencing through a review of field notes and other information associated with museum specimens. Localities for the sister taxon, Z. h. pallidus, were downloaded from MANIS (8 Jan 2010). Localities with >0.5km 2 uncertainty were discarded resulting in 92 Z. h. luteus, and 60 Z. h. pallidus localities (Fig. 3). We constructed SDMs for both contemporary and paleodistributions (at LGM) for both Z. h. luteus and Z. h. pallidus and the combined distribution of Z. h. luteus/pallidus using the default settings in the program MAXENT ver a (Elith et al., 2006; Phillips et al., 2006). We ran 20 replicates with 20th percentile training presence criteria and depicted the results using the point-wise bootstrap mean of the models. Localities represent the known distribution for Z. h. luteus and Z. h. pallidus to identify the variables constituting the fundamental niche of each individually (Hutchinson, 1957; Soberon & Peterson, 2005; Holt, 2009; Soberon, 2010) and the combined potential paleodistribution was used to identify potential overlap between lineages. A threshold value of 0.70 was used to interpret predicted distributions and structure a priori hypotheses for coalescent simulations to establish divergence patterns at the LGM. Basic 24
33 assumptions of SDMs include niche conservatism (Wiens & Graham, 2005), environmental data adequate to generate predictions of a species distribution (Kozak et al., 2008; McCormack et al., 2010), and adequate records of occurrence that encapsulate the species niche (Pearson et al., 2007). Timing of Divergence Fossil deposits in South Dakota, Nebraska, and Kansas, identify the most recent common ancestor for Z. hudsonius (Z. sandersi) in the middle Pleistocene ~1.0 Myra (Kurtén & Anderson, 1980). We chose a conservative divergence point of 1.0 Myr BP for Z. hudsonius from Z. sandersi and calculations of molecular sequence evolution was 3.14% per Myr (95%CI = 1.70% & 4.58%). A Bayesian coalescent approach implemented in BEAST ver was used to estimate the timing of divergence (Drummond & Rambaut, 2007). The GTR+ Γ model of evolution with four rate categories was used with priors of an uncorrelated lognormal tree, constant population size, and an assumed relaxed lognormal clock scaled to 100 ky BP (Drummond et al., 2006). All other parameter settings were default. Analyses estimated tree shape and divergence dates for nodes and sampled every 1000 iterations for 50 million generations with 10% of the initial samples discarded as burn-in. Results were analyzed in TRACER ver. 1.5 (Drummond & Rambaut, 2007) to check for appropriately large Effective Sample Size (ESS) values, convergence of results, and performance of operators. Coalescent Simulations Coalescent simulations were conducted to test specific historical biogeographic hypotheses (AV, SC, RF) with MESQUITE ver. 2.7 (Maddison & Maddison, 2009) using a 25
34 likelihood based or frequentist approach (Knowles & Maddison, 2002; Hickerson et al., 2010) versus estimating parameters not directly related to our questions (Beaumont et al., 2002). Gene matrices were simulated with 1,000 replicates for each hypothesis using ancestral N E(f) (84,395) from our estimate of the parameter θw, one-year generation time, and divergence estimate for Z. h. luteus/pallidus (17.5 kya) obtained in BEAST. We evaluated the validity of these models by using upper and lower confidence intervals (90%) of θw (Knowles et al., 2007). We constructed genealogies from each matrix in PAUP* heuristic parsimony searches with 10 random addition replicates, tree bisection-reconnection branch swapping and max-trees set to 100. Each search produced a majority-rule consensus tree from which we calculated s (Slatkin & Maddison, 1989), a measure of discord between the reconstructed gene tree and the assignment of individuals into separate lineages. When lineage assignment is treated as a character that is mapped parsimoniously onto the gene tree, s is the number of observed character state changes. Higher values of s for a specific locus indicate that sequences are paraphyletic with respect to their lineage association, a possible indication of either gene flow or incomplete lineage sorting. The test statistic of empirical data was compared against simulated data and considered to be significant (two-tailed) if the empirical values occur outside of the 90% CI generated via simulation tests. Our θ estimates (effective population size scaled to the neutral mutation rate) were calibrated to recent fossil dates (100 kyr BP) using the equation θ = 4N E(f) µ, assuming µ = 3.14 substitutions per Myr calculated in BEAST. Scaled branch widths of θ were used for each of the biogeographic hypotheses. 26
35 Historical demography Historical demography was reconstructed with Bayesian Skyline Plots (BSP; (Drummond et al., 2005) as implemented in BEAST which estimates θ through time and does not require a specified demographic model (e.g. constant size, exponential growth, logistic growth, or expansive growth). We used the same parameters as timing of divergence and applied five grouped coalescent intervals (m). Finally, we tested for non-neutral mutational changes with Tajima s D (Tajima, 1989), Fu s F S (Fu, 1997), which were calculated in DNASP ver (Librado & Rozas, 2009) and significance was tested with 10,000 coalescent simulations. For these historical demographic analyses, we used a reduced dataset of 56 individuals representing coding region (cyt b) of sequence data as these tests are sensitive to synonymous versus nonsynonymous changes and missing data. Landscape genetics We tested the null hypotheses of no population differentiation among all sampled sites (F ST = 0) using 10,000 permutations in ARLEQUIN. To examine the relationship between geographic distance and genetic distance we performed Mantel tests and interpolation of genetic landscape shape using Alleles in Space (AIS, (Miller, 2005). 27
36 RESULTS DNA extraction, PCR and sequencing Using the concatenated dataset of 1514 bp (i.e., 1512 plus 2 insertions), we documented 19 haplotypes, with 36 variable sites of which 17 were parsimony informative for Z. h. luteus (Table 1). We re-sequenced 8 individuals for CR given differences reported between Ramey et al. (2005) and King et al. (2006) datasets and added sequences from cyt b for these individuals. We further compared CR & cyt b sequences with King et al. (2006) for 13 individuals. We documented no discordance with either dataset downloaded from GenBank when compared to our Z. h. luteus sequences but identified and then corrected errors in reporting museum catalogue numbers and localities (Appendix S1). Phylogeography Zapus h. luteus was monophyletic but showed little geographic structure (Fig. 2). Tree topologies were consistent across methods MP, ML, and PP. Median joining network (Fig. 4) identified a common haplotype in the Jemez Mountains (Hap 1) that is shared with the Sacramento Mountains and upper Rio Grande. The most divergent haplotype (Hap 12) differs by 8 mutations and occurs in the Sangre de Cristo Mountains. The tree topologies identified Z. h. pallidus as sister taxon to Z. h. luteus (Fig. 2). This agrees with previous findings by Ramey et al. (2005; based on mtdna sequence and nuclear microsatellites), shared characteristic haplotypes (Vignieri et al., 2006), and more extensive mtdna sequence and nuclear microsatellite data (King et al., 2006). 28
37 Species Distribution Modelling Distribution models performed well (i.e., AUC > 0.95) with variables of annual mean temperature (Bio1) and precipitation of the driest month (Bio15) contributing most to the model (Bio1 45.2%, Bio %, Bio17 9.1%, Bio7 8.0%, Bio9 7.6%, Bio8 7.0%, others <5.0%). Annual mean temperature was the most informative variable alone based on the jackknife test of variable importance. In general, this model accurately predicted the location of 4 of 6 known regions (Jemez, Sangre de Cristo, White, Sacramento). However, the model failed to predict occupied areas along major low-elevation rivers in arid areas (i.e., lower Rio Grande, San Juan River tributaries), perhaps because suitable microclimate in these river systems is extremely limited (Fig. 3). In addition, the model predicted suitable climate in several areas where Z. h. luteus is not known to occur such as the Mogollon Mountains and Black Range in southwestern New Mexico. The LGM model predicted wider (compared to current) potential paleodistributions for Z. h. luteus (Fig. 3). Most of this predicted distribution is outside the currently occupied range. Fossils for this lineage of Z. hudsonius are available from Hall, Schulze, and Zesch caves on the Edwards Plateau (Fig. 3; (Dalquest et al., 1969; Hafner, 1993; Sagebiel, 2010), and from Tonk Creek in the North-central plains (Pfau, 1994), all of which date to the late Wisconsin. Scarbrough (1986) identified fossil teeth of Z. hudsonius from Bat Cave, Plains of San Augustin (= Agustín) in southwestern New Mexico that date to the early Holocene (approximately 8000y BP; Harris, 1990). Additional older fossils are available for Zapus sp. in Kansas and Oklahoma dating from the Middle Pleistocene into the Pliocene (Krutzsch, 1954; Hibbard, 1956; Klingener, 29
38 1963). Finally, there are several Holocene and Pleistocene faunas throughout the American Southwest where Zapus are absent (Kurtén & Anderson, 1980; Harris, 1990). Timing of Divergence The MRCA of Z. h. luteus dates to the Late Pleistocene 17.5kyr BP (95% CI, kyr BP) which diverged from the most recent common ancestor of Z. h. pallidus roughly 25kyr BP (95%CI, kyr BP) from an average mutation rate of 3.14% (95% CI, 1.71% 4.58%) per million years. We calculated Θw = resulting in an ancestral N E of 84,395. Coalescent Simulations The recently fragmented ancestor hypothesis could not be rejected and alternative hypotheses (AV and SC) of diversification were rejected. These results are based on the observed value of Slatkin and Maddison s s as compared to simulated values (s = 56; Fig. 2; Slatkin and Maddison, 1989). Historical demography All coalescent calculations of neutrality failed to reject the null hypothesis of static demography (Table 2). Zapus h. luteus populations were static for the last 175k years but began increasing roughly 25kyr BP, or at the LGM and entering into the current interglacial (i.e., early Holocene; all ESS values > 300; Fig. 4). That period coincides with the split of Z. h. luteus/pallidus (Fig. 2). A slight increase in effective population size from the late Pleistocene through the Holocene corresponds to the range shifts documented between the paleodistribution and the contemporary distribution of Z. h. 30
39 luteus (Fig. 3). We do not detect a significant signature of population demographic expansion using these techniques. Landscape Genetics Results of AMOVA revealed that 66% of the variation is within populations of Z. h. luteus with a lower than expected fixation index (FST =.3394, P < 0.01) for Z. h. luteus. The correlation of genetic distance to geographic distance was low (r = 0.034) with little chance of observing values greater (P = ) or less (P = ). Barriers to gene flow, based on landscape shape interpolation, exist in the northern distribution of Z. h. luteus (Fig. 4). 31
40 DISCUSSION Biogeographic History Based on an array of independent evidence including phylogeny, coalescent simulations, SDMs, and fossils, the recently fragmented ancestor model was supported. We rejected alternative models of sequential colonization and the ancient vicariance with persistent isolation. The ancestor of Z. h. luteus occurred on the Edwards Plateau and eastern edge of the Southern Plains during the LGM, a conclusion supported by both SDMs and direct fossil evidence. We postulate that the ancestor then shifted distribution westward as it tracked warming climate of the Holocene, eventually resulting in vicariance into multiple populations as it retreated to mesic riparian refugia in mountains or along major rivers. Given the close association of Z. h. luteus with riparian areas (Frey & Malaney, 2009), we hypothesize the use of river systems (e.g., the Rio Grande or Pecos River) or ancient lake shores (Plains of San Agustín) as colonization routes due to the dense herbaceous cover required and these areas coincide with the potential distributions at LGM. The only fossils of Z. hudsonius from the American Southwest are those from the Plains of San Agustín in southwestern New Mexico, which are dated to the Holocene (8000kyr BP). The appearance of Z. hudsonius fossils at this time and place suggests the early Holocene colonization of New Mexico, because this species is absent from multiple earlier fossil deposits in this region (Kurtén & Anderson, 1980; Scarbrough, 1986; Harris, 1990). We detected signatures of recent fragmentation and shifting distributions to higher elevations but failed to detect a strong signature of demographic expansion. The Bayesian skyline plot showed that effective population size remained constant for several thousand generations. Further, there was no departure from 32
41 neutrality typically indicative of populations experiencing rapid demographic change (Lessa et al., 2003; Lessa et al., 2010). Consequently, we conclude Z. h. luteus shifted distribution since the LGM with minor historical fluctuations in population size, and have only recently (i.e., last 10kyr) been fragmented to their current distributions. Hafner et al. (1981) suggested that the ancestor of Z. h. luteus instead occurred in the north (inferring close relationship with Z. h. preblei, which is the geographically closest conspecific populations to Z. h. luteus). These ancestors were hypothesized to have colonized Arizona and southern New Mexico during pluvial maxima via southward movement through the plains east of the Southern Rocky Mountains. Hafner et al. (1981) cited prior studies (Harris & Findley, 1964; Harris, 1970; Harris et al., 1973) that suggested broad occurrence of cool, moist-grasslands throughout central and southern New Mexico as supporting evidence. However, upon discovery that LGM fossils of Zapus from the Edwards Plateau were Z. hudsonius rather than Z. princeps, Hafner (1993) modified this scenario to suggest that Z. hudsonius spread south and west to colonize the American Southwest. In doing so, he also refuted the earlier paleoreconstruction hypothesis that the flora and fauna of the Edwards Plateau were continuously distributed across the High Plains to the Rocky Mountains through alpine meadow habitat (Dalquest et al., 1969). Thus, Hafner (1993) concluded that the flora and fauna of the Edwards Plateau resulted from eastern grassland influence, rather than western boreal influences. Our study provides broad support for Hafner s (1993) conclusions, but refutes the earlier southward colonization model of Hafner et al. (1981). First, and in agreement with previous studies (Ramey et al., 2005; King et al., 2006; Vignieri et al., 2006), Z. h. luteus is most closely related to Z. h. pallidus, not Z. h. 33
42 preblei. Secondly, there are no fossils to suggest either a Z. h. luteus/preblei ancestor on the Colorado Piedmont or an in situ lineage of Z. h. luteus in the American Southwest before the Holocene. The fossil record is consistent with a Z. h. luteus/pallidus ancestral lineage. Finally, divergence of Z. h. luteus and Z. h. pallidus coincided with the LGM when the recent ancestor of Z. h. luteus colonized north-westward during the warm, arid phase of the Holocene (Harris, 1990), while the Z. h. pallidus lineage shifted north and east. It seems likely that the phylogeographic history of Z. h. luteus may apply to other species that occur in the American Southwest but that have northeastern affinities (e.g., southern redbelly dace [Phoxinus erythrogaster], meadow vole [Microtus pennsylvanicus]). Potential current distributions for Z. h. luteus were predicted from several areas (e.g. Mogollon Mountains and Black Range) where there are no records (Findley et al., 1975; Hafner et al., 1981; Morrison, 1992; Frey & Malaney, 2009; Frey, 2010). Three possibilities emerge: 1) these regions were colonized and subsequently went extinct (Findley, 1969; Patterson, 1980), 2) populations currently exist but have yet to be documented (Udvardy, 1969; Frey, 2009), or 3) colonization never occurred (Lomolino, 1993; Lomolino & Davis, 1997). Holocene fossils of Z. hudsonius from the Plains of San Agustín located near the northern edge of the Mogollon Mountain-Black Range massive and the edge of Pleistocene Lake San Agustín (Scarbrough, 1986) suggest Z. h. luteus was extirpated from this region. Vicariance and Dispersal 34
43 Minimal genealogical structuring (Fig. 2) across the spatially disjunct populations of Z. h. luteus in the southwestern United States reflects a shallow demographic history without demographic expansion or contemporary gene flow (Excoffier et al., 2009). Frey s (1994) cladistic analysis of allozyme data uncovered an unresolved polytomy and she concluded that Z. h. luteus diverged as a result of vicariance through the peripheral isolates model of speciation. Understanding the timing of these processes is critical because some of the patterns we documented, including low structure, shared haplotypes, no isolation by distance, and non-significant population increase, could alternatively be interpreted as signatures of recent gene flow. However, our explicit tests of hypotheses of historical biogeography demonstrate that there is no gene flow among currently isolated regions. Brown (1971) hypothesized that boreal mammals in the Great Basin were islandbound Pleistocene relicts that are now survivors of more widespread ancestors, a paradigm which has persisted, albeit strongly challenged, for nearly four decades. Subsequent researchers have suggested many boreal species are capable of traversing the intervening desert habitats with high success (Davis & Dunford, 1987; Lawlor, 1998; Floyd et al., 2005) thereby allowing persistent gene flow among islands. Timing of original establishment (extinction driven), or alternatively, timing of immigration among islands (colonization driven), is of critical importance in making sound conclusions about historical biogeography and conservation (DeChaine & Martin, 2006; Shepard & Burbrink, 2008, 2009). Indeed, there may be little genetic divergence among recently isolated regions because the coalescent process takes time and may be locally discordant (Rosenberg & Nordborg, 2002). But, concluding there is ongoing gene flow without 35
44 entertaining alternatives can be problematic (Knowles, 2009; Beaumont et al., 2010). Colonization-driven processes would exhibit different signatures than those reflected in Z. h. luteus. Colonization or immigration-mediated signatures may reflect three different processes: 1) shared haplotypes among geographic localities resulting in multiple, sequentially structured haplotypes from a repetitive source, 2) a structured event (e.g. ancient vicariance) which is now mixed geographically, 3) or hybridization. Marmots (Marmota flaviventris) in the Great Basin appear to have sequential structure (Floyd et al., 2005) whereas tree frogs (Hyla arenicolor/h. wrightorum) in the Grand Canyon have experienced recent hybridization (Bryson et al., 2010). Finally, ongoing gene flow should result in haplotypes shared across geographic localities as detected in California voles (Microtus californicus; (Conroy & Neuwald, 2008; Adams & Hadly, 2010) and Pacific jumping mice (Z. trinotatus; (Vignieri, 2005). We document a low level of haplotype sharing between nearby regions which is due to a lack of lineage sorting, rather than ongoing gene flow. Management Recommendations As demonstrated here, isolated populations are not always highly divergent but may still retain distinctive signatures worth preserving as they reflect the complex history of the lineage. Zapus h. luteus has experienced recent rapid decline with extirpations of populations as a consequence of anthropogenic land use practices and drought (Frey & Malaney, 2009), however these recent declines were not reflected in the genetic signatures as the coalescent does not always detect very recent processes (Arbogast et al., 36
45 2002; Wakeley, 2008). Mesic habitats, including riparian areas, are limited in the xeric Southwest and projected to experience significant declines within the next century (Moritz et al., 2008). Management actions that aim to maintain or bolster populations of Z. h. luteus may be required. Repatriation efforts, in particular, will need to be properly planned to insure the genetic integrity of populations. Hence, we recommend additional studies using independent nuclear markers, given the shortcomings of a single-locus mtdna data set, to more fully assess the relationships and diversification of geographically isolated populations (Brito & Edwards, 2009; Edwards, 2009). For example, some regions that we initially expected to be genetically similar, were not (northern and middle Rio Grande populations) while others show genetic distances that generally parallel landscape distances (Fig. 4). Finally, consequences of repatriation and artificial admixture of populations in attempts of genetic rescue (Hedrick, 2004) could have profound implications for altering the course of diversification for organisms that have begun independent evolutionary trajectories in contemporary isolation, thereby erasing early signatures of incipient speciation and biogeographic history. Consequently, conservation should preferentially focus on restoration of habitats and in situ expansion of remaining remnant populations with repatriation considered only as secondary measures. 37
46 ACKNOWLEDGMENTS We thank A. Harris, S.O. MacDonald, two anonymous reviewers, and members of the CUERVO Molecular Lab for reviewing early versions of this manuscript. Funding for this project was provided by the NMDG&F Share with Wildlife program, T&E Inc., UNM GRD research funds, and the Museum of Southwestern Biology s Yates Field Mammalogy Fund. 38
47 LITERATURE CITED Adams, R.I. & Hadly, E.A. (2010) High levels of gene flow in the California vole (Microtus californicus) are consistent across spatial scales. Western North American Naturalist, 70, Arbogast, B.S., Edwards, S.V., Wakeley, J., Beerli, P. & Slowinski, J.B. (2002) Estimating divergence times from molecular data on phylogenetic and population genetic timescales. Annual Review of Ecology and Systematics, 33, Armstrong, D.M. (1972) Distribution of the mammals of Colorado. University of Kansas Press, Lawrence, KS. Barber, P.H. (1999) Phylogeography of the canyon treefrog, Hyla arenicolor (Cope) based on mitochondrial DNA sequence data. Molecular Ecology, 8, Beaumont, M., Zhang, W. & Balding, D.J. (2002) Approximate Bayesian computation in population genetics. Genetics, 162, Beaumont, M.A., Nielsen, R., Robert, C., Hey, J., Gaggiotti, O., Knowles, L., Estoup, A., Panchal, M., Corander, J., Hickerson, M., Sisson, S.A., Fagundes, N., Chikhi, L., Beerli, P., Vitalis, R., Cornuet, J.M., Huelsenbeck, J., Foll, M., Yang, Z.H., Rousset, F., Balding, D. & Excoffier, L. (2010) In defence of model-based inference in phylogeography REPLY. Molecular Ecology, 19, Bell, C.J., Lundelius, E.L., Barnosky, A.D., Graham, R.W., Lindsay, E.H., Ruez, D.R., Semken, H.A., Webb, S.D. & Zakrzewski, R.J. (2004) The Blancan, Irvingtonian, and Rancholabrean Mammal Ages. Late Cretaceous and Cenozoic Mammals of 39
48 North America : Biostratigraphy and Geochronology (ed. by M.O. Woodburne), p Columbia University Press, New York, NY, USA. Brito, P. & Edwards, S.V. (2009) Multilocus phylogeography and phylogenetics using sequence-based markers. Genetica, 135, Brown, J.H. (1971) Mammals on mountaintops - nonequilibrium insular biogeography. American Naturalist, 105, Brunsfeld, S.J., Sullivan, J., Soltis, D.E. & Soltis, P.S. (2001) Comparative phylogeography of northwestern North America: A synthesis. Integrating ecology and evolution in a spatial context (ed. by J. Silvertown and J. Antonovics), pp Blackwell Publishing, Williston, Vermont. Bryson, R.W., Jr., Nieto-Montes de Oca, A., Jaeger, J.R. & Riddle, B.R. (2010) Elucidation of cryptic diversity in a widespread nearctic treefrog reveals episodes of mitochonrial gene capture as frogs diversified across a dynamic landscape. Evolution, 64, Buckley, D. (2009) Toward an organismal, integrative, and iterative phylogeography. Bioessays, 31, Conroy, C.J. & Neuwald, J.L. (2008) Phylogeographic study of the California vole, Microtus californicus. Journal of Mammalogy, 89, Dalquest, W.W., Roth, E. & Judd, F. (1969) The mammal fauna of Schulze cave Edwards County Texas USA fossil armadillo peccary ringtail rock squirrel absence. Bulletin of the Florida State Museum Biological Sciences, 13,
49 Davis, R. & Dunford, C. (1987) An example of contemporary colonization of the montane islands by small, nonflying mammals in the American Southwest. American Naturalist, 129, Davis, R., Dunford, C. & Lomolino, M.V. (1988) Montane mammals of the American Southwest - the possible influence of post-pleistocene colonization. Journal of Biogeography, 15, DeChaine, E.G. & Martin, A.P. (2006) Using coalescent simulations to test the impact of quaternary climate cycles on divergence in an alpine plant-insect association. Evolution, 60, Ditto, A.M. & Frey, J.K. (2007) Effects of ecogeographic variables on genetic variation in montane mammals: implications for conservation in a global warming scenario. Journal of Biogeography, 34, Drummond, A.J. & Rambaut, A. (2007) BEAST: Bayesian evolutionary analysis by sampling trees. Bmc Evolutionary Biology, 7 Drummond, A.J., Rambaut, A., Shapiro, B. & Pybus, O.G. (2005) Bayesian coalescent inference of past population dynamics from molecular sequences. Molecular Biology and Evolution, 22, Drummond, A.J., Ho, S.Y.W., Phillips, M.J. & Rambaut, A. (2006) Relaxed phylogenetics and dating with confidence. Plos Biology, 4, Edgar, R.C. (2004) MUSCLE: a multiple sequence alignment method with reduced time and space complexity. Bmc Bioinformatics, 5,
50 Edwards, S.V. (2009) Is a new and general theory of molecular systematics emerging? Evolution, 63, Elith, J., Graham, C.H., Anderson, R.P., Dudik, M., Ferrier, S., Guisan, A., Hijmans, R.J., Huettmann, F., Leathwick, J.R., Lehmann, A., Li, J., Lohmann, L.G., Loiselle, B.A., Manion, G., Moritz, C., Nakamura, M., Nakazawa, Y., Overton, J.M., Peterson, A.T., Phillips, S.J., Richardson, K., Scachetti-Pereira, R., Schapire, R.E., Soberon, J., Williams, S., Wisz, M.S. & Zimmermann, N.E. (2006) Novel methods improve prediction of species' distributions from occurrence data. Ecography, 29, Excoffier, L., Foll, M. & Petit, R.J. (2009) Genetic consequences of range expansions. Annual Review of Ecology Evolution and Systematics, 40, Felsenstein, J. (1985) Phylogenies and the Comparative Method. American Naturalist, 125, Felsenstein, J. (2004) Inferring phylogenies. Sinauer Associates, Inc., Sunderland, Massachusetts. Findley, J.S. (1969) Biogeography of the southwestern boreal and desert mammals. University of Kansas Museum of Natural History Miscellaneous Publication, Findley, J.S., Harris, A.H., Wilson, D.E. & Jones, C. (1975) Mammals of New Mexico. University of New Mexico Press, Albuquerque, NM. 42
51 Floyd, C.H., Van Vuren, D.H. & May, B. (2005) Marmots on Great Basin mountaintops: Using genetics to test a biogeographic paradigm. Ecology, 86, Franklin, J. (2010) Moving beyond static species distribution models in support of conservation biogeography. Diversity and Distributions, 16, Frey, J.K. (1994) Testing among modes of allopatric speciation: a hypothetico-deductive approach. PhD Dissertation, University of New Mexico, Albuquerque, New Mexico. Frey, J.K. (2009) Distinguishing range expansions from previously undocumented populations using background data from museum records. Diversity and Distributions, 15, Frey, J.K. (2010) Mammals of the Gila: patterns of diversity and threat. New Mexico Botanist, Special Issue, 2, Frey, J.K. & Malaney, J.L. (2009) Decline of the meadow jumping mouse (Zapus hudsonius luteus) in two mountain ranges in New Mexico. Southwestern Naturalist, 54, Frey, J.K., Bogan, M.A. & Yates, T.L. (2007) Mountaintop island age determines species richness of boreal mammals in the American Southwest. Ecography, 30, Fu, Y.X. (1997) Statistical tests of neutrality of mutations against population growth, hitchhiking and background selection. Genetics, 147,
52 Hafner, D.J. (1993) Reinterpretation of the Wisconsinan mammalian fauna and paleoenvironment of the Edwards Plateau, Texas. Journal of Mammalogy, 74, Hafner, D.J., Petersen, K.E. & Yates, T.L. (1981) Evolutionary relationships of jumping mice (Genus Zapus) of the southwestern United States. Journal of Mammalogy, 62, Hall, E.R. (1981) The mammals of North America, 2nd edn. John Wiley & Sons, New York, New York. Harris, A.H. (1970) Dry cave mammalian fauna and late pluvial conditions in southeastern New Mexico. Texas Journal of Science, 22, 3-&. Harris, A.H. (1990) Fossil evidence bearing on southwestern mammalian biogeography. Journal of Mammalogy, 71, Harris, A.H. (1993) Wisconsinan pre-pleniglacial biotic change in southeastern New Mexico. Quaternary Research, 40, Harris, A.H. & Findley, J.S. (1964) Pleistocene recent fauna of Isleta Caves Bernalillo County New Mexico. American Journal of Science, 262, Harris, A.H., Smartt, R.A. & Smartt, W.R. (1973) Cryptotis parva from the Pleistocene of New Mexico. Journal of Mammalogy, 54, Hedrick, P.W. (2004) Recent developments in conservation genetics. Forest Ecology and Management, 197,
53 Hewitt, G.M. (1996) Some genetic consequences of ice ages, and their role in divergence and speciation. Biological Journal of the Linnean Society, 58, Hewitt, G.M. (2001) Speciation, hybrid zones and phylogeography - or seeing genes in space and time. Molecular Ecology, 10, Hewitt, G.M. (2004) Genetic consequences of climatic oscillations in the Quaternary. Philosophical Transactions of the Royal Society of London Series B-Biological Sciences, 359, Hibbard, C.W. (1956) Vertebrate fossils from the Meade formation of Southwestern Kansas. Michigan Acadamy of Science Arts and Letters, 41, Hickerson, M.J., Carstens, B.C., Cavender-Bares, J., Crandall, K.A., Graham, C.H., Johnson, J.B., Rissler, L., Victoriano, P.F. & Yoder, A.D. (2010) Phylogeography's past, present, and future: 10 years after Avise, Molecular Phylogenetics and Evolution, 54, Hijmans, R.J., Cameron, S.E., Parra, J.L., Jones, P.G. & Jarvis, A. (2005) Very high resolution interpolated climate surfaces for global land areas. International Journal of Climatology, 25, Hillis, D.M. & Bull, J.J. (1993) An empirical test of bootstrapping as a method for assessing confidence in phylogenetic analyses. Systematic Biology, 42, Hoffmeister, D.H. (1986) Mammals of Arizona. University of Arizona Press, Tucson, AZ. 45
54 Holt, R.D. (2009) Bringing the Hutchinsonian niche into the 21st century: Ecological and evolutionary perspectives. Proceedings of the National Academy of Sciences of the United States of America, 106, Huelsenbeck, J.P. & Ronquist, F. (2005) Bayesian analysis of molecular evolution using MrBayes. Statistical Methods in Molecular Evolution, Hutchinson, G.E. (1957) Population studies - animal ecology and demography - concluding remarks. Cold Spring Harbor Symposia on Quantitative Biology, 22, IUCN (2001) IUCN Red List Categories and Criteria: Version 3.1. In: (ed. I.S.S. Commission), p. 30 pp. IUCN, Gland, Switzerland; Cambridge, UK. King, T.L., Switzer, J.F., Morrison, C.L., Eackles, M.S., Young, C.C., Lubinski, B.A. & Cryan, P. (2006) Comprehensive genetic analyses reveal evolutionary distinction of a mouse (Zapus hudsonius preblei) proposed for delisting from the US Endangered Species Act. Molecular Ecology, 15, Klingener, D. (1963) Dental evolution of Zapus. Journal of Mammalogy, 44, Klymus, K.E., Humfeld, S.C., Marshall, V.T., Cannatella, D. & Gerhardt, H.C. (2010) Molecular patterns of differentiation in canyon treefrogs (Hyla arenicolor): evidence for introgressive hybridization with the Arizona treefrog (H. wrightorum) and correlations with advertisement call differences. Journal of Evolutionary Biology, 23,
55 Knowles, L.L. (2001a) Did the Pleistocene glaciations promote divergence? Tests of explicit refugial models in montane grasshopprers. Molecular Ecology, 10, Knowles, L.L. (2001b) Genealogical portraits of speciation in montane grasshoppers (genus Melanoplus) from the sky islands of the Rocky Mountains. Proceedings of the Royal Society of London Series B-Biological Sciences, 268, Knowles, L.L. (2009) Statistical phylogeography. Annual Review of Ecology Evolution and Systematics, 40, Knowles, L.L. & Maddison, W.P. (2002) Statistical phylogeography. Molecular Ecology, 11, Knowles, L.L., Carstens, B.C. & Keat, M.L. (2007) Coupling genetic and ecologicalniche models to examine how past population distributions contribute to divergence. Current Biology, 17, Kozak, K.H., Graham, C.H. & Wiens, J.J. (2008) Integrating GIS-based environmental data into evolutionary biology. Trends in Ecology & Evolution, 23, Krutzsch, P.H. (1954) North American jumping mice (genus Zapus). University of Kansas Publications, Museum of Natural History, 7, Kurtén, B. & Anderson, E. (1980) Pleistocene Mammals of North America. Columbia University Press, New York. Lawlor, T.E. (1998) Biogeography of great mammals: paradigm lost? Journal of Mammalogy, 79,
56 Lear, L.L. & Harris, A.H. (2007) Holocene fauna of Big Manhole Cave, Eddy County, New Mexico. Southwestern Naturalist, 52, Lessa, E.P., Cook, J.A. & Patton, J.L. (2003) Genetic footprints of demographic expansion in North America, but not Amazonia, during the Late Quaternary. Proceedings of the National Academy of Sciences of the United States of America, 100, Lessa, E.P., D'Elia, G. & Pardinas, U.F.J. (2010) Genetic footprints of late Quaternary climate change in the diversity of Patagonian-Fueguian rodents. Molecular Ecology, 19, Librado, P. & Rozas, J. (2009) DnaSP v5: a software for comprehensive analysis of DNA polymorphism data. Bioinformatics, 25, Lomolino, M.V. (1993) Immigrations and distribution patterns of insular mammals - studying fundamental processes in island biogeography. Ecography, 16, Lomolino, M.V. & Davis, R. (1997) Biogeographic scale and biodiversity of mountain forest mammals of western North America. Global Ecology and Biogeography Letters, 6, Lomolino, M.V., Brown, J.H. & Davis, R. (1989) Island biogeography of montane forest mammals in the American Southwest. Ecology, 70, Maddison, W. & McMahon, M. (2000) Divergence and reticulation among montane populations of a jumping spider (Habronattus pugillis Griswold). Systematic Biology, 49,
57 Maddison, W.P. & Maddison, D.R. (2009) MESQUITE: a modular system for evolutionary analysis. Masta, S.E. (2000) Phylogeography of the jumping spider Habronattus pugillis (Araneae : Salticidae): Recent vicariance of sky island populations? Evolution, 54, McCormack, J.E., Zellmer, A.J. & Knowles, L.L. (2010) Does niche divergence accompany allopatric divergence in Aphelocoma jays as predicted under ecological speciation?: Insights from tests with niche models. Evolution, 64, McDonald, K.A. & Brown, J.H. (1992) Using montane mammals to model extinctions due to global change. Conservation Biology, 6, Merriam, C.H. (1890) Results of a biological survey of the San Francisco Mountains region and desert of the Little Colorado in Arizona. North American Fauna, 3, 136. Miller, G.S. (1911) A new Jumping-Mouse from New Mexico. Washington D.C. Proc. Biol. Soc., 24, ( ). Miller, M.P. (2005) Alleles In Space (AIS)-Computer software for the joint analysis of interindividual spatial and genetic information. Journal of Heredity, 96, Moritz, C., Patton, J.L., Conroy, C.J., Parra, J.L., White, G.C. & Beissinger, S.R. (2008) Impact of a century of climate change on small-mammal communities in Yosemite National Park, USA. Science, 322,
58 Morrison, J.L. (1992) Persistence of the meadow jumping mouse, Zapus hudsonius luteus, in New Mexico. Southwestern Naturalist, 37, Patterson, B.D. (1980) Montane mammalian biogeography in New Mexico USA. Southwestern Naturalist, 25, Patterson, B.D. (1989) Local extinctions and the biogeographic dynamics of boreal mammals in the Southwest. Storm over a mountain island: conservation biology and the Mt. Graham affair (ed. by C.A. Istock and R.S. Hoffmann). The University of Arizona Press, Tucson. Patterson, B.D. (1999) Contingency and determinism in mammalian biogeography: The role of history. Journal of Mammalogy, 80, Pearson, R.G., Raxworthy, C.J., Nakamura, M. & Peterson, A.T. (2007) Predicting species distributions from small numbers of occurrence records: a test case using cryptic geckos in Madagascar. Journal of Biogeography, 34, Peel, M.C., Finlayson, B.L. & McMahon, T.A. (2007) Updated world map of the Köppen-Geiger climate classification. Hydrology and Earth System Sciences, 11, Pfau, R.S. (1994) A late Pleistocene mammal fauna from Stonewall County, Texas. The Texas Journal of Science, 46, Phillips, S.J., Anderson, R.P. & Schapire, R.E. (2006) Maximum entropy modeling of species geographic distributions. Ecological Modelling, 190,
59 Posada, D. & Crandall, K.A. (1998) MODELTEST: testing the model of DNA substitution. Bioinformatics, 14, Posada, D. & Crandall, K.A. (2002) The effect of recombination on the accuracy of phylogeny estimation. Journal of Molecular Evolution, 54, Ramey, R.R., Liu, H.P., Epps, C.W., Carpenter, L.M. & Wehausen, J.D. (2005) Genetic relatedness of the Preble's meadow jumping mouse (Zapus hudsonius preblei) to nearby subspecies of Z. hudsonius as inferred from variation in cranial morphology, mitochondrial DNA and microsatellite DNA: implications for taxonomy and conservation. Animal Conservation, 8, Richards, C.L., Carstens, B.C. & Knowles, L.L. (2007) Distribution modelling and statistical phylogeography: an integrative framework for generating and testing alternative biogeographical hypotheses. Journal of Biogeography, 34, Richardson, D.M. & Whittaker, R.J. (2010) Conservation biogeography - foundations, concepts and challenges. Diversity and Distributions, 16, Rissler, L.J. & Apodaca, J.J. (2007) Adding more ecology into species delimitation: Ecological niche models and phylogeography help define cryptic species in the black salamander (Aneides flavipunctatus). Systematic Biology, 56, Rosenberg, N.A. & Nordborg, M. (2002) Genealogical trees, coalescent theory and the analysis of genetic polymorphisms. Nature Reviews Genetics, 3, Sagebiel, J.C. (2010) Late Pleistocene fauna from Zesch Cave, Mason County, Texas. Quaternary International, 217,
60 Scarbrough, L.L. (1986) Zooarchaeological investigations of climatic change at Bat Cave, San Augustin Plains, Catron Co., New Mexico. MS Thesis, The University of Texas at El Paso, El Paso. Scoble, J. & Lowe, A.J. (2010) A case for incorporating phylogeography and landscape genetics into species distribution modelling approaches to improve climate adaptation and conservation planning. Diversity and Distributions, 16, Shepard, D.B. & Burbrink, F.T. (2008) Lineage diversification and historical demography of a sky island salamander, Plethodon ouachitae, from the Interior Highlands. Molecular Ecology, 17, Shepard, D.B. & Burbrink, F.T. (2009) Phylogeographic and demographic effects of Pleistocene climatic fluctuations in a montane salamander, Plethodon fourchensis. Molecular Ecology, 18, Slatkin, M. & Maddison, W.P. (1989) A cladistic measure of gene flow inferred from the phylogenies of alleles. Genetics, 123, Smith, C.I. & Farrell, B.D. (2005) Phylogeography of the longhorn cactus beetle Moneilema appressum LeConte (Coleoptera : Cerambycidae): was the differentiation of the Madrean sky islands driven by Pleistocene climate changes? Molecular Ecology, 14, Smith, K.F. & Brown, J.H. (2002) Patterns of diversity, depth range and body size among pelagic fishes along a gradient of depth. Global Ecology and Biogeography, 11,
61 Soberon, J. & Peterson, T.A. (2005) Interpretation of models of fundamental ecological niches and species' distributional areas. Biodiversity Informatics, 2, Soberon, J.M. (2010) Niche and area of distribution modeling: a population ecology perspective. Ecography, 33, Sullivan, R.M. (1994) Micro-evolutionary differentiation and biogeographic structure among coniferous forest populations of the Mexican woodrat (Neotoma mexicana) in the American Southwest - a test of the vicariance hypothesis. Journal of Biogeography, 21, Swofford, D.L. (2002) PAUP* Beta version. Phylogenetic analysis using parsimony (*and other methods). Sinauer Associated, Sunderland, Massachusetts. Tajima, F. (1989) Statistical method for testing the neutral mutation hypothesis by DNA polymorphism. Genetics, 123, Udvardy, M.D.F. (1969) Dynamic zoogeography with special reference to land animals. Dynamic Zoo Geography with Special Reference to Land Animals, 445. Vignieri, S.N. (2005) Streams over mountains: influence of riparian connectivity on gene flow in the Pacific jumping mouse (Zapus trinotatus). Molecular Ecology, 14, Vignieri, S.N., Hallerman, E.M., Bergstrom, B.J., Hafner, D.J., Martin, A.P., Devers, P., Grobler, P. & Hitt, N. (2006) Mistaken view of taxonomic validity undermines conservation of an evolutionarily distinct mouse: a response to Ramey et al. (2005). Animal Conservation, 9,
62 Wakeley, J. (2008) Coalescent Theory: An Introduction. Roberts and Company Publishers, Greenwood Village, Colorado. Waltari, E. & Guralnick, R.P. (2009) Ecological niche modelling of montane mammals in the Great Basin, North America: examining past and present connectivity of species across basins and ranges. Journal of Biogeography, 36, Waltari, E., Hijmans, R.J., Peterson, A.T., Nyari, A.S., Perkins, S.L. & Guralnick, R.P. (2007) Locating Pleistocene refugia: comparing phylogeographic and ecological niche model predictions. Plos One, 2 Weaver, K.F., Anderson, T. & Guralnick, R. (2006) Combining phylogenetic and ecological niche modeling approaches to determine distribution and historical biogeography of Black Hills mountain snails (Oreohelicidae). Diversity and Distributions, 12, Wiens, J.J. (2004) Speciation and ecology revisited: Phylogenetic niche conservatism and the origin of species. Evolution, 58, Wiens, J.J. & Graham, C.H. (2005) Niche conservatism: Integrating evolution, ecology, and conservation biology. Annual Review of Ecology Evolution and Systematics, 36, Yensen, E., Hafner, D.J., Cook, J.A., Hafner, D.J., Yensen, E. & Kirkland, G.L. (1998) Conservation priorities, action plans, and conservation strategies for North American rodents. North American rodents: status survey and conservation action plan.,
63 Zwickl, D.J. (2006) Genetic algorithm approaches for the phylogenetic analysis of large biological sequence datasets under the maximum likelihood criterion. PhD dissertation, The University of Texas at Austin, Austin, Texas. 55
64 APPENDIX Appendix S1 GenBank accession numbers for taxa used in the manuscript with associated museum and tissue numbers; CR mitochondrial control region and cyt b mitochondrial cytochrome b gene. Geographic regions: JMZ - Jemez Mountains, MRG - Middle Rio Grande Valley, SAC - Sacramento Mountains, SDC - Sangre de Cristo Mountains, SAJ - San Juan Mountains, URG - Upper Rio Grande Valley, WHT - White Mountains. Haplotypes are listed that correspond with Fig. 4 and associated samples cited in the text with sampling localities represented as geographic coordinates (latitude and longitude). 56
65 Museum # Tissue # Taxon CR cyt b Hap Region Latitude Longitude DMNH 8630 Z. h. luteus AY SDC DMNH 8631 Z. h. luteus AY SDC DMNH 8632 Z. h. luteus AY SDC DMNH 8633 Z. h. luteus AY SDC DMNH 8634 Z. h. luteus AY SDC DMNH 8635 Z. h. luteus AY SDC MSB Z. h. luteus AY SAC MSB NK 1584 Z. h. luteus JN JN WHT MSB NK 1585 Z. h. luteus JN JN WHT MSB NK 1592 Z. h. luteus JN JN WHT MSB NK 1593 Z. h. luteus JN JN WHT
66 Museum # Tissue # Taxon CR cyt b Hap Region Latitude Longitude MSB NK 1594 Z. h. luteus JN JN WHT MSB NK 1595 Z. h. luteus JN JN WHT MSB NK 1598 Z. h. luteus JN JN WHT MSB NK 1603 Z. h. luteus JN JN WHT MSB NK 1604 Z. h. luteus JN JN WHT MSB NK 1605 Z. h. luteus JN JN WHT MSB NK 1606 Z. h. luteus JN JN WHT MSB NK 1607 Z. h. luteus JN JN WHT MSB NK 856 Z. h. luteus JN JN JMZ MSB NK 878 Z. h. luteus JN JN SAC MSB NK 879 Z. h. luteus JN JN SAC
67 Museum # Tissue # Taxon CR cyt b Hap Region Latitude Longitude MSB NK 874 Z. h. luteus JN JN SAC MSB NK 877 Z. h. luteus JN JN SAC MSB NK 876 Z. h. luteus JN JN SAC MSB NK 873 Z. h. luteus JN JN SAC MSB NK 875 Z. h. luteus JN JN SAC MSB NK 871 Z. h. luteus JN JN SAC MSB NK 872 Z. h. luteus JN JN SAC MSB NK 884 Z. h. luteus JN JN MRG MSB NK 885 Z. h. luteus JN JN MRG MSB NK 886 Z. h. luteus JN JN MRG MSB NK 887 Z. h. luteus JN JN MRG
68 Museum # Tissue # Taxon CR cyt b Hap Region Latitude Longitude MSB NK 888 Z. h. luteus JN JN MRG MSB NK 889 Z. h. luteus JN JN MRG MSB NK 890 Z. h. luteus JN JN MRG MSB NK 892 Z. h. luteus JN JN MRG MSB NK 893 Z. h. luteus JN JN MRG MSB NK 894 Z. h. luteus JN JN MRG MSB NK 895 Z. h. luteus JN JN MRG MSB NK 896 Z. h. luteus JN JN MRG MSB NK 897 Z. h. luteus JN JN MRG MSB NK 3832 Z. h. luteus DQ DQ JMZ MSB NK 3835 Z. h. luteus DQ DQ JMZ
69 Museum # Tissue # Taxon CR cyt b Hap Region Latitude Longitude MSB NK 3837 Z. h. luteus DQ DQ JMZ MSB NK 3826 Z. h. luteus DQ DQ JMZ MSB NK 3833 Z. h. luteus DQ JMZ MSB NK 3830 Z. h. luteus DQ JMZ MSB NK 3838 Z. h. luteus DQ DQ JMZ MSB NK 3842 Z. h. luteus DQ DQ JMZ MSB NK 3844 Z. h. luteus DQ DQ JMZ MSB NK 3845 Z. h. luteus DQ DQ JMZ MSB NK 3843 Z. h. luteus DQ DQ JMZ MSB NK 3839 Z. h. luteus DQ DQ JMZ MSB NK 3840 Z. h. luteus DQ DQ JMZ
70 Museum # Tissue # Taxon CR cyt b Hap Region Latitude Longitude MSB NK 3841 Z. h. luteus DQ DQ JMZ MSB NK 3827 Z. h. luteus DQ DQ JMZ MSB NK 3828 Z. h. luteus DQ DQ JMZ MSB NK 3831 Z. h. luteus DQ DQ JMZ MSB NK 3829 Z. h. luteus DQ DQ JMZ MSB NK 3834 Z. h. luteus DQ DQ JMZ MSB NK 9976 Z. h. luteus JN JN MRG MSB NK 9995 Z. h. luteus AY URG MSB NK 9993 Z. h. luteus AY URG MSB Z. h. luteus AY SAC MSB Z. h. luteus AY SAC
71 Museum # Tissue # Taxon CR cyt b Hap Region Latitude Longitude MSB Z. h. luteus AY SAC MSB Z. h. luteus AY SAC MSB Z. h. luteus AY SAC MSB NK Z. h. luteus AY JMZ MSB Z. h. luteus AY MRG MSB NK Z. h. luteus JN JN WHT MSB NK Z. h. luteus AY WHT MSB NK Z. h. luteus AY WHT MSB NK Z. h. luteus JN JN WHT MSB NK Z. h. luteus JN SAJ MSB NK Z. h. luteus JN SAJ
72 Museum # Tissue # Taxon CR cyt b Hap Region Latitude Longitude MSB NK 3836 Z. h. luteus DQ DQ JMZ MSB NK 1475 Z. h. luteus JN MRG FT 353 Z. h. luteus JN JN JMZ FT 358 Z. h. luteus JN JN SAC FT 359 Z. h. luteus JN JN SAC FT 360 Z. h. luteus JN JN JMZ FT 506 Z. h. luteus JN JN SDC FT 507 Z. h. luteus JN JN SDC FT 520 Z. h. luteus JN JN SDC FT 521 Z. h. luteus JN JN SDC FT 528 Z. h. luteus JN JN SDC
73 Museum # Tissue # Taxon CR cyt b Hap Region Latitude Longitude FT 541 Z. h. luteus JN JN SDC FT 604 Z. h. luteus JN JN SDC FT 605 Z. h. luteus JN JN SDC FT 613 Z. h. luteus JN JMZ Zhc_032 Z. h. campestris DQ DQ Zhc_087 Z. h. campestris DQ DQ Zhi_011 Z. h. intermedius DQ DQ Zhi_015 Z. h. intermedius DQ DQ Zhp_007 Z. h. preblei DQ DQ Zhp_019 Z. h. preblei DQ DQ Zhpa_002 Z. h. pallidus DQ DQ
74 Museum # Tissue # Taxon CR cyt b Hap Region Latitude Longitude Zhpa_006 Z. h. pallidus DQ DQ
 for the New Mexico meadow jumping mouse (Zapus hudsonius luteus) in the American Southwest with elevation shading above 2000 m in dark grey and over 3000 m")
75 FIGURES Figure 1. Distribution of all known records (circles) for the New Mexico meadow jumping mouse (Zapus hudsonius luteus) in the American Southwest with elevation shading above 2000 m in dark grey and over 3000 m in light grey. Holocene fossil record from the Plains of San Agustín is indicated by a square. Inset map shows the distribution of Z. hudsonius in North America (modified from Frey & Malaney, 2009). 67
76 Figure 2. Bayesian inference majority rules consensus tree produced using GTR + Γ model for 93 individuals of Z. h. luteus and sister taxa for 1514 bp of concatenated mitochondrial CR and cyt b genes. Stars at nodes correspond to posterior probabilities (>0.95, PP) from 50k post burn-in trees and 1k non-parametric bootstraps (>.95 ML, >.70 MP). Grey bars around nodes reflect the 95% CI for lineage divergence time with a relaxed molecular clock calibrated by fossils. Demographic hypotheses inset Alternative hypothesis parametric bootstrap (coalescent modelling) tests for Z. h. luteus with 90% confidence intervals and effective population size scaled to each contemporary population. The arrow highlights the empirical tree value for Slatkin and Maddison's s. 68
77 Figure 3. Species Distribution Models (A) contemporary SDM for 92 records (circles) of Zapus hudsonius luteus based on point-wise mean logistic bootstrap prediction with 20 replicates. Thresholds for probability of occurrence are white <0.5, light grey , dark grey > 0.7. (B) Paleodistribution models of Z. h. luteus and 60 records (stars) of sister taxon Z. h. pallidus. Thresholds for probability of occurrence are >0.70 for all models. Light grey is Z. h. pallidus, dark grey is Z. h. luteus, and medium grey is combined Z. h. luteus + Z. h. pallidus. Fossil records are indicated by a square (Holocene; Plains of San Agustín) and triangles (Wisconsin glaciation Late Pleistocene). 69
 A 70")
78 Figure 3 (a) A 70
 B 71")
79 Figure 3(b) B 71


80 Figure 4 Left panel: A graphical interpolation-based representation of the genetic structure for Zapus hudsonius luteus in the American Southwest. Corners represent geographic coordinates, while surface heights indicate genetic distances between adjacent locations. Peaks (darker) and valleys (lighter) are indicative of areas with high or low (respectively) pair-wise genetic distances between samples over the geographical landscape. Right panel: Median joining network of Z. h. luteus for mitochondrial DNA with respect to sampling localities. Haplotypes are listed in Appendix S1. Individual tick marks represent one polymorphic site (mutation). Dashed lines represent shared haplotypes between localities (no mutation). Localities with multiple haplotypes present have no more than two mutations among haplotypes. Bayesian skyline plot inset Effective population size since 175kyr BP for Z. h. luteus. Time is in units of thousands of years (i.e = 50kyr BP). 72
81 TABLES Table 1 Polymorphism data for the full 1514 bp of concatenated control region (CR) and cytochrome b (cyt b) genes for 49 individual Zapus hudsonius luteus. Data are either partitioned or combined (Total) for analyses. S = polymorphic sites, = total number of mutations, Hap = number of haplotypes, Hd = haplotype diversity, = nucleotide diversity (per site), k = average number of nucleotide differences, n = Theta-W per site from S, g = Theta-W per sequence. Gene Sites S Hap Hd k n g CR cyt b Total 1514* * Plus two insertions in the CR dataset 73
82 Table 2 Coalescent simulations (10,000 replicates) of neutrality tests for 49 individual Zapus hudsonius luteus with complete 1514 bp of concatenated control region and cytochrome b genes (no missing data). Values correspond to calculations based on Theta ( ) and S for the test statistics Tajima's D and Fu's Fs. D Fs S S Observed Statistic Average (P-value) (0.1290) 0.083(0.1190) (0.1310) (0.1570) 95% CI to to to to
83 CHAPTER 2 PHYLOGEOGRAPHY OF THE WESTERN JUMPING MOUSE (ZAPUS PRINCEPS) DETECTS DEEP AND PERSISTENT ALLOPATRY WITH EXPANSION JASON L. MALANEY*, CHRIS J. CONROY, LENA A. MOFFITT, HARMONY D. SPOONHUNTER, JAMES L. PATTON, JOSEPH A. COOK Biology Department and Museum of Southwestern Biology, University of New Mexico, Albuquerque, NM 87131,USA (JLM, LAM, JAC) Biological Sciences, Idaho State University, Pocatello, ID 83209, USA (HDS) Museum of Vertebrate Zoology, University of California, Berkeley, CA 94720, USA (CJC, JLP) 75
84 ABSTRACT Understanding how diversity is partitioned across the landscape provides perspectives on the environmental processes that have influenced the evolutionary history of organisms. We analyzed spatial demography, historical biogeography, and niche divergence of the western jumping mouse (Zapus princeps) using molecular DNA sequences of the mitochondrial cytochrome-b gene and nuclear glucocerebrosidase and myosin heavy chain 2 markers recovered from 7 of the 11 subspecies in western North America. Phylogeographic structure within Z. princeps was partitioned across 5 clades (Boreal, Northern Sierra, Southern Rockies, Southern Sierra, and Uinta). Two lineages detected in the Sierra Nevada's of California (Northern Sierra and Southern Sierra) were more closely allied to Z. trinotatus than to other lineages of Z. princeps and species distribution models mirror these phylogenetic signatures by detecting wide overlap in niches for Sierran jumping mice and Z. trinotatus as compared to other Z. princeps. Four southern lineages are deeply divergent and limited to highly disjunct mesic and montane habitats within the xeric southwestern United States, while the fifth lineage is widespread, extending from Wyoming to Alaska and reflecting expansion northward following deglaciation, a common pattern in boreal mammals. 76
85 INTRODUCTION Western North America has a diverse biota that is the product of complex evolutionary and environmental processes (Lomolino et al. 2006). Significant intraspecific genetic variation in mammals in the region is hypothesized to have been shaped by extreme topographic heterogeneity and repeated glaciations during the Quaternary (Riddle and Hafner 2006). Molecular investigations of western mammals have provided new views of diversification, occasionally revealing unexpected genetic architectures (Alvarez-Castaneda and Patton 2004; Galbreath et al. 2010; Matocq 2002b; Riddle et al. 2000). Documentation of geographic molecular variation in organisms, when combined with assessments of demography, historical biogeography, and niche variation, can provide insight into key questions related to climate change, post-pleistocene colonization, habitat fragmentation, and possible future response to changing environments (Avise 2000). We assess phylogeographic structure in the western jumping mouse (Zapus princeps) to further explore the biogeographic history of western North America. The western jumping mouse is an inhabitant of mesic and montane habitats ranging from New Mexico and central California northward through most of western North America (Fig. 1) to southeast Alaska and southern Yukon Territory (Hafner et al. 1981; Hall 1981; Jones 1981; Krutzsch 1954). Because much of this widespread range was glaciated during the late Quaternary, the patterns and levels of connectivity of the mesic environments they inhabit have changed, potentially leaving an imprint on molecular variation in the species (Hewitt 1996, 2000; Waltari and Guralnick 2009). The dynamic geologic history, variable topography, and patchy mesic environments of western North America provide a series of evolutionary experiments as multiple mountain ranges may represent replicated isolation events. We explore historicalbiogeographic questions related to the effects of Pleistocene fragmentation on mesic-associated biota by testing two primary ideas using molecular variation and niche modeling in jumping 77
86 mice. First, we explore lineage divergence related to glacial cycling by asking whether jumping mice lineages were in wide contact during glaciations or if they remained geographically isolated, similar to their current distribution. Second, given that their contemporary northern range was blanketed by ice until the end of the Pleistocene, we test the scenario that southern lineages of Z. princeps reflect signatures of genetic structure that are deeper (due to persistence) than northern lineage(s) which presumably expanded (ephemeral) from the south following the latest Pleistocene deglaciation. Two mutually exclusive and competing hypotheses, related to lineage divergence and historical biogeography, are plausible. The admixture (AM) scenario, with populations of jumping mice isolated during interglacials on montane islands (e.g., the contemporary condition) but in wide contact during glacial advances, predicts genetic signatures should reflect high levels of exchange. Previous studies in western montane environments have identified different forms and levels of mixing (admixture, introgression, hybridization) in grasshoppers (Knowles 2001), birds (Mettler and Spellman 2009; Spellman and Klicka 2007), pika (Galbreath et al. 2009, 2010), and rodents (Good and Sullivan 2001; Spaeth et al. 2009). Alternatively, jumping mice lineages may have remained independent and evolved in situ due to sustained geographic isolation or persistent allopatry (PA). Evidence for the persistent allopatry scenario would include geographically structured lineages. Signatures of genetic divergence and geographically structured variation in montane organisms have been recorded for alpine stonecrops (DeChaine and Martin 2005b), foxtail pine (Eckert et al. 2008), kittentails (Marlowe and Hufford 2008), alpine butterflies (DeChaine and Martin 2005a), birds (Spellman et al. 2007), and various mammals (Demboski and Cook 2001; Hornsby and Matocq 2011; Sullivan et al. 2000). North American environments have not been static and organisms have presumably tracked climate change (Hewitt 2000), with many species dispersing northward following glacial retreat (Anderson and Borns 1994; Lessa et al. 2003). In Canada and Alaska, northern 78
87 populations of Z. princeps are likely the result of post-pleistocene colonization of deglaciated terrains as observed in other mammals (Arbogast 1999; Conroy and Cook 2000b; Runck and Cook 2005). Southwestern peripheral populations of jumping mice, in contrast, are comparatively more fragmented and largely restricted to dense alder (Alnus spp.), willow (Salix spp.), and aspen (Populus spp.) stands typically associated with riparian systems and high elevation mesic habitats (Frey and Malaney 2009; Hart et al. 2004; Krutzsch 1954; Quimby 1951). Because these habitats are limited in extent and isolated within predominantly xeric environments, populations of montane mesic-associated mammals are hypothesized to exhibit a deeper divergence than their northern counterparts. For example, genetic breaks across arid barriers such as the Columbia and Wyoming Basins (Carstens et al. 2005; Carstens and Richards 2007; DeChaine and Martin 2005b; Nielson et al. 2001) suggest that isolation during warm interglacial periods may contribute to allopatric divergence in mammals (Demboski and Cook 2001; Demboski and Sullivan 2003; Galbreath et al. 2010; Good et al. 2008; Hornsby and Matocq 2011). Persistent allopatric divergence is expected to result in deeper genetic distance and lineage cohesion suggesting limited or no mixing through multiple glacial cycles (DeChaine and Martin 2006; Nielson et al. 2001, 2006). We begin by assessing how past events influenced the phylogenetic signature, demography, and historical biogeography of the western jumping mouse. We test if the phylogenetic signal is the result of admixture (AM) or persistent allopatry (PA) using coalescent simulations. Next, we examine the existing taxonomic framework for Z. princeps, originally based on morphological features (Krutzsch 1954), and then assess environmental variation with species distribution models (SDMs) and test for niche and range overlap among paraphyletic clades. Finally, we propose a set of alternative biogeographic hypotheses based on allopatric modes of speciation that may account for the observed phylogenetic signal. 79
88 METHODS DNA Extraction and Sequencing. We included specimens from the Museum of Southwestern Biology (MSB University of New Mexico Albuquerque), the Museum of Vertebrate Zoology (MVZ University of California Berkley), and the University of Alaska Museum of the North (UAM University of Alaska Fairbanks; Appendix I). Specimens represent 7 of the 11 subspecies (Z. p. idahoensis, Z. p. minor, Z. p. oregonus, Z. p. pacificus, Z. p. princeps, Z. p. saltator, Z. p. utahensis) recognized by Krutzsch (1954) and Hall (1981) and range from southeast Alaska and Yukon Territory southward throughout most western states to the species' southern limits in California and New Mexico (Fig. 1). Detailed information related to voucher specimens is available through the ARCTOS database ( The mitochondrial (mtdna) cytochromeb (cytb 1140bp) gene was obtained for 91 specimens (see Appendix) representing 46 locations across the range of Z. princeps. In addition, samples of Z. trinotatus (4), Z. hudsonius (6), and Napaeozapus insignis (1) were included. Independent perspectives were gained by sequencing two nuclear (nudna) markers to test major lineage breaks identified by mtdna; glucocerebrosidase (GBA 347bp) and myosin heavy chain 2 (MYH2 267bp). Total genomic DNA was extracted from frozen or ethanol preserved tissues (heart or liver). Amplification of the cytb gene was conducted with primers L14724 and H15915 (Irwin et al. 1991) or with a combination of MVZ05-MVZ16 and MVZ127-MVZ108 (Leite and Patton 2002; Smith and Patton 1993) using protocols previously established (Halanych et al. 1999; Lessa and Cook 1998; Patton et al. 2008). PCR products were sequenced using BigDye Terminator Cycle Sequencing Ready Reaction mix. v. 3.1 (Applied Biosystems) with combinations of amplification primers. Heavy and light strands were sequenced in both directions using an Applied Biosystems 3100 automated DNA sequencer in the Molecular Biology Facility, Biology Department, University of New Mexico, Albuquerque, or at the Museum of Vertebrate Zoology, 80
89 University of California, Berkeley. Sequences were analyzed using SEQUENCHER 4.9 (Gene Codes) with a reference sequence from GenBank (Z. trinotatus, AF119262). We sequenced two fragments of nuclear introns (GBA and MYH2) for several specimens using published primers and protocols (Lyons et al. 1997). We sequenced a minimum of 2 randomly selected individuals from mitochondrial clades of Z. princeps (30 GBA and 14 MYH2), Z. trinotatus (2), and Z. hudsonius (2) with 1 Napaeozapus insignis used to root phylogenies. All individuals were sequenced in both directions. Heterozygous positions were identified and polymorphic alleles were assessed using PHASE 2.1 (Stephens and Scheet 2005; Stephens et al. 2001) in DNASP (Librado and Rozas 2009; Rozas et al. 2003) with haplotypes inferred from multi-allelic loci using a Bayesian framework with 0.90 cutoff and 10,000 iterations. Unresolved haplotypes were coded as missing data. Alignments were completed using default parameters and algorithms of CLUSTAL X (Larkin et al. 2007) in the program MEGA 5.05 (Tamura et al. 2011). Contigs for all genes (unphased) are available on GenBank (Appendix). Diversity Measures. Molecular diversity and demographic estimates from each marker were determined for putative Z. princeps (Table 1). Neutrality and population equilibrium were assessed via Tajima s D and Fu s F S tests and 10,000 coalescent simulations to assess significance. The mtdna dataset was partitioned into clades to assess demographic change. Net sequence divergence (d A ) was calculated between the observed mtdna clades (Nei 1987). We calculated segregating sites (S), haplotypes (h), haplotype diversity ( ), and nucleotide diversity ( ) for each marker with DNASP (Librado and Rozas 2009; Rozas et al. 2003). Phylogenetic and Phylogeographic Analyses. Our aligned mitochondrial and nuclear data were processed via MRMODELTEST (Nylander 2004) performing hierarchical likelihood ratio tests (hlrt) and calculating Akaike Information Criterion (AIC); both 81
90 measures agreed for all genes. General Time Reversal (Tavaré 1986) plus gamma (1.6506) plus proportion (0.4875) of invariant sites model (GTR+ log likelihood = , K = 10, AIC = ) was selected as the most appropriate evolutionary model for the mitochondrial marker and subsequently used in Bayesian inference and maximum likelihood analyses. The Kimura (1980) model (K80, log likelihood = , K = 1, AIC = ) was selected for the GBA gene. The Hasegawa, Kishino, and Yano (1985) plus proportion (0.9085) invariant sites model (HKY+I, log likelihood = , K = 5, AIC = ) was identified for the MYH2 gene. Bayesian reconstruction was performed using MRBAYES (Huelsenbeck and Ronquist 2001; Lakner et al. 2008) beginning with random trees and Markov chain sampled every 1000 th tree for 2 million generations and 4 chains run simultaneously with temperature set to 0.20 for 3 chains and 1 cold chain. Three replicate runs were completed to confirm consistency and each marker was run with distinct priors set from MRMODELTEST output. Chain stationarity was assessed by inspecting the standard deviation of split frequencies consistently below 0.05 and confirmed complete via the graphical output from the initial 50,000 generations with 0.20 of each replicate discarded as burn in (Huelsenbeck and Imennov 2002). Nodal strength (posterior probability PP) was identified in the consensus of the residual trees and the midpoint rooted majority rule consensus tree was visualized in FIGTREE ver (Fig. 2). Maximum likelihood (ML) optimality criteria were used for phylogenetic reconstruction using GARLI v2.0 Parallel (Zwickl 2006). We considered all characters as unordered with 4 possible states (A, C, G, T) with heuristic searches. Distinct models of evolution were applied to each marker with discrete base frequencies and rate categories for each from MRMODELTEST. Tree bisection-reconnection (TBR) branch swapping was employed with 100 random stepwise 82
91 additions. Three runs were conducted to ensure consistency and non-parametric bootstrap support (Felsenstein 1985) was evaluated with 1000 pseudo-replicates (Fig. 2). The median joining statistical parsimony algorithm (Bandelt et al. 1999) in the program NETWORK ver. 4.2 (Fluxus engineering, Suffolk, U.K.) was employed to produce a haplotype network (Fig. 3) for each marker given that intraspecific phylogenetic methods may fail (Posada and Crandall 2002). This algorithm calculates the similarity between haplotypes into a network where the combined probability is >95% (Templeton et al. 1992). Taxonomic Evaluation. We compared the morphological taxonomic classification of Z. princeps (Krutzsch 1954) against the mitochondrial framework using the Shimodaira-Hasegawa (1999) test. A maximum-likelihood tree constrained to reflect monophyly of Z. princeps, Z. trinotatus, and Z. hudsonius was compared to the unconstrained best maximum-likelihood tree using PAUP* v.4.0b10 (Swofford 2003), GTR model of nucleotide substitution, and 10,000 resampling of estimated log-likelihoods (RELL) bootstrap replicates (Hasegawa and Kishino 1994). Coalescent Simulations. We conducted coalescent simulations using the parametric bootstrap method (Goldman et al. 2000). Our aim was to test alternative hypotheses of admixture (AM) versus persistent allopatry (PA) using a likelihood based or frequentist approach (Hickerson et al. 2010; Knowles and Maddison 2002) with coalescent simulations in the program MESQUITE (Maddison and Maddison 2009). Alternative hypothesized phylogenies (AM vs. PA) were simulated for 1000 replicates to produce gene matrices using ancestral N E(f) (183,779) from our estimate of the parameter θw (calculated in DNASP), branches scaled to branching pattern, one-year generation time (Brown 1970; Cranford 1983), and ancestral divergence estimates from zapodid fossil records (Hafner 1993; Kurtén and Anderson 1980; Ruez and Bell 2004). To assess 83
92 the validity of each model and determine overlap between models, we used upper and lower confidence intervals (90%) of θw (Knowles and Carstens 2007) on independent runs. From the 1000 gene matrices, we constructed genealogies in PAUP* using heuristic parsimony searches with 10 random addition replicates, TBR branch swapping with max-trees set to 100, and produced a majority-rule consensus tree. Next we calculated the discord between the reconstructed gene tree and the assignment of individuals into separate lineages using Slatkin and Maddison's s (1989) as implimented in MESQUITE. Finally, assessment of our two-tailed test was considered significant if the empirical data occur outside of the 90% CI of the simulation data. Our θ estimates (effective population size scaled to the neutral mutation rate) were calibrated to recent fossil dates using the equation θ = 4N E(f) µ, assuming µ = 3.14 substitutions per million years as calculated by Malaney et al. (2011) and scaled branch widths of θ were used for the competitive hypotheses. Species Distribution Modeling. Climate variables such as temperature and precipitation are known to effect the metabolic rates of jumping mice (Cranford 1975) and can provide insight into the spatial distribution of environmental characteristics for monophyletic lineages. We obtained bioclimatic variables from 2.5 minute (4km) resolution coverages from the WorldClim database (http// Hijmans et al. 2005). Torpor in jumping mice is impacted by elevation (Cranford 1978; Muchlinski and Rybak 1978), so we included this coverage. We followed species distribution modeling (SDM) procedures from previous studies (Waltari and Guralnick 2009; Waltari et al. 2007) by clipping the coverages to the study area (North America) and reducing the dataset (Rissler and Apodaca 2007) to the 12 most biologically meaningful and uncorrelated coverages (Bio1 - Annual Mean Temperature, Bio2 - Mean Diurnal Range, Bio3 - Isothermality, Bio7 - Temperature Annual Range, Bio8 - Mean Temperature of Wettest Quarter, Bio9 - Mean Temperature of Driest Quarter, Bio15 - Precipitation Seasonality, 84
93 Bio16 - Precipitation of Wettest Quarter, Bio17 - Precipitation of Driest Quarter, Bio18 - Precipitation of Warmest Quarter, Bio19 - Precipitation of Coldest Quarter, and elevation). Localities for Z. princeps and Z. trinotatus were downloaded from MANIS (8 Jan 2010). Localities with >0.5km 2 uncertainty were discarded and several records were georeferenced (JLM) using BioGeomancer ( Guralnick et al. 2006). To account for sampling biases (Reddy and Davalos 2003) which may result in model over-fitting and subjective outcome, we spaced localities at least 10km by removing intervening records. To test if the Sierra Nevada lineages reflect phylogenetic signal in niche occupancy, we further partitioned localities of Z. princeps (see below). We constructed SDMs using the default settings in the program MAXENT version 3.3.3a (Elith et al. 2006; Phillips et al. 2006) and ran 20 replicates with randomized 20th percentile training presence and depicted results using the point-wise bootstrap mean. To identify overlap between taxonomic divisions and establish whether Sierra Nevada clades occupy analogous environments to Z. trinotatus or other Z. princeps, we completed a series of niche tests. Localities were partitioned into three groups reflecting DNA phylogenetic signal: Z. trinotatus, Sierran (Southern and Northern Sierra) clades, and remaining Z. princeps (Boreal, Southern Rockies, Uinta) clades. First, we calculated the proportion of pixels (km 2 ) where overlap between suitable niches occur using ARCGIS v Threshold values were determined from the conservative last sample included criterion and were 0.21 for Z. princeps, 0.24 for Z. trinotatus, and 0.28 for Sierran. Quantifying niche overlap was accomplished with three metrics using ENMTOOLS (Warren et al. 2010); Schoener's D (Schoener 1968), Warren's I (Warren et al. 2008), and relative ranks (RR; Warren and Seifert 2011). Each measure identifies pair-wise niche overlap values between 0 (none) and 1 (full). We calculated 100 pseudoreplicates of niche models (Warren et al. 2008, 2010) and corresponding measures of niche overlap among lineages following methods of Pyron and Burbrink (2009). This conforms to a 85
94 one-tailed test to identify if niche models are significantly different from a null distribution by randomly assigning lineage membership to the occurrence points for any two lineages. All SDMs have basic assumptions including niche conservatism (Wiens and Graham 2005), whether coverages (environmental data) are adequate to generate predictions of a species distribution (Kozak et al. 2008; McCormack et al. 2010), and adequate occurrence points to encapsulate the range of environmental conditions in the species niche (Pearson et al. 2007). 86
95 RESULTS Molecular Diversity. The cytb gene was obtained for 91 Z. princeps specimens, 4 Z. trinotatus, 6 Z. hudsonius, and 1 Napaeozapus insignis (Appendix). Excluding N. insignis, there were 157 segregating sites (Table 1). Nucleotide composition (28.4% adenine, 32.0% thymine, 26.9% cytosine, and 12.7% guanine), transition:transversion ratio (R = 4.73), and codon position changes (6-1 st position, 0-2 nd position, 39-3 rd position) among Zapus lineages were consistent with other measures of genuine cytb gene for mammals (Irwin et al. 1991). Twenty-seven (GBA) and 20 (MYH2) randomly selected individuals of Z. princeps from the 5 mitochondrial clades were sequenced for the nuclear introns (Lyons et al. 1997) plus 2 Z. hudsonius, 2 Z. trinotatus, and 1 N. insignis. For the GBA marker nucleotide composition was 21.6% adenine, 24.1% thymine, 28.3% cytosine, and 26.0% guanine. There were 22 segregating sites, 1 site with more than 2 variants, transition:transversion ratio of 2.26, plus an 2 bp insertiondeletion between Zapus - Napaeozapus. The MYH2 marker had 20.3% adenine, 25.2% thymine, 28.1% cytosine, and 26.4% guanine, 16 segregating and 2 multi-variant sites. Transition:transversion ratio was 2.11 with 9 positions represented by insertion-deletions. Phylogenetic and Phylogeographic Divergence. Phylogenetic reconstructions using maximum likelihood (ML) and Bayesian (PP) techniques and the parsimony network indicated congruent topologies (Fig. 2 & 3) for all genes. Seven clades were recovered including discrete Z. trinotatus and Z. hudsonius, plus 5 putative Z. princeps clades (Boreal, Northern Sierra, Southern Rockies, Southern Sierra, Uinta; Fig. 2 & 3). Each of the 7 clades identified in the phylogram (Fig. 2) reflect high bootstrap support (ML) and posterior probabilities (PP) for major nodes. Both of the nuclear perspectives reflect deep nodes but provided less resolution near the tips. Current taxonomy of Z. princeps (Holden and Musser 2005) showed a polyphyletic relationship with respect to Z. trinotatus based on both the mitochondrial and nuclear data, with 87
96 Northern and Southern Sierra clades more closely related to Z. trinotatus than to other Z. princeps (Boreal, Southern Rockies, Uinta; Fig. 2 & 3). There were 42 unique cytb haplotypes in our dataset (Hd = 0.993; Fig. 3) with 14 haplotypes representing the Boreal clade, 5 in the Northern Sierra, 7 in the Southern Rockies, 5 in the Southern Sierra, 3 in the Uinta, and 3 in Z. trinotatus. Five other haplotypes including 4 in Z. hudsonius and 1 in N. insignis were identified (haplotypes not displayed in Fig. 3). No widespread haplotype sharing was documented (Fig. 2 & 3) but a few haplotypes were shared between adjacent sampling localities within clades. Further, no haplotypes were co-located at a single locality from distinct clades. Several polymorphic sites define each lineage of jumping mice, with highest geographic structure across the 4 southern lineages (Northern Sierra, Southern Rockies, Southern Sierra, Uinta; Fig. 3). For example, >100 steps separated the Uinta from the Southern Rockies and Boreal clades, while at least 47 steps segregated haplotypes of the Boreal and Southern Sierra clades. The Northern Sierra clade and Z. trinotatus are segregated by <60 mutational steps. Between Z. princeps (Uinta) and Z. trinotatus there are 136 steps, while there are at least 147 mutational steps between Z. trinotatus and Z. hudsonius. Almost 300 mutational steps separated Z. hudsonius (haplotype 2; Z. h. luteus) and the Uinta Z. princeps (haplotype 51). Haplotype structure for the independent nuclear genes was less pronounced (fewer segregating sites) but consistent with the mtdna signature. Neutrality tests for mitochondrial lineages (Tajima s D and Fu s Fs; Table 1) for the Boreal and Southern Sierra clades were significantly negative, suggesting deviation from mutation-drift equilibrium and may suggest population expansion (Excoffier et al. 2009). Neutrality tests for the Southern Rockies clade was not significant and small sample sizes from the Northern Sierra and Uinta clades precluded population-level analyses. 88
97 Intra-clade Diversity. Patterns of intra-clade genetic diversity differed across clades (Table 1). Within the Boreal and Southern Sierra clades, haplotypes showed a star like phylogeny (Fig. 2 & 3) with relatively few mutational steps between haplotypes than other clades. In contrast, the Southern Rockies clade showed higher structure and a greater number of mutational steps between haplotypes. For example, within the Southern Rockies there were 16 steps separating haplotype 16 (Jackson Co., Colorado) and haplotype 21 (Santa Fe Co., New Mexico) over a geographic distance of 500 km. In the Boreal clade there were only 8 steps between haplotypes 11 (Yellowstone National Park) and 4 (Unuk River, Alaska) over a geographic distance of >2000 km (Fig. 3). The Uinta clade was represented by 4 specimens from the same locality (Strawberry Reservoir) and 3 unique haplotypes with 5 mutations. The 5 haplotypes from the Northern Sierra clade were distributed among 3 localities segregated by 4 mutational steps over 250 km. The Southern Sierra clade was represented by 11 unique sampling localities and 5 haplotypes within 200 km. Taxonomic Evaluation and Coalescent Simulations. A tree constrained for monophyly of Z. princeps was significantly worse (P < 0.001) than the unconstrained maximum likelihood topology that showed paraphyly of these lineages (ML best = ; ML constraints = ; Shimodaira and Hasegawa 1999). Results of the parametric bootstrap test of alternative hypotheses confirmed the persistent allopatry (PA) hypothesis as the best match to the empirical data (Fig. 4). The empirical data had an s value of 13 that was significantly different (2-tailed) from the admixture (AD) hypothesis. Species Distribution Models. Modeling procedures had high AUC scores (>0.95 for each model). Models were based from 170 Z. trinotatus and 499 putative Z. princeps localities; of these, 66 Sierra Nevada localities (Z. p. pacificus) were partitioned from other Z. princeps lineages. Niche overlap and range overlap (threshold value >0.20) was higher for the Sierran jumping mice and Z. trinotatus than the Sierran jumping mice and other Z. princeps (Fig. 5). All 89
98 pair-wise comparisons using pseudo-replicates reflected values significantly different than predicated from random among lineages. 90
99 DISCUSSION We documented a history of demographic and range expansion for the Boreal clade that contrasts with long-term persistent southern clades (Northern Sierra, Southern Rockies, Southern Sierra, Uinta). This spatial and temporal contrast reflects distinctive demographic processes across the distribution of jumping mice of the west. The phylogeny and wide niche overlap between Sierran jumping mice and Z. trinotatus are inconsistent with current taxonomy that identifies the former as Z. princeps (Hall 1981; Holden and Musser 2005; Krutzsch 1954). Finally, the coalescent-based tests provide clarity on the historical biogeography of jumping mice over multiple glacial cycles. Spatial Demography. For species with broad latitudinal distributions in North America, a common pattern of deep southern (persistent) and shallow northern (ephemeral) structure has been documented. This signature is common to other rodents with similar latitudinal range such as Z. hudsonius (King et al. 2006), red-backed voles, Myodes gapperi (Runck and Cook 2005), long-tailed voles, Microtus longicaudus (Conroy and Cook 2000a), deer mice, Peromyscus maniculatus (Dragoo et al. 2006), woodrats, Neotoma cinerea (Hornsby and Matocq 2011), chipmunks, Tamias amoenus and T. ruficaudus (Demboski and Sullivan 2003; Good et al. 2003, 2008; Good and Sullivan 2001), red squirrels, Tamiasciurus hudsonicus, (Arbogast et al. 2001; Wilson et al. 2005), and flying squirrels, Glaucomys sabrinus and G. volans (Arbogast 1999). Similarly soricomorphs, such as Sorex cinereus, S. monticolus, and S. palustris (Demboski and Cook 2001, 2003; Himes and Kenagy 2010) and lagomorphs (e.g., Ochotona princeps; Galbreath et al. 2009, 2010) also show this latitudinal signature suggesting a common set of processes has influenced diversification across these montane organisms. Characteristic signatures of population expansion following glacial retreat (Excoffier et al. 2009; Hewitt 2004, Lessa et al. 2003, 2010) include minimal haplotype sorting, low nucleotide 91
100 diversity, lack of equilibrium between mutation-drift and migration-drift, and star-like phylogeny which were detected for the Boreal clade of jumping mice. Specific results of tests of neutrality (Table 1) are suggestive of demographic instability since the Last Glacial Maximum (LGM). Ancestors of the Boreal clade likely expanded northward in the Holocene due to glacial retreat (Graham et al. 1996; McGill et al. 2005) and in this case, a few closely related haplotypes typify populations ranging from Wyoming (Yellowstone National Park) northward to south-coastal Alaska (Fig. 3), probably the most recently colonized region. At that northern limit, populations separated by 100 km share haplotypes. Post-Pleistocene glacial retreat and the signature of genetic expansion (Table 1) suggest smaller ancestral population size. Ancestral populations were likely restricted to refugia as documented for other mammals (Sommer and Zachos 2009; Waltari et al. 2007). The newly formed populations at higher latitudes in Canada and southeast Alaska potentially originated from a source refugium in the south, as reflected by minimal differentiation of haplotypes among populations that span this large area. With the warming climate and retreating glaciers, jumping mice populations likely closely tracked newly available habitats (Hewitt 2004). There is no signal of an isolated refugium in southeast Alaska as proposed by Jones (1981) for jumping mice and hypothesized for other mammals (Cook et al. 2006). We documented prolonged isolation (Arenas et al. 2012) for the southern clades which reflect expected patterns of complete haplotype sorting, deep genetic divergence across the landscape (Fig. 3), high nucleotide and haplotype diversity, and, in general, mutation-drift and migration-drift equilibrium (except Southern Sierra, Table 1). The Southern Sierra clade, however, reflects a significant departure from neutrality suggestive of a smaller ancestral population (e.g. bottle-neck) and a more complex history than our simple hypotheses (ephemeral vs. persistent). Genetic footprints of population expansion documented for the Boreal and Southern Sierra clades are likely due to different mechanisms (e.g., latitudinal expansion versus 92
101 elevational expansion), but this comparison will require more detailed analyses of paleoenvironments and expanded sampling. Elevation fluctuations and concordant genetic signatures have been documented for alpine plants, pika, and woodrats (Beever et al. 2010; DeChaine and Martin 2005b; Galbreath et al. 2009, 2010; Matocq 2002b) accross western North America. However, the magnitude of range shifts may differ for species living in montane (elevational shifts) versus more homogeneous environments (latitudinal shifts; Guralnick 2007) and these alternative signatures should be explored further (Rubidge et al. 2012, Parmesan 2006). Shifts in elevation and latitude are projected to correspond to changing temperatures (Parmesan 2006; Petit et al. 2008; Walther et al. 2002) and several species in the Sierras have declined over the last century including jumping mice (Moritz et al. 2008). Other species have shown recent extirpations such as alpine pika (Beever et al. 2010, Galbreath et al. 2009, 2010) with declines also common elsewhere (Albach et al. 2006; DeChaine and Martin 2005a; Haubrich and Schmitt 2007; Knowles and Richards 2005) including jumping mice (Frey and Malaney, 2009). Niche Overlap. The Sierran jumping mice and Z. trinotatus overlap in niche space more than either does with other lineages of Z. princeps (Fig. 5). This overlap may mirror their close evolutionary relationship (Fig. 2); however, overlap may simply reflect the spatial proximity and ecological similarity of the two regions. Still, there is significantly more niche divergence between lineages than expected by chance based on pseudo-replicates of background niche space. Because organisms can shift niche preferences through time (Hadly et al. 2009; Peterson 2011), the roles of niche conservatism (Warren et al. 2008; Wiens 2004; Wiens and Graham 2005) or niche divergence (Raxworthy et al. 2007; Rissler and Apodaca 2007) in speciation warrants further exploration. Both have been shown to operate at various temporal and spatial scales in Mexican Jays (genus Aphelocoma; McCormack et al. 2010), common kingsnakes (Lampropeltis getula; Pryon and Burbrink 2009), and deer mice (Peromyscus maniculatus; Kalkvik et al. 2011). Jumping mice are presumed to have diverged in allopatry based on 93
102 coalescent simulations (see below, Fig. 4) with both niche conservatism and divergent selection playing roles in the evolution of western jumping mice. Taxonomic Implications. Western jumping mice represent a more complex taxonomic assemblage than previously documented. Deep molecular divergence discovered among southern populations of the western jumping mouse, including paraphyly with respect to Z. trinotatus, significantly alters our understanding of species limits in this group (Hall 1981; Holden and Musser 2005; Krutzsch 1954). Hall (1981) recognized 11 subspecies of Z. princeps and 4 subspecies of Z. trinotatus following Krutzsch s (1954) extensive review of morphological characters. Our molecular and niche assessment suggests that the initial alignment of the Sierra Nevada populations (Elliot 1898; Howell 1920; Preble 1899) close to Z. trinotatus is appropriate. Gene trees based on mtdna may not always reflect species limits due to historical mitochondrial introgression (Good et al. 2008; Runck et al. 2009), but in this case, the independent nuclear perspectives corroborate mtdna and demonstrate the need for revision of species limits in western jumping mice. A comprehensive re-evaluation of morphological variation across nominal Z. princeps and Z. trinotatus coupled with development of additional nuclear markers and exploration of finer scale niche variation might provide clarity on the spatiotemporal aspects of diversification. Historical-biogeographic Patterns. Phylogeographic structure in the Sierran jumping mice appears to reflect long-term sustained faunal isolation, north-south division of lineages, and elevational shifts with warming climates (Moritz et al. 2008). Other vertebrates in the Sierra Nevada's also show a pronounced north-south split such as wood rats (Matocq 2002a, 2002b; Matocq and Murphy 2007; Matocq et al. 2007), salamanders, and newts (Tan and Wake 1995; Wake 1997). A concordant signature among several species may reflect the influence of glaciers and pluvial lakes formed during the Pleistocene that impeded gene-flow (Gillespie and Zehfuss 2004; James et al. 2002). Further evaluation of shifts in elevation through glacial cycles, in 94
103 combination with comparative assessments of temporal and spatial congruence in lineage diversification across co-distributed taxa, is needed for the region. In general, Southern clades of Z. princeps demonstrate strong phylogeographic structure that reflects long periods of isolation without mixing of lineages. There were no haplotypes shared among geographic regions (Fig. 3) with molecular signatures (Table 1) indicative of longterm segregation during the LGM in a series of isolated refugial areas across western North America. Coalescent simulations reject an admixture hypothesis but not the persistent allopatric hypothesis (Fig. 4). Jumping mice lineages exhibit higher levels of mtdna divergence than documented for many other sister-species comparisons in mammals (Baker and Bradley 2006). Further, segregation may have persisted over multiple glacial cycles. Multi-locus data, coupled with fossil calibration and relaxed molecular clocks (Drummond et al. 2006; Heled and Drummond 2010), have been used to establish initial isolation events in birds and mammals in western North America (McCormack et al. 2011; Reid et al. 2011). Independent lines of evidence suggest there is a common process of allopatric divergence, with historical vicariance via intervening xeric environments, responsible for phylogeographic signatures in DNA and niches among co-distributed taxa (Arbogast and Kenagy 2001; Carstens et al. 2005; Sullivan et al. 2000; Zink 2002). Implications of a common signature suggest shared biogeographic processes (Gutierrez-Garcia and Vazquez-Dominguez 2011; Ronquist and Sanmartin 2011) at the community level. Thus, projected climate change and potential shifts in distribution may have more profound (community level) effects that previously considered (Ackerly et al. 2010; Moritz et al. 2008; Thomas et al. 2004). In conclusion, deep molecular divergence within Z. princeps is accentuated over the southern portion of its current distribution. The wide latitudinal range of Z. princeps provides future opportunities to test hypotheses of incipient speciation using multi-locus models and coalescent techniques (Carstens et al. 2005; Lessa et al. 2003). Refinement of the persistent 95
104 allopatric hypothesis includes testing among vicariant speciation models but serves as a working hypothesis to explore concerted signatures among co-distributed species. These preliminary data suggest geographic separation between southern lineages has been a dominant and persistent force shaping divergence within Z. princeps and presumably sympatric mammals. Whether these vicariant signatures are suggestive of a common process that is spatially and temporally shared across co-distributed mammals, versus simply idiosyncratic responses to fluctuating climate, should be explored. 96
105 ACKNOWLEDGMENTS The following institutions provided specimens: University of Alaska Museum of the North, Fairbanks (UAM); Museum of Southwestern Biology, University of New Mexico, Albuquerque (MSB); Museum of Vertebrate Zoology, University of California, Berkley (MVZ). Several analyses were completed with the University of Alaska, Fairbanks Life Science Informatics facility ( We thank J. Dragoo, F. Torrez- Perez, and B. Truett for assistance with lab work, Eric Waltari for Excel macro development to down sample records, members of the CUERVO molecular lab and S. O. MacDonald for thoughtful discussions, and the associate editor Samantha Wisely plus two reviewers for critical suggestions on a previous version of this manuscript. The project was partially based on support and specimens from the Grinnell Resurvey Project (Yosemite Fund, National Geographic Society Grant , and NSF DEB ), ISLES (USDA Forest Service), and the Beringian Coevolution Project (NSF ). 97
106 LITERATURE CITED ACKERLY, D. D., ET AL The geography of climate change: implications for conservation biogeography, Diversity and Distributions 16: ALBACH, D. C., P. SCHONSWETTER, AND A. TRIBSCH Comparative phylogeography of the Veronica alpina complex in Europe and North America, Molecular Ecology 15: ALVAREZ-CASTANEDA, S. T., AND J. L. PATTON Geographic genetic architecture of pocket gopher (Thomomys bottae) populations in Baja California, Mexico, Molecular Ecology 13: ANDERSON, B. G., AND H. W. BORNS The Ice Age World: An introduction to quaternary history and research with emphasis on North America and northern Europe during the last 2.5 million years. Scandinavian University Press, Oslo. ARBOGAST, B. S Mitochondrial DNA phylogeography of the new world flying squirrels (Glaucomys): Implications for pleistocene biogeography, Journal of Mammalogy 80: ARBOGAST, B. S., R. A. BROWNE, AND P. D. WEIGL Evolutionary genetics and Pleistocene biogeography of North American tree squirrels (Tamiasciurus), Journal of Mammalogy 82: ARBOGAST, B. S., AND G. J. KENAGY Comparative phylogeography as an integrative approach to historical biogeography, Journal of Biogeography 28:
107 ARENAS, M., N. RAY, M. CURRAT, AND L. EXCOFFIER Consequences of range contractions and range shifts on molecular diversity, Molecular Biology and Evolution. AVISE, J. C Phylogeography. The history and formation of species. Harvard University Press, Cambridge, Massachusetts. BAKER, R. J., AND R. D. BRADLEY Speciation in mammals and the genetic species concept, Journal of Mammalogy 87: BANDELT, H. J., P. FORSTER, AND A. ROHL Median-joining networks for inferring intraspecific phylogenies, Molecular Biology and Evolution 16: BEEVER, E. A., C. RAY, P. W. MOTE, and J. L. WILKENING Testing alternative models of climate-mediated extirpations, Ecological Applications 20: BROWN, L. N Population dynamics of western jumping mouse (Zapus princeps) during a 4-year study, Journal of Mammalogy 51: CARSTENS, B. C., S. J. BRUNSFELD, J. R. DEMBOSKI, J. M. GOOD, AND J. SULLIVAN Investigating the evolutionary history of the Pacific Northwest mesic forest ecosystem: Hypothesis testing within a comparative phylogeographic framework, Evolution 59: CARSTENS, B. C., AND C. L. RICHARDS Integrating coalescent and ecological niche modeling in comparative phylogeography, Evolution 61: CONROY, C. J., AND J. A. COOK. 2000a. Molecular systematics of a holarctic rodent (Microtus : Muridae), Journal of Mammalogy 81:
108 CONROY, C. J., AND J. A. COOK. 2000b. Phylogeography of a post-glacialcolonizer: Microtus longicaudus (Rodentia : Muridae), Molecular Ecology 9: COOK, J. A., N. G. DAWSON, AND S. O. MACDONALD Conservation of highly fragmented systems: The north temperate Alexander Archipelago, Biological Conservation 133:1-15. CRANFORD, J. A Life-history strategy of Western Jumping Mouse (Zapus princeps), American Zoologist 15: CRANFORD, J. A Hibernation in western jumping mouse (Zapus princeps), Journal of Mammalogy 59: CRANFORD, J. A Ecological strategies of a small hibernator, the western jumping mouse Zapus princeps, Canadian Journal of Zoology 97: DECHAINE, E. G., AND A. P. MARTIN. 2005a. Historical biogeography of two alpine butterflies in the Rocky Mountains: broad-scale concordance and local-scale discordance, Journal of Biogeography 32: DECHAINE, E. G., AND A. P. MARTIN. 2005b. Marked genetic divergence among sky island populations of Sedum lanceolatum (Crassulaceae) in the Rocky Mountains, American Journal of Botany 92: DECHAINE, E. G., AND A. P. MARTIN Using coalescent simulations to test the impact of quaternary climate cycles on divergence in an alpine plant-insect association, Evolution 60:
109 DEMBOSKI, J. R., AND J. A. COOK Phylogeography of the dusky shrew, Sorex monticolus (Insectivora, Soricidae): insight into deep and shallow history in northwestern North America, Molecular Ecology 10: DEMBOSKI, J. R., AND J. A. COOK Phylogenetic diversification within the Sorex cinereus group (Soricidae), Journal of Mammalogy 84: DEMBOSKI, J. R., AND J. SULLIVAN Extensive mtdna variation within the yellowpine chipmunk, Tamias amoenus (Rodentia : Sciuridae), and phylogeographic inferences for northwest North America, Molecular Phylogenetics and Evolution 26: DRAGOO, J. W., J. A. LACKEY, K. E. MOORE, E. P. LESSA, J. A. COOK, AND T. L. YATES Phylogeography of the deer mouse (Peromyscus maniculatus) provides a predictive framework for research on hantaviruses, Journal of General Virology 87: DRUMMOND, A. J., S. Y. W. HO, M. J. PHILLIPS, AND A. RAMBAUT Relaxed phylogenetics and dating with confidence, Plos Biology 4: ECKERT, A. J., B. R. TEARSE, AND B. D. HALL A phylogeographical analysis of the range disjunction for foxtail pine (Pinus balfouriana, Pinaceae): the role of Pleistocene glaciation, Molecular Ecology 17: ELITH, J., ET AL Novel methods improve prediction of species' distributions from occurrence data, Ecography 29:
110 ELLIOT, D. G Lists of species of mammals principally rodents obtained by W. W. Price, Dr. S. E. Meek, G. R. Cherrie, and E. S. Thompson in the states of Iowa, Wyoming, Montana, Idaho, Nevada, and California with descriptions of new species, Field Columbian Museum Publication 27: EXCOFFIER, L., M. FOLL, AND R. J. PETIT Genetic consequences of range expansions, Annual Review of Ecology Evolution and Systematics 40: FELSENSTEIN, J Confidence-limits on phylogenies - an approach using the bootstrap, Evolution 39: FREY, J. K., AND J. L. MALANEY Decline of the meadow jumping mouse (Zapus hudsonius luteus) in two mountain ranges in New Mexico, Southwestern Naturalist 54: GALBREATH, K. E., D. J. HAFNER, AND K. R. ZAMUDIO When cold is better: climate-driven elevation shitfs yield complex patterns of diversification and demography in an alpine specialist (American pika, Ochotona princeps), Evolution 63: GALBREATH, K. E., D. J. HAFNER, K. R. ZAMUDIO, AND K. AGNEW Isolation and introgression in the Intermountain West: contrasting gene genealogies reveal the complex biogeographic history of the American pika (Ochotona princeps), Journal of Biogeography 37:
111 GILLESPIE, A. R., AND P. H. ZEHFUSS Glaciations of the Sierra Nevada, California, USA, In: J. Ehlers and P.L. Gibbard, Eds., Developments in Quaternary Sciences, Elsevier, V. 2, Part B, Pages GOLDMAN, N., J. P. ANDERSON, AND A. G. RODRIGO Likelihood-based tests of topologies in phylogenetics, Systematic Biology 49: GOOD, J. M., J. R. DEMBOSKI, D. W. NAGORSEN, AND J. SULLIVAN Phylogeography and introgressive hybridization: Chipmunks (genus Tamias) in the northern Rocky Mountains, Evolution 57: GOOD, J. M., ET AL Ancient hybridization and mitochondrial capture between two species of chipmunks, Molecular Ecology 17: GOOD, J. M., AND J. SULLIVAN Phylogeography of the red-tailed chipmunk (Tamias ruficaudus), a northern Rocky Mountain endemic, Molecular Ecology 10: GRAHAM, R. W., ET AL Spatial response of mammals to late quaternary environmental fluctuations, Science 272: GURALNICK, R. P., J. WIECZOREK, R. BEAMAN, R. J. HIJMANS, AND BIOGEOMANCER WORKING GROUP BioGeomancer: Automated georeferencing to map the world's biodiversity data, Plos Biology 4: GURALNICK, R Differential effects of past climate warming on mountain and flatland species distributions: a multispecies North American mammal assessment, Global Ecology and Biogeography 16:
112 GUTIERREZ-GARCIA, T., AND E. VAZQUEZ-DOMINGUEZ Comparative phylogeography: Designing studies while surviving the process, Bioscience 61: HADLY, E. A., P. A. SPAETH, AND C. LI Niche conservatism above the species level, Proceedings of the National Academy of Sciences of the United States of America 106: HAFNER, D. J Reinterpretation of the Wisconsinan mammalian fauna and paleoenvironment of the Edwards Plateau, Texas, Journal of Mammalogy 74: HAFNER, D. J., K. E. PETERSEN, AND T. L. YATES Evolutionary relationships of jumping mice (Genus Zapus) of the southwestern United States, Journal of Mammalogy 62: HALANYCH, K. M., J. R. DEMBOSKI, B. J. VAN VUUREN, D. R. KLEIN, and J. A. COOK Cytochrome b phylogeny of North American hares and jackrabbits (Lepus, Lagomorpha) and the effects of saturation in outgroup taxa, Molecular Phylogenetics and Evolution 11: HALL, E. R The mammals of North America. Vol. 2, 2nd ed. John Wiley & Sons, New York, New York. HART, E. B., M. C. BELK, E. JORDAN, AND M. W. GONZALEZ Zapus princeps, Mammalian Species 749:
113 HASEGAWA, M., AND H. KISHINO Accuracies of the simple methods for estimating the bootstrap probability of a maximum-likelihood tree, Molecular Ecology 1: HASEGAWA, M., H. KISHINO, AND T. YANO Dating of human-ape splitting by a molecular clock of mitochondrial DNA, Journal of Molecular Evolution 22: HAUBRICH, K., AND T. SCHMITT Cryptic differentiation in alpine-endemic, highaltitude butterflies reveals down-slope glacial refugia, Molecular Ecology 16: HELED, J., AND A. J. DRUMMOND Bayesian inference of species trees from multilocus data, Molecular Biology and Evolution 27: HEWITT, G The genetic legacy of the Quaternary ice ages, Nature 405: HEWITT, G. M Some genetic consequences of ice ages, and their role in divergence and speciation, Biological Journal of the Linnean Society 58: HEWITT, G. M Genetic consequences of climatic oscillations in the Quaternary, Philosophical Transactions of the Royal Society of London Series B-Biological Sciences 359: HICKERSON, M. J., ET AL Phylogeography's past, present, and future: 10 years after Avise, 2000, Molecular Phylogenetics and Evolution 54:
114 HIJMANS, R. J., S. E. CAMERON, J. L. PARRA, P. G. JONES, AND A. JARVIS Very high resolution interpolated climate surfaces for global land areas, International Journal of Climatology 25: HIMES, C. M., AND G. J. KENAGY Influence of montane isolation and refugia on population structure of Sorex palustris in western North America, Journal of Mammalogy 91: HOLDEN, M. E., AND G. G. MUSSER Family Dipodidae, Pp in Mammal Species of the World (D. E. Wilson and D. M. Reeder, eds.). The Johns Hopkins University Press, Baltimore, Maryland. HORNSBY, A. D., and M. D. MATOCQ Differential regional response of the bushytailed woodrat (Neotoma cinerea) to late Quaternary climate change, Journal of Biogeography 38:1-17. HOWELL, A. B A study of the California jumping mice of the genus Zapus, University of California Publications in Zoology 21: HUELSENBECK, J. P., AND N. S. IMENNOV Geographic origin of human mitochondrial DNA: Accommodating phylogenetic uncertainty and model comparison, Systematic Biology 51: HUELSENBECK, J. P., AND F. RONQUIST MRBAYES: Bayesian inference of phylogenetic trees, Bioinformatics 17: IRWIN, D. M., T. D. KOCHER, AND A. C. WILSON Evolution of the cytochrome b gene of mammals, Journal of Molecular Evolution 32:
115 JAMES, L. A., ET AL Late Pleistocene glaciations in the northwestern Sierra Nevada, California. Quaternary Research 57: JONES, G. S The systematics and biology of the genus Zapus (Mammalia, Rodentia, Zapodidae). PhD, Indiana State University, Terre Haute, Indiana. KALKVIK, H. M., I. J. STOUT, T. J. DOONAN, AND C. L. PARKINSON Investigation niche and lineage diversification in widely distributed taxa: phylogeography and ecological niche modeling of the Peromyscus maniculatus species group, Ecography 34:1-11. KIMURA, M A simple method for estimating evolutionary rates of base substitutions through comparative studies of nucleotide sequences, Journal of Molecular Evolution 16: KING, T. L., ET AL Comprehensive genetic analyses reveal evolutionary distinction of a mouse (Zapus hudsonius preblei) proposed for delisting from the US Endangered Species Act, Molecular Ecology 15: KNOWLES, L. L Genealogical portraits of speciation in montane grasshoppers (genus Melanoplus) from the sky islands of the Rocky Mountains, Proceedings of the Royal Society of London Series B-Biological Sciences 268: KNOWLES, L. L., AND B. C. CARSTENS Estimating a geographically explicit model of population divergence, Evolution 61: KNOWLES, L. L., AND W. P. MADDISON Statistical phylogeography, Molecular Ecology 11:
116 KNOWLES, L. L., AND C. L. RICHARDS Importance of genetic drift during Pleistocene divergence as revealed by analyses of genomic variation, Molecular Ecology 14: KOZAK, K. H., C. H. GRAHAM, AND J. J. WIENS Integrating GIS-based environmental data into evolutionary biology, Trends in Ecology & Evolution 23: KRUTZSCH, P. H North American jumping mice (genus Zapus), University of Kansas Publications, Museum of Natural History 7: KURTÉN, B., AND E. ANDERSON Pleistocene Mammals of North America. Columbia University Press, New York. LAKNER, C., P. VAN DER MARK, J. P. HUELSENBECK, B. LARGET, AND F. RONQUIST Efficiency of Markov chain Monte Carlo tree proposals in Bayesian phylogenetics, Systematic Biology 57: LARKIN, M. A., ET AL Clustal W and clustal X version 2.0, Bioinformatics 23: LEITE, Y. L. R., AND J. L. PATTON Evolution of South American spiny rats (Rodentia, Echimyidae): the star-phylogeny hypothesis revisited, Molecular Phylogenetics and Evolution 25: LESSA, E. P., AND J. A. COOK The molecular phylogenetics of tuco-tucos (genus Ctenomys, Rodentia : Octodontidae) suggests an early burst of speciation, Molecular Phylogenetics and Evolution 9:
117 LESSA, E. P., J. A. COOK, AND J. L. PATTON Genetic footprints of demographic expansion in North America, but not Amazonia, during the Late Quaternary, Proceedings of the National Academy of Sciences of the United States of America 100: LESSA, E. P., G. D'ELIA, AND U. F. J. PARDINAS Genetic footprints of late Quaternary climate change in the diversity of Patagonian-Fueguian rodents, Molecular Ecology 19: LIBRADO, P., AND J. ROZAS DnaSP v5: a software for comprehensive analysis of DNA polymorphism data, Bioinformatics 25: LOMOLINO, M. V., B. R. RIDDLE, AND J. H. BROWN Biogeography, 3rd ed. Sinauer Associates, Sunderland, Massachusetts. LYONS, L. A., T. F. LAUGHLIN, N. G. COPELAND, N. A. JENKINS, J. E. WOMACK, AND S. J. OBRIEN Comparative anchor tagged sequences (CATS) for integrative mapping of mammalian genomes, Nature Genetics 15: MADDISON, W. P., AND D. R. MADDISON MESQUITE: a modular system for evolutionary analysis. MALANEY, J. L., J. K. FREY, AND J. A. COOK The biogeographic legacy of an imperilled taxon provides a foundation for assessing lineage diversification, demography, and conservation genetics, Diversity and Distributions doi: /j x. 109
118 MARLOWE, K., AND L. HUFFORD Evolution of Synthyris sect. Dissecta (Plantaginaceae) on sky islands in the Northern Rocky Mountains, American Journal of Botany 95: MATOCQ, M. D. 2002a. Morphological and molecular analysis of a contact zone in the Neotoma fuscipes species complex, Journal of Mammalogy 83: MATOCQ, M. D. 2002b. Phylogeographical structure and regional history of the duskyfooted woodrat, Neotoma fuscipes, Molecular Ecology 11: MATOCQ, M. D., and P. J. MURPHY Fine-scale phenotypic change across a species transition zone in the genus Neotoma: Disentangling independent evolution from phylogenetic history, Evolution 61: MATOCQ, M. D., Q. R. SHURTLIFF, AND C. R. FELDMAN Phylogenetics of the woodrat genus Neotoma (Rodentia : Muridae): Implications for the evolution of phenotypic variation in male external genitalia, Molecular Phylogenetics and Evolution 42: MCCORMACK, J. E., J. HELED, K. S. DELANEY, A. T. PETERSON, AND L. L. KNOWLES Calibrating divergenece times on species trees versus gene trees: Implications for speciation history of Aphelocoma jays, Evolution 65: MCCORMACK, J. E., A. J. ZELLMER, AND L. L. KNOWLES Does niche divergence accompany allopatric divergence in Aphelocoma jays as predicted under ecological speciation?: Insights from tests with niche models, Evolution 64:
119 MCGILL, B. J., E. A. HADLY, AND B. A. MAURER Community inertia of quaternary small mammal assemblages in North America, Proceedings of the National Academy of Sciences of the United States of America 102: METTLER, R. D., and G. M. SPELLMAN A hybrid zone revisited: molecular and morphological analysis of the maintenance, movement, and evolution of a Great Plains avian (Cardinalidae: Pheucticus) hybrid zone, Molecular Ecology 18: MORITZ, C., J. L. PATTON, C. J. CONROY, J. L. PARRA, G. C. WHITE, AND S. R. BEISSINGER Impact of a century of climate change on small-mammal communities in Yosemite National Park, USA, Science 322: MUCHLINSKI, A. E., AND E. N. RYBAK Energy-consumption of resting and hibernating meadow jumping mice, Journal of Mammalogy 59: NEI, M Molecular evolutionary genetics. Columbia University Press, New York, Chichester, West Sussex. NIELSON, M., K. LOHMAN, C. H. DAUGHERTY, F. W. ALLENDORF, K. L. KNUDSEN, AND J. SULLIVAN Allozyme and mitochondrial DNA variation in the tailed frog (Anura : Ascaphus): The influence of geography and gene flow, Herpetologica 62: NIELSON, M., K. LOHMAN, AND J. SULLIVAN Phylogeography of the tailed frog (Ascaphus truei): Implications for the biogeography of the Pacific Northwest, Evolution 55:
120 NYLANDER, J. A. A MrModeltest v2in Program distributed by the Author. Evolutionary Biology Centre, Uppsala University. PARMESAN, C Ecological and evolutionary responses to recent climate change, Annual Review of Ecology Evolution and Systematics 37: PATTON, J. L., D. G. HUCKABY, AND S. T. ALVAREZ-CASTANEDA The evolutionary history and a systematic revision of woodrats of the Neotoma lepida group. Vol University of California Publications in Zoology, Berkeley and Los Angeles, California. PEARSON, R. G., C. J. RAXWORTHY, M. NAKAMURA, AND A. T. PETERSON Predicting species distributions from small numbers of occurrence records: a test case using cryptic geckos in Madagascar, Journal of Biogeography 34: PETERSON, A. T Ecological niche conservatism: a time-structured review of evidence, Journal of Biogeography 38: PETIT, R. J., F. S. HU, AND C. W. DICK Forests of the past: A window to future changes, Science 320: PHILLIPS, S. J., R. P. ANDERSON, AND R. E. SCHAPIRE Maximum entropy modeling of species geographic distributions, Ecological Modelling 190: POSADA, D., AND K. A. CRANDALL The effect of recombination on the accuracy of phylogeny estimation, Journal of Molecular Evolution 54: PREBLE, E. A Revision of the jumping mice of the genus Zapus, North American Fauna 15:
121 PRYON, R. A., AND F. T. BURBRINK Lineage diversificaiton in a widespread species: roles for niche divergence and conservatism in the common kingsnake, Lampropeltis getula, Molecular Ecology 18: QUIMBY, D. C The life history and ecology of the jumping mouse, Zapus hudsonius, Ecological Monographs 21: RAXWORTHY, C. J., C. INGRAM, N. RABIBISOA, AND R. PEARSON Applications of ecological niche modeling for species delimitation: a review and empirical evaluation using Day Geckos (Phelsuma) from Madagascar, Systematic Biology 56: REDDY, S., AND L. M. DAVALOS Geographical sampling bias and its implications for conservation priorities in Africa, Journal of Biogeography 30: REID, N., G. DEMBOSKI, AND J. SULLIVAN Phylogeny estimation of the radiation of western American chipmunk (Tamias) in the face of introgression using reproductive protein genes, Systematic Biology in press:in press. RIDDLE, B. R., AND D. J. HAFNER A step-wise approach to integrating phylogeographic and phylogenetic biogeographic perspectives on the history of a core North American warm deserts biota, Journal of Arid Environments 66: RIDDLE, B. R., AND D. J. HAFNER Phylogeography in historical biogeography: Investigating the biogeographic histories of populations, species, and young biotas, Biogeography in a Changing World:
122 RIDDLE, B. R., D. J. HAFNER, L. F. ALEXANDER, AND J. R. JAEGER Cryptic vicariance in the historical assembly of a Baja California Peninsular Desert biota, Proceedings of the National Academy of Sciences of the United States of America 97: RISSLER, L. J., AND J. J. APODACA Adding more ecology into species delimitation: Ecological niche models and phylogeography help define cryptic species in the black salamander (Aneides flavipunctatus), Systematic Biology 56: RONQUIST, F., AND I. SANMARTIN Phylogenetic methods in biogeography, Annual review of Ecology, Evolution, and Systematics 42: ROZAS, J., J. C. SANCHEZ-DELBARRIO, X. MESSEGUER, AND R. ROZAS DnaSP, DNA polymorphism analyses by the coalescent and other methods, Bioinformatics 19: RUBIDGE, E. M., J. L. PATTON, M. LIM, A. C. BURTON, J. S. BRASHARES, and C. MORITZ Climate-induced range contraction drives genetic erosion in an alpine mammal, Nature Climate Change 2: RUEZ, D. R., AND C. J. BELL First Pleistocene jumping mouse (Zapus, Zapodinae, Rodentia) from Utah, Western North American Naturalist 64: RUNCK, A. M., AND J. A. COOK Postglacial expansion of the southern red-backed vole (Clethrionomys gapperi) in North America, Molecular Ecology 14:
123 RUNCK, A. M., M. D. MATOCQ, AND J. A. COOK Historic hybridization and persistence of a novel mito-nuclear combination in red-backed voles (genus Myodes), BMC Evolutionary Biology 9:1-15. SCHOENER, T. W Anolis lizards of Bimini: resource partitioning in a complex fauna, Ecology 49: SHIMODAIRA, H., AND M. HASEGAWA Multiple comparisons of log-likelihoods with applications to phylogenetic inference, Molecular Biology and Evolution 16: SLATKIN, M., AND W. P. MADDISON A cladistic measure of gene flow inferred from the phylogenies of alleles, Genetics 123: SMITH, M. F., AND J. L. PATTON The diversification of South-American murid rodents - evidence from mitochondrial-dna sequence data for the Akodontine tribe, Biological Journal of the Linnean Society 50: SOMMER, R. S., AND F. E. ZACHOS Fossil evidence and phylogeography of temperate species: 'glacial refugia' and post-glacial recolonization, Journal of Biogeography 36: SPAETH, P. A., M. VAN TUINEN, Y. L. CHAN, D. TERCA, AND E. A. HADLY Phylogeography of Microtus longicaudus in the tectonically and glacially dynamic central rocky mountains., Journal of Mammalogy 90:
124 SPELLMAN, G. M., and J. KLICKA Phylogeography of the white-breasted nuthatch (Sitta carolinensis): diversification in North American pine and oak woodlands, Molecular Ecology 16: SPELLMAN, G. M., B. RIDDLE, and J. KLICKA Phylogeography of the mountain chickadee (Poecile gambeli): diversification, introgression, and expansion in response to Quaternary climate change, Molecular Ecology 16: STEPHENS, M., AND P. SCHEET Accounting for decay of linkage disequilibrium in haplotype inference and missing-data imputation, American Journal of Human Genetics 76: STEPHENS, M., N. J. SMITH, AND P. DONNELLY A new statistical method for haplotype reconstruction from population data, American Journal of Human Genetics 68: SULLIVAN, J., E. ARELLANO, AND D. S. ROGERS Comparative phylogeography of mesoamerican highland rodents: Concerted versus independent response to past climatic fluctuations, American Naturalist 155: SWOFFORD, D. L PAUP*. Phylogenetic Analysis Using Parsimony (*and Other Methods). Version 4 in Sinauer Associates, Sunderland, Massachusetts. TAMURA, K., D. PETERSON, N. PETERSON, G. STECHER, M. NEI, AND S. KUMAR MEGA5: Molecualr Evolutionary Genetics Analysis using maximum likelihood, evolutionary distance, and maximum parsimony methods, Molecular Biology and Evolution 28:
125 TAN, A. M., AND D. B. WAKE MtDNA phylogeography of the California newt, Taricha torosa (Caudata, salamandridae), Molecular Phylogenetics and Evolution 4: TAVARÉ, S Some probabilistic and statistical problems in the analysis of DNA sequences, Lectures on Mathematics in the Life Sciences (American Mathematical Society) 17: TEMPLETON, A. R., K. A. CRANDALL, AND C. F. SING A cladistic analysis of phenotypic associations with haplotypes inferred from restriction endonuclease mapping and DNA sequence data. III. Cladogram estimation, Genetics 132: THOMAS, C. D., ET AL Extinction risk from climate change, Nature 427: WAKE, D. B Incipient species formation in salamanders of the Ensatina complex, Proceedings of the National Academy of Sciences of the United States of America 94: WALTARI, E., AND R. P. GURALNICK Ecological niche modelling of montane mammals in the Great Basin, North America: examining past and present connectivity of species across basins and ranges, Journal of Biogeography 36: WALTARI, E., R. J. HIJMANS, A. T. PETERSON, A. S. NYARI, S. L. PERKINS, AND R. P. GURALNICK Locating Pleistocene refugia: comparing phylogeographic and ecological niche model predictions, Plos One 2:e
126 WALTHER, G. R., ET AL Ecological responses to recent climate change, Nature 416: WARREN, D. L., R. E. GLOR, AND M. TURELLI Environmental niche equivalency versus conservatism: quantitative approaches to niche evolution, Evolution 62: WARREN, D. L., R. E. GLOR, AND M. TURELLI ENMTools: a toolbox for comparative studies of enironmental niche models, Ecography 33: WARREN, D. L., AND S. N. SEIFERT Ecological niche modeling in Maxent: the importance of model complexity and the performance of model selection criteria Ecological Applications 21: WIENS, J. J Speciation and ecology revisited: Phylogenetic niche conservatism and the origin of species, Evolution 58: WIENS, J. J., AND C. H. GRAHAM Niche conservatism: Integrating evolution, ecology, and conservation biology, Annual Review of Ecology Evolution and Systematics 36: WILSON, G. M., R. A. DEN BUSSCHE, K. MCBEE, L. A. JOHNSON, AND C. A. JONES Intraspecific phylogeography of red squirrels (Tamiasciurus hudsonicus) in the central rocky mountain region of North America, Genetica 125: ZINK, R. M Methods in comparative phylogeography, and their application to studying evolution in the North American aridlands, Integrative and Comparative Biology 42:
127 ZWICKL, D. J Genetic algorithm approaches for the phylogenetic analysis of large biological sequence datasets under the maximum likelihood criterion. PhD dissertation, The University of Texas at Austin, Austin, Texas. 119
128 APPENDIX Specimens examined are listed by scientific name, collection localities, source museums (museum catalog number), and corresponding GenBank accession numbers (mitochondrial DNA cytochrome b [cytb], nuclear DNA glucocerebrosidase gene [GBA] and myosin heavy chain 2 [MYH2], or - for not applicable) for jumping mice samples used in this study. Acronyms for museum accessions are MSB - Museum of Southwestern Biology - University of New Mexico, Albuquerque; MVZ - Museum of Vertebrate Zoology - University of California, Berkley; UAM - University of Alaska Museum of the North, Fairbanks. Locality abbreviations: Apache Sitgreaves National Forest (ASNF), Inyo National Forest (INF), Kings Canyon National Park (KCNP), Lassen National Forest (LNF), Lassen Volcanic National Park (LVNP), Peppers Lake Recreation Area (PLRA), Point Reyes National Seashore (PRNS), Powdermill Nature Reserve (PNR), Routt National Forest (RNF), Santa Fe National Forest (SFNF), Yellowstone National Park (YSNP), Voyageurs National Park (VNP), Yosemite National Park (YNP). Species Subspecies State/Province Locality GenBank accession (cytb,gba,myh2) no.(s) Z. princeps saltator Alaska Chickamin River xxx.xxx,-,-; xxx.xxx,-,-; xxx.xxx,-,-; xxx.xxx,xxx.xxx,- Museum accession no.(s) UAM-22750; UAM-22760; UAM-22771; UAM Z. princeps saltator Alaska Gwent Cove xxx.xxx,-,-; xxx.xxx,-,- UAM-33121; UAM Z. princeps saltator Alaska mouth of Unuk River xxx.xxx,xxx.xxx,-; xxx.xxx,-,-; xxx.xxx,-,- UAM-22765; UAM-22748; UAM Z. princeps saltator Alaska Reflection Lake xxx.xxx,-,-; xxx.xxx,-,-; xxx.xxx,xxx.xxx,- UAM-71051; UAM-71052; UAM
129 Z. princeps saltator Alaska Stikine River xxx.xxx,-,-; xxx.xxx,xxx.xxx,- UAM-20805; UAM Z. princeps saltator Alaska Tyee xxx.xxx,-,- UAM Z. princeps minor Alberta 4 km N, 38 km W Sundre xxx.xxx,xxx.xxx,xxx.xxx MSB Z. princeps minor Alberta PLRA xxx.xxx,xxx.xxx,xxx.xxx; xxx.xxx,xxx.xxx,- MSB-55775; MSB Z. princeps saltator British Columbia Nass River Valley xxx.xxx,-,- UAM Z. princeps pacificus California Fresno Co., Bullfrog Lake, KCNP xxx.xxx,-,- MVZ Z. princeps pacificus California Mariposa Co., 3.2 mi E Chinquapin, YNP xxx.xxx,-,- MVZ Z. princeps pacificus California Mariposa Co., Bridalveil Creek, YNP xxx.xxx,-,- MVZ Z. princeps pacificus California Mariposa Co., Crane Flat, YNP xxx.xxx,xxx.xxx,xxx.xxx MVZ Z. princeps pacificus California Mariposa Co., Merced Grove, YNP xxx.xxx,-,-; xxx.xxx,-,-; xxx.xxx,-,-; xxx.xxx,-,- Z. princeps pacificus California Mariposa Co., Monroe Meadows, YNP xxx.xxx,xxx.xxx,xxx.xxx; xxx.xxx,xxx.xxx,xxx.xxx; xxx.xxx,-,-; xxx.xxx,xxx.xxx,- MVZ ; MVZ ; MVZ ; MVZ MVZ ; MVZ ; MVZ ; MVZ Z. princeps pacificus California Mariposa Co., Yosemite Creek, YNP xxx.xxx,-,- MVZ Z. princeps pacificus California Mono Co., Bohler Creek xxx.xxx,-,- MVZ Z. princeps pacificus California Mono Co., Sweetwater Canyon xxx.xxx,xxx.xxx,xxx.xxx MSB Z. princeps pacificus California Mono Co., Walker Lake xxx.xxx,-,- MVZ Z. princeps pacificus California Mono Co., Warren Fork of Lee Vining Creek xxx.xxx,-,-; xxx.xxx,-,-; xxx.xxx,-,- MVZ ; MVZ ; MVZ Z. princeps pacificus California Nevada Co., Sagehen Research Station xxx.xxx,xxx.xxx,xxx.xxx; xxx.xxx,xxx.xxx,xxx.xxx MVZ ; MVZ
130 Z. princeps pacificus California Plumas Co., Willow Lake Campground, LNF xxx.xxx,-,- MVZ Z. princeps pacificus California Tehama Co., LVNP xxx.xxx,xxx.xxx,xxx.xxx; xxx.xxx,-,- MVZ ; MVZ Z. princeps pacificus California Tulare Co., Little Brush Meadow, INF xxx.xxx,-,-; xxx.xxx,-,-; xxx.xxx,-,-; xxx.xxx,-,- MVZ ; MVZ ; MVZ ; MVZ Z. princeps pacificus California Tuolumne Co., North Crane Creek, YNP xxx.xxx,-,- MVZ Z. princeps pacificus California Tuolumne Co., upper Lyell Canyon, YNP xxx.xxx,xxx.xxx,-; xxx.xxx,-,- MVZ ; MVZ Z. princeps pacificus California Tuolumne Co., Glen Aulin, YNP xxx.xxx,xxx.xxx,-; xxx.xxx,-,- MVZ ; MVZ Z. princeps pacificus California Tuolumne Co., McGee Lake, YNP xxx.xxx,-,- MVZ Z. princeps pacificus California Tuolumne Co., Dorothy Lake, YNP xxx.xxx,-,-; xxx.xxx,-,- MVZ ; MVZ Z. princeps pacificus California Tuolumne Co., Grace Meadow, YNP xxx.xxx,-,- MVZ Z. princeps pacificus California Tuolumne Co., Virginia Canyon, YNP xxx.xxx,-,-; xxx.xxx,-,- MVZ ; MVZ Z. princeps princeps Colorado Jackson Co., Connor Creek xxx.xxx,xxx.xxx,-; xxx.xxx,-,-; xxx.xxx,xxx.xxx,- MSB-76672; MSB-76673; MSB Z. princeps princeps Colorado Routt Co., RNF, Reed Creek xxx.xxx,-,-; xxx.xxx,-,- MSB-76593; MSB Z. princeps idahoensis Montana Gallatin Co., Hyalite Creek xxx.xxx,-,-; xxx.xxx,-,- MSB-56732; MSB Z. princeps princeps New Mexico Mora Co., 8 mi N, 6 mi E Tres Ritos xxx.xxx,xxx.xxx,- MSB Z. princeps princeps New Mexico Santa Fe Co., 5 mi N, 8 mi E of Santa Fe xxx.xxx,-,- MSB Z. princeps princeps New Mexico Santa Fe Co., SFNF, Ski Basin Rd. xxx.xxx,xxx.xxx,xxx.xxx; xxx.xxx,xxx.xxx,-; xxx.xxx,xxx.xxx,- MSB-72781; MSB-72783; MSB Z. princeps princeps New Mexico Taos Co., 4 mi NE of Tres Ritos xxx.xxx,xxx.xxx,xxx.xxx MSB Z. princeps princeps New Mexico Taos Co., 4 mi N, 11 mi E Arroyo Hondo xxx.xxx,-,- MSB
131 Z. princeps utahensis Utah Wasatch Co., Strawberry Reservoir xxx.xxx,-,-; xxx.xxx,-,-; xxx.xxx,xxx.xxx,xxx.xxx; xxx.xxx,xxx.xxx,xxx.xxx MSB-77223; MSB-77224; MSB-77225; MSB Z. princeps princeps Wyoming Carbon Co., Battle Creek, xxx.xxx,xxx.xxx,- UAM Z. princeps princeps Wyoming Carbon Co., Snowy Range DQ665221,-,- Z. princeps idahoensis Wyoming Park Co., YSNP, Blacktail Cabin xxx.xxx,-,-; xxx.xxx,xxx.xxx,xxx.xxx; xxx.xxx,-,-; xxx.xxx,xxx.xxx,- MSB-72296; MSB-72297; MSB-72298; MSB Z. princeps idahoensis Wyoming Park Co., YSNP, Lamar Creek xxx.xxx,-,- MSB Z. princeps idahoensis Wyoming Park Co., YSNP, Slough Creek xxx.xxx,-,-; xxx.xxx,-,-; xxx.xxx,-,-; xxx.xxx,xxx.xxx,-; xxx.xxx,-,- MSB-72300; MSB-72301; MSB-72302; MSB ; MSB Z. hudsonius alascensis Alaska Murray Lake xxx.xxx,xxx.xxx,xxx.xxx MSB Z. hudsonius hudsonius Minnesota St Louis Co., VNP xxx.xxx,xxx.xxx,xxx.xxx MSB Z. hudsonius luteus Colorado La Plata Co., Florida River JN546499,xxx.xxx,xxx.xxx MSB Z. trinotatus orarius California Marin Co., Abbott's Lagoon, PRNS xxx.xxx,xxx.xxx,xxx.xxx MVZ Z. trinotatus trinotatus Oregon Benton Co., Prairie Mountain xxx.xxx, xxx.xxx,xxx.xxx; AF119262,-,- UAM-67563; UAM N. insignis insignis New Brunswick Kings Co. xxx.xxx,xxx.xxx,xxx.xxx MSB
 Z. p. chrysogenys, 2) Z. p. cinereus, 3) Z. p. curtatus, 4) Z. p. idahoensis, 5) Z. p. kootenayensis, 6) Z. p. minor, 7) Z. p. oregonus, 8) Z. p. pacificus, 9) Z.")
132 FIGURES FIG. 1. Distribution and range limits of North American zapodids - Zapus hudsonius (grey), Z. princeps (hashes), and Z. trinotatus (stipples) modified from Hall (1981). Currently recognized sub-species 1) Z. p. chrysogenys, 2) Z. p. cinereus, 3) Z. p. curtatus, 4) Z. p. idahoensis, 5) Z. p. kootenayensis, 6) Z. p. minor, 7) Z. p. oregonus, 8) Z. p. pacificus, 9) Z. p. princeps, 10) Z. p. saltator, 11) Z. p. utahensis, a) Z. t. trinotatus, b) Z. t. montanus, c) Z. t. eureka, d) Z. t. orarius. Sub-species of Z. hudsonius not shown. 124
133 FIG. 2. Phylogram of Bayesian inference majority rules consensus tree produced using GTR+I+Γ model and samples of Z. princeps and other taxa for the mitochondrial cytb gene. Stars at nodes correspond to posterior probabilities (>0.95, PP) from 50k post burn-in trees and 1k non-parametric bootstraps (>.90 ML). 125
 with")
134 FIG. 3. Median joining statistical parsimony networks for jumping mice mtdna (cytb) with respect to geography and ndna (GBA and MYH2 - inset). Individual tick marks 126
135 represent one polymorphic site or mutation (step) and squares represent missing or ancestral haplotypes. Note multiple haplotypes per locality in southern lineages reflecting deep phylogenetic history but haplotypes shared among geographic locations in the most northern populations of the Boreal clade reflecting recent demographic history. 127
136 FIG. 4. Alternative demographic hypotheses for Zapus princeps using the parametric bootstrap test (coalescent simulations) of divergence patterns in jumping mice with 90% confidence intervals. Hypotheses of persistent allopatry (PA, grey) versus admixture (AM, white) with the arrow highlighting the empirical tree value for Slatkin and Maddison's s (1989; s = 13). Numbers correspond with geographic ranges and clades in PA (1 = Z. trinotatus, 2 = N. Sierra, 3 = S. Sierra, 4 = Boreal, 5 = Uinta, 6 = S. Rockies) but clades are represented geographically (mixed) in AM. 128
 from 12 environmental variables for Z. princeps, Z. trinotatus, and Sierran jumping mice. Geographic overlap was calculated in km 2 for each pair and indices (D, I, RR; Warren et al.")
137 FIG. 5. Phylogenetically-informed species distributions models using MAXENT based on point-wise mean logistic bootstrap prediction from 20 replicates and minimum training presence threshold rule (>0.20) from 12 environmental variables for Z. princeps, Z. trinotatus, and Sierran jumping mice. Geographic overlap was calculated in km 2 for each pair and indices (D, I, RR; Warren et al. 2008, 2010) with significance (* < 0.05, **< 0.001) via 100 pseudo-replicates using ENMtools. 129
138 TABLES Table 1. Molecular diversity indices of mtdna (cytb) and ndna (GBA and MYH2) for North American jumping mice calculated in DNASP; N = Number of individuals sampled, S = polymorphic sites, h = number of haplotypes, = haplotype diversity and standard deviation (sd), = nucleotide diversity (per site), and neutrality estimates. Tajima's D and Fu's Fs were calculated with coalescent simulations (10,000 replicates) with values that correspond to calculations based on the Waterson estimator theta ( W). Stars represent significance *<0.05, **<0.01. Napaeozapus excluded from cytb analyses. N S h D F s (sd) cytb gene (0.018) Boreal * ** (0.013) 130
139 Northern Sierra (0.126) Southern Rockies (0.061) Southern Sierra * ** (0.094) Uinta (0.222) Z. trinotatus Z. hudsonius GBA gene 32 (64) * 131
140 MYH2 gene 25 (50) * 132
141 CHAPTER 3 USING HISTORICAL BIOGEOGRAPHY TO INFORM CONSERVATION: THE CASE OF PREBLE S MEADOW JUMPING MOUSE Jason L. Malaney a,1, Joseph A. Cook a a Museum of Southwestern Biology, Department of Biology, University of New Mexico, Albuquerque, NM Correspondence should be sent at the address: Museum of Southwestern Biology, Department of Biology, University of New Mexico, Albuquerque, NM or jmalaney@gmail.com 133
142 ABSTRACT The last Pleistocene deglaciation shaped temperate and boreal biotic communities in North America. Rapid northward expansion into high latitudes created distinctive spatial genetic patterns including distant populations of widespread species that are closely related while adjacent populations, especially those near the southern periphery, often are distinctive due to long-term disjunction. Across a spatial expanse that includes both recently colonized and long-occupied regions, we analyzed molecular variation in zapodid rodents to explore how historical climate shifts influenced diversification in this group. By combining molecular analyses with species distribution modeling and tests of ecological exchangeability, we show that the lineage including the Preble's meadow jumping mouse (Zapus hudsonius preblei), a federally listed taxon of conservation concern, is not restricted to the southern Rocky Mountains. Rather, populations along the Front Range are part of a single lineage of ecologically indistinct populations that extends to the far north. Of the 21 lineages identified, this Northern lineage has the largest geographic range and relatively low measures of genetic diversity, consistent with recent northward expansion. Comprehensive sampling combined with coalescent-based analyses and niche modeling lead to a radically different view of geographic structure within jumping mice and indicates the need to re-evaluate their management. Our study highlights a fundamental principle in conservation biology, that biogeographic history should be central to establishing conservation priorities for sound management initiatives. keywords. conservation prioritization evolution niche modeling phylogeography speciation 134
143 INTRODUCTION Historical biogeography provides the spatiotemporal context to document geographic variability and to explore processes responsible for generating diversity (1, 2). A growing body of knowledge from fossils (3) and DNA analyses (4) demonstrates massive pole-ward shifts (5, 6) of biota since the last glacial maximum (LGM ka; (7)), reflecting the role of Pleistocene climate fluctuations in shaping present-day distributions and patterns of diversity. Analogous shifts to higher elevations with warming conditions are also documented (8, 9). In North America, molecular signatures reveal that across multiple species, many high-latitude populations share recent ancestry with distant low-latitude populations due to rapid northward colonization following glacial retreat (4). Conversely, adjacent low-latitude populations are often genetically divergent, reflecting enduring spatial disjunction. Identifying distinct evolutionary lineages and their spatial distribution is central to understanding the processes that lead to biological diversification, but these entities are also the units that are the target of conservation action. Deciphering molecular signatures across the entire range of a species should be an essential first step toward executing effective conservation and management strategies, but this step requires broad sampling across multiple components (taxonomic, genetic, geographic, ecological) to ensure variation and historical signatures are rigorously assessed (10-12). The federal Endangered Species Act (ESA) is a cornerstone of management practices in the United States and often guides conservation spending, however, implementation of the ESA can be problematic (13-15). Debate persists on how best to assess imperilment, but a foundational principle is to conserve diversity, often by 135
144 identifying evolutionarily divergence (16-19). Limited ranges also are widely considered to increase conservation concern (20, 21). Conservation decisions often need to be made quickly and, thus, using available information, which can often be datasets based on a single character type (usually morphology) analyzed decades ago, before the sophisticated quantitative methods available to modern studies. Consequently, conservation efforts frequently rely on antiquated intraspecific taxonomy (i.e., subspecies) as the primary roadmap identifying diversity (22), yet federal managers are bound by statute to follow the best-available science. Allocation of finite conservation resources should hinge on the ability to define geographic variation (e.g., Evolutionarily Significant Units ESU) within species (23, 24) and assess ecological exchangeability within and among ESUs (25-27). These goals depend on adequate sampling across genes to identify units of significant evolutionary distinction and across the spatial and ecological breadth of lineages (28-30) to ensure evolutionary history is well established. We implement conservation phylogenetic methods (31-34) by integrating genetic and ecological approaches to assess whether genetic subdivisions are consistent with jumping mice taxonomic hypotheses. Then we develop conservation priorities that reflect a historical-biogeographic perspective (35-38) predicated on extinction threats. Conservation phylogenetic techniques have been developed (39, 40) in an effort to more objectively prioritize protection efforts. We explore the historical signatures (genetics and niches) of jumping mice and simultaneously test alternative hypotheses of evolutionary independence across this group to better inform conservation action. Broadly, our aim is to highlight that unraveling biogeographic signatures of the past is an essential step in conservation efforts. Our specific goal is to examine whether 136
145 geographic structure of evolutionary diversity is reflected in taxonomy which is the current foundation of the politically-charged management of zapodid rodents in North America (41, 42). Specifically we integrate phylogeographic structure, including historical demographic signals and spatial shifts, into conservation prioritization. Through a coalescent-based approach (43, 44), populations of the Preble's meadow jumping mouse (Zapus hudsonius preblei, Fig. 1B) along the Front Range of Colorado and Wyoming (45, 46) are minimally diverged from populations extending far northward to western Canada and Alaska (Fig. 1A, 2). Since 1998, controversy regarding the federal listing of this subspecies has led to rancorous debates in popular press (47, 48), science (49-55), policy (56, 57), and law (58). Conservation efforts for Z. h. preblei in the past were estimated at nearly $172 million (59) and may cost an additional $268 million in the next 2 decades (60, 61). Our work extends previous efforts to test the distinctiveness of this subspecies (49, 55) by placing Z. h. preblei populations within an expanded context of evolutionary diversification and ecological variation across all zapodid taxa, not just adjacent subspecies. 137
146 METHODS Our generalized workflow began with sequencing genes from all jumping mice taxa using samples from natural-history museums and targeted fieldwork (2007 and 2010) to obtain topotypes, but also considering a broader phylogenetic context. Single gene and multilocus phylogeny reconstructions (e.g. species-tree) were used to identify lineages (e.g. ESUs). Coalescent-based population summary statistics (mtdna) and multilocus Extended Bayesian Skyline analyses were conducted to document historical demographic change for each lineage. Phylogenetically-informed species distribution models (SDM) were constructed from contemporary locality records and projected to the past (66, 80, 112, 121) to identify potential paleodistributions (i.e. at LGM). Fossils were integrated for the species-tree phylogeny and to independently confirm paleodistributions. Finally, evolutionary distinctiveness (i.e. monophyly), population size change (contemporary and past), contemporary range size, historical range size, and existing risks were integrated to define extinction threats (SI Appendix, Table S1) and each lineage was assigned an updated regional IUCN score (117). IUCN scores were then converted using ranks-to-extinction probability transformations and applied to the taxonomy-based species-tree phylogeny (33, 39) to more objectively measure and assess conservation priorities. Genetic Data. We obtained DNA sequences for 762 jumping mice across North America from existing natural-history collections and targeted fieldwork at type localities (i.e. topotypes) of subspecies. We extracted and sampled DNA from 430 individuals and sequenced the complete mitochondrial cytochrome b gene (cytb 1140 bp). To more fully explore genomic diversity, we also sequenced a subset of these specimens for 2 138
147 nuclear introns and 2 nuclear exons. Partial introns included Apolipoprotein B (APOB) and Glucocerebrosidase (GBA), and partial exons Breast Cancer Susceptibility (BCRA1), and the beta-myosin heavy chain (MYH7). Partial (1006 bp) cytb data were obtained from GenBank for 332 samples (predominantly Z. hudsonius) from previous molecular studies (49, 55). Samples were partitioned by species; 31 N. insignis (5 subspecies), 455 Z. hudsonius (12 subspecies), 223 Z. princeps (10 subspecies), and 53 Z. trinotatus (4 subspecies) to address conservation-phylogenetic and historical-biogeographic questions and assess if phylogeographic structure is reflected in the existing taxonomy (41, 42, 85); Fig. 2, SI Appendix, Fig. S1). Polymerase chain reactions (PCR) and cycle sequencing followed protocols previously established (84, 122, 123) and heterozygous positions were scored using the IUPAC nucleic acid code. Specific ndna alleles were identified using statistical methods with haplotypes inferred from multi-allelic loci using a Bayesian framework via PHASE (124, 125) in DNASP v (126). We conducted three independent runs for each locus for 1k iterations with alterations in block size for the partition-ligation procedure. Individual haplotypes that could not be statistically resolved (<90% posterior probability) were coded as missing data. Homologous sequences were aligned using MUSCLE v. 3.7 (127) and validated visually. Individual contigs were deposited in GenBank (xxxx.xxxxxxxx.xxxx). Phylogenetic Analyses. We conducted phylogenetic analyses using a Bayesian inference (BI) framework for each locus with MRBAYES v (128, 129). Aligned datasets were subjected to alternative models of sequence evolution in jmodeltest (130) where Bayesian information criterion (BIC) (131) was used to determine the best-fit nucleotide 139
148 substitution model (SI Appendix, Table S4). Phylogenetic reconstructions were initiated with random trees, run with 4 chains (default heating values) for 5 million generations, with sampling every 5k generations. Convergence diagnostics were completed with the program AWTY (132) and optimal parameter estimates were examined in TRACER (133). Nodal support (posterior probability PP) was identified in the consensus of the residual trees with the first 5k trees discarded (134) and three independent runs were performed to ensure replicated convergence and trees were depicted with FIGTREE. Given that tree-based methods may fail to reveal reticulate evolution (135) often inherent to recent divergences, we also conducted a phylogenetic statistical-parsimony network analysis (120) for each species and each gene using TCS v (119). For Cytb, we detected 102 haplotypes in our Z. hudsonius dataset, and 33 within the Northern lineage as a distinct network with a significant (95%) limit at 5 steps (other networks not presented). We failed to detect haplotype H from King et al. (49) and the reported sample is identical to A. We document 4 other errors in reporting data. In Douglas Co. Colorado, both haplotypes C and I were reported, but all available datasets reflect only haplotype J at this locality. GenBank does not return haplotypes E or S, but reported F and V have 2 distinct haplotypes each that we inferred respectively (highlighted with an asterisk in SI Appendix, Fig. S4). We detected the widespread I haplotype from two new locations plus one additional haplotype in Colorado. Twelve closely related haplotypes were detected in the far North. Species-Tree Estimation and Divergence. Single-gene analyses often indicate a lack of monophyly at the species level and may vary in comparisons among loci (136), so we estimated the phylogeny with *BEAST (65) using a subset of the molecular data from 140
149 each subspecies (topotypes). We used species-tree methods (136) to assess if phylogeographic structure is reflected by the morphologically-based subspecies taxonomy of North American jumping mice (42). We sampled at least one representative individual topotype for each subspecies but generally >3 representatives for all genes conforming to a multilocus, multispecies, coalescent-based framework. Analyses were setup in BEAUti v and run with BEAST v Fossil calibration points for divergences were used at several nodes (137), Fig. 2) of the species-tree from well-dated fossils of North American zapodids (92, 116, ) and correspond to paleodistribution reconstructions (see below) and established estimates of spatiotemporal divergence. A strict molecular clock (0.05) was used for the mtdna dataset and estimated clocks for ndna. Models of sequence evolution were used for each locus with remaining parameters set to default. Runs were conducted for 50M generations, sampled every 5k, and we examined ESS values (>200) in TRACER and split frequencies across the Markov-chain in AWTY (132) indicating stabilization. Demographic Tests. Molecular diversity indices (142) were calculated in DNASP and determined for each gene, by species, and by lineage (Table 2; only mtdna presented) including segregating sites (S), number of haplotypes (N h ), haplotype (h) and nucleotide (π) diversity, and mean nucleotide differences (K). Population equilibrium tests for the mtdna dataset were conducted by each lineage and included Tajima s D (143) Fu s F S (144), and R 2 -test (88), and significance was assessed using a null distribution of 10,000 coalescent-based simulations. Population equilibrium tests (D, F S, R 2 ) have high power for revealing demographic change under a model of sudden expansion (88) where significant negative values of D and F S and small positive values of R 2 are indicative of 141
150 population growth. Tajima s D (large sample size) and the R 2 -test (small sample size) estimates demographic change using information from segregating sites whereas Fu s F s uses information from haplotype frequencies based on Ewens (145) sampling distribution. Given that single gene summary statistics (e.g. D, F S, R 2 ) may not accurately capture or assess all historical demographic information, we also analyzed the changes in population size through time using the Bayesian-skyline (single locus(90)) and extended Bayesian-skyline (multilocus (89)) analyses. These coalescent-based approaches calculate the posterior distribution of effective population size at intervals along the phylogeny. We performed analyses for each zapodid lineage using the model of nucleotide substitution, fixed the mtdna substitution rate to 1 (substitution per site) and maintained a strict molecular clock, but estimated clocks for the ndna datasets. Default setting for the skyline model (constant) and number of groups (10, except n-1 for Coastal, Northern Sierra, Okanogan, and Southern Cascade) were retained. Species Distribution Modeling. We used SDM to assess niche envelopes of each lineage with 2.5 minute (4km) resolution, bioclimatic variables (146) from the WorldClim database (http// for contemporary and LGM. Modeling procedures followed previous studies (68, 147) by clipping the coverages to the study area (North America). Niche variables may be highly correlated and influence projections, so we used the 11 most biologically meaningful and uncorrelated coverages (Bio1-3, 7-9, 15-19; (82). Localities for each taxon were downloaded from MANIS (Jan 2011) and updated using biogeomancer workbench (148). To account for sampling biases (149) that may result in model over-fitting, we discarded localities with >0.5km 2 uncertainty and down- 142
151 sampled (aka culled) records so that only a single record was represented within 10 km 2. We partitioned localities by species-tree lineages rather than nominal subspecies to reconstruct SDMs for contemporary and ancestral conditions. However, one exception includes a finer analysis of the Northern lineage to test if Z. h. preblei is ecologically exchangeable (see below) with conspecifics (i.e. Z. h. alascensis, Z. h. tenellus; SI Appendix, Table S2). Partitioned SDMs were used to inform regional IUCN rankings for each lineage (see below, SI Appendix, Table S1). SDMs were constructed using default settings in the program MAXENT version 3.3.3a (114, 121) with 20 replicate runs. When possible, localities with genetic data were used as an alternative training dataset. When insufficient genetic samples were available, we randomly reserved 20% of available localities as training datasets. Models used the point-wise bootstrap median of replicated runs with the 90% of the samples included as the projection criterion. Given that changes in population size and range size are correlated (87, 91), we relate LGM and contemporary predicted SDM to historical and contemporary N e that were then incorporated into IUCN rankings (see below). Niche conservation is a continuum (69, 150) where closely related taxa (i.e. lineages) generally share niche space more frequently than randomly expected, but rarely are environmental envelopes identical. Ecological exchangeability is expected when niches are sufficiently similar (26). To detect the degree of ecological exchangeability among jumping mice we assessed niche overlap between pairs of lineages using two metrics: the I statistic (69) and relative rank (RR; (151). With both metrics, pairwise overlap values range from 0.0 (completely discordant) to 1.0 (identical environmental envelopes). We also conducted niche identity tests to assess if environmental envelope 143
152 overlap is significantly different (one-tailed test) from a null expectation for populations within the Northern lineage. Niche identity tests randomize sample points and reconstruct an expected degree of niche overlap from an underlying distribution. ENMTOOLS v.1.3 (152) was used to assess niche overlap (I, RR) and conduct randomized tests (niche identity) using 100 pseudoreplicates for each analysis (SI Appendix, Table S2). Conservation Prioritization. Regional IUCN rankings were updated using established criteria (21, 117) and applied to each lineage to address both risk of extinction and conservation priority. Rankings are characterized by threats to extinction (SI Appendix, Table S1), which simultaneously incorporates independent datasets. These include current conservation concerns, phylogenetic distinctiveness, SDMs reflecting current range size and range size change since LGM relative (to conspecifics), plus contemporary and historical change in population size (84, 86, 104). IUCN rankings included: Critically endangered (CR), Endangered (EN), Vulnerable (VU), Near Threatened (NT), Least Concern (LC). The rankings Extinct, Extinct in the Wild, and Regionally Extinct (EX/EW/RE) and Data Deficient, Not Applicable, and Not Evaluated (DD/NA/NE) were not implemented in this study. Next, regional IUCN ranks were converted using the IUCN 100 (39, 98) ranks-toextinction probability transformations with the TUATARA module (153) in MESQUITE v.2.75 (154). There are several ranks-to-extinction transformations, but the IUCN 100 (Fig. 3) is thought to most accurately reflect threats to extinction within the next 100 years considering ongoing and future anthropogenic pressure (98). 144
153 RESULTS Sampling. Using museum collections and targeted fieldwork, we obtained range-wide samples that represented all extant zapodid taxa (i.e. complete taxon sampling, 32 subspecies of 4 extant species), and then sequenced multiple genetic loci and inferred niche space to assess if genetic structure accurately reflects the nominal taxonomy (41, 42). We simultaneously tested the genetic structure against the existing taxonomy and set the historic framework with a species-tree phylogeny (62-65). Then, by sampling niches using phylogenetically-informed SDMs (66, 67), we explored potential contemporary and paleodistributions (68) to assess ecological exchangeability (25, 26, 69). Phylogenetic Analyses. Bayesian gene-tree analyses of individual loci produced different estimates of divergence (SI Appendix, Fig. S1) and varying degrees of lineage sorting among phylogeographic groups (i.e. lineages). The mtdna dataset had the strongest phylogenetic signal and support values (posterior probabilities 0.95) identifying 12 clades as deeply divergent. Phylogenetic analyses for the nuclear loci reflect some degree of allele sharing across the range of jumping mice, but in general, alleles are well partitioned among species and lineages (SI Appendix, Fig. S1). Species-Tree Estimation and Divergence. Our taxonomy-based species-tree reflected strong support for 21 phylogeographic lineages, but failed to document significant support for all morphologically-based subspecies (Fig. 2). Further, the species-tree revealed novel intraspecific relationships. For example, past assessments of the validity of Z. h. preblei focused on geographically proximate taxa that were assumed to be close phylogenetic relatives (SI Appendix, Fig. S2). Instead, far northern (geographically 145
154 distant) subspecies (i.e. Z. h. alascensis, Z. h. tennellus, and western populations of Z. h. hudsonius) form a closely related clade with Front Range Z. h. preblei (Fig. 2). This widespread lineage separated from the Southern Plains lineage (Z. h. campestris, Z. h. hudsonius, Z. h. intermedius) at the end of the last glacial period. This distilled understanding of shared biogeographic history and wide range of closely related haplotypes may alter conservation priorities for Front Range jumping mice. Demographic Tests. Assessments of changes in effective population size N e were evaluated using both single-locus (mtdna) and multi-locus techniques, with signatures for both generally concordant (Table 2, SI Appendix, Fig. S3). Ten lineages experienced significant shifts in N e. The Northern lineage experienced the most pronounced historical demographic expansion signatures (Table 2, Fig. 1D, SI Appendix, Fig S3B), while the Uinta lineage reflected historical demographic declines (SI Appendix, Fig. S3C). Species Distribution Modeling. Climate-based SDMs predicted for each lineage reflect geographically restricted populations with varying degrees of niche overlap, but generally over-prediction was minimal (SI Appendix, Fig. S2). An exception is the Northern Cascade and Southern Cascade lineages that show niche overlap (I = 0.875, RR = 0.929), but deep divergence (middle Illinoisan; Fig. 2). Reconstructed SDMs fail to predict separation at the Columbia River. Relative influences of environmental parameters are typically lineage specific (SI Appendix, Table S3) but not for the Northern Cascade and Southern Cascade lineages. For example, Mean Temperature of Driest Quarter (Bio9), Precipitation of Coldest Quarter (Bio19), and Precipitation Seasonality (Bio15) had similar combined contributions (82.7% and 83.2%) for these lineages, a pattern that typifies niche models for recently diverged lineages (e.g. Acadian and Allegheny). Tests 146
155 of niche evolution (69) for subspecies within the Northern lineage suggest there is minimal differences among populations across this wide range (SI Appendix, Table S2). Conservation Prioritization. Key metrics (SI Appendix, Table S1; (20)) that elevate conservation ranking include genetic distinctiveness (Fig. 2), comparatively low N e (Table 2, SI Appendix, Fig. S3), population declines (historical or contemporary), spatial declines (Table 1), non-overlapping niches (i.e., not ecologically exchangeable; SI Appendix, Table S2), and existing management efforts (e.g., Z. h. preblei). We defined the risk of extinction for all lineages by first establishing genetic distinctiveness (Fig. 2), then calculating effective population sizes (N e ; Table 2, SI Appendix, Fig. S3), population declines (historical and contemporary), spatial shifts in distribution (Table 1), and overlap in niche space (i.e., ecologically exchangeability) among lineages. Risks of extinction ranged from Least Concern (0.0001) to Critically Endangered (0.999) and were applied in a phylogenetic context to determine conservation priority. The lineage that includes the federally threatened subspecies Z. h. preblei has low priority (Fig. 3) while other lineages without protection are identified as high priority (i.e., high extinction threat of a divergent lineage). 147
156 DISCUSSION This study highlights how historical biogeography can be used to lay a foundation for conservation action. Specifically, the federally listed Z. h. preblei is part of the wideranging Northern lineage, composed of closely related populations that expanded northand westward following the last deglaciation of North America. Under a variety of wellestablished conservation criteria, this widespread set of populations would hold lower conservation priority than other lineages that are genetically divergent, ecologically distinct, and geographically restricted units (i.e., endemic lineages) with molecular signatures indicative of declines (34, 70-72). We suggest that management plans for species-of-concern should, at a minimum, require comprehensive sampling of a species range coupled with phylogeographic analyses to establish a broad spatial and temporal perspective on diversity as a strong foundation for prioritizing conservation efforts. Second, inadequate sampling can lead to a failure to identify and test relevant taxonomic hypotheses, and thus fail to rigorously assess signatures of diversification and demography. Third, conservation phylogenetics (32), set within a broader lineage-based context that explicitly integrates historical signatures (e.g. demographic and spatial shifts), provides a more objective means of prioritizing management efforts (33). Finally, museums harbor an irreplaceable wealth of spatiotemporal data for deciphering changing conditions and informing conservation (9, 73). Comprehensive sampling reveals diversification that informs conservation. A requisite, but often overlooked, first step in any conservation study is establishing the systematic relationships and geographic limits of the taxon of concern (20). A key assumption in systematics is complete taxon sampling (29, 74, 75) to distinguish among 148
157 alternative phylogeographic hypotheses (11, 76, 77). By using comprehensive taxon sampling, assessing variation across multiple genetic loci (78, 79), and implementing an integrative approach that includes niche characterization (66, 80), we uncovered 21 divergent lineages across North American jumping mice (Fig. 2). Generally, lineages differed in niche space (SI Appendix, Table S3) and these are interpreted as ecologically inexchangeable. For example, the Uinta lineage (Z. p. utahensis), is sufficiently distinctive based on genetic and niche variation to warrant specific status via classic measures (81-84) and within a generalized lineage context (43, 44). Similarly, using this approach, and accounting for limited morphological variation (42), Z. h. preblei would be considered synonymous with Z. h. alascensis and Z. h. tenellus. We suggest that jumping mice taxonomy (41, 85) currently under-represents species-level variation with both phylogenetic and niche datasets implying management should focus on lineages (84, 86), rather than subspecies, as the requisite backdrop to conservation action. More specifically, several divergent lineages other than the one including Z. h. preblei should be carefully assessed and monitored. Signatures of diversification and demography contradict taxonomic assumptions. We used extended Bayesian sky-line analyses to assess historic demographic signals (Fig. 1D). The integrated molecular and niche approach reveals spatial shifts since the LGM (latitudinal, longitudinal, or elevational) that can be placed into four general models. [i] Demographic (4, 87) & Spatial (latitudinal) Expansion. The genetic signatures of Acadian, Appalachian, Boreal, Canadian, Great Plains, Northern (including Z. h. preblei), and the Northern Plains lineage (Table 2, Fig. 1D) significantly deviate from neutrality (88) with comparatively lower nucleotide diversity, increased haplotype diversity (87), 149
158 and recent population increases (SI Appendix, Fig. S3, (89, 90). Further, each lineage reflects spatial expansion from disjunct late-pleistocene ancestral ranges (Fig. 1C, Table 1, SI Appendix, Fig. S2). [ii] Demographic & Spatial Contraction (91). Conversely, the low-latitude and montane-associated Great Basin, Northern Sierra, Okanogan, Southern Cascades, Southern Rockies, and the Uinta lineages reflect signatures of demographic stasis or contraction with concordant spatial contraction during Holocene warming. [iii] Demographic Expansion with Elevational Shift. The Southern Sierra lineage recently experienced demographic expansion to higher elevations (not latitudes) since the LGM (86). [iv] Demographic Stability but Spatial Shift (84). Finally, the Coastal, Southern Plains, and the Southwestern lineage shifted from ancestral ranges, but experienced no significant demographic change. The Northern lineage extends from Colorado northwest to the Alaskan Peninsula (Fig. 1A), a distance of >4700 km and the broadest distributional range of all jumping mice (Table 1). Among 16 lineages with >5 haplotypes, the Northern lineage has the lowest haplotype diversity (h), lowest nucleotide diversity ( ), and fewest nucleotide differences (K). Together (Table 2) these metrics indicate recent demographic growth (4, 87). Further, populations across this wide range appear ecologically exchangeable (i.e., occupy equivalent niche space, SI Appendix, Table S2). Fossils dated to the Late Pleistocene from the Great Plains coincide with the paleodistribution models (Fig. 1C) (92) with the hind-cast narrow-range agreeing with low-density ancestral effective population sizes (Table 2, Fig. 1D). During the early Holocene as glaciers retreated, ancestors of the Northern lineage may have tracked suitable conditions westward from the Great Plains to regions along the Front Range of the Southern Rockies (49, 51, 55) 150
159 and northward to Alaska. Northward expansion signatures were detected in 6 other jumping mice lineages (Table 2), mirroring a common process (1, 4, 6, 87). However, no other zapodid reflects demographic expansion metrics near the magnitude of the Northern lineage (Table 2; Fig. S3). Morphologically-based taxonomy (41, 42) and previous molecular studies of Preble s jumping mice (49, 55) assumed that spatially adjacent subspecies were most closely related, leading to limited sampling of taxa (1/2 subspecies) and geographic breadth (<1/4 Z. hudsonius range) as the basis for the federal listing (52). In this case, spatially proximal subspecies are not necessarily closely related. Zapus h. preblei was described in 1954 based on 4 adult specimens (42). Although diagnostic morphological characters (42) broadly overlap with northern subspecies (i.e., Z. h. alascensis and Z. h. tenellus), those subspecies were never directly compared, likely due to their tremendous geographic distance from the southern Rocky Mountain populations. Instead taxonomic evaluation of the jumping mice (49, 51, 53, 55) compared Southern Rocky Mountains with adjacent Plains and Southern subspecies (i.e., Z. h. preblei against Z. h. campestris, Z. h. intermedius, Z. h. luteus, Z. h. pallidus). This study reinforces the need to assess evolutionary variation within a comprehensive historical-biogeographic context, as a first step in evaluating conservation status (23, 39, 93, 94) or exploring other processes (25, 26). Further, observations of morphological similarity across jumping mice were part of the basis for a proposal to remove recognition of all Z. hudsonius subspecies (95), but that conclusion was not incorporated in a formal taxonomic revision. Our tests of adaptive niche variation are across multiple populations of the Northern lineage that showed no statistically significant ecological differences (SI Appendix, Table S2). To 151
160 fully address conservation of North American jumping mice, a comprehensive taxonomic re-evaluation of all lineages and subspecies is needed and should include a set of tests that encompasses the emerging historical-biogeographic perspective, and more finely assesses hypotheses of both evolutionary independence and adaptive variation. Conservation prioritization informed by historical factors. Over seventy-five percent (16/21) of jumping mice lineages rank higher in conservation priority than the Northern lineage that includes the state and federally listed subspecies Z. h. preblei (Fig. 3). Furthermore, the 7 lineages (Acadian, Appalachian, Boreal, Canadian, Great Plains, Northern, Northern Plains) that experienced Model [i](i.e. Demographic and Spatial Expansion) are among the lowest conservation priorities (Fig. 3). Each of these lineages are recently diverged (Fig. 2, since Late-Pleistocene), have wide ranges that spatially expanded since LGM, reflect comparatively large N e, and experienced recent demographic growth (Table 2; SI Appendix, Fig. S3). Moreover, Z. h. preblei is ecologically exchangeable with far northern subspecies (e.g. Z. h. alascensis and Z. h. tenellus). Combined, these metrics and regionally updated IUCN scores, suggest the Northern lineage is Least Concern (LC = 0 threats; Weights = (40). However, given the ongoing management concerns in the Front Range of Colorado and Wyoming, we used the Near Threatened (NT = 0+ threats; Weights = 0.05, Fig. 3) for this lineage. In contrast, lineages that are endemic to southern mountains and mesic coasts have remained relatively stable over glacial cycles (Model iv) or contracted to higher elevations (Model iii). Both are histories that largely preserved accrued genetic variation and ecological differentiation. These signatures demonstrate that climate-mediated demographic histories (96, 97) are mirrored in genes and niches with the 5 jumping mice 152
161 lineages with highest extinction threat over the next century (Fig. 3) are endemic to lowlatitude montane regions (Allegheny, La Sal, Southwestern, and Uinta) and the Redwood Coast of California (Coastal). Among these, the neoendemic Southwestern lineage (USFWS candidate Z. h. luteus) has an order of magnitude higher conservation priority (Fig. 3) than the Northern lineage (using IUCN 100 (40, 98). The Allegheny (N. i. roanensis) lineage should have comparable priority over the Northern lineage, but has no protected status. Other jumping mice exhibiting higher conservation metrics, yet no protected status, include two populations of the La Sal lineage (Z. p. chrysogenys), the contracting Uinta lineage (Z. p. utahensis), and relict populations of the Coastal lineage in California (Z. t. eureka + Z. t. orarius). Thus, existing management plans targeting only Z. h. preblei may be missing key elements of evolutionary history. An integrative approach to conservation of zapodids should target distinct lineages at higher risk of extinction, particularly those that are endemic to regions with critical land use issues. Shrinking mesic habitats at lower latitudes are due to the synergy (99) between climate change ( ) and anthropogenic fragmentation (103) that may precipitate jumping mice declines (84, 104). Conversely, high-latitude lineages of zapodids are the result of expanded ranges during the warming phase of the Holocene epoch (4) and generally have lower extinction risk because of more limited human use of these landscapes. Taken together, these data may counter the proposed listing of Z. h. preblei under the ESA (105, 106) based on traditional measures of rarity, such as limited range for an ecologically and genetically discrete taxon (107, 108). Conservation efforts targeting jumping mice within the Front Range of Colorado and Wyoming (109) should be carefully re-evaluated in light of the projected wide distribution of the Northern lineage. 153
162 Localized population declines, as reported for Z. h. preblei (45, 110, 111), are problematic for mesic-associated organisms throughout the xeric environments of the West (104). These analyses identified lineages elsewhere with higher conservation priority, reinforcing the premise that management efforts should first identify and preserve the most ecologically and genetically divergent units (112). Furthermore, these results suggest management action should not rely principally on taxonomy that may be in need of revision (22) to more accurately reflect ecological distinction and evolutionary history. Specimen-based conservation remains undervalued. Finally, we underscore the point that museum collections directly facilitate and inform conservation efforts by providing temporal, spatial, and taxonomic breadth of samples. Integrative conservation analyses directly depend on widespread specimen representation in two phases: georeferenced occurrence records to project SDMs (113, 114) and high-quality specimens that preserve tissues and morphological features. Specimens link genes to the phenotype and the organism to the environment providing the necessary framework to refine our understanding of how phenotypes are interacting with changing conditions. Analyses that are spatiotemporally anchored by fossil specimens further highlight the value of integration across independent datasets to build robust taxonomies (43) and falsifiable measures of diversity, critical for any conservation effort (115). 154
163 ACKNOWLEDGMENTS We thank the CUERVO lab at the University of New Mexico plus the Matocq and Feldman labs at the University of Nevada Reno for valuable discussions and encouragement. John Demboski, Chris Feldman, Rob Guralnick, Enrique Lessa, Marjorie Matocq, Jim Patton, and Steve Poe provided critical reviews and valuable insights on a previous draft. US Fish and Wildlife Service biologists and staff provided a firmer understanding of conservation implications related to ESA mandates. Funding was provided by the Lloyd David and Carlye Cannon Wattis Foundation Internship (Denver Museum of Nature and Science), Graduate Research Development Grant from the Graduate Professional Student Association (UNM), New Mexico Department of Game and Fish Share with Wildlife Fund, National Science Foundation ( ), T&E Inc., and the US Fish and Wildlife Service. Several natural history museums loaned valuable vouchered specimens for this study, from which robust phylogenies and detailed SDMs were generated. 155
164 LITERATURE CITED 1. Hewitt G (2000) The genetic legacy of the Quaternary ice ages. Nature 405: Carnaval AC, Hickerson MJ, Haddad CFB, Rodrigues MT, & Moritz C (2009) Stability Predicts Genetic Diversity in the Brazilian Atlantic Forest Hotspot. Science 323(5915): Polly PD (2003) Paleophylogeography: The tempo of geographic differentiation in marmots (Marmota). Journal of Mammalogy 84(2): Lessa EP, Cook JA, & Patton JL (2003) Genetic footprints of demographic expansion in North America, but not Amazonia, during the Late Quaternary. Proceedings of the National Academy of Sciences of the United States of America 100(18): Hewitt GM (1999) Post-glacial re-colonization of European biota. Biological Journal of the Linnean Society 68(1-2): Hewitt GM (2004) Genetic consequences of climatic oscillations in the Quaternary. Philosophical Transactions of the Royal Society of London Series B- Biological Sciences 359(1442): Clark PU, et al. (2009) The Last Glacial Maximum. Science 325(5941): Galbreath KE, Hafner DJ, & Zamudio KR (2009) When cold is better: climatedriven elevation shifts yield complex patterns of diversification and demography in an alpine specialist (American Pika, Ochotona princeps). Evolution 63(11):
165 9. Moritz C, et al. (2008) Impact of a century of climate change on small-mammal communities in Yosemite National Park, USA. Science 322(5899): Hey J & Pinho C (2012) Population genetics and objectivity in species diagnosis. Evolution. 11. Hickerson MJ, et al. (2010) Phylogeography's past, present, and future: 10 years after Avise, Molecular Phylogenetics and Evolution 54(1): Knowles LL (2009) Statistical phylogeography. Annual Review of Ecology Evolution and Systematics 40: Schwartz MW (2008) The performace of the Endangered Species Act. Annual Review of Ecology and Systematics 39: Wood CC & Gross MR (2008) Elemental Conservation Units: Communicating extinction risk without dictating targets for Protection. Conservation Biology 22(1): Wilcove DS & Master LL (2008) How many endangered species are then in the United States. Frontiers in Ecology and the Environment 3(8): Willis KJ & Birks HJB (2006) What is natural? The need for a long-term perspective in biodiversity conservaiton. Science 314: Crozier RH (1997) Preserving the information content of species: genetic diversity, phylogeny and conservation worth. Annual Review of Ecology and Systematics 24: Nee S & May RM (1997) Extinction and the loss of evolutionary history. Science 278:
166 19. Stockwell CA, Hendry AP, & Kinnison MT (2003) Contemporary evolution meets conservation biology. Trends in Ecology & Evolution 18: Bradshaw CJA & Brook BW (2010) The conservation biologist's toolbox - principes for the design and analysis of conservation studies. Conservation Biology for All, eds Sodhi NS & Ehrich D (Oxford University Press, New York). 21. IUCN (2001) IUCN Red List Categories and Criteria: Version 3.1. ed Commission ISS (IUCN, Gland, Switzerland; Cambridge, UK), p 30 pp. 22. Gippoliti S & Amori G (2007) The problem of subspecies and biased taxonomy in conservation lists: the case of mammals. Folia Zoologica 56(2): Moritz C (1995) Uses of Molecular Phylogenies for Conservation. Philosophical Transactions of the Royal Society of London Series B-Biological Sciences 349(1327): Moritz C (1994) Defining 'Evolutionarily Significant Units' for conservation. Trends in Ecology & Evolution 9(10): Crandall KA, Bininda-Emonds ORP, Mace GM, & Wayne RK (2000) Considering evolutionary processes in conservation biology. Trends in Ecology & Evolution 15: Rader RB, Belk MC, Shiozawa DK, & Crandall KA (2005) Empirical tests for ecological exchangeability. Animal Conservation 8: Fraser DJ & Bernatchez L (2001) Adaptive evolutionrary conservation: towards a unified concept for defining conservation unit. Molecular Ecology 10:
167 28. Hird S, Kubatko L, & Carstens B (2010) Rapid and accurate species tree estimation for phylogeographic investigations using replicated subsampling. Molecular Phylogenetics and Evolution 57(2): Zwickl DJ & Hillis DM (2002) Increased taxon sampling greatly reduces phylogenetic error. Systematic Biology 51(4): Makowsky R, Marshall JC, Jr., McVay J, Chippindale PT, & Rissler LJ (2010) Phylogeographic analysis and environmental niche modeling of the plain-bellied watersnake (Nerodia erythrogaster) reveals low levels of genetic and ecological differentiation. Molecular Phylogenetics and Evolution 55(3): May RM (1990) Taxonomy as destiny. Nature Faith DP (2007) Phylogenetic diversity and conservation. Conservation Biology: Evolution in action, eds Carroll SP & Fox C (Oxford University Press, New York, NY). 33. Vane-Wright RI, Humphries CJ, & Williams PH (1991) What to protect? Systematics and the agony of choice. Biological Conservation 55: Winter M, Devictor V, & Schweiger O (2013) Phylogenetic diversity and nature conservation: where are we? Trends in Ecology & Evolution 1632: Ceballos G & Brown JH (1995) Global Patterns of Mammalian Diversity, Endemism, and Endangerment. Conservation Biology 9(3): Richardson DM & Whittaker RJ (2010) Conservation biogeography - foundations, concepts and challenges. Diversity and Distributions 16(3): Whittaker RJ, et al. (2005) Conservation biogeography: assessment and prospect. Diversity and Distributions 11:
168 38. Channell R & Lomolino MV (2000) Dynamic biogeography and conservation of endangered species. Nature 403(6765): Collen B, et al. (2011) Investing in evolutionary history: impementing a phylogenetic approach for mammal conservation. Philosophical Transactions of the Royal Society B-Biological Sciences 336(1578): Isaac NJB, Turvey ST, Collen B, Waterman C, & Baillie JEM (2007) Mammals on the EDGE: conservation priorities based on the threat and phylogeny. PLoS One 2(3): Holden ME & Musser GG (2005) Family Dipodidae. Mammal Species of the World, eds Wilson DE & Reeder DM (The Johns Hopkins University Press, Baltimore, Maryland), pp Krutzsch PH (1954) North American jumping mice (genus Zapus). University of Kansas Publications, Museum of Natural History 7(4): Fujita MK, Leache AD, Burbrink FT, McGuire JA, & Moritz C (2012) Coalescent-based species delimitaiton in an integrative taxonomy. Trends in Ecology & Evolution xxx(xxx):xxx-xxx. 44. de Queiroz K (2007) Species concepts and species delimitation. Systematic Biology 56(6): USFWS (2002) Endangered and threatened wildlife and plants; designation of critical habitat for the Preble's meadow jumping mouse (Zapus hudsonius preblei); proposed rule (Federal Register, Washington, D.C.), (Service DotI- USFaW). 160
169 46. USFWS (1998) Final rule to list the Preble's meadow jumping mouse as a Threatened Species (Federal Register, Washington, D.C.), (Service DotI- USFaW). 47. Johnson K (27 June 2004) Debate swirls around the status of a protected mouse. The New York Times. 48. Heilprin J (24 July 2006) Study bolsters protecting jumping mouse. USAToday. 49. King TL, et al. (2006) Comprehensive genetic analyses reveal evolutionary distinction of a mouse (Zapus hudsonius preblei) proposed for delisting from the US Endangered Species Act. Molecular Ecology 15(14): Ramey RR, Wehausen JD, Liu HP, Epps CW, & Carpenter LM (2006) Response to Vignieri et al. (2006): Should hypothesis testing or selective post hoc interpretation of results guide the allocation of conservation effort? Animal Conservation 9(3): Vignieri SN, et al. (2006) Mistaken view of taxonomic validity undermines conservation of an evolutionarily distinct mouse: a response to Ramey et al. (2005). Animal Conservation 9(3): Crifasi RR (2007) A subspecies no more? A mouse, its unstable taxonomy, and western riparian resource conflict. Cultural Geographies 14: Ramey RR, Wehausen JD, Liu HP, Epps CW, & Carpenter LM (2007) How King et al. (2006) define an 'evolutionary distinction' of a mouse subspecies: A response. Molecular Ecology 16(17): Martin A (2006) Advocacy dressed up as science: response to Ramey et al. (2005). Animal Conservation 9(3):
170 55. Ramey RR, Liu HP, Epps CW, Carpenter LM, & Wehausen JD (2005) Genetic relatedness of the Preble's meadow jumping mouse (Zapus hudsonius preblei) to nearby subspecies of Z. hudsonius as inferred from variation in cranial morphology, mitochondrial DNA and microsatellite DNA: implications for taxonomy and conservation. Animal Conservation 8: Scott JM, et al. (2007) Policy advocacy in science: Prevalence, perspectives, and implications for conservation biologists. Conservation Biology 21(1): Lackey RT (2007) Science, scientists, and policy advocacy. Conservation Biology 21(1): Doremus H (2010) The Endangered Species Act: static law meets dynamic world. Journal of Law & Policy 32: Industrial Economics I (2002) Economic impact analysis of critical habitat designation for the Preble's Meadow Jumping Mouse: Summary.). 60. Service FaW (2010) Endangered and Threatened Wildlife and Plants; Revised Critical Habitat for the Preble's Meadow Jumping Mouse in Colorado; Final Rule (Federal Register), (Interior Dot). 61. Industrial Economics I (2010) Economic analysis of critical habitat designation for Preble's Meadow Jumping Mouse in Colorad. in Final Economic Analysis ICambridge, MA). 62. Degnan JH & Rosenberg NA (2009) Gene tree discordance, phylogenetic inference and the multispecies coalescent. Trends in Ecology & Evolution 24(6):
171 63. Carstens BC & Knowles LL (2007) Estimating species phylogeny from gene-tree probabilities despite incomplete lineage sorting: An example from Melanoplus grasshoppers. Systematic Biology 56(3): Knowles LL & Carstens BC (2007) Delimiting species without monophyletic gene trees. Systematic Biology 56: Heled J & Drummond AJ (2010) Bayesian inference of species trees from multilocus data. Molecular Biology and Evolution 27(3): Franklin J (2010) Moving beyond static species distribution models in support of conservation biogeography. Diversity and Distributions 16(3): Kozak KH, Graham CH, & Wiens JJ (2008) Integrating GIS-based environmental data into evolutionary biology. Trends in Ecology & Evolution 23(3): Waltari E, et al. (2007) Locating Pleistocene refugia: comparing phylogeographic and ecological niche model predictions. Plos One 2(7):e Warren DL, Glor RE, & Turelli M (2008) Environmental niche equivalency versus conservatism: quantitative approaches to niche evolution. Evolution 62(11): Waples RS (1991) Definition of "Species" under the Endangered Species Act: application of pacific salmon. 71. Waples RS (1998) Evolutionary significant units, distinct population segments, and the endangered species act: reply to Pennock and Dimmick. Conservation Biology 12(3):
172 72. Pennock DS & Dimmick WW (1997) Critique of the evolutionarily significant unit as a definition for "distinct populaiton segments" under the US Endangered Species Act. Conservation Biology 11: Rubidge EM, et al. (2012) Climate-induced range contraction drives genetic erosion in an alpine mammal. Nature Climate Change 2: Poe S & Swofford DL (1999) Taxon sampling revisited. Nature 398(6725): Wiens JJ & Morrill MC (2011) Missing data in phylogentic analysis: Reconciling results from simulations and emperical data. Systematic Biology 60(5): Avise JC, et al. (1987) Intraspecific Phylogeography - the Mitochondrial-DNA Bridge between Population-Genetics and Systematics. Annual Review of Ecology and Systematics 18: Hewitt GM (2001) Speciation, hybrid zones and phylogeography - or seeing genes in space and time. Molecular Ecology 10(3): Brito P & Edwards SV (2009) Multilocus phylogeography and phylogenetics using sequence-based markers. Genetica 135(3): Edwards SV (2009) Is a new and general theory of molecular systematics emerging? Evolution 63(1): Scoble J & Lowe AJ (2010) A case for incorporating phylogeography and landscape genetics into species distribution modelling approaches to improve climate adaptation and conservation planning. Diversity and Distributions 16(3):
173 81. Baker RJ & Bradley RD (2006) Speciation in mammals and the genetic species concept. Journal of Mammalogy 87(4): Rissler LJ & Apodaca JJ (2007) Adding more ecology into species delimitation: Ecological niche models and phylogeography help define cryptic species in the black salamander (Aneides flavipunctatus). Systematic Biology 56(6): Raxworthy CJ, Ingram C, Rabibisoa N, & Pearson R (2007) Applications of ecological niche modeling for species delimitation: a review and empirical evaluation using Day Geckos (Phelsuma) from Madagascar. Systematic Biology 56: Malaney JL, Frey JK, & Cook JA (2011) The biogeographic legacy of an imperilled taxon provides a foundation for assessing lineage diversification, demography, and conservation genetics. Diversity and Distributions. 85. Hall ER (1981) The mammals of North America (John Wiley & Sons, New York, New York) 2nd Ed pp v-vi, Malaney JL, et al. (in press) Phylogeography of the western jumping mouse (Zapus princeps) detects deep lineages in the Southwestern United States. Journal of Mammalogy xxx(xxx):xxx-xxx. 87. Excoffier L, Foll M, & Petit RJ (2009) Genetic consequences of range expansions. Annual Review of Ecology Evolution and Systematics 40: Ramos-Onsins SE & Rozas J (2002) Statistical properties of new neutrality tests against population growth. Molecular Biology and Evolution 19(12): Heled J & Drummond AJ (2008) Bayesian inference of population size history from multiple loci. Bmc Evolutionary Biology
174 90. Drummond AJ, Rambaut A, Shapiro B, & Pybus OG (2005) Bayesian coalescent inference of past population dynamics from molecular sequences. Molecular Biology and Evolution 22(5): Arenas M, Ray N, Currat M, & Excoffier L (2012) Consequences of range contractions and range shifts on molecular diversity. Molecular Biology and Evolution. 92. Kurtén B & Anderson E (1980) Pleistocene Mammals of North America (Columbia University Press, New York). 93. Avise JC (2008) Three ambitious (and rather unorthodox) assignments for the field of biodiversity genetics. Proceedings of the National Academy of Sciences of the United States of America 105: Moritz C (2002) Strategies to protect biological diversity and the evolutionary processes that sustain it. Systematic Biology 51(2): Jones GS (1981) The systematics and biology of the genus Zapus (Mammalia, Rodentia, Zapodidae). PhD Dissertation PhD (Indiana State University, Terre Haute, Indiana). 96. Moritz C, Hoskin C, Graham CH, Hugall A, & Moussalli A (2005) Historical biogeography, diversity and conservation of Australia's tropical rainforest herpetofauna. Phylogeny and Conservation 8: Hugall A, Moritz C, Moussalli A, & Stanisic J (2002) Reconciling paleodistribution models and comparative phylogeography in the Wet Tropics rainforest land snail Gnarosophia bellendenkerensis (Brazier 1875). Proceedings 166
175 of the National Academy of Sciences of the United States of America 99(9): Mooers AO, Faith DP, & Maddison WP (2008) Converting endangered species categories to probabilities of extinction for phylogenetic conservation prioritization. PLoS One 3(11):e Mantyka-Pringle, Martin TG, & Rhodes JR (2011) Interactions between climate and habitat loss effects on biodiversity: a systematic review and meta-analysis. Global Change Biology X(X):xx-xx Ackerly DD, et al. (2010) The geography of climate change: implications for conservation biogeography. Diversity and Distributions 16(3): McDonald KA & Brown JH (1992) Using montane mammals to model extinctions due to global change. Conservation Biology 6(3): Thomas CD, et al. (2004) Extinction risk from climate change. Nature 427(6970): Andren H (1994) Effects of habitat fragmentation on birds and mammals in landscapes with different proportions of suitable habitat: a review. Oikos 71: Frey JK & Malaney JL (2009) Decline of the meadow jumping mouse (Zapus hudsonius luteus) in two mountain ranges in New Mexico. Southwestern Naturalist 54(1): ESA (1973) Endangered Species Act of 1973 (Washington, D.C ), (Service DotI-USFaW). 167
176 106. Haig SM, et al. (2006) Taxonomic considerations in listing subspecies under the US Endangered Species Act. Conservation Biology 20(6): Rabinowitz D (1981) Seven forms of rarity. The Biological Aspects of Rare Plant Conservation, ed Synge H (Wiley, Chichester, UK), pp Yu J & Dobson FS (2000) Seven forms of rarity in mammals. Journal of Biogeography 27: USF&WS (2003) Draft recovery plan Preble's Meadow Jumping Mouse (Zapus hudsonius preblei).) Trainor AM, Shenk TM, & Wilson KR (2007) Microhabitat characteristics of Preble's meadow jumping mouse high-use areas. Journal of Wildlife Management 71(2): Meaney CA, Ruggles AK, Lubow BC, & Clippinger NW (2003) Abundance, survival, and hibernation of preble's meadow jumping mice (Zapus hudsonius preblei) in Boulder County, Colorado. Southwestern Naturalist 48(4): May SE, Medley KA, Johnson SA, & Hoffman EA (2011) Combining genetic structure and ecological niche modeling to establish units of conservation: A case study of an imperiled salamander. Biological Conservation 144(5): Graham CH, Ferrier S, Huettman F, Moritz C, & Peterson AT (2004) New developments in museum-based informatics and applications in biodiversity analysis. Trends in Ecology & Evolution 19(9): Elith J, et al. (2006) Novel methods improve prediction of species' distributions from occurrence data. Ecography 29(2):
177 115. Isaac NJB, Mallet J, & Mace GM (2004) Taxonomic inflation: its influence on macroecology and conservation. Trends in Ecology & Evolution 19(9): Hafner DJ (1993) Reinterpretation of the Wisconsinan mammalian fauna and paleoenvironment of the Edwards Plateau, Texas. Journal of Mammalogy 74(1): IUCN (2003) Guideline for Applicaiton of IUCN Red List Criteria at Regional Levels: Version 3.0 (IUCN, Gland, Switzerland and Cambridge, UK) p 26 pp Guo Q, Liu Y, & Wieczorek J (2008) Georeferencing locality descriptions and computing associated uncertainty using a probabilistic approach. International Journal of Geographical Information Science 22(10): Clement M, Posada D, & Crandall KA (2000) TCS: a computer program to estimate gene genealogies. Molecular Ecology 9(10): Templeton AR, Crandall KA, & Sing CF (1992) A cladistic analysis of phenotypic associations with haplotypes inferred from restriction endonuclease mapping and DNA sequence data. III. Cladogram estimation. Genetics 132: Phillips SJ, Anderson RP, & Schapire RE (2006) Maximum entropy modeling of species geographic distributions. Ecological Modelling 190(3-4): DeBry RW & Sagel RM (2001) Phylogeny of Rodentia (mammalia) inferred from the nuclear-encoded gene IRBP. Molecular Phylogenetics and Evolution 19(2):
178 123. Lyons LA, Kehler JS, & O'Brien SJ (1999) Development of comparative anchor tagged sequences (CATS) for canine genome mapping. Journal of Heredity 90(1): Stephens M & Scheet P (2005) Accounting for decay of linkage disequilibrium in haplotype inference and missing-data imputation. American Journal of Human Genetics 76(3): Stephens M, Smith NJ, & Donnelly P (2001) A new statistical method for haplotype reconstruction from population data. American Journal of Human Genetics 68(4): Librado P & Rozas J (2009) DnaSP v5: a software for comprehensive analysis of DNA polymorphism data. Bioinformatics 25(11): Edgar RC (2004) MUSCLE: a multiple sequence alignment method with reduced time and space complexity. Bmc Bioinformatics 5: Lakner C, Van Der Mark P, Huelsenbeck JP, Larget B, & Ronquist F (2008) Efficiency of Markov chain Monte Carlo tree proposals in Bayesian phylogenetics. Systematic Biology 57(1): Huelsenbeck JP & Ronquist F (2005) Bayesian analysis of molecular evolution using MrBayes. Statistical Methods in Molecular Evolution: Posada D (2008) jmodeltest: phylogenetic model averaging. Molecular Biology and Evolution 25: Posada D & Buckley TR (2004) Model selection and model averaging in phylogenetics: Advantages of akaike information criterion and Bayesian approaches over likelihood ratio tests. Systematic Biology 53(5):
179 132. Nylander JAA, Wilgenbusch JC, Warren DL, & Swofford DL (2007) AWTY (are we there yet?): a system for graphical exploration of MCMC convergence in Bayesian phylogenetics. Bioinformatics 24(4): Drummond AJ & Rambaut A (2007) BEAST: Bayesian evolutionary analysis by sampling trees. Bmc Evolutionary Biology Huelsenbeck JP & Imennov NS (2002) Geographic origin of human mitochondrial DNA: Accommodating phylogenetic uncertainty and model comparison. Systematic Biology 51(1): Posada D & Crandall KA (2001) Intraspecific gene genealogies: trees grafting into networks. Trends in Ecology & Evolution 16(1): McCormack JE, Huang H, & Knowles LL (2009) Maximum likelihood estimates of species trees: How accuracy of phylogenetic inference depends upon the divergence history and sampling design. Systematic Biology 58(5): McCormack JE, Heled J, Delaney KS, Peterson AT, & Knowles LL (2011) Calibrating divergenece times on species trees versus gene trees: Implications for speciation history of Aphelocoma jays. Evolution 65(1): Ruez DR & Bell CJ (2004) First Pleistocene jumping mouse (Zapus, Zapodinae, Rodentia) from Utah. Western North American Naturalist 64(4): Klingener D (1966) Dipodoid rodents from the Valentine Formation of Nebraska. Occas Papers Mus Zool Univ Mich 644: Hibbard CW (1941) The Borchers fauna, a new Pleistocene interglacial fauna from Meade county, Kansas. Bull Univ Kansas State Geol Surv 38((7)):
180 141. Harington CR (2011) Quaternary cave faunas of Canada: a review of the vertebrate remains. Journal of Cave and Karst Studies 73(3): Nei M (1987) Molecular evolutionary genetics (Columbia University Press, New York, Chichester, West Sussex) pp Tajima F (1989) Statistical method for testing the neutral mutation hypothesis by DNA polymorphism. Genetics 123(3): Fu YX (1997) Statistical tests of neutrality of mutations against population growth, hitchhiking and background selection. Genetics 147(2): Ewens WJ (1972) The sampling theory of selectively neutral alleles. Theoretical Population Biology 3: Hijmans RJ, Cameron SE, Parra JL, Jones PG, & Jarvis A (2005) Very high resolution interpolated climate surfaces for global land areas. International Journal of Climatology 25(15): Waltari E & Guralnick RP (2009) Ecological niche modelling of montane mammals in the Great Basin, North America: examining past and present connectivity of species across basins and ranges. Journal of Biogeography 36(1): Guralnick RP, Wieczorek J, Beaman R, Hijmans RJ, & BioGeomancer Working G (2006) BioGeomancer: Automated georeferencing to map the world's biodiversity data. Plos Biology 4: Reddy S & Davalos LM (2003) Geographical sampling bias and its implications for conservation priorities in Africa. Journal of Biogeography 30:
181 150. Wiens JJ & Graham CH (2005) Niche conservatism: Integrating evolution, ecology, and conservation biology. Annual Review of Ecology Evolution and Systematics 36: Warren DL & Seifert SN (2011) Ecological niche modeling in Maxent: the importance of model complexity and the performance of model selection criteria Ecological Applications 21: Warren DL, Glor RE, & Turelli M (2010) ENMTools: a toolbox for comparative studies of enironmental niche models. Ecography 33: Maddison WP & Mooers AO (2007) Tuatara: Conservation priority in a phylogenetic context. Version Maddison WP & Maddison DR (2009) MESQUITE: a modular system for evolutionary analysis ( Version
 SDM for Northern lineage at the LGM. Note a significant expansion from ancestral range(s) to both high latitudes (e.g., Alaskan Peninsula) and Front Range of Colorado and Wyoming during the Holocene.")
182 FIGURES Fig. 1. (A) Potential contemporary distribution of the Northern lineage (includes USFWS threatened Z. h. preblei.) (B) Photograph of Preble s jumping mouse. (C) SDM for Northern lineage at the LGM. Note a significant expansion from ancestral range(s) to both high latitudes (e.g., Alaskan Peninsula) and Front Range of Colorado and Wyoming during the Holocene. Fossils ( ) dated to LGM on the Great Plains are consistent with the paleodistribution reconstruction with a narrow-range hind-cast projection. (D) Shallow divergence, wide range, and recent population changes (coalescent-based demographic tests: multilocus Extended Bayesian Skyline Plot and mtdna summary statistics) all reflect significant demographic and spatial expansion following Pleistocene deglaciation. 174
183 This common historical-biogeographic process led to widespread and genetically similar populations that represent a low extinction threat of the lineage. 175
 at nodes represent >.")
184 Napaeozapus insignis Zapus trinotatus Zapus princeps Zapus hudsonius Fig. 2. Coalescent-based Bayesian fossil-calibrated multilocus species-tree phylogeny (79) for North American jumping mice. Open circles ( ) at nodes represent >.95 posterior probability (PP), with skulls denoting fossil calibrations (92, 116) and bars highlighting 95% highest posterior density interval (HPD) of divergence time. Background shading corresponds to species with tips reflecting the 32 subspecies + 2 cryptic, significantly divergent lineages (*). Tip shapes represent 21 significantly divergent historicalbiogeographic lineages and correspond with other Tables and Figures. Taxa of conservation concern include (t) the federally threatened subspecies (Z. h. preblei) and (c) the federal candidate subspecies (Z. h. luteus). Grey boxes below reflect interglacial (H Holocene; S Sangamonian) and glacial periods (blue; I Illinoian; W Wisconsinan) 176
185 through the Pleistocene and corresponding Irvingtonian and Rancholabrean North American land mammal stages. 177
186 May's Distinctness N. insignis Z.princeps Z.trinotatus Z.hudsonius EDGE Fig. 3. Conservation prioritization (Evolutionarily Distinct + Globally Endangered EDGE vs. May s Distinctness) scores contrasted for 21 divergent North American jumping mice lineages. The lineage that includes the federally threatened taxon (Z. h. preblei green cross) is among the lowest conservation priorities using the IUCN 100 ranks-to-extinction probability transformation (40, 98). 178
187 TABLES Table. 1. Lineages with associated subspecies, range areas (km 2 ) and furthest distributed range (km) using 90% minimum presence threshold for contemporary and LGM median SDMs (see Fig. 1 and SI Appendix, Fig. S2), and updated regional IUCN 100 scores (40, 98, 117) following the ranks-to-extinction probability transformation. *Cryptic and un-described taxa (86). #Current range area based on georeference and associated uncertainty (118). Species & Lineage subspecies Current km 2 area LGM km 2 area km range IUCN 100 N. insignis Acadian insignis 499, ,711 1, Allegheny roanensis 450, , Canadian abietorum frutectanus saguenayensis 990, ,610 2,
188 Z. hudsonius Appalachian acadicus americanus ladas 907,822 53,898 2, Can. Shield canadensis 1,505, ,855 2, Northern alascensis preblei tenellus 2,421, ,388 4, N. Plains campestris hudsonius intermedius 2,166,740 1,020,983 2, S. Plains pallidus 430, , Southwestern luteus 208, , Z. princeps 180
189 Boreal idahoensis saltator 710, ,824 2, Great Basin cinereus curtatus oregonus 206, , Great Plains minor kootenayensis 624, ,904 1, La Sal chrysogenys 36 # N/A Okanogan Un-described* 38,523 60, S. Rockies princeps 204, ,724 1, Uinta utahensis 89, , Z. trinotatus Coastal eureka orarius 7,861 38,
190 N. Cascade trinotatus 115, , S. Cascade montanus 83, , N. Sierra Z. p. pacificus 29,675 66, S. Sierra Z. p. pacificus* 14,781 68,
191 Table. 2. Species and intraspecies, lineage-based molecular diversity indices for 762 mtdna samples (cytb gene). Indices include segregating sites (S), number of haplotypes (N h ), haplotype (h) and nucleotide (π) diversity, mean nucleotide differences (K), plus population equilibrium tests Tajima s D, Fu s F S, and Ramos-Onsins and Rozas R 2. *=P<0.05, **=P<0.01. Species a & Lineage N S N h h π K D F S R 2 N. insignis Acadian * ** * Allegheny 2 b 2 Canadian ** Z. hudsonius c Appalachian Canadian Shield 2 b 2 Northern ** ** * N. Plains ** ** * 183
192 S. Plains Southwestern Z. princeps c Boreal ** ** ** Great Basin * Great Plains * ** * La Sal 4 b 3 Okanogan S. Rockies * Uinta ** ** * Z. trinotatus Coastal
193 N. Cascade 1 b 1 N. Sierra S. Cascade S. Sierra * ** * a Species level demographic tests not conducted (violation of population assumption). b Sample size <5 and thus not tested for population indices. c Smaller values are due to the reduced (1006 bp) dataset of King et al. (49) missing data excluded. 185
194 SUPPLEMENTARY INFORMATION * 186
195 Fig. S1. Bayesian gene trees with posterior probabilities indicated on branches next to supported nodes ( ). Branches are colored for each species: grey N. insignis, green Z. hudsonius, blue Z. princeps, red Z. trinotatus. Genes include the mitochondrial cytochrome b gene (Cytb bp) and 4 nuclear introns and exons, including 346 bp of Apolipoprotein B (APOB), 824 bp of Breast Cancer Susceptibility (BCRA), 347 bp of Glucocerebrosidase (GBA), and 267 bp of the beta-myosin heavy chain (MYH2). Subspecies are indicated on the Cytb gene-tree for all monophyletic lineages (i.e. all nodes significant) but statistics removed for clarity (*). 187


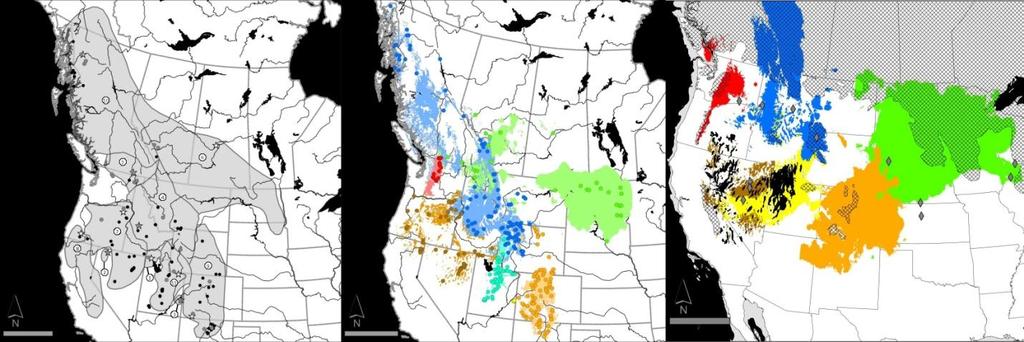
196 Subspecies Taxonomy Current SDM Paleodistribution N. insignis Z. hudsonius Z. princeps 188

197 Z. trinotatus Fig. S2. Subspecies (32 taxa) taxonomy and species distribution models (current & LGM) for 21 lineages of North American jumping mice (see Table 1). Left: The subspecies of each taxon is identified with an alphabetically ordered numerical hexagon, stars depict the type locality for each subspecies, grey symbols are sampling localities for constructing the species tree (e.g. topotypes), and small black symbols reflect mtdna (cytb) geographic samples used in demographic tests. Napaeozapus insignis: 1) N. i. abietorum, 2) N. i. frutectanus, 3) N. i. insignis, 4) N. i. roanensis, 5) N. i. saquenayensis. Zapus hudsonius: 1) Z. h. acadicus, 2) Z. h. alascensis, 3) Z. h. americanus, 4) Z. h. campestris, 5) Z. h. canadensis, 6) Z. h. hudsonius, 7) Z. h. intermedius, 8) Z. h. ladas, 9) Z. h. luteus, 10) Z. h. pallidus, 11) Z. h. preblei, 12) Z. h. tenellus. Zapus princeps: 1) Z. p. cinereus, 2) Z. p. chrysogenys, 3) Z. p. curtatus, 4) Z. p. idahoensis, 5) Z. p. kootenayensis, 6) Z. p. minor, 7) Z. p. oregonus, 8) Z. p. pacificus, 9) Z. p. princeps, 10) Z. p. saltator, 11) Z. p. utahensis. Zapus trinotatus: 1) Z. t. eureka, 2) Z. t. montanus, 3) Z. t. orarius, 4) Z. t. trinotatus. Note Z. p. pacificus range depicted given cryptic diversity recently documented in the Sierra Nevada s (86) and the Okanagan lineage has no described subspecies but overlaps with the far northeastern range of Z. h. trinotatus. Center: Current SDMs for lineages of each species. Symbols are localities used in 189
198 constructing the model and correspond with other Tables and Figures. Right: Projected Paleodistributions of lineages for each species. Diamonds depict fossils that correspond to the Late Pleistocene and Early Holocene transition period (92) for each species. 190
 for North American jumping mice lineages showing")
 begins on the left and progresses to the right in")
 and dashed (median) lines reflect estimates effective population")
 is indicated with a blue")
199 A C B D Fig. S3. Bayesian skyline plots (mtdna) for North American jumping mice lineages showing effective population size (scaled by mutation rate) plotted as a function of time. Time 0 (present) begins on the left and progresses to the right in substitutions per million years. Colored (mean) and dashed (median) lines reflect estimates effective population size with gray lines denoting the 95% credibility interval (CI). The position of the Last Glacial Maximum (~21 ka) is indicated with a blue vertical line. [A] Napaeozapus insignis lineages, [B] Zapus hudsonius lineages, [C] Zapus princeps lineages, [D] Zapus trinotatus lineages. 191
200 A B 192
201 Fig. S4. [A] Northern lineage, mtdna cytochrome b gene haplotype network via statistical parsimony (119, 120). This dataset was spatially and taxonomically sampled [B] and reveals recent demographic expansion to the Front Range of the southern Rockies and the far North for the Northern lineage. Capital letters reflect data (20 haplotypes) from King et al. (49) and lower case letters (13 haplotypes) were detected in this study. Asterisks (*) are inferred haplotypes due to data discrepancies (see methods and materials). Size is proportional to frequency with those >10 placed inside the symbol. Colors mirror morphological-based nominal (42) subspecies (dark grey = Z. h. alascensis, white = Z. h. preblei, light grey = Z. h. tenellus) and each branch is proportional to one mutation. 193
202 Table. S1. Conservation phylogenetics, within a broader coalescent framework, was used to define priority scores by updating regional IUCN scores and then ranking divergent jumping mice lineages. Population size changes include, I increasing, S stable, D declining, and? unknown. High threats to extinction (red) include declining population(s) or small range(s), low threats (orange) are stable populations and medium ranges (or unknown -?), and non-threats (white) include increasing populations and large range. Plus symbols (+) associated with threats highlight the condition where taxa meet the lower criteria but localized population(s) experience a threat. For example, the Northern lineage meets the Least Concern (LC) criteria but given localized declines and defined conservation concerns in the Front Range (i.e. Z. h. preblei) permits using Near Threatened (NT; i.e to 0.01). Other criteria include Threatened (TH), Endangered (EN), and Critically Endangered (CE). Weighting (W) scheme follows the IUCN 100 ranks-toextinction probability transformation (98). W Threats 3+ = CE = EN = TH Historical Δ in population size I S(?) D Contemporary Δ in population size I S(?) D Relative Range Lg Md Sm Historical Range Δ = NT = LC 194

203 Frequency Table. S2. Measures of niche overlap (ecological exchangeability), Warren s I and Relative Ranks (RR) between subspecies comprising the Northern lineage. Values near 1.0 are considered highly exchangeable versus near 0.0 are considered inexchangeable. Significance (niche identity) tests were conducted with 100 pseudo-replicates of randomized localities for paired taxa but no comparison was significantly different suggesting niche space is analogous across all taxa pairs (figure). Jumping mice populations along the Front Range appear to be ecologically exchangeable with populations in the far north. Northern lineage taxa pairs I RR Z. h. alascensis vs. Z. h. preblei Z. h. alascensis vs. Z. h. tenellus Z. h. preblei vs. Z. h. tenellus Relative Ranks Niche Overlap 195
204 Table. S3a-d. Bioclimatic variables ranked according to their overall model contribution, highest, lowest, and decreased gain based on a jackknife test of variable importance, plus mean area under receiver operating curve (AUC) and standard deviation from 20 replicate Maxent runs for the North American jumping mice lineages, separated by nominal species. Asterisks (*) highlight the variable with the highest permutation importance. Table S3a. Napaeozapus insignis lineages Rank Acadian Allegheny Canadian Bio1* 48.3 Bio1* 26.6 Bio Bio Bio Bio Bio Bio Bio Bio9 4.4 Bio Bio Bio8 4.3 Bio8 6.0 Bio Bio Bio9 5.5 Bio Bio7 0.1 Bio7 5.2 Bio2 196
205 8 0.2 Bio3 0.0 Bio2 4.1 Bio Bio Bio Bio Bio2 0.0 Bio Bio3* Bio Bio3 1.9 Bio18 Highest Gain Bio15 Bio15 Bio17 Lowest Gain Bio9 Bio9 Bio8 Decreased Gain Bio15 Bio15 Bio1 AUC (0.007) (0.009) (0.066) 197
206 Table S3b. Zapus hudsonius lineages Rank Appalachia Canadian Shield Northern N. Plains S. Plains Southwestern Bio Bio Bio Bio Bio Bio1* Bio Bio Bio Bio Bio Bio Bio17* 10.5 Bio Bio Bio Bio Bio Bio Bio19* 9.3 Bio Bio Bio3* 9.5 Bio Bio Bio1 6.9 Bio1 6.4 Bio7 5.8 Bio Bio Bio Bio8 6.5 Bio8 5.9 Bio Bio7 4.9 Bio Bio2 2.4 Bio3 6.1 Bio7* 4.3 Bio19* 2.8 Bio Bio Bio Bio Bio2 3.0 Bio Bio Bio Bio7 1.2 Bio Bio Bio Bio8 0.6 Bio Bio9 1.1 Bio2 4.0 Bio Bio2 0.4 Bio Bio16 198
207 Bio8 0.4 Bio7 2.6 Bio Bio3 0.2 Bio2 0.2 bio18 Highest Gain Bio15 Bio19 Bio9 Bio8 Bio1 Bio3 Lowest Gain Bio8 Bio7 Bio2 Bio15 Bio15 Bio18 Decreased Gain Bio1 Bio9 Bio9 Bio1 Bio1 Bio3 AUC (SD) (0.015) (0.006) (0.020) (0.009) (0.001) (0.002) 199
208 Table S3c. Zapus princeps lineages Rank Boreal Great Basin Great Plains Okanogan S. Rockies Uinta Bio Bio Bio Bio Bio Bio Bio Bio18* 9.4 Bio16* 36.4 Bio Bio Bio Bio Bio1 6.9 Bio2 8.1 Bio1 7.1 Bio Bio Bio Bio8 6.3 Bio Bio Bio2 8.7 Bio Bio7 4.9 Bio Bio Bio Bio7 7.1 Bio Bio Bio Bio Bio3* 3.2 Bio Bio Bio Bio2 3.4 Bio9 1.6 Bio2 3.1 Bio Bio Bio18* 2.7 Bio3 1.7 Bio3 0.6 Bio Bio Bio Bio Bio Bio7 0.0 Bio Bio Bio Bio2 1.2 Bio Bio Bio Bio9 1.1 Bio7 200
209 Bio9 0.9 Bio7 1.4 Bio8 0.0 Bio7 0.9 Bio8 0.8 bio19 Highest Gain Bio3 Bio9 Bio1 Bio8 Bio3 Bio3 Lowest Gain Bio16 Bio16 Bio8 Bio2 Bio8 Bio16 Decreased Gain Bio3 Bio9 Bio1 Bio8 Bio3 Bio1 AUC (0.003) (0.041) (0.043) (0.001) (0.002) (0.002) 201
210 Table S3d. Zapus trinotatus lineages Rank Coastal N. Cascade N. Sierra S. Cascade S. Sierra Bio Bio Bio9* 30.9 Bio Bio Bio Bio bio Bio Bio Bio Bio Bio Bio Bio Bio9 6.8 Bio Bio Bio1 9.6 Bio Bio Bio Bio2 3.9 Bio18* 9.5 Bio Bio8 2.5 Bio2 3.1 Bio Bio Bio1* Bio1 1.2 Bio7 2.8 Bio Bio7 4.4 Bio Bio2 0.3 Bio1* 1.6 Bio8 1.7 Bio Bio Bio3 0.2 Bio Bio1 1.4 Bio3 1.1 Bio Bio17* 0.1 Bio8 0.8 Bio3 0.4 bio8 0.1 Bio3 202
211 Bio Bio3 0.0 Bio7 0.0 Bio2 0.0 Bio16 Highest Gain Bio19 Bio19 Bio19 Bio19 Bio8 Lowest Gain Bio2 Bio18 Bio17 Bio2 Bio2 Decreased Gain Bio18 Bio18 Bio18 Bio18 Bio1 AUC (0.001) (0.001) (0.036) (0.001) (0.001) 203
212 Table. S4. Molecular data, character variation, and nucleotide substitution model selected using Bayesian Information Criterion (BIC) for 92 samples of North American jumping mice. Molecular marker Characters Variable characters Parsimony informative characters Substitution model APOB T92 + BCRA HKY + Cytb GTR + I + GBA JC + MYH T
213 CONCLUSIONS Summary In chapter 1 (Malaney et al. 2012), I tested alternative historical biogeographic scenarios proposed for a southwestern montane endemic using coalescent simulations (e.g. Parametric Bootstrap). Then, using SDMs and projecting models into the past I reconstruct the LGM paleodistribution and link fossils as spatiotemporal anchors to establish the origination of the New Mexico Meadow Jumping Mouse (Zapus hudsonius luteus). Results suggest Z. h. luteus diverged from Z. h. pallidus (not Z. h. preblei) at the LGM on the Edwards Plateau followed by colonization of the montane regions of the American Southwest. In chapter 2 (Malaney et al. in press), I tested alternate models of divergence, again using coalescent simulations, to establish that populations of the Western Jumping Mouse (Z. princeps) in the western United States have been long divergent in an allopatric model. However, not all populations have been stagnant as northern populations have a shallower history with demographic signatures consistent with Holocene expansion. I also detected cryptic variation in the Sierra Nevada s of California where these populations reflect a signal of diversification closer to the coastal Pacific Jumping Mouse (Z. trinotatus) than other populations of Z. princeps. In chapter 3 (Malaney and Cook in review), I used complete taxon sampling across all North American jumping mice subspecies and across geography, but coupled with contemporary and paleodistributions (SDMs) to identify the signatures of various lineages that may be important in conservation prioritization. Signatures detected and implemented in conservation assessment include recent and historic declines in both 205
214 population size and geographic range. When signatures are coupled with the phylogeny we are better able to objectively assess extinction threats for both recently and anciently diverged lineages. Results from this work have important implications given that conservation planning is often predicated on a taxonomy that generally lacks an understanding of the dynamic biogeographic past and often fails to account for evolutionary history. Whereas, linking comprehensive sampling, coalescent-based analyses, species distribution modeling, and fossil evidence points to a drastic shift in understanding conservation priorities and highlights a fundamental concept: systematics coupled with biogeographic history should inform conservation. 206
215 Taxonomic implications EXPLORING THE SPECIES DELIMITATION (AND DEFINITION) CONTINUUM USING AN INTEGRATIVE APPROACH The three chapters of my dissertation are linked by a broader set of ideas related to incipient speciation and species delimitation. Species definitions and operational criteria reflect variations on how evolutionary diversification is described and species delimitation can be controversial as evidenced by rancorous debates related to the species definition (de Queiroz 1998, 2007). Jumping mice serve as an example of this debate due to the controversial listing of Preble s Jumping Mouse (Z. h. preblei). In 1998, this subspecies was listed as federally threatened (USFWS 2002, 2010, 1998). Subsequent to listing efforts and in response to concerns about whether Front Range populations were a discrete subspecies, two studies found contradicting evidence of subspecies validity using analogous datasets (King et al. 2006; Ramey et al. 2005). Both studies implemented a limited sampling strategy predicated on the assumption that geographically adjacent subspecies were most closely related. Following these contradictory studies, further debates around this controversial listing boiled over into the incipient-species taxonomic debate (Crifasi 2007; Ramey et al. 2006; Vignieri et al. 2006). Still, others debated the use of statistics (Brosi and Biber 2009; Skalski et al. 2008) and issues related to policy advocacy (Carolan 2008; Scott et al. 2007) and economic impacts (Foulke et al. 2010; Industrial Economics 2010, 2002) that now are projected to top $440 million by the end of Here, I aim to update the taxonomy of North American jumping mice using sound theoretical and statistical contexts that account for evolutionary history and echoes the 207
216 perspective of Adaptive Evolutionary Conservation (AEC; (Fraser and Bernatchez 2001). My efforts also reflect the need for an integrative taxonomy (Fujita et al. 2012; Padial et al. 2010). However this study differs from previous research by using a comprehensive taxon sampling approach (all subspecies) and implementing a coalescent-based context that harnesses the strength of multiple independent molecular datasets to assess evolutionary relatedness and divergence times. Once the phylogeny is established, I use phylogenetically-informed species distribution modeling (SDM) to assess if ecological variation mirrors evolutionary divergence. The advantage of this approach is that it emphasizes evolutionary relationships and accounts for ecological differences within the broader context of all jumping mice while simultaneously assessing if taxonomy accurately reflects phylogeographic variation. Jumping mice have received national attention and have been considered iconic for conservation definitions and actions implemented by the USFWS (Foulke et al. 2010). However, in chapter 3, I highlighted (Malaney and Cook in review) there are other, more divergent, jumping mice lineages that potentially face serious threats, but that currently have no conservation status. Consequently, I apply the General Lineage Concept to update the taxonomy of the North American jumping mice (Zapodidae) and identify 14 statistically significantly divergent lineages (genetic and niche) that should be elevated to species level (Fig 1 & 2). I also explore a hierarchical set of ideas to include Evolutionary Significant Units (ESUs) within species and Distinct Population Segments (DPSs) within ESUs. For example, Z. h. preblei may be considered a DPS in the Front Range, within a broader Northern lineage (ESU; Fig 3). However the Northern lineage is divergent from 208
217 neighboring Northern Plains and Canadian Shield lineages (see Chapter 3) reflecting deeper histories and combined the three make up neo Z. hudsonius. My dissertation data suggest two specific conclusions related to North American jumping mice taxonomy. First, the morphological-based jumping mice taxonomy significantly under represents geographic variation in both DNA and niches and fails to reflect evolutionary and biogeographic history; a type I error (Felsenstein 2008; Skalski et al. 2008). Second, conservation predicated on morphological-based taxonomic understandings (i.e. subspecies) is potentially missing alternative units important for preservation with a changing climate; a type II error (Brosi and Biber 2009). These results echo the need to reduce ambiguity associated with subspecies-level classification (Haig et al. 2006) given the poor philosophical backbone, inconsistent execution, trinomial handicap (requires frequent taxonomic revisions), and most important, explicit lack of historical perspective. Consequently, I advocate abandoning the subspecies taxonomic distinction and provide an empirical example of where hierarchical divisions (i.e., species ESU DPS) can be placed within a more-powerful integrative context. More broadly, my results reflect the perspective that a more objective, yet integrative, taxonomic scope is needed to aid in identifying imperiled organisms and better clarify conservation considerations that may enhance ESA decisions. Further, an integrative and hierarchical approach should facilitate communication related to the classification across the taxonomic continuum, more fully explore the processes of speciation, and undercut the species (and infraspecies) concept debate, that combined, may provide fewer impediments to conservation efforts. 209
218 In conclusion, my dissertation detected deep molecular divergence across Z. princeps and Z. trinotatus that is accentuated over the southern portion of current distributions in western North America, reflecting deeper, allopatric divergence (Fitzpatrick et al. 2009; Fitzpatrick and Turelli 2006; Wiley and Lieberman 2011). Conversely, Z. hudsonius reflects a signature of latitudinal fluctuations over the last glacial cycle and preliminary signals of repetitive secondary contact may suggest the homogenization hypothesis (Nosil 2008) resulting in shallower molecular phylogenetic signal. The wide range of jumping mice provides opportunities to test hypotheses related to incipient speciation using multi-locus models and coalescent techniques (Carstens et al. 2005; Lessa et al. 2003) and further refined questions related to environmental drivers of diversification. Refinement of the persistent allopatric hypothesis includes testing among specific vicariant speciation models but also serves as a working hypothesis to explore concerted signatures among co-distributed species. My data suggest geographic separation between southern lineages has been a dominant and persistent force shaping divergence in jumping mice and presumably other sympatric mammals. Whether these vicariant signatures are suggestive of a common process that is spatially and temporally shared across co-distributed mammals, versus simply idiosyncratic responses to fluctuating climate is explored and summarized next. These data place jumping mice divergence within the context of montane mammal diversification in North America. 210
219 Comparative phylogeography LINKING SIGNATURES ACROSS JUMPING MICE AND HIGHLIGHTING BIOGEOGRAPHIC PROCESSES OF DIVERGENCE IN NORTH AMERICAN BOREAL MAMMALS Processes resulting in speciation or extinction and mechanisms of community assembly across the landscape have long fascinated biogeographers (Lomolino et al. 2006; Merriam 1895; Simpson 1940; Wallace 1876). Isolated systems have provided the foundations for biogeographic theory in identifying the principal processes of colonization versus extinction that both explain and predict factors affecting species richness of natural communities (Brown 1971; Lomolino et al. 1989; Lomolino and Davis 1997). Key factors contributing to the study of island biogeography include the spatial and temporal histories of organisms (Lomolino 1984; MacArthur and Wilson 1967) which suggests that some communities may be structured or persistent over the long-term. Conversely, fossil evidence suggests there were few historical communities that are analogs of today, implying populations and species distributions are dynamic and ephemeral (Graham et al. 1996) but not all agree (Lyons 2003). Comparative phylogeography is well suited to test specific hypotheses of spatial and temporal dynamics responsible for structuring communities, especially communities restricted to geographic regions such as the montane island systems of the West (Avise et al. 1987; Gutierrez-Garcia and Vazquez-Dominguez 2011; Hickerson et al. 2010). In general, these systems (Fig. 4) have been referred to as montane- or sky-islands (DeChaine and Martin 2005; Knowles 2000; McCormack et al. 2009). 211
220 Western North America has a diverse biota that is the product of complex evolutionary and environmental processes (Lomolino et al. 2006). A suite of boreal mammals (Fig. 4) are distributed from the sky islands of the American southwest and Great Basin northward through most of mountainous western North America to northern Canada and Alaska (Hall 1981; McCormack et al. 2009; Merriam 1892). Given the vast range, variable topography and dynamic glacial history, this community is likely to have complex demographic signatures reflected in DNA because levels of connectivity and population sizes have changed (Hewitt 1999, 2001; Waltari and Guralnick 2009). My aim is to characterize and summarize the phylogeographic relationships among boreal mammals to provide a set of insights into the historical events responsible for triggering lineage diversification, the timing and directionality of lineage expansion or contraction, and phylogenetic congruence (or lack thereof) among mammals in major geographic areas in western North America. Using phylogenetic techniques, I documented a consistent set of phylogenetic signatures across boreal mammals (Fig. 5) indicative of spatial breaks and temporal events that may have shaped the geographic distribution of genetic diversity. More specifically, northern populations are the result of post-pleistocene re-colonization of deglaciated terrains (Hewitt 2004; Lessa et al. 2003; Runck and Cook 2005) and these populations are generally less disjunct, than southern peripheral populations that are isolated at higher elevations at lower latitudes (Brown 1971; Malaney et al. in press). I documented significant demographic expansion across all boreal mammals for the northern lineages, which is a common signature (Lessa et al. 2003). However, the isolated montane habitats within xeric western environments harbor populations of boreal 212
221 associated mammals that reflect a deeper history of divergence (i.e., a signature of ancient vicariance). These community level analyses suggest that boreal mammals evolved over the last several glacial periods largely as a cohesive unit, with exceptions, rather than as independent species with idiosyncratic responses. In all taxa, I document a distinct east-west split that generally dates to Middle Pleistocene and precedes subsequent divergence of the Late Pleistocene. The southern clade is always closer to the eastern/continental clade than to the western/coastal clade and where present, tends to be older than eastern/continental clade. Continental clades extending into the Pacific Northwest generally originate from further east and not from southern or western clades. Pulses of diversification include a progression of an early eastern lineage, followed by a coastal and continental split further west, and a subsequent southwestern divergence. Timing of divergent splits is coincident with periodicity of Pleistocene cycling (Fig. 1D). Among the taxa I examined, all reflect cladogenic events coincident with warmer interglacial periods and not cooler glaciations. Given many species are known to maintain niche conservatism (Hadly et al. 2009; Wiens 2004; Wiens and Graham 2005), boreal mammals may have shifted to higher elevations during warmer interglacial periods reinforcing geographic variation during isolation coupled with reduced effective population sizes. Recolonizations of northern deglaciated (leading edge) areas are typically via populations that represent the continental clade from the Midwest. These northern populations tend to exhibit significant signatures of demographic and range expansion during the Holocene across boreal mammals. However, in other organisms within the region significant signatures of demographic expansion do not always coincide with range expansion reflecting a complex signature in 213
222 Northwestern North America (Brunsfeld et al. 2001; Carstens et al. 2005). A fundamental understanding of the processes shaping geographic variation is critical for addressing questions ranging from community assembly to speciation, and also applied to conservation management. The deep mitochondrial divergence observed in some taxa would warrant species status with the lineage-based taxonomic framework (see taxonomic implications above), but should be tested with independent nuclear markers, and combined with niche models, morphology, and natural history criteria. However, these deeper signatures have conservation implications for boreal mammals as many clades are isolated at the highest elevations, and presumably relatively smaller population sizes. With projections of generally warmer conditions over the next century and dwindling high elevation montane and riparian habitats in the west (Ackerly et al. 2010), conservation efforts and monitoring programs should focus on the future of these species and lineages. Over the last century, mammals have generally moved to higher elevations (Moritz et al. 2008) and continued anthropogenic mediated climate change will likely force some species extinctions (Beever et al. 2010). Species that persist will likely face genetic erosion as observed in alpine organisms (Rubidge et al. 2012) with dwindling populations. Continued efforts to systematically monitor and preserve these deep evolutionary legacies within the sky-islands of the west should be a management priority. 214
223 LITERATURE CITED ACKERLY, D. D., et al The geography of climate change: implications for conservation biogeography, Diversity and Distributions 16: AVISE, J. C., et al Intraspecific Phylogeography the Mitochondrial DNA Bridge between Population Genetics and Systematics, Johnston, R. F. (Ed.). Annual Review of Ecology and Systematics, Vol. 18. Ix+540p. Annual Reviews, Inc.: Palo Alto, California, USA. Illus: BEEVER, E. A., C. RAY, P. W. MOTE, and J. L. WILKENING Testing alternative models of climate-mediated extirpations, Ecological Applications 20: BROSI, B. J., and E. G. BIBER Statistical inference, Type II error, and decision making under the US Endangered Species Act, Frontiers in Ecology and the Environment 7: BROWN, J. H Mammals on mountaintops - nonequilibrium insular biogeography, American Naturalist 105: BRUNSFELD, S. J., J. SULLIVAN, D. E. SOLTIS, and P. S. SOLTIS Comparative phylogeography of northwestern North America: A synthesis, Pp in Integrating ecology and evolution in a spatial context (J. Silvertown and J. Antonovics, eds.). Blackwell Publishing, Williston, Vermont. CAROLAN, M. S The politics in evironmental science: The Endangered Species Act and the Preble's mouse controversy, Environmental Politics 17: CARSTENS, B. C., S. J. BRUNSFELD, J. R. DEMBOSKI, J. M. GOOD, and J. SULLIVAN Investigating the evolutionary history of the Pacific Northwest mesic forest 215
224 ecosystem: Hypothesis testing within a comparative phylogeographic framework, Evolution 59: CRIFASI, R. R A subspecies no more? A mouse, its unstable taxonomy, and western riparian resource conflict, Cultural Geographies 14: DE QUEIROZ, K The general lineage concept of species, species criteria, and the process of speciation: a conceptual unification and terminological recommendations, Pp in Endless Forms: Species and Speciation (D. J. Howard and S. H. Berlocher, eds.). Oxford University Press, New York. DE QUEIROZ, K Species concepts and species delimitation, Systematic Biology 56: DECHAINE, E. G., and A. P. MARTIN Historical biogeography of two alpine butterflies in the Rocky Mountains: broad-scale concordance and local-scale discordance, Journal of Biogeography 32: FELSENSTEIN, J Comparative methods with sampling error and within-species variation: Contrasts revisited and revised, American Naturalist 171: FITZPATRICK, B. M., J. A. FORDYCE, and S. GAVRILETS Pattern, process and geographic modes of speciaiton, Journal of Evolutionary Biology 22: FITZPATRICK, B. M., and M. TURELLI The geography of mammalian speciation: Mixed signals from phylogenies and range maps, Evolution 60: FOULKE, T., D. T. TAYLOR, and R. H. COUPAL Chapter 6: Modeling the economic impacts of critical habitat designationin New perspectives on agri-environmental policies: a multidisciplinary and transatlantic approach. Routledge, New York. 216
225 FRASER, D. J., and L. BERNATCHEZ Adaptive evolutionrary conservation: towards a unified concept for defining conservation unit, Molecular Ecology 10: FUJITA, M. K., A. D. LEACHE, F. T. BURBRINK, J. A. MCGUIRE, and C. MORITZ Coalescent-based species delimitaiton in an integrative taxonomy, Trends in Ecology & Evolution 27: GRAHAM, R. W., et al Spatial response of mammals to late quaternary environmental fluctuations, Science 272: GUTIERREZ-GARCIA, T., and E. VAZQUEZ-DOMINGUEZ Comparative phylogeography: Designing studies while surviving the process, Bioscience 61: HADLY, E. A., P. A. SPAETH, and C. LI Niche conservatism above the species level, Proceedings of the National Academy of Sciences of the United States of America 106: HAIG, S. M., et al Taxonomic considerations in listing subspecies under the US Endangered Species Act, Conservation Biology 20: HALL, E. R The mammals of North America. Vol. 2, 2nd ed. John Wiley & Sons, New York, New York. HEWITT, G. M Post-glacial re-colonization of European biota, Biological Journal of the Linnean Society 68: HEWITT, G. M Speciation, hybrid zones and phylogeography - or seeing genes in space and time, Molecular Ecology 10:
226 HEWITT, G. M Genetic consequences of climatic oscillations in the Quaternary, Philosophical Transactions of the Royal Society of London Series B-Biological Sciences 359: HICKERSON, M. J., et al Phylogeography's past, present, and future: 10 years after Avise, 2000, Molecular Phylogenetics and Evolution 54: INDUSTRIAL ECONOMICS, I Economic impact analysis of critical habitat designation for the Preble's Meadow Jumping Mouse: Summary. INDUSTRIAL ECONOMICS, I Economic analysis of critical habitat designation for Preble's Meadow Jumping Mouse in Coloradin Final Economic Analysis I, Cambridge, MA. KING, T. L., et al Comprehensive genetic analyses reveal evolutionary distinction of a mouse (Zapus hudsonius preblei) proposed for delisting from the US Endangered Species Act, Molecular Ecology 15: KNOWLES, L. L Tests of Pleistocene speciation in montane grasshoppers (genus Melanoplus) from the sky islands of western North America, Evolution 54: LESSA, E. P., J. A. COOK, and J. L. PATTON Genetic footprints of demographic expansion in North America, but not Amazonia, during the Late Quaternary, Proceedings of the National Academy of Sciences of the United States of America 100: LOMOLINO, M. V Mammalian Island Biogeography - Effects of Area, Isolation and Vagility, Oecologia 61:
227 LOMOLINO, M. V., J. H. BROWN, and R. DAVIS Island biogeography of montane forest mammals in the American Southwest, Ecology 70: LOMOLINO, M. V., and R. DAVIS Biogeographic scale and biodiversity of mountain forest mammals of western North America, Global Ecology and Biogeography Letters 6: LOMOLINO, M. V., B. R. RIDDLE, and J. H. BROWN Biogeography, 3rd ed. Sinauer Associates, Sunderland, Massachusetts. LYONS, S. K A quantitative assessment of the range shifts of Pleistocene mammals, Journal of Mammalogy 84: MACARTHUR, R. H., and E. O. WILSON The Theory of Island Biogeography. Princeton University Press, Princeton, N.J. MALANEY, J. L., C. J. CONROY, L. A. MOFFITT, H. D. SPOONHUNTER, J. L. PATTON, and J. A. COOK. in press. Phylogeography of the western jumping mouse (Zapus princeps) detects deep lineages in the Southwestern United States, Journal of Mammalogy xxx:xxx-xxx. MALANEY, J. L., and J. A. COOK. in review. Using biogeographic history to inform conservation: the case of Preble's meadow jumping mouse, Molecular Ecology xx:xxx-xxx. MALANEY, J. L., J. K. FREY, and J. A. COOK The biogeographic legacy of an imperilled taxon provides a foundation for assessing lineage diversification, demography, and conservation genetics, Diversity and Distributions 18:
228 MCCORMACK, J. E., H. T. HUANG, and L. L. KNOWLES Sky Islands, Pp in Encyclopedia of Islands (R. G. Gillespie and D. Clague, eds.). University of California Press, Berkeley, CA. MERRIAM, C. H The geographic distribution of life in North America with special reference to the mammalia, Proceedings of the Biological Society of Washington 7:1-64. MERRIAM, C. H The geographic distribution of animals and plants in North America, Yearbook of the United States Department of Agriculture MORITZ, C., J. L. PATTON, C. J. CONROY, J. L. PARRA, G. C. WHITE, and S. R. BEISSINGER Impact of a century of climate change on small-mammal communities in Yosemite National Park, USA, Science 322: NOSIL, P Speciaiton with gene flow could be common, Molecular Ecology 17: PADIAL, J. M., A. MIRALLES, I. DE LA RIVA, and M. VENCES The integrative future of taxonomy, Frontiers in Zoology 7:1-14. RAMEY, R. R., H. P. LIU, C. W. EPPS, L. M. CARPENTER, and J. D. WEHAUSEN Genetic relatedness of the Preble's meadow jumping mouse (Zapus hudsonius preblei) to nearby subspecies of Z. hudsonius as inferred from variation in cranial morphology, mitochondrial DNA and microsatellite DNA: implications for taxonomy and conservation, Animal Conservation 8: RAMEY, R. R., J. D. WEHAUSEN, H. P. LIU, C. W. EPPS, and L. M. CARPENTER Response to Vignieri et al. (2006): Should hypothesis testing or selective post hoc 220
229 interpretation of results guide the allocation of conservation effort?, Animal Conservation 9: RUBIDGE, E. M., J. L. PATTON, M. LIM, A. C. BURTON, J. S. BRASHARES, and C. MORITZ Climate-induced range contraction drives genetic erosion in an alpine mammal, Nature Climate Change 2: RUNCK, A. M., and J. A. COOK Postglacial expansion of the southern red-backed vole (Clethrionomys gapperi) in North America, Molecular Ecology 14: SCOTT, J. M., et al Policy advocacy in science: Prevalence, perspectives, and implications for conservation biologists, Conservation Biology 21: SIMPSON, G. G Mammals and Land Bridges, Journal of the Washington Academy of Sciences 30: SKALSKI, J. R., R. L. TOWNSEND, L. L. MCDONALD, J. W. KERN, and J. J. MILLSPAUGH Type I errors linked to faulty statistical analyses of endangered subspecies classifications, Journal of Agricultural Biological and Environmental Statistics 13: USFWS Final rule to list the Preble's meadow jumping mouse as a Threatened Species, Pp (D. o. t. I.-U. S. F. a. W. Service, ed.). Federal Register, Washington, D.C. USFWS Endangered and threatened wildlife and plants; designation of critical habitat for the Preble's meadow jumping mouse (Zapus hudsonius preblei); proposed rule, Pp (D. o. t. I.-U. S. F. a. W. Service, ed.). Federal Register, Washington, D.C. 221
230 USFWS Endangered and Threatened Wildlife and Plants; Revised Critical Habitat for the Preble's Meadow Jumping Mouse in Colorado; Final Rule, Pp (D. o. t. Interior, ed.). Federal Register. VIGNIERI, S. N., et al Mistaken view of taxonomic validity undermines conservation of an evolutionarily distinct mouse: a response to Ramey et al. (2005), Animal Conservation 9: WALLACE, A. R The geographical distribution of animals: with a study of the relations of living and extinct faunas as elucidating the past changes of the earth's surface. Vol. II. Harper & Brothers, New York. WALTARI, E., and R. P. GURALNICK Ecological niche modelling of montane mammals in the Great Basin, North America: examining past and present connectivity of species across basins and ranges, Journal of Biogeography 36: WIENS, J. J Speciation and ecology revisited: Phylogenetic niche conservatism and the origin of species, Evolution 58: WIENS, J. J., and C. H. GRAHAM Niche conservatism: Integrating evolution, ecology, and conservation biology, Annual Review of Ecology Evolution and Systematics 36: WILEY, E. O., and B. S. LIEBERMAN Phylogenetics: theory and practive of phylogenetic systematics. John Wiley & Sons, Inc., Hoboken, New Jersey. 222
231 FIGURES Figure 1. Bayesian multilocus coalescent-based fossil calibrated molecular species-tree phylogeny of 14 North American jumping mice. Bars represent 95% credible intervals of divergence time. All nodes have 0.95 posterior probability and probability of speciation. 223
232 Figure 2. Reproduced from Malaney and Cook (in review). [A] Northern lineage (ESU), mtdna cytochrome b gene haplotype network via statistical parsimony that was [B] spatially and taxonomically sampled. In this dataset, Southern populations may be considered a Distinct Population Segment (DPS) due to geographic separation from Northern populations (DPS). Intervening areas (?) need further sampling to test if this system represents a widespread set of populations or geographically Northern and Southern isolates (DPS). A B 224


![[A] Blue = N. abietorum, Red = N.](/docs-images/89/99969282/images/233-2.jpg "insignis; [B] Blue = Z. americanus, Green = Z.")
![hudsonius, Brown = Z. luteus; [C] Black = Z.](/docs-images/89/99969282/images/233-3.jpg "okanaganensis, Orange = Z. princeps, Yellow = Z.")
233 Figure 3. Species distributions for each proposed taxonomic species (see Fig. 1). All models have significantly different niches. [A] Blue = N. abietorum, Red = N. insignis; [B] Blue = Z. americanus, Green = Z. hudsonius, Brown = Z. luteus; [C] Black = Z. okanaganensis, Orange = Z. princeps, Yellow = Z. utahensis, Pink = Z. minor, Purple = Z. nevadensis; [D] Spruce = Z. alleni, Grey = Z. orarius, Navy = Z. trinotatus. A B C D 225
![Figure 4. [A] Major biotic communities of North America with emphasis on boreal (dark green) and cold temperate forests (olive) distributed in the West.](/docs-images/89/99969282/images/234-0.jpg "[B] Generic geographic ranges of 10 boreal mammals illustrating the broad overlap and opportunity to test for concordant patterns of geographic variation in molecular data among taxa.")
![[C] Glaciated areas of North America at Last Glacial Maximum with potential refugial areas (highlighted in red) presented in the literature and tested here with comparative phylogeography.](/docs-images/89/99969282/images/234-1.jpg "[D] Pulses of diversification for 8 species though glacial cycles of the Quaternary tested in a Bayesian framework with relaxed molecular clock and calibrated with fossils (glacial chart from")
234 Figure 4. [A] Major biotic communities of North America with emphasis on boreal (dark green) and cold temperate forests (olive) distributed in the West. [B] Generic geographic ranges of 10 boreal mammals illustrating the broad overlap and opportunity to test for concordant patterns of geographic variation in molecular data among taxa. [C] Glaciated areas of North America at Last Glacial Maximum with potential refugial areas (highlighted in red) presented in the literature and tested here with comparative phylogeography. [D] Pulses of diversification for 8 species though glacial cycles of the Quaternary tested in a Bayesian framework with relaxed molecular clock and calibrated with fossils (glacial chart from Wikipedia December 2010). Bar heights correspond to number of cladistic events. Example: 6 cladistic events during the Sangamon interglacial. 1 species 4 species 7+ species A B?? Timing of Pulses of Diversification Across 8 species?? 226 C One cladogenic event D
GIS Applications to Museum Specimens
 GIS Applications to Museum Specimens Joseph Grinnell (1877 1939) At this point I wish to emphasize what I believe will ultimately prove to be the greatest value of our museum. This value will not, however,
Climate, niche evolution, and diversification of the bird cage evening primroses (Oenothera, sections Anogra and Kleinia)
") Climate, niche evolution, and diversification of the bird cage evening primroses (Oenothera, sections Anogra and Kleinia) Margaret Evans, Post-doc; YIBS, EEB, Yale University Stephen Smith, PhD student;
Climate, niche evolution, and diversification of the bird cage evening primroses (Oenothera, sections Anogra and Kleinia) Margaret Evans, Post-doc; YIBS, EEB, Yale University Stephen Smith, PhD student;
Molecular Markers, Natural History, and Evolution
 Molecular Markers, Natural History, and Evolution Second Edition JOHN C. AVISE University of Georgia Sinauer Associates, Inc. Publishers Sunderland, Massachusetts Contents PART I Background CHAPTER 1:
ECOLOGICAL PLANT GEOGRAPHY
 Biology 561 MWF 11:15 12:05 Spring 2018 128 Wilson Hall Robert K. Peet ECOLOGICAL PLANT GEOGRAPHY Objectives: This is a course in the geography of plant biodiversity, vegetation and ecological processes.
Integrative Biology 200 "PRINCIPLES OF PHYLOGENETICS" Spring 2018 University of California, Berkeley
 Integrative Biology 200 "PRINCIPLES OF PHYLOGENETICS" Spring 2018 University of California, Berkeley B.D. Mishler Feb. 14, 2018. Phylogenetic trees VI: Dating in the 21st century: clocks, & calibrations;
Biogeography expands:
 Biogeography expands: Phylogeography Ecobiogeography Due to advances in DNA sequencing and fingerprinting methods, historical biogeography has recently begun to integrate relationships of populations within
The California Hotspots Project: I.
 The California Hotspots Project: I. Identifying regions of rapid diversification of mammals Ed Davis, M. Koo, C. Conroy, J. Patton & C. Moritz Museum of Vertebrate Zoology, UC Berkeley *Funded by Resources
Estimating Evolutionary Trees. Phylogenetic Methods
 Estimating Evolutionary Trees v if the data are consistent with infinite sites then all methods should yield the same tree v it gets more complicated when there is homoplasy, i.e., parallel or convergent
Conservation genetics of the Ozark pocket gopher
 Conservation genetics of the Ozark pocket gopher Project Summary The Ozark pocket gopher (Geomys bursarius ozarkensis) is a range-restricted subspecies of the broadly distributed plains pocket gopher (G.
Applications of Genetics to Conservation Biology
 Applications of Genetics to Conservation Biology Molecular Taxonomy Populations, Gene Flow, Phylogeography Relatedness - Kinship, Paternity, Individual ID Conservation Biology Population biology Physiology
8/23/2014. Phylogeny and the Tree of Life
 Phylogeny and the Tree of Life Chapter 26 Objectives Explain the following characteristics of the Linnaean system of classification: a. binomial nomenclature b. hierarchical classification List the major
Fields connected to Phylogeography Microevolutionary disciplines Ethology Demography Population genetics
 Stephen A. Roussos Fields connected to Phylogeography Microevolutionary disciplines Ethology Demography Population genetics Macrevolutionary disciplines Historical geography Paleontology Phylogenetic biology
Reconstructing the history of lineages
 Reconstructing the history of lineages Class outline Systematics Phylogenetic systematics Phylogenetic trees and maps Class outline Definitions Systematics Phylogenetic systematics/cladistics Systematics
Harvesting and harnessing data for biogeographical research
 How do we know what grows where? Harvesting and harnessing data for biogeographical research A. Geography Tree B. Species Tree inventories and surveys natural areas, preserves, state forests, private properties
Evolutionary Significant Units (ESUs) & Management Units (MUs)
 & Management Units (MUs)") Evolutionary Significant Units (ESUs) & Management Units (MUs) Diversity is Diverse and Complex Defining Management Units Within Species Genetic Distinctiveness & ESU s definition Measuring & Managing
Evolutionary Significant Units (ESUs) & Management Units (MUs) Diversity is Diverse and Complex Defining Management Units Within Species Genetic Distinctiveness & ESU s definition Measuring & Managing
Project Budget: State Wildlife Grant Requested: $16,412 Project Match (UARK in kind services): $5,744 Total Project Cost: $22,156
: $5,744 Total Project Cost: $22,156") Project Title: Genetic examination of the Ringed Crayfish species group, with special emphasis on the endemic Gapped Ringed Crayfish (Orconectes neglectus chaenodactylus) Project Summary: Morphological
Project Title: Genetic examination of the Ringed Crayfish species group, with special emphasis on the endemic Gapped Ringed Crayfish (Orconectes neglectus chaenodactylus) Project Summary: Morphological
Statistical phylogeography
 Molecular Ecology (2002) 11, 2623 2635 Statistical phylogeography Blackwell Science, Ltd L. LACEY KNOWLES and WAYNE P. MADDISON Department of Ecology and Evolutionary Biology, University of Arizona, Tucson,
The Tempo of Macroevolution: Patterns of Diversification and Extinction
 The Tempo of Macroevolution: Patterns of Diversification and Extinction During the semester we have been consider various aspects parameters associated with biodiversity. Current usage stems from 1980's
POPULATION GENETICS Winter 2005 Lecture 17 Molecular phylogenetics
 POPULATION GENETICS Winter 2005 Lecture 17 Molecular phylogenetics - in deriving a phylogeny our goal is simply to reconstruct the historical relationships between a group of taxa. - before we review the
Intraspecific gene genealogies: trees grafting into networks
 Intraspecific gene genealogies: trees grafting into networks by David Posada & Keith A. Crandall Kessy Abarenkov Tartu, 2004 Article describes: Population genetics principles Intraspecific genetic variation
Tropical Rainforests in the Pleistocene
 Tropical Rainforests in the Pleistocene tropics stable during Pleistocene? 1 C temperature drop based on 1976 CLIMAP study of warm vs. cold loving forams (vs. 10 C in North Atlantic) Paleothermometers
Tropical Rainforests in the Pleistocene
 Tropical Rainforests in the Pleistocene tropics stable during Pleistocene? 1 C temperature drop based on 1976 CLIMAP study of warm vs. cold loving forams (vs. 10 C in North Atlantic) Pollen analysis of
"PRINCIPLES OF PHYLOGENETICS: ECOLOGY AND EVOLUTION" Integrative Biology 200B Spring 2009 University of California, Berkeley
 "PRINCIPLES OF PHYLOGENETICS: ECOLOGY AND EVOLUTION" Integrative Biology 200B Spring 2009 University of California, Berkeley B.D. Mishler Jan. 22, 2009. Trees I. Summary of previous lecture: Hennigian
Anatomy of a species tree
 Anatomy of a species tree T 1 Size of current and ancestral Populations (N) N Confidence in branches of species tree t/2n = 1 coalescent unit T 2 Branch lengths and divergence times of species & populations
Dr. Amira A. AL-Hosary
 Phylogenetic analysis Amira A. AL-Hosary PhD of infectious diseases Department of Animal Medicine (Infectious Diseases) Faculty of Veterinary Medicine Assiut University-Egypt Phylogenetic Basics: Biological
Amira A. AL-Hosary PhD of infectious diseases Department of Animal Medicine (Infectious Diseases) Faculty of Veterinary Medicine Assiut
 Faculty of Veterinary Medicine Assiut") Amira A. AL-Hosary PhD of infectious diseases Department of Animal Medicine (Infectious Diseases) Faculty of Veterinary Medicine Assiut University-Egypt Phylogenetic analysis Phylogenetic Basics: Biological
Amira A. AL-Hosary PhD of infectious diseases Department of Animal Medicine (Infectious Diseases) Faculty of Veterinary Medicine Assiut University-Egypt Phylogenetic analysis Phylogenetic Basics: Biological
Concepts and Methods in Molecular Divergence Time Estimation
 Concepts and Methods in Molecular Divergence Time Estimation 26 November 2012 Prashant P. Sharma American Museum of Natural History Overview 1. Why do we date trees? 2. The molecular clock 3. Local clocks
LATITUDINAL VARIATION IN SPECIATION MECHANISMS IN FROGS
 ORIGINAL ARTICLE doi:10.1111/j.1558-5646.2009.00836.x LATITUDINAL VARIATION IN SPECIATION MECHANISMS IN FROGS Xia Hua 1,2 and John J. Wiens 1,3 1 Department of Ecology and Evolution, Stony Brook University,
Ph ylogeography. A guide to the study of the spatial distribution of Seahorses. By Leila Mougoui Bakhtiari
 Ph ylogeography A guide to the study of the spatial distribution of Seahorses By Leila Mougoui Bakhtiari Contents An Introduction to Phylogeography JT Bohem s Resarch Map of erectu s migration Conservation
Integrating Fossils into Phylogenies. Throughout the 20th century, the relationship between paleontology and evolutionary biology has been strained.
 IB 200B Principals of Phylogenetic Systematics Spring 2011 Integrating Fossils into Phylogenies Throughout the 20th century, the relationship between paleontology and evolutionary biology has been strained.
Speciation. Today s OUTLINE: Mechanisms of Speciation. Mechanisms of Speciation. Geographic Models of speciation. (1) Mechanisms of Speciation
 Mechanisms of Speciation") Speciation Today s OUTLINE: (1) Geographic Mechanisms of Speciation (What circumstances lead to the formation of new species?) (2) Species Concepts (How are Species Defined?) Mechanisms of Speciation Last
Speciation Today s OUTLINE: (1) Geographic Mechanisms of Speciation (What circumstances lead to the formation of new species?) (2) Species Concepts (How are Species Defined?) Mechanisms of Speciation Last
UoN, CAS, DBSC BIOL102 lecture notes by: Dr. Mustafa A. Mansi. The Phylogenetic Systematics (Phylogeny and Systematics)
") - Phylogeny? - Systematics? The Phylogenetic Systematics (Phylogeny and Systematics) - Phylogenetic systematics? Connection between phylogeny and classification. - Phylogenetic systematics informs the
- Phylogeny? - Systematics? The Phylogenetic Systematics (Phylogeny and Systematics) - Phylogenetic systematics? Connection between phylogeny and classification. - Phylogenetic systematics informs the
Geography of Evolution
 Geography of Evolution Biogeography - the study of the geographic distribution of organisms. The current distribution of organisms can be explained by historical events and current climatic patterns. Darwin
Phylogenetic diversity and conservation
 Phylogenetic diversity and conservation Dan Faith The Australian Museum Applied ecology and human dimensions in biological conservation Biota Program/ FAPESP Nov. 9-10, 2009 BioGENESIS Providing an evolutionary
Chapter 26: Phylogeny and the Tree of Life Phylogenies Show Evolutionary Relationships
 Chapter 26: Phylogeny and the Tree of Life You Must Know The taxonomic categories and how they indicate relatedness. How systematics is used to develop phylogenetic trees. How to construct a phylogenetic
Introduction to Phylogenetic Analysis
 Introduction to Phylogenetic Analysis Tuesday 24 Wednesday 25 July, 2012 School of Biological Sciences Overview This free workshop provides an introduction to phylogenetic analysis, with a focus on the
ORIGINAL ARTICLE. Kurt E. Galbreath 1,2 *, David J. Hafner 3, Kelly R. Zamudio 1 and Kelly Agnew 4
 Journal of Biogeography (J. Biogeogr.) (2010) 37, 344 362 ORIGINAL ARTICLE Isolation and introgression in the Intermountain West: contrasting gene genealogies reveal the complex biogeographic history of
5/31/17. Week 10; Monday MEMORIAL DAY NO CLASS. Page 88
 Week 10; Monday MEMORIAL DAY NO CLASS Page 88 Week 10; Wednesday Announcements: Family ID final in lab Today Final exam next Tuesday at 8:30 am here Lecture: Species concepts & Speciation. What are species?
Past climate change on Sky Islands drives novelty in a core developmental gene network and its phenotype
 Supplementary tables and figures Past climate change on Sky Islands drives novelty in a core developmental gene network and its phenotype Marie-Julie Favé 1, Robert A. Johnson 2, Stefan Cover 3 Stephan
Using phylogenetics to estimate species divergence times... Basics and basic issues for Bayesian inference of divergence times (plus some digression)
") Using phylogenetics to estimate species divergence times... More accurately... Basics and basic issues for Bayesian inference of divergence times (plus some digression) "A comparison of the structures
Using phylogenetics to estimate species divergence times... More accurately... Basics and basic issues for Bayesian inference of divergence times (plus some digression) "A comparison of the structures
Speciation. Today s OUTLINE: Mechanisms of Speciation. Mechanisms of Speciation. Geographic Models of speciation. (1) Mechanisms of Speciation
 Mechanisms of Speciation") Speciation Today s OUTLINE: (1) Geographic Mechanisms of Speciation (What circumstances lead to the formation of new species?) (2) Species Concepts (How are Species Defined?) Mechanisms of Speciation Last
Speciation Today s OUTLINE: (1) Geographic Mechanisms of Speciation (What circumstances lead to the formation of new species?) (2) Species Concepts (How are Species Defined?) Mechanisms of Speciation Last
Bustamante et al., Supplementary Nature Manuscript # 1 out of 9 Information #
 Bustamante et al., Supplementary Nature Manuscript # 1 out of 9 Details of PRF Methodology In the Poisson Random Field PRF) model, it is assumed that non-synonymous mutations at a given gene are either
Systematics - Bio 615
 Bayesian Phylogenetic Inference 1. Introduction, history 2. Advantages over ML 3. Bayes Rule 4. The Priors 5. Marginal vs Joint estimation 6. MCMC Derek S. Sikes University of Alaska 7. Posteriors vs Bootstrap
Integrative Biology 200A "PRINCIPLES OF PHYLOGENETICS" Spring 2012 University of California, Berkeley
 Integrative Biology 200A "PRINCIPLES OF PHYLOGENETICS" Spring 2012 University of California, Berkeley B.D. Mishler April 12, 2012. Phylogenetic trees IX: Below the "species level;" phylogeography; dealing
"PRINCIPLES OF PHYLOGENETICS: ECOLOGY AND EVOLUTION" Integrative Biology 200B Spring 2011 University of California, Berkeley
 "PRINCIPLES OF PHYLOGENETICS: ECOLOGY AND EVOLUTION" Integrative Biology 200B Spring 2011 University of California, Berkeley B.D. Mishler March 31, 2011. Reticulation,"Phylogeography," and Population Biology:
ESS 345 Ichthyology. Systematic Ichthyology Part II Not in Book
 ESS 345 Ichthyology Systematic Ichthyology Part II Not in Book Thought for today: Now, here, you see, it takes all the running you can do, to keep in the same place. If you want to get somewhere else,
Mathematical models in population genetics II
 Mathematical models in population genetics II Anand Bhaskar Evolutionary Biology and Theory of Computing Bootcamp January 1, 014 Quick recap Large discrete-time randomly mating Wright-Fisher population
National Wildland Significant Fire Potential Outlook
 National Wildland Significant Fire Potential Outlook National Interagency Fire Center Predictive Services Issued: September, 2007 Wildland Fire Outlook September through December 2007 Significant fire
Taming the Beast Workshop
 Workshop and Chi Zhang June 28, 2016 1 / 19 Species tree Species tree the phylogeny representing the relationships among a group of species Figure adapted from [Rogers and Gibbs, 2014] Gene tree the phylogeny
Phylogeny and systematics. Why are these disciplines important in evolutionary biology and how are they related to each other?
 Phylogeny and systematics Why are these disciplines important in evolutionary biology and how are they related to each other? Phylogeny and systematics Phylogeny: the evolutionary history of a species
Historical Biogeography. Historical Biogeography. Systematics
 Historical Biogeography I. Definitions II. Fossils: problems with fossil record why fossils are important III. Phylogeny IV. Phenetics VI. Phylogenetic Classification Disjunctions debunked: Examples VII.
Phylogeography and genetic differentiation between Loxigilla noctis and L. barbadensis in the Lesser Antilles
 Phylogeography and genetic differentiation between Loxigilla noctis and L. barbadensis in the Lesser Antilles Sophie Arnaud-Haond 1, Carla Daniel 2, Sébastien Motreuil 3, Julia Horrocks 2 & Frank Cézilly
Conceptually, we define species as evolutionary units :
 Bio 1M: Speciation 1 How are species defined? S24.1 (2ndEd S26.1) Conceptually, we define species as evolutionary units : Individuals within a species are evolving together Individuals of different species
INCREASED RATES OF MOLECULAR EVOLUTION IN AN EQUATORIAL PLANT CLADE: AN EFFECT OF ENVIRONMENT OR PHYLOGENETIC NONINDEPENDENCE?
 Evolution, 59(1), 2005, pp. 238 242 INCREASED RATES OF MOLECULAR EVOLUTION IN AN EQUATORIAL PLANT CLADE: AN EFFECT OF ENVIRONMENT OR PHYLOGENETIC NONINDEPENDENCE? JEREMY M. BROWN 1,2 AND GREGORY B. PAULY
PHYLOGENY AND SYSTEMATICS
 AP BIOLOGY EVOLUTION/HEREDITY UNIT Unit 1 Part 11 Chapter 26 Activity #15 NAME DATE PERIOD PHYLOGENY AND SYSTEMATICS PHYLOGENY Evolutionary history of species or group of related species SYSTEMATICS Study
Topic 5: Mechanisms of influence: Species range shi s. Climate Change Ecology Geography 404 Jeff Hicke
 Topic 5: Mechanisms of influence: Species range shi s Geography 404 Jeff Hicke 1 1. Introduction focus on historical (documented) range shifts range shifts only reminders niches (fundamental, realized)
Nebraska Conservation and Environmental Review Tool (CERT): Terminology used in the Tables of the CERT Report
: Terminology used in the Tables of the CERT Report") Nebraska Conservation and Environmental Review Tool (CERT): Terminology used in the Tables of the CERT Report Nebraska Natural Heritage Program Nebraska Game and Parks Commission February 8, 2018 Contents
Nebraska Conservation and Environmental Review Tool (CERT): Terminology used in the Tables of the CERT Report Nebraska Natural Heritage Program Nebraska Game and Parks Commission February 8, 2018 Contents
PHYLOGENY & THE TREE OF LIFE
 PHYLOGENY & THE TREE OF LIFE PREFACE In this powerpoint we learn how biologists distinguish and categorize the millions of species on earth. Early we looked at the process of evolution here we look at
Algorithms in Bioinformatics
 Algorithms in Bioinformatics Sami Khuri Department of Computer Science San José State University San José, California, USA khuri@cs.sjsu.edu www.cs.sjsu.edu/faculty/khuri Distance Methods Character Methods
Speciation. Today s OUTLINE: Mechanisms of Speciation. Mechanisms of Speciation. Geographic Models of speciation. (1) Mechanisms of Speciation
 Mechanisms of Speciation") Speciation Today s OUTLINE: (1) Geographic Mechanisms of Speciation (What circumstances lead to the formation of new species?) (2) Species Concepts (How are Species Defined?) Mechanisms of Speciation Last
Speciation Today s OUTLINE: (1) Geographic Mechanisms of Speciation (What circumstances lead to the formation of new species?) (2) Species Concepts (How are Species Defined?) Mechanisms of Speciation Last
, Helen K. Pigage 1, Peter J. Wettstein 2, Stephanie A. Prosser 1 and Jon C. Pigage 1ˆ. Jeremy M. Bono 1*
 Bono et al. BMC Evolutionary Biology (2018) 18:139 https://doi.org/10.1186/s12862-018-1248-4 RESEARCH ARTICLE Genome-wide markers reveal a complex evolutionary history involving divergence and introgression
The Phylogenetic Reconstruction of the Grass Family (Poaceae) Using matk Gene Sequences
 Using matk Gene Sequences") The Phylogenetic Reconstruction of the Grass Family (Poaceae) Using matk Gene Sequences by Hongping Liang Dissertation submitted to the Faculty of the Virginia Polytechnic Institute and State University
The Phylogenetic Reconstruction of the Grass Family (Poaceae) Using matk Gene Sequences by Hongping Liang Dissertation submitted to the Faculty of the Virginia Polytechnic Institute and State University
of Nebraska - Lincoln
 University of Nebraska - Lincoln DigitalCommons@University of Nebraska - Lincoln USGS Staff -- Published Research US Geological Survey 2006 Comprehensive genetic analyses reveal evolutionary distinction
Chapter 16: Reconstructing and Using Phylogenies
 Chapter Review 1. Use the phylogenetic tree shown at the right to complete the following. a. Explain how many clades are indicated: Three: (1) chimpanzee/human, (2) chimpanzee/ human/gorilla, and (3)chimpanzee/human/
Introduction to Biosystematics - Zool 575
 Introduction to Biosystematics Lecture 8 - Modern Taxonomy Outline - 1. Tools - digital imaging, databases 2. Dissemination - WWW 3. Tools - Molecular data, species demarcation, phylogeography 1 2 Prognosis
of a landscape to support biodiversity and ecosystem processes and provide ecosystem services in face of various disturbances.
 L LANDSCAPE ECOLOGY JIANGUO WU Arizona State University Spatial heterogeneity is ubiquitous in all ecological systems, underlining the significance of the pattern process relationship and the scale of
Consensus Methods. * You are only responsible for the first two
 Consensus Trees * consensus trees reconcile clades from different trees * consensus is a conservative estimate of phylogeny that emphasizes points of agreement * philosophy: agreement among data sets is
Phylogeographic analysis of the true lemurs (genus Eulemur) underlines the role of river catchments for the evolution of micro-endemism in Madagascar
 underlines the role of river catchments for the evolution of micro-endemism in Madagascar") Phylogeographic analysis of the true lemurs (genus ) underlines the role of river catchments for the evolution of micro-endemism in Madagascar Markolf and Kappeler Markolf and Kappeler Frontiers in Zoology
Phylogeographic analysis of the true lemurs (genus ) underlines the role of river catchments for the evolution of micro-endemism in Madagascar Markolf and Kappeler Markolf and Kappeler Frontiers in Zoology
Metacommunities Spatial Ecology of Communities
 Spatial Ecology of Communities Four perspectives for multiple species Patch dynamics principles of metapopulation models (patchy pops, Levins) Mass effects principles of source-sink and rescue effects
Title. Author(s)Tomozawa, Morihiko; Tomida, Hiroshi; Suzuki, Hitoshi. CitationMammal Study, 35(2): Issue Date Doc URL.
Tomozawa, Morihiko; Tomida, Hiroshi; Suzuki, Hitoshi. CitationMammal Study, 35(2): Issue Date Doc URL.") Title Mitochondrial Phylogeography and Population History Sado Island, Japan Author(s)Tomozawa, Morihiko; Tomida, Hiroshi; Suzuki, Hitoshi CitationMammal Study, 35(2): 93-97 Issue Date 2010-06 Doc URL
Title Mitochondrial Phylogeography and Population History Sado Island, Japan Author(s)Tomozawa, Morihiko; Tomida, Hiroshi; Suzuki, Hitoshi CitationMammal Study, 35(2): 93-97 Issue Date 2010-06 Doc URL
Over 20 years ago, John Avise coined the term
 Comparative Phylogeography: Designing Studies while Surviving the Process Articles Tania A. Gutiérrez-García and Ella Vázquez-Domínguez Comparative phylogeography (CP) can be defined as the study of the
Biogeography. An ecological and evolutionary approach SEVENTH EDITION. C. Barry Cox MA, PhD, DSc and Peter D. Moore PhD
 Biogeography An ecological and evolutionary approach C. Barry Cox MA, PhD, DSc and Peter D. Moore PhD Division of Life Sciences, King's College London, Fmnklin-Wilkins Building, Stamford Street, London
Title of the Project: Distribution and population status of Arkansas bumble bees
 Title of the Project: Distribution and population status of Arkansas bumble bees Project Summary: The goal of this project is to determine the distribution and population status of bumble bees in Arkansas.
Three Monte Carlo Models. of Faunal Evolution PUBLISHED BY NATURAL HISTORY THE AMERICAN MUSEUM SYDNEY ANDERSON AND CHARLES S.
 AMERICAN MUSEUM Notltates PUBLISHED BY THE AMERICAN MUSEUM NATURAL HISTORY OF CENTRAL PARK WEST AT 79TH STREET NEW YORK, N.Y. 10024 U.S.A. NUMBER 2563 JANUARY 29, 1975 SYDNEY ANDERSON AND CHARLES S. ANDERSON
Integrative Biology 200A "PRINCIPLES OF PHYLOGENETICS" Spring 2012 University of California, Berkeley
 Integrative Biology 200A "PRINCIPLES OF PHYLOGENETICS" Spring 2012 University of California, Berkeley B.D. Mishler Feb. 7, 2012. Morphological data IV -- ontogeny & structure of plants The last frontier
Supplemental Information Likelihood-based inference in isolation-by-distance models using the spatial distribution of low-frequency alleles
 Supplemental Information Likelihood-based inference in isolation-by-distance models using the spatial distribution of low-frequency alleles John Novembre and Montgomery Slatkin Supplementary Methods To
Chapter 26. Phylogeny and the Tree of Life. Lecture Presentations by Nicole Tunbridge and Kathleen Fitzpatrick Pearson Education, Inc.
 Chapter 26 Phylogeny and the Tree of Life Lecture Presentations by Nicole Tunbridge and Kathleen Fitzpatrick Investigating the Tree of Life Phylogeny is the evolutionary history of a species or group of
Figure 1. Consider this cladogram. Let s examine it with all three species concepts:
 Biology 1B Evolution Lecture 9 - Speciation Processes Species identification - the grey zone Figure 1 Consider this cladogram. Let s examine it with all three species concepts: For each species, we can
A (short) introduction to phylogenetics
 introduction to phylogenetics") A (short) introduction to phylogenetics Thibaut Jombart, Marie-Pauline Beugin MRC Centre for Outbreak Analysis and Modelling Imperial College London Genetic data analysis with PR Statistics, Millport Field
A (short) introduction to phylogenetics Thibaut Jombart, Marie-Pauline Beugin MRC Centre for Outbreak Analysis and Modelling Imperial College London Genetic data analysis with PR Statistics, Millport Field
Understanding How Stochasticity Impacts Reconstructions of Recent Species Divergent History. Huateng Huang
 Understanding How Stochasticity Impacts Reconstructions of Recent Species Divergent History by Huateng Huang A dissertation submitted in partial fulfillment of the requirements for the degree of Doctor
Chapter 8. Biogeographic Processes. Upon completion of this chapter the student will be able to:
 Chapter 8 Biogeographic Processes Chapter Objectives Upon completion of this chapter the student will be able to: 1. Define the terms ecosystem, habitat, ecological niche, and community. 2. Outline how
7. Tests for selection
 Sequence analysis and genomics 7. Tests for selection Dr. Katja Nowick Group leader TFome and Transcriptome Evolution Bioinformatics group Paul-Flechsig-Institute for Brain Research www. nowicklab.info
Amy Driskell. Laboratories of Analytical Biology National Museum of Natural History Smithsonian Institution, Wash. DC
 DNA Barcoding Amy Driskell Laboratories of Analytical Biology National Museum of Natural History Smithsonian Institution, Wash. DC 1 Outline 1. Barcoding in general 2. Uses & Examples 3. Barcoding Bocas
Phylogenomics. Jeffrey P. Townsend Department of Ecology and Evolutionary Biology Yale University. Tuesday, January 29, 13
 Phylogenomics Jeffrey P. Townsend Department of Ecology and Evolutionary Biology Yale University How may we improve our inferences? How may we improve our inferences? Inferences Data How may we improve
GENETICS - CLUTCH CH.22 EVOLUTIONARY GENETICS.
 !! www.clutchprep.com CONCEPT: OVERVIEW OF EVOLUTION Evolution is a process through which variation in individuals makes it more likely for them to survive and reproduce There are principles to the theory
Lecture 11 Friday, October 21, 2011
 Lecture 11 Friday, October 21, 2011 Phylogenetic tree (phylogeny) Darwin and classification: In the Origin, Darwin said that descent from a common ancestral species could explain why the Linnaean system
ESTIMATING A GEOGRAPHICALLY EXPLICIT MODEL OF POPULATION DIVERGENCE
 ORIGINAL ARTICLE doi:10.1111/j.1558-5646.2007.00043.x ESTIMATING A GEOGRAPHICALLY EXPLICIT MODEL OF POPULATION DIVERGENCE L. Lacey Knowles 1,2 and Bryan C. Carstens 1,3 1 Department of Ecology and Evolutionary
PCB6675C, BOT6935, ZOO6927 Evolutionary Biogeography Spring 2014
 PCB6675C, BOT6935, ZOO6927 Evolutionary Biogeography Spring 2014 Credits: 3 Schedule: Wednesdays and Fridays, 4 th & 5 th Period (10:40 am - 12:35 pm) Location: Carr 221 Instructors Dr. Nico Cellinese
Markov chain Monte-Carlo to estimate speciation and extinction rates: making use of the forest hidden behind the (phylogenetic) tree
 tree") Markov chain Monte-Carlo to estimate speciation and extinction rates: making use of the forest hidden behind the (phylogenetic) tree Nicolas Salamin Department of Ecology and Evolution University of Lausanne
Markov chain Monte-Carlo to estimate speciation and extinction rates: making use of the forest hidden behind the (phylogenetic) tree Nicolas Salamin Department of Ecology and Evolution University of Lausanne
Unifying theories of molecular, community and network evolution 1
 Carlos J. Melián National Center for Ecological Analysis and Synthesis, University of California, Santa Barbara Microsoft Research Ltd, Cambridge, UK. Unifying theories of molecular, community and network
The tropics are species-rich and: 1. In the middle (mid-domain affect)
") The tropics are species-rich and: 1. In the middle (mid-domain affect) Why are the Tropics so biodiverse? 2. Bigger. More area = more species (just the interprovincial Species-Area curve again) 3. Older.
The tropics are species-rich and: 1. In the middle (mid-domain affect) Why are the Tropics so biodiverse? 2. Bigger. More area = more species (just the interprovincial Species-Area curve again) 3. Older.
Gene Genealogies Coalescence Theory. Annabelle Haudry Glasgow, July 2009
 Gene Genealogies Coalescence Theory Annabelle Haudry Glasgow, July 2009 What could tell a gene genealogy? How much diversity in the population? Has the demographic size of the population changed? How?
Lecture V Phylogeny and Systematics Dr. Kopeny
 Delivered 1/30 and 2/1 Lecture V Phylogeny and Systematics Dr. Kopeny Lecture V How to Determine Evolutionary Relationships: Concepts in Phylogeny and Systematics Textbook Reading: pp 425-433, 435-437
Head of College Scholars List Scheme. Summer Studentship. Report Form
 Head of College Scholars List Scheme Summer Studentship Report Form This report should be completed by the student with his/her project supervisor. It should summarise the work undertaken during the project
National Wildland Significant Fire Potential Outlook
 National Wildland Significant Fire Potential Outlook National Interagency Fire Center Predictive Services Issued: April 1, 2008 Next Issue: May 1, 2008 Wildland Fire Outlook April 2008 through July 2008
JML: testing hybridization from species trees
 Molecular Ecology Resources (2012) 12, 179 184 doi: 10.1111/j.1755-0998.2011.03065.x JML: testing hybridization from species trees SIMON JOLY Institut de recherche en biologie végétale, Université de Montréal
Conservation Genetics. Outline
 Conservation Genetics The basis for an evolutionary conservation Outline Introduction to conservation genetics Genetic diversity and measurement Genetic consequences of small population size and extinction.
U.S. Department of the Interior U.S. Geological Survey. Krista Karstensen Mark Drummond
 USGS Land-Cover Trends: A focus on contemporary land-use and land-cover change within the LCCs U.S. Department of the Interior U.S. Geological Survey Krista Karstensen Mark Drummond The Challenge Land
Genetic Drift in Human Evolution
 Genetic Drift in Human Evolution (Part 2 of 2) 1 Ecology and Evolutionary Biology Center for Computational Molecular Biology Brown University Outline Introduction to genetic drift Modeling genetic drift
Species complex, cryptic species and the need for Integrative taxonomy
 Species complex, cryptic species and the need for Integrative taxonomy K. Praveen Karanth CES, IISc, Bangalore National Seminar on Conservation Biotechnology and DNA Barcoding, 18-19 th May 2015 Gujarat