ABSTRACT. pathway of bacteria. In this system, cell-surface receptor proteins regulate a histidine
|
|
|
- Calvin Rose
- 5 years ago
- Views:
Transcription
1 ABSTRACT Title of Dissertation: BINDING INTERACTIONS IN THE BACTERIAL CHEMOTAXIS SIGNAL TRANSDUCTION PATHWAY Anna Kolesar Eaton, Doctor of Philosophy, 2008 Dissertation Directed By: Dr. Richard C. Stewart Cell Biology and Molecular Genetics The investigation of signal transduction pathways is critical to the basic understanding of cellular processes as these pathways function to regulate diverse processes in both eukaryotes and prokaryotes. This dissertation focuses on understanding some of the biochemical events that take place in the chemotaxis signal transduction pathway of bacteria. In this system, cell-surface receptor proteins regulate a histidine protein kinase, CheA, that autophosphorylates and then transfers its phosphate to an effector protein, CheY. Phospho-CheY, in turn, influences the direction of flagellar rotation. This sequence of biochemical events establishes a chain of communication that ultimately allows the chemotaxis receptor proteins to regulate the swimming pattern of the bacterial cell when it encounters gradients of attractant and repellent chemicals in its environment. The three projects presented in this dissertation sought to fill basic gaps in our current understanding of CheA and CheY function. In the first project, I examined the
2 nucleotide binding reaction of CheA using the fluorescent nucleotide analogue, TNP- ATP [2'(3')-O-(2,4,6-trinitrophenyl)adenosine 5'-triphosphate]. TNP-ATP is an effective inhibitor for CheA. By monitoring the fluorescence of TNP-ATP when it bound to CheA, I examined the affinity of the binding interaction and discovered that the two ATP binding sites of each CheA dimer exhibited negative cooperativity in their interactions with TNP-ATP. This is the first evidence of cooperativity in the histidine protein kinase superfamily. In the second project, I focused on elucidating the binding mechanism that underlies formation of the CheA:TNP-ATP complex. My results indicated a three-step mechanism, including rapid formation of a low-affinity complex, followed by two steps during which conformational changes give rise to the final high-affinity complex. This same basic mechanism applied to CheA from Escherichia coli and from Thermotoga maritima. In the third project, I turned my attention to studying the CheY phosphorylation and binding reactions using fluorescently labeled versions of CheY. The results of this final study indicated that CheY proteins labeled with the fluorophore Badan [6-bromoacetyl-2-(dimethylamino)naphthalene] could be useful tools for investigating CheY biochemistry. However my results also brought to light some of the limitations and difficulties of this approach.
3 BINDING INTERACTIONS IN THE BACTERIAL CHEMOTAXIS SIGNAL TRANSDUCTION PATHWAY By Anna Kolesar Eaton Dissertation submitted to the Faculty of the Graduate School of the University of Maryland, College Park, in partial fulfillment of the requirements for the degree of Doctor of Philosophy 2008 Advisory Committee: Dr. Richard C. Stewart, Chair Dr. Dorothy Beckett Dr. Steven Hutcheson Dr. Heven Sze Dr. Stephen Wolniak
4 Copyright by Anna Kolesar Eaton 2008
5 Dedication To my husband, Chris, my parents, Dennis and Janet, and in memory of my grandmother, Olga. ii
6 Acknowledgements I would very much like to acknowledge my advisor, Dr. Rick Stewart, for his generosity, encouragement, insight, and patience during my time in graduate school. As a mentor, he has taught me the invaluable lesson of balancing work and family commitments as well as the rewards of persistence, dedication, and hard-work. I would like to thank Dr. Joseph Kolesar for his help with the MATLAB software and for his selfless donation of his evenings and weekends to teach me the basics of this software as well as to debug my scripts. I would like to thank the members of my committee, Dr. Dorothy Beckett, Dr. Steven Hutcheson, Dr. Heven Sze, and Dr. Stephen Wolniak, for stimulating discussions, invaluable input, and light-hearted conversations. I am very grateful to Dr. Todd Cooke, as well as the Graduate School, for allowing me the opportunity to switch graduate programs in my pursuit of the right research, lab, and mentor. I am appreciative of Dr. Joelle Presson and Mrs. Linda Dalo, both of whom provided the encouragement, support, and friendship that enabled me to surmount some of my most difficult moments in graduate school. Finally, I would like to thank Mrs. Nancy Williams for her help in making my entrance into CBMG smooth as well as Dr. Jeffrey DeStefano and Mrs. Sarah Biancardi for coordinating my final months in the program. I would also like to thank Dr. Nancy Trun at Duquesne University, for preparing me for graduate-level research by providing my first real opportunity to 'do science'. I am grateful to Mrs. Nora Doerder at Charles F. Brush High School, whose AP Biology class helped me decide to pursue science as a career. iii
7 I also thank the members of the Stewart lab, particularly Ricki VanBruggen (and her husband, Jon) and Megan Savage (and her husband, Jason) as well as former CBMG graduate students, Drs. Liliana and Bruce Brown. Their friendship and support will not be forgotten. Much of my success is credited to my family. I would like to acknowledge my parents, Dennis and Janet Kolesar, who have taught me to have faith, which I have found to be important in research, where it seems that more things go wrong than go right. I would also like to thank my brother and sister-in-law, Joe and Carrie Kolesar, who made living in Washington, D.C. enjoyable. Their constant invitations to dinner and family excursions provided me with a family that I very much needed. I also would like to thank my brother, Mike Kolesar, for his support, as well as for introducing me to LoC. Finally, I express my deepest appreciation to my husband, Chris, for his help with this dissertation, his many sacrifices, and his constant love and support during my graduate career. iv
8 Table of Contents Dedication... ii Acknowledgements. iii Table of Contents v List of Tables.. vii List of Figures. viii List of Abbreviations.. xiii Chapter 1: Introduction.. 1 History of 'Chemotaxis' in Bacteria... 2 Overview of the Chemotaxis System in Escherichia coli. 3 E. coli Biases Its Swimming Pattern.. 4 Excitation and Adaptation... 6 Signal Amplification 9 Phosphotransfer Reactions.. 9 Two-Component Systems, Pathogenicity, and Drug Development.. 12 Two-Component Paradigm.. 12 Role of Chemotaxis in Bacterial Pathogenesis 12 TCST Pathways as Drug Targets. 15 Components of the E. coli Chemotaxis System. 17 Receptor Signaling Complexes 19 The Excitation Pathway 25 The Adaptation Pathway.. 30 Chemotaxis Systems in Other Bacteria. 33 General Goals and Specific Aims. 35 Experimental Approaches: General Considerations.. 37 Chapter 2: The Nucleotide Analogue TNP-ATP Binds with Negative Cooperativity to the Histidine Kinase CheA Introduction.. 40 Materials and Methods 49 Results. 57 Discussion Chapter 3: Kinetics of TNP-ATP Binding to CheA Introduction. 92 Materials and Methods. 99 Results. 104 Discussion v
9 Chapter 4: Exploiting the Naturally Occurring Cysteine in CheY Homologues. 177 Introduction 177 Materials and Methods Results 187 Discussion Chapter 5: General Conclusions and Future Directions Appendices Appendix A. 223 Appendix B. 229 Appendix C. 240 Works Cited 246 vi
10 List of Tables Table 3-1: Parameters extracted from the kinetic analysis of TmP4 binding to TNP-ATP in the absence of Mg Table 3-2: Parameters extracted from the kinetic analysis of TmP4 binding to TNP-ATP in the presence of Mg Table 3-3: Parameters extracted from the kinetic analysis of EcP4 binding to TNP-ATP in the presence of Mg Table 3-4: Kinetic parameters for TNP-ATP binding TmP4 as optimized by MATLAB.141 Table 3-5: Refined kinetic parameters for TmP4 binding TNP-ATP as optimized by MATLAB 148 Table 3-6: Kinetic parameters for EcP4 binding TNP-ATP as optimized by MATLAB..152 Table 3-7: Kinetic parameters for the dissociation of EcP4:TNP-ATP complex as optimized by MATLAB 155 Table 3-8: Refined kinetic parameters for EcP4 binding TNP-ATP as optimized by MATLAB.157 vii
11 List of Figures Chapter 1 Figure 1-1: How E. coli Cells Swim. 5 Figure 1-2: The "Balance Model" for Signaling/Adaptation 8 Figure 1-3: Receptor Signaling Complexes Figure 1-4: The Archetypal Two-Component System Figure 1-5: The Essential Components of the E. coli Chemotaxis System 18 Figure 1-6: Diagram of a Typical Receptor Dimer.20 Figure 1-7: The Structural and Functional Domains of E. coli CheA 23 Figure 1-8: Crystal Structure of the CheA Dimer from the T. maritima CheA Figure 1-9: The ATP Binding Pocket of T. maritima CheA...27 Chapter 2 Figure 2-1: Heterodimers of CheA Demonstrate Trans-Phosphorylation. 43 Figure 2-2: Ribbon Diagram of the Crystal Structure of the P4 domain from Thermotoga maritima CheA Bound to the Nucleotide Analogue TNP-ATP.47 Figure 2-3: Fluorescence emission spectrum of the CheA:TNP-ATP complex when EcA or TNP-ATP is in excess at 4 C Figure 2-4: Fluorescence emission spectrum of the P4:TNP-ATP complex when EcP4 or TNP-ATP is in excess at 4 C..61 Figure 2-5: Results of fluorescence-monitored titrations of EcP4 and TNP-ATP at 4 C Figure 2-6: Results of fluorescence-monitored titrations of EcA and TNP-ATP at 4 C 64 viii
12 Figure 2-7: Fluorescence emission spectrum of the CheA:TNP-ATP complex when TmA or TNP-ATP is in excess at 4 C Figure 2-8: Fluorescence emission spectrum of the P4:TNP-ATP complex when TmP4 or TNP-ATP is in excess at 4 C..68 Figure 2-9: Results of fluorescence-monitored titrations of TmP4 and TNP-ATP at 4 C.70 Figure 2-10: Results of fluorescence-monitored titrations of TmA and TNP-ATP at 4 C.71 Figure 2-11: Results of fluorescence-monitored titrations of diluted TmA with TNP-ATP at 4 C.73 Figure 2-12: Fluorescence emission spectrum of the CheA:TNP-ATP complex when EcA or TNP-ATP is in excess at 25 C.. 74 Figure 2-13: Fluorescence emission spectrum of the CheA:TNP-ATP complex when EcP4 or TNP-ATP is in excess at 25 C Figure 2-14: Results of fluorescence-monitored titrations of EcP4 and TNP-ATP at 25 C...77 Figure 2-15: Results of fluorescence-monitored titrations of EcA and TNP-ATP at 25 C...78 Figure 2-16: Results of fluorescence-monitored titrations of EcP4 and EcA with TNP-ATP at 25 C in buffer lacking Mg Figure 2-17: Cross-linking studies show that both EcP4 and TmP4 do not dimerize over a range of concentrations 82 Figure 2-18: Two Models Depicting CheA Asymmetry. 88 Chapter 3 Figure 3-1: Kinetics of TmP4 binding TNP-ATP in the absence of Mg Figure 3-2: Kinetics of TmP4:TNP-ATP complex dissociation in the absence of Mg Figure 3-3: Kinetics of EcP4 binding TNP-ATP in the absence of Mg ix
13 Figure 3-4: Kinetics of EcP4:TNP-ATP complex dissociation in the absence of Mg Figure 3-5: Biphasic time course observed for TmP4 binding TNP-ATP in the presence of Mg Figure 3-6: Kinetic analysis of the fast phase from biphasic time courses obtained from TmP4 binding TNP-ATP 116 Figure 3-7: Kinetic analysis of the slow phase from biphasic time courses obtained from TmP4 binding TNP-ATP Figure 3-8: Kinetics of TmP4:TNP-ATP complex dissociation in the presence of Mg Figure 3-9: Biphasic time course observed for EcP4 binding TNP-ATP.122 Figure 3-10: Kinetic analysis of the fast phase from biphasic time courses obtained from EcP4 binding TNP-ATP.123 Figure 3-11: Kinetic analysis of the slow phase from biphasic time courses obtained from EcP4 binding TNP-ATP. 124 Figure 3-12: Kinetics of EcP4:TNP-ATP complex dissociation in the presence of Mg Figure 3-13: Kinetic analysis of the fast phase from biphasic time courses obtained from TmA binding TNP-ATP. 129 Figure 3-14: Kinetic analysis of the slow phase from biphasic time courses obtained from TmA binding TNP-ATP Figure 3-15: Kinetic analysis of the fast phase from biphasic time courses obtained from EcA binding TNP-ATP..132 Figure 3-16: Kinetic analysis of the slow phase from biphasic time courses obtained from EcA binding TNP-ATP..133 Figure 3-17: Kinetics of dissociation for TNP-ATP bound CheA dimers from either T. maritima or E. coli Figure 3-18: Comparison of a set of simulated reaction curves to the experimental time courses for TmP4 binding TNP-ATP x
14 Figure 3-19: Optimization performed by MATLAB on the experimental data from TmP4 binding to TNP-ATP Figure 3-20: MATLAB simulation of the hypothetical dissociation of the TmP4:TNP-ATP complex Figure 3-21: Fitting optimization performed by MATLAB on the dissociation data for TmP4:TNP-ATP Figure 3-22: Final optimization performed by MATLAB on the association binding data for TNP-ATP and TmP Figure 3-23: Comparison of a set of simulated reaction curves to the experimental time courses for EcP4 binding TNP-ATP 150 Figure 3-24: Optimization performed by MATLAB on the experimental data from EcP4 binding to TNP-ATP Figure 3-25: Fitting optimization performed by MATLAB on the dissociation data for EcP4:TNP-ATP Figure 3-26: Final optimization performed by MATLAB on the association binding data for TNP-ATP and EcP Figure 3-27: Schematic diagram of the CheA active site depicting the mechanism of CheA binding ATP in the absence and presence of Mg Figure 3-28: Model of the CheA active site depicting possible ways TNP-ATP binds in the absence and presence of Mg Chapter 4 Figure 4-1: Sequence alignments of CheY Homologues. 188 Figure 4-2: Badan-labeled T. maritima CheY..191 Figure 4-3: Absorbance spectrum of Badan-labeled TmY Figure 4-4: SDS-PAGE analysis of Badan-labeled T. maritima CheY 195 Figure 4-5: The effect of Mg 2+, acetyl phosphate, and TmY on the fluorescence emission intensity of free Badan xi
15 Figure 4-6: Effect of phosphorylation and beryllofluoride on the fluorescence emission spectrum of Bdn-TmY Figure 4-7: Effect of T. maritima CheA on the fluorescence emission spectrum of Bdn-TmY 200 Figure 4-8: Effect of TmP1P2 on the fluorescence emission spectrum of Bdn-TmY Figure 4-9: Effect of TmP2 on the fluorescence emission spectrum of Bdn-TmY Figure 4-10: SDS-PAGE analysis of Badan-labeled G. stearothermophilus CheY.204 Figure 4-11: Effect of phosphorylation and beryllofluoride on the fluorescence emission spectrum of Bdn-GsY 205 Figure 4-12: Effect of GsA on the fluorescence emission spectrum of Bdn-GsY 206 Figure 4-13: Effect of phosphorylation and beryllofluoride on the fluorescence emission spectrum of Bdn-EcY V86C..208 Figure 4-14: Effect of E. coli CheA on the fluorescence emission spectrum of Bdn-EcY V86C..210 Appendix C Figure C-1: Model depicting the dissociation of TNP-ATP from CheA when in the presence of excess ATP..241 xii
16 List of Abbreviations Å ADP ADPCP ADPNP A E T Asp ATP ß-ME Badan, Bdn Che C-terminal CW CCW cm cps DTT E Ec EDTA EP Angstrom Adenosine 5'-diphosphate 5'-adenyl(ß,γ-methylene)-diphosphonate 5'adenylyl-ß-γ-imidodiphosphate Denotes both free ATP and TNP-ATP bound to CheA Aspartate Adenosine 5'-triphosphate Beta-mercaptoethanol 6-bromoacetyl-2-(dimethylamino) naphthalene Chemotaxis Carboxy-terminal Clockwise Counterclockwise Centimeter Counts per second Dithiothreitol Enzyme (CheA) Escherichia coli Ethylenediaminetetraacetatic acid Final enzyme-substrate complex intermediate (CheA:TNP-ATP) xiii
17 ES ET E T FC Gs His HPK IPTG ITC k k cat k f K d K m k r kda Me 2 SO MCP MFC Mg 2+ mg min ml First enzyme-substrate complex intermediate Second enzyme-substrate complex intermediate Total concentration of CheA (bound and unbound) Fluorescence counts or coefficient Geobacillus stearothermophilus Histidine Histidine protein kinase Isopropyl ß-D-thiogalactoside Isothermal calorimetry Rate constant Catalytic constant Forward rate constant Equilibrium dissociation constant Apparent dissociation constant Backward rate constant Kilodalton Dimethylsulfoxide Methyl-accepting chemotaxis protein Molar fluorescence response coefficient Divalent magnesium ion Milligram Minute Milliliter xiv
18 mm mm ms NaCl nm NMR N-terminal P-Che PAGE PCR S SDS TCST Tm TNP-ATP Millimolar Millimeter Millisecond Sodium chloride Nanometer Nuclear magnetic resonance Amino-terminal Phosphorylated chemotaxis protein Polyacrylamide gel electrophoresis Polymerase chain reaction Substrate (TNP-ATP) Sodium dodecyl sulfate Two component signal transduction Thermotoga maritima 2'(3')-O-(2,4,6-trinitrophenyl)adenosine 5'-triphosphate µg Microgram µl Microliter µm Micromolar vol wt Volume Wild-type [ ] Concentration C Degrees Celsius xv
19 Chapter 1: Introduction This dissertation research focuses on elucidating the biochemical mechanisms utilized by two proteins, CheA and CheY, to carry out their respective functional roles in the bacterial chemotaxis signal transduction pathway. The introductory chapter provides some general background information about the chemotaxis system as well as information about CheA and CheY that is relevant to the specific biochemical questions that I address in my thesis work. Chapters 2 and 3 present research focused on equilibrium binding studies and binding kinetics of a nucleotide analogue, TNP-ATP, to the protein histidine kinase, CheA, from Thermotoga maritima and Escherichia coli. Chapter 4 focuses on my efforts to generate fluorescent derivatives of CheY proteins from three bacterial species (E. coli, T. maritima, and Geobacillus stearothermophilus) with the long-term goal of being able to easily monitor CheY interactions with Mg 2+, phosphorylating agents, and CheA. The final chapter discusses the overall significance of these studies for understanding how the bacterial chemotaxis system operates as well as some potential implications for the field of drug discovery and the ongoing hunt for inhibitors of histidine kinases. In this chapter, I will first describe what bacterial chemotaxis is and very briefly summarize the long history of studying directed movement by microorganisms. I will provide a brief general overview of the E. coli chemotaxis system and then describe how CheA and CheY participate in a two-component signal transduction pathway. From there, I will provide a general overview of two-component systems, how they accomplish 1
20 signal transduction, their connection to bacterial pathogenesis, and their potential as targets for new antimicrobial drugs. In the next two sections, I will provide a more detailed description of the components of the E. coli chemotaxis signal transduction pathway and then briefly describe some of the similarities and differences between the E. coli chemotaxis system and chemotaxis systems in other bacteria. I will conclude this chapter with a short overview of my research projects where I will describe the general questions addressed, the basic experimental approaches taken, and my general conclusions. HISTORY OF 'CHEMOTAXIS' IN BACTERIA Bacteria were first observed in the 17 th century by Antony van Leeuwenhook who, through a self-made single-lens microscope, recorded the first observations of these cells and their movements. More than fifty years later, a scientist by the name of Christian Ehrenberg identified a gigantic bacterium from a stream in Germany and by studying this species, was the first to observe flagella. Around the same time, Theodor Englemann identified another gigantic bacterium and was the first to observe bacterial behavior: cells moved in response to changes in light stimuli. It was not until the late twentieth century, after considerable progress had been made in identifying bacterial species, as well as with the techniques used to study bacteria, that Julius Adler first began his work on bacterial 'chemotaxis', discovering that E. coli can detect attractants and repellents in their environment [1, 2, 12]. 2
21 'Chemotaxis' in bacteria is actually a misnomer. The term itself implies directed movement in response to chemicals, as "taxis" is defined as non-random, directed movements in response to a stimulus [178]. 'Chemotaxis' was first coined by Wilhelm Pfeffer, in the late 1800's to describe the directed movements of fern spermatozoids in response to malic acid [169]. He later went on to describe what he believed were directed movements of bacteria towards a chemical attractant [12]. Movement in bacteria was later determined to be a result of random turns that are biased in response to an environmental stimulus. This process is more accurately defined as klinokinesis rather than chemotaxis [178]. But in research labs investigating bacterial movements, the term chemotaxis caught on, and so it has become the word most often used to describe klinokinesis in response to chemical stimuli. OVERVIEW OF THE CHEMOTAXIS SYSTEM IN ESCHERICHIA COLI The chemotaxis system of Escherichia coli has been studied as a model signal transduction system for the past fifty years [Reviewed in (7, 50, 155, 161)]. This system consists of a network of proteins which allow the cell-surface receptors of a bacterial cell to communicate with its flagellar motors so that the cell can control its movements in response to perceived chemical gradients. This control allows individual E. coli cells to migrate toward more favorable environments and away from less favorable ones. 'Favorable' in this context is defined in relation to the chemical composition of the immediate surroundings of the cell and its potential effect on the health/viability of the cell. A more favorable environment is one that has a higher concentration of various 3
22 nutrients and/or a lower concentration of potentially harmful chemicals (e.g., acids or toxic metals), while a less favorable environment is one that harbors lower concentrations of nutrients and/or higher concentrations of noxious chemicals. The swimming behavior of an E. coli cell reflects the rotational direction of the flagellar motors that drive rotation of the cell's 6 to 10 flagella. At first glance, this appears to be an astonishingly simple system: if the flagellar motors rotate in a counterclockwise rotation, the cell will propel forward in a somewhat straight line; reversing the motors to a clockwise rotation results in the cell tumbling and changing direction (Figure 1-1A) [Reviewed in (106)]. Despite the apparent simplicity of this binary decision (swim or tumble), the timing of these direction changes is regulated in response to changes in environmental conditions in a manner that is not so simple. In fact, this regulation exhibits some of the hallmarks of sophisticated sensory systems present in 'higher organisms'. For example, the bacterial chemotaxis system integrates positive and negative inputs, has an adaptation ability that stems from a mechanism that compares "past" and "present" conditions, and accomplishes signal amplification. E. coli Biases Its Swimming Pattern in Response to Chemical Gradients. Motile E. coli cells alternate frequently between episodes of swimming and tumbling. During each period of swimming, the cell moves in a more or less straight path (termed a 'smooth swimming run' or just 'run'). In the absence of chemoattractants/repellents, each run lasts ~ 1-2 seconds and is followed by a 'tumble' lasting ~ 0.1 seconds. By alternating between running and tumbling an E. coli cell moves about on a "random walk" [13, 19]. The 4


23 A B Figure 1-1. How E. coli Cells Swim. (A) During "smooth swimming," the flagellar filaments, located randomly on the cell surface, rotate counterclockwise and form a bundle at one end of the cell. These filaments are left-handed helices which generate a wave moving away from the cell, pushing the cell forward. During a tumble event, one or more of the motors change the rotation of their filament from counterclockwise to clockwise. This creates a right-handed helix in that filament, which generates a wave moving towards the cell. The filament breaks away from the bundle and this disruption causes the cell to tumble. Lines illustrate the conformation of the helices; arrow heads show the direction of the wave [Adapted from (106)]. (B) Gradient sensing in E. coli. Bold arrows indicate the direction of increasing gradients, light arrows indicate the path of a cell. The only thing changed between the two paths is the length of runs and tumbles. When heading in a favorable direction, the cell extends its run, decreasing the probability of a tumble. When heading in a less favorable direction, the cell increases the probability of tumbles, and decreases the length of runs [Adapted from (105)]. 5
24 chemotaxis system allows the cell to bias this random walk in response to chemical stimuli present in the environment. As the cell moves in a particular direction, if it senses that it is moving up a gradient of an attractant chemical (or down a gradient of a chemorepellent), then it suppresses the frequency of tumbling such that its run is longer than 1-2 seconds. On the other hand, if the swimming cell finds itself moving down an attractant gradient (or up a repellent gradient), it does not suppress tumbling, and as a consequence the cell somersaults and sets out in a new (random) direction (Figure 1-1B). Using this basic approach, the cell can migrate toward higher concentrations of attractants and/or lower concentrations of repellents [13, 19, 106, 168]. Chemotaxis Responses Involve Two Stages (Excitation and Adaptation) that Work in Tandem to Allow Time-based Comparisons of Environmental Quality. The existence of distinct excitation and adaptation abilities was first proposed to explain the swimming patterns of E. coli observed when cells were subjected to large stepwise increases in attractants or repellents. Immediately after cells were subjected to an attractant stimulus, they ceased tumbling and swam exclusively in a smooth mode. Such responses took place quickly (within ~ 100 milliseconds) [21, 140]. Then, over the next several minutes, the swimming pattern gradually returned to the pre-stimulus pattern of alternating runs and tumbles. A similar two-phase response sequence was observed if cells were exposed to a stepwise increase in repellant concentration. Cells initially tumbled exclusively, then gradually reverted to their pre-stimulus pattern. Macnab and Koshland referred to the rapid initial response as the "excitation phase" and the slower return to the pre-stimulus 6
25 pattern as the "adaptation phase" [107]. Subsequent work has demonstrated that the behavioral events underlying excitation include phosphorylation and dephosphorylation of a protein (CheY) in response to attractant/repellent binding to the chemoreceptors [63]. Phospho-CheY can be viewed as a "tumble factor": high levels of phospho-chey promote tumbling, low levels promote running. During the excitation phase, very quick alterations are made in the level of P-CheY, adjusting the amount of tumble factor up or down, as appropriate. During the adaptation phase, adjustment of the CheY phosphorylation levels are thought to result (indirectly) from alterations of receptor methylation levels [24]. These adjustments reset the level of tumble factor to its prestimulus level so that the cell swimming pattern returns to normal. The phosphorylation and methylation reactions are described more fully later in this chapter. E. coli cells sense gradients of attractants/repellents using a mechanism that involves time-based comparisons (i.e., the chemotaxis system compares "present" to "past") [107]. One way of thinking of this is as follows: during the adaptation phase, attractant concentrations are "recorded" in the methylation state of the receptors, providing an indication of the past. To identify gradients, this record is compared to the amount of ligand bound (reflecting the present) [151]. If less ligand is bound to the receptor than what is "remembered" in the methylation record, the receptor complexes create an excitation signal. Adaptation follows, by adjusting receptor methylation to reestablish the balance (Figure 1-2). With 4-5 methylation sites per receptor, this system of adaptation allows E. coli to respond to a wide range of attractant concentrations [Reviewed in (155)]. 7

 A decrease in ligand binding produces a CW signal by activating (phosphorylating) CheA.")
26 Figure 1-2. The "Balance Model" for Signaling/Adaptation. The receptor-kinase signaling complex serves as a "balance" that "weighs" ligand occupancy against methylation level via an unknown mechanism. (Top) An increase in ligand binding produces a CCW signal by deactivating CheA. This signaling results in the cell having a smooth swimming bias. To adapt, the cell increases methylation by decreasing CheB activity. (Bottom) A decrease in ligand binding produces a CW signal by activating (phosphorylating) CheA. These cells demonstrate a tumbly bias. To adapt, the cell decreases methylation by increasing CheB activity thereby returning the system to a balance between methylation and ligand binding. See Figure 1-5 and the text for descriptions of CheA and CheB. 8
27 The Chemotaxis Signaling Pathway Exhibits Signal Amplification. The chemotaxis signal transduction pathway has an input (ligands binding to receptors) and an output (motor bias). Sourjik and Berg have estimated that the occupancy of about 1 receptor in 1000 is the minimum input needed to effect a change in output in the E. coli chemotaxis system [148]. These numbers suggest that the cell detects a small change in the ligand occupancy and amplifies this signal to produce a greater change in motor output; a gain of a factor of ~ 50 has been estimated for the E. coli chemotaxis system [128, 140]. This signal amplification, in conjunction with the sensory adaptation pathway, allows E. coli to respond to chemotactic stimuli over a concentration range spanning five orders of magnitude [14, 64, 140]. Defining the biochemical mechanism(s) underlying this signal amplification has provided the motivation for detailed biochemical investigations of the signaling components. The Chemotaxis Sensory System Involves Chemoreceptors Regulating Phosphotransfer Reactions in a Two-Component Signal Transduction Pathway. Regulation of flagellar rotation is accomplished by the chemotaxis signal transduction pathway. In this pathway, the autophosphorylating protein kinase CheA is responsible for directing phosphorylation of CheY at a rate that is regulated by the chemotaxis receptor proteins that reside in the cytoplasmic membrane [2]. These receptors cluster at the poles of the cell and form signaling complexes that also include the adaptor protein, CheW, as well as the histidine kinase, CheA (Figure 1-3) [108]. Gradients of attractants and repellents are sensed by the receptors in these signaling complexes, and this affects the kinase activity of CheA, 9


28 Figure 1-3. Receptor Signaling Complexes. Chemotaxis signaling receptors cluster with the aid of CheW and CheA, to form signaling complexes at the poles of the cell. Although the stoichiometry of receptor complexes (inset) remains controversial, the most recent research suggests that a minimal functional complex formed in vitro has a ratio of 6 receptor dimers to 8 CheW monomers to 1 CheA dimer. Polar clusters potentially could include thousands of receptors and hundreds of molecules of CheA and CheW [33,145]. 10
29 which, in turn, determines how much of the CheY in the cell is phosphorylated at any given time. In the absence of any attractants or repellents, the receptors in these signaling complexes direct CheA to autophosphorylate at some moderate rate. This, in turn, generates a corresponding moderate level of the "tumble factor" phospho-chey, which is responsible for the alternating running and tumbling that takes the cell on a random walk. When the receptors detect an increased concentration of some attractant, they decrease the autokinase activity of CheA. This, in turn, results in a decreased level of phosphorylated CheY as the rate of CheY phosphorylation plummets and the existing P- CheY quickly dephosphorylates. The end result of this regulation (the decreased level of "tumble factor") causes the cell to suppress tumbling thereby continuing its run. Responses to repellent stimuli presumably involve CheA activation to generate more phospho-chey that quickly diffuses from the receptor:chew:chea signaling complexes to the flagellar motors where it can promote tumbling. However, the biochemical events underlying repellent responses have not yet been defined in detail. The two central players in the chemotaxis signaling pathway (CheA and CheY) communicate with one another by a mechanism that involves the transfer of a phosphoryl group from CheA to CheY, more specifically from His48 of CheA to Asp57 of CheY. A similar His-Asp phospho-relay mechanism is utilized by hundreds of distinct (nonchemotaxis) signal transduction pathways, collectively referred to as two-component signal transduction (TCST) pathways [129]. 11
30 TWO-COMPONENT SYSTEMS, PATHOGENICITY, AND DRUG DEVELOPMENT The Two-Component Paradigm. The archetypal two-component system consists of a sensor kinase (which resembles CheA) and a response regulator (which resembles CheY) (Figure 1-4) [127]. The sensor kinase receives signals from the environment and in response to those signals, adjusts its autophosphorylation activity. Once the kinase is phosphorylated on a specific histidine residue, the phosphate signal is then transferred to the response regulator where it covalently attaches to a specific aspartate residue. This phosphorylation activates the response regulator to carry out its function. In many cases, the response regulator is a transcription factor that functions to alter gene expression [37]. The chemotaxis signal transduction pathway is more complex than the archetypal two-component system in several respects [Reviewed in (104)]. In the chemotaxis pathway, instead of a single protein acting as the sensor kinase, three proteins (chemoreceptors, CheW, and CheA) work together to accomplish the functions of a typical sensor kinase. Another complexity lies with the response regulators. While most two-component systems have a single response regulator for each cognate sensory kinase, the chemotaxis system utilizes two response regulators, CheY and CheB. In addition, the chemotaxis system has a dedicated phosphatase that quickly removes the phosphoryl group from phospho-chey, while most TCST systems do not have such a component (although in some cases the sensory kinase can function as a phosphatase [129]). The Role of Chemotaxis in Bacterial Pathogenesis. Chemotaxis has long been speculated to play an important role in pathogenicity [4, 104] although, to date, no drugs have been 12

.")
31 Figure 1-4. The Archetypal Two-Component System. The classic two-component system consists of two distinct proteins. The sensor protein recognizes environmental stimuli and alters its autophosphorylation activity at a conserved histidine residue in response to those stimuli. The response regulator receives the phosphate at a conserved aspartate residue. Phosphorylation of the receiver domain of the response regulator activates its output domain to perform some specific function in the cell (e.g., alter gene expression or change swimming pattern). Colors relate to the various components in Figure 1-5. [Figure adapted from (127)]. 13
32 developed to inhibit this important pathway. Pathogenic bacteria such as Salmonella enterica, Helicobacter pylori, and Campylobacter jejuni, appear to require chemotaxis in order to establish infections effectively. [Reviewed in (104)]. In studies with Salmonella, mutations in the chemotaxis receptor genes trg, tar, or cher, led to a decrease in, or even complete inhibition of, intestinal colonization in gnotobiotic pigs [98]. H. pylori cells carrying deletions of chey or chea were unable to colonize the mucus layer in the stomachs of mice [52]. The failure of non-chemotactic mutant strains of C. jejuni to colonize the intestinal tract of mice lends further support to the idea that chemotaxis is important for, if not vital to, pathogenesis for at least some bacteria [177]. Another highprofile bacterium, Pseudomonas aeruginosa, exhibits a chemotactic response towards mucin from cystic fibrosis patients, an ability that might contribute to the initial stages of colonization of lung tissue [120]. The chemotaxis genes also may play a role in regulation of toxin production in addition to their role in colonizing the host. For example, in recent studies with Vibrio cholerae, insertional mutations in chemotaxis genes resulted in a delay in the expression of ToxT, a transcriptional activator of virulence genes [87]. This regulation has been theorized to play an important role in the life cycle of this particular pathogen. One model suggests that repression of chemotaxis increases shedding from the human host thereby continuing the pathogen's life cycle [115]. The CheA protein kinase is universal among chemotactic bacteria [176], and therefore developing inhibitors of this protein kinase may lead to potential anti-microbial therapies. 14
33 Two-Component Signal Transduction Pathways as Drug Targets. TCST systems are attractive targets for anti-microbial drug development for several reasons. The connection between chemotaxis TCST pathway and pathogenesis was discussed in the preceding subsection. Other TCST pathways directly regulate expression of virulence factors for pathogens including Pseudomonas aeruginosa (AlgR2-AlgR1 and PilS-PilR), Vibrio cholerae (ToxS-ToxR), Agrobacterium tumefaciens (VirA-VirG), Bordetella pertussis (BvgS-BvgA), and Neisseria gonorrhoeae (PilB-PilA) [Reviewed in (29, 48)]. In addition, there are TCST systems responsible for regulating some vital cellular functions, such as osmoregulation (EnvZ-OmpR) and metabolic regulation (NtrB-NtrC, ArcB-ArcA) [88, 122, 129, 133]. Indeed, many bacteria make extensive use of TCST systems, utilizing as many as distinct sensor kinase-response regulator pairs in a single bacterial cell [100]. The sensor kinases and response regulators from these systems typically share 20-30% amino acid sequence identity, but at the active sites, conservation is considerably higher than this, suggesting that they utilize similar/common biochemical mechanisms that, in theory, could be targeted by appropriate inhibitors [129, 184]. Thus, targeting these systems with new drugs could provide a mechanism for inhibiting microbial growth and/or for preventing expression of virulence factors [100]. TCST systems are present in most bacterial species but have yet to be identified in mammals [37, 100, 129]. This makes them potentially attractive drug targets because inhibitors could serve as proverbial "magic bullets" that hinder resident bacteria (e.g., at an infection site) without hurting the host organism harboring the microbes. Pharmaceutical research is actively pursuing the development of antimicrobial agents 15
34 with broad specificity towards multiple two-component systems, by manufacturing chemicals to target the protein kinase [11, 64, 100]. Unfortunately, so far these types of broad specificity drugs have exhibited poor selectivity, affecting the host cells as well as systems other than the targeted two-component systems in bacteria [64]. Therefore, developing drugs for specific two-component systems, such as the chemotaxis pathway, may prove to be more successful when developing anti-microbial drug therapies. Although drugs that function by inhibiting eukaryotic kinases are relatively common, few chemicals have been identified as inhibitors of the protein kinases of prokaryotic two-component systems [100]. A study in the early 1990's screened 25,000 compounds and found two classes of chemicals that inhibited the AlgR2-AlgR1 twocomponent system in P. aeruginosa [135]. One class was found to inhibit the autophosphorylation activity as well as the autophosphatase activity of the kinase AlgR2, while the other class inhibited AlgR1. The two classes of inhibitors were also tested on kinases of other two-component systems to assess specificity The class of chemicals that inhibited AlgR1 was found to inhibit the kinase activities of CheA, NtrB (the kinase involved in the nitrogen assimilation two-component system of E. coli) and KinA (the kinase involved in sporulation in B. subtilis). In the latter part of the 1990's, a chemical that is part of the hydrophobic tyramine family was determined to be a potent inhibitor of the autophosphorylation reaction of KinA [11]. This inhibition was competitive with respect to ATP [11]. By screening the chemical libraries accumulated by pharmaceutical companies, other classes of chemicals were found to inhibit prokaryotic protein kinases. However the mode of action for most of these chemicals is poorly understood [100]. 16
35 Understanding the mechanism of action for inhibitors of prokaryotic protein kinases could lead to effective drug development for the control of pathogenic bacteria via inhibition of two-component systems. COMPONENTS OF THE E. COLI CHEMOTAXIS SYSTEM The essential components of the E. coli chemotaxis signal transduction pathway are presented in Figure 1-5. The following section will focus on the individual components that constitute the three main parts of the chemotaxis signal transduction pathway: the receptor signaling complexes, the excitation pathway, and the adaptation pathway. Environmental signals are first received by the receptor signaling complexes residing at the inner membrane of the bacterial cell. These complexes activate the two branches of the chemotaxis signaling pathway (excitation or adaptation) by passing the phosphate signal to CheY or CheB. Phospho-CheY initiates the excitation pathway which causes direct changes in the swimming behavior of the cell. Phospho-CheB activates the adaptation pathway, which allows the cell to adapt to constant stimulus levels (eq. 1-1). Receptor:CheW:CheA-P signaling complex P-CheY P-CheB Excitation Pathway Adaptation Pathway (eq. 1-1) 17


36 Figure 1-5. The Essential Components of the E. coli Chemotaxis System. When recepters, residing in the inner membrane, bind chemoattractants/repellents, these receptors alter the autophosphorylation activity of the histidine kinase, CheA. CheA can transfer its phosphate to one of two response regulators, CheY or CheB. Upon phosphorylation, CheY diffuses through the cytoplasm and binds to FliM, a protein that is part of the switch component of the motor. Upon binding phospho-chey, the motor rotates the flagellar filament clockwise, causing the cell to tumble. Phospho-CheY is dephosphorylated by CheZ. Phospho-CheB acts in the sensory adaptation pathway as a methylesterase, removing methyl groups from the cytosolic portion of the receptors. CheR functions as the antagonist to CheB, adding methyl groups to four specific glutamate side chains located within the receptors. Colors relate to Figure 1-4. [Figure adapted from (91)]. 18
37 Receptor Signaling Complexes. Receptor signaling complexes are composed of three types of proteins: the chemotaxis receptors, the coupling protein, CheW, and the histidine kinase, CheA [55, 56, Reviewed in (145)]. Chemotaxis Receptors. The chemotaxis receptors are transmembrane proteins that bind attractant and repellent molecules present in the bacterial cell's environment [Reviewed in (50, 155, 168)]. Receptors are composed of a sensory domain, a transmembrane domain, a linker region, the methylation region, and the signaling domain (Figure 1-6) [50]. With one exception (Aer), the sensory domain of each chemoreceptor resides in the periplasm and can directly bind many chemical ligands, although a few attractant molecules must first bind to periplasmic binding proteins before interacting with a chemoreceptor. The linker region, methylation region, and signaling domain of each chemoreceptor protein reside in the cytoplasm. The methylation region contains four glutamate residues which are reversibly methylated by components of the adaptation pathway [77, 152, 167, 182 and Reviewed in (151)]. It has been proposed that when an attractant (or repellent) binds the sensory domain of a receptor, the receptor undergoes a conformational change. This change is transmitted to the signaling domain and thereby affects the autophosphorylation activity of the CheA that is 'coupled' to the receptor within the receptor:chew:chea signaling complexes [24, 35, 50, 60-63, 56, 97, 123]. In E. coli there are five distinct chemotaxis receptors: Tar, Tsr, Trg, Tap, and Aer. Tar mediates taxis towards the attractants aspartate, glutamate, and maltose (maltose requires participation of the periplasmic maltose-binding protein) and away from the 19


38 Figure 1-6. Diagram of a Typical Receptor Dimer. Receptors exist as homodimeric proteins with five distinct regions. In the aspartate receptor, the periplasmic sensory domain contains symmetrical aspartate binding sites which bind the attractant with strong negative cooperativity [16]. The transmembrane region spans the hydrophobic phospholipid bilayer and the linker region connects the transmembrane region to the methylation region. The methylation region contains four glutamate residues which are methylated by CheR and demethylated by CheB. The signaling domain binds CheW and CheA and functions to transmit environmental signals to the histine kinase, CheA. [Figure adapted from (50)]. 20
39 repellents nickel and cobalt. Tsr mediates taxis towards serine (and several small organic molecules with structures similar to serine) and away from leucine. Trg mediates taxis towards attractants ribose and galactose, both of which must first interact with periplasmic binding proteins. Tap mediates taxis towards dipeptides via the dipeptidebinding protein. Finally, Aer mediates tactic responses to O 2 levels [(2, 15, 80, 109, 150) Reviewed in (168)]. Tar and Tsr constitute the majority of the chemotaxis receptors with ~5,000 copies of each type per cell. Trg, Tap and Aer are present at much lower levels with ~500 copies of each per cell [128]. Purified receptor proteins form homodimers with two symmetrical ligand binding sites [50, 116]. In the case of the Tar homodimers, these binding sites display strong negative cooperativity when binding aspartate [16]. Crystal structures of Tsr suggest that each receptor homodimer forms a complex with two other homodimers, forming a 'trimer-of-dimers' [79, 145, 171]. The homodimers within these trimers of dimers need not be identical. Mixed complexes such a (Tsr) 2 :(Tar) 2 :(Trg) 2 are possible as well as complexes such as (Tar) 2 :(Tar) 2 :(Tar) 2 [Reviewed in (145)]. In vivo, these trimers-ofdimers form higher order signaling clusters with the aid of CheW and CheA (Figure 1-3). The signaling clusters appear to accumulate at the poles of the cell and may contain up to 7,500 receptors [108, 145, 146]. The stoichiometry of the receptors, CheW, and CheA in these signaling clusters remains controversial. The most recent research suggests that a minimal complex with a ratio of 6 receptor dimers to 8 CheW monomers to 1 CheA dimer, provides for optimal kinase activation in vitro [90, 145]. Another suggestion, based upon the cellular stoichiometry of the chemotaxis proteins, proposes that one 21
40 trimer of receptor dimers, two CheW monomers, and one dimer of CheA combine to form a functional unit [95, 145]. CheW. CheW, an 18 kda protein, is an essential component of the chemotaxis signal transduction pathway: deletion or overexpression of chew results in complete loss of chemotaxis ability (a Che - phenotype) and an extreme smooth-swimming bias [55, 126, 138]. Cells lacking CheW or overproducing this protein tumble very infrequently and cannot modulate their swimming pattern in response to attractants or repellents. CheW is composed of two fused SH3-domains [58] and its role in signal transduction appears to act as an 'adaptor protein' that physically links CheA to the chemoreceptors in signaling complexes that allow the receptors to regulate the autokinase activity of CheA [55, 56]. An NMR structure for CheW from T. maritima is available [58] and in-depth mutational studies have defined surfaces on the protein that interact with CheA and Tar [27, 28]. CheW is required for productive CheA-receptor interactions in vitro and in vivo [108, 146]. CheA. The final player in the receptor-signaling complex is the protein histidine kinase CheA. E. coli chea null mutants have an extreme smooth-swimming bias (they tumble very infrequently) and are unable to control their swimming pattern in response to attractant or repellent stimuli [126]. CheA is a 654 amino acid (71 kda) protein comprised of five structural/functional domains (P1-P5) (Figure 1-7) [50, 55, 144, 168, 173]. In vitro, and presumably also in vivo, CheA forms homodimers, and this 22

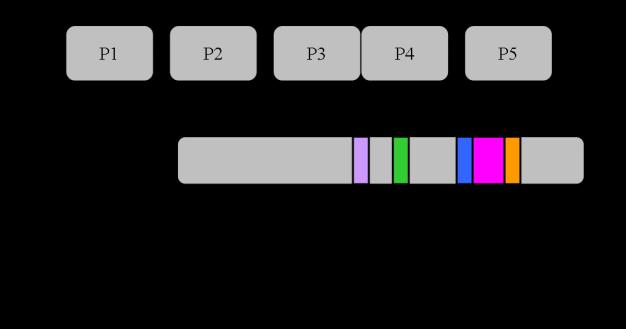
41 Figure 1-7. The Structural and Functional Domains of Escherichia coli CheA. CheA has five domains as defined by various NMR, X-ray crystallography and protease sensitivity methods. The P1 domain contains the conserved histidine residue which is reversibly phosphorylated. The P2 domain reversibly binds the response regulators CheY and CheB. P3 is responsible for dimerization of CheA. The P4 domain binds ATP and catalyzes the autophosphorylation reaction. The P5 domain binds the adapter protein CheW as well as the chemotaxis receptors. Refer to text for publication references. [Figure adapted from (33, 154)]. 23
42 dimerization is necessary for the protein to be functional as an autokinase [172]. The C- terminal, regulatory domain (P5) binds to CheW and the receptors [30, 129]. The P4 domain, which contains the ATP-binding active site, catalyzes an autophosphorylation reaction, transferring the γ-phosphate of ATP to the imidazole side chain of His48 located in the P1 domain of the accompanying protomer. This is a trans-phosphorylation reaction where one protomer in a CheA dimer phosphorylates the other protomer [60-63, 89, 123, 174, 190]. The P4 domain contains four sequence motifs (N, G1, F, G2) that are conserved among most members of the large superfamily of histidine protein kinases (Figure 1-9A) [3, 17]. The P1 domain contains the phosphorylation site, His48 [60, 173], as well as some amino acid residues that contribute to catalysis of the autophosphorylation reaction [134]. The phosphoryl group of phospho-chea is transferred from His48 to either CheY or CheB which 'dock' at the P2 domain of CheA [62, 173]. Although CheY and CheB compete for binding to the P2 domain, these response regulators appear to utilize different specific recognition motifs during this binding [93, 100]. The final domain of CheA, P3, is responsible for dimerization [89]. When the chea gene is expressed in E. coli (and numerous other bacteria), two versions of the CheA protein are produced: the full-length CheA (CheA L ) molecule and a truncated version (CheA S ) that results from ribosomes utilizing an alternative start site [144, 168]. CheA S lacks the N-terminal 97 amino acids of CheA L (including the phosphorylation site) and is produced at lower levels than CheA L. E. coli cells expressing a version of chea that directs production of only CheA L (and no CheA S ) 24
43 exhibit normal chemotaxis ability (at least within the confines of the laboratory), so the role of CheA S in chemotaxis is unclear [136]. CheA is one of the best characterized two-component sensor kinases. Extensive genetic, biochemical, and structural investigations contribute to an understanding of how CheA functions in vitro as well as in living cells. The overall domain architecture of CheA is supported by detailed structural analyses as well as by low resolution approaches such as protease sensitivity assays [118]. NMR structures exist for the isolated P1 and P2 domains from E. coli CheA [113, 194]. X-ray crystallography studies have determined the structure of the P3-P4-P5 domains from Thermotoga maritima (Figure 1-8) [17]. Further x-ray crystallography studies have provided a detailed view of the isolated P4 domain from T. maritima CheA bound to various ATP analogues (Figure 1-9B) [18]. The Excitation Pathway. In response to an increase in the concentration of attractants in the cell's environment, the receptor proteins of the signaling complex signal CheA to decrease its rate of autophosphorylation, which, in turn, decreases the phospho-chey levels in the cell resulting in a decreased frequency of tumbles [62]. Two proteins, CheY and CheZ, constitute the excitation pathway of the chemotaxis signal transduction system. CheY. CheY, a 14 kda, soluble, globular protein, functions to relay the "tumble signal" from CheA to the flagellar motor proteins [62, 111, 188]. CheY binds CheA with a K d of 1-2 µm [93, 173]. Once bound to phospho-chea, CheY phosphorylates at Asp57 [137]. 25

44 N N C C Figure 1-8. Ribbon Diagram Representing the Crystal Structure of the P3-P4-P5 Domains from the Thermotoga maritima CheA Dimer. Ribbon diagram of the crystal structure of CheAΔ289 homodimer at 2.6 Å resolution. Blue ribbon represents the P3 dimerization domains. In this crystal structure, one P3 domain from one protomer interacts with the P3 domain of another protomer to form the dimer. Green represents the P4 ATP-binding domains, and red represents the P5 domains. The yellow ribbon (flanked by green) represents the ATP binding pockets within the CheA dimer. Each dimer has two ATP-binding pockets located on opposite sides of the molecule. PDB accession code: 1b3q [17]. Figure was produced with the WebLab ViewerLite program. 26

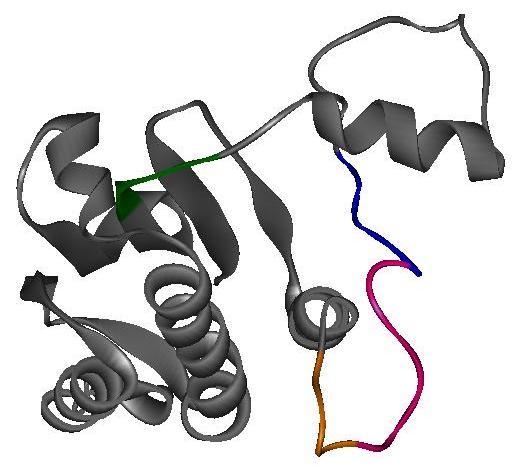
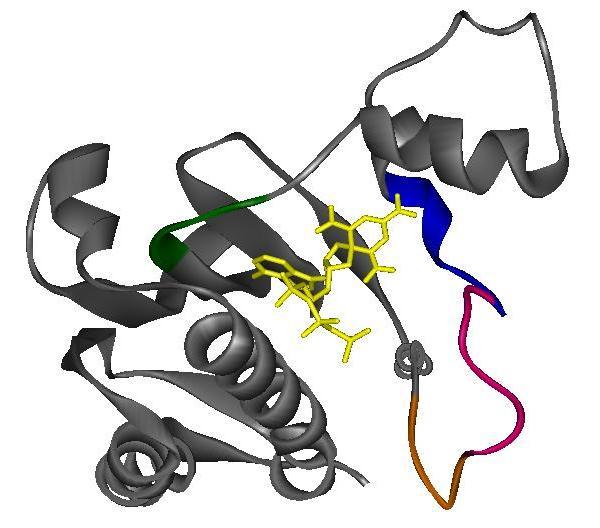
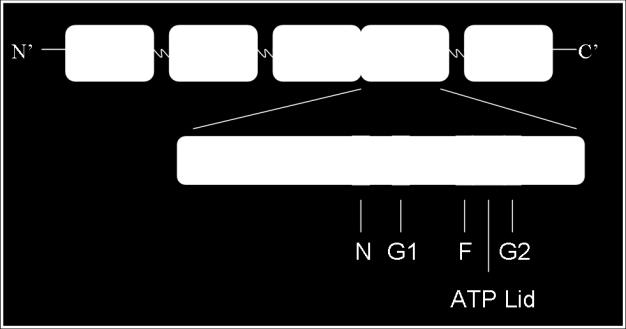
45 A B
46 Figure 1-9. The ATP Binding Pocket of Thermotoga maritima CheA. (A) Schematic diagram of the ATP binding pocket of CheA from Thermotoga maritima. The ATP binding pocket lies within the P4 domain of CheA. The binding pocket includes four sequence motifs that are highly conserved in the histidine kinase superfamily: the N box, the G1 box, the F box, and the G2 box. (B) Ribbon diagrams of crystal structures of the P4 domain from Thermotoga maritima with various ATP analogues bound: (1) Empty (2) ADPCP-Mg 2+ and (3) TNP-ATP. The ATP lid region (magenta) undergoes significant conformational change upon binding ADPCP-Mg 2+. This same change (termed "lid closure") is not seen when TNP-ATP binds the P4 domain. However, the F box region (blue) undergoes conformational changes in both nucleotide-bound structures. Colors coordinate with the sequence motifs in part A. PDB accession codes: (1) 1b3q, (2)1i58, (3) 1i5d. Figures were produced with WebLab ViewerLite. 28
47 This phosphorylation alters the conformation of CheY thereby increasing its affinity for FliM (the flagellar basal body protein which is part of the switch component of the flagellar motor) [188]. When phospho-chey binds FliM, there is a marked increase in the probability that the motor will reverse direction and spin clockwise, causing the E. coli cell to tumble [188]. Phosphorylation of CheY also increases the affinity of its interaction with CheZ (the phosphatase) [20], while decreasing the affinity of the CheY- CheA interaction [93]. Considerable structural detail is available for CheY. Crystal structures of CheY from E. coli and Salmonella typhimurium have been generated along with a crystal structure of T. maritima CheY bound to the P2 domain of CheA [124, 163, 186]. The crystal structure for Mg 2+ -bound CheY from S. typhimurium has also been solved [164]. However, the crystal structure of phospho-chey has yet to be determined, due to the extremely short half-life of the phospho-aspartate linkage (~ 10 seconds) [62]. A crystal structure has been determined for CheY bound to BeF - 3 (the beryllofluoride anion is capable of binding to the CheY active site thereby mimicking the phospho-aspartate linkage formation at Asp57) [191]. In-depth genetic studies have been done to define the role of CheY in chemotaxis. A chey null mutant is incapable of tumbling and cannot control its swimming pattern in response to any repellents or attractants [128]. Overexpressing CheY in an E. coli cell will cause the cell to tumble incessantly, rendering the cell nonchemotactic [40]. 29
48 CheZ. Phospho-aspartate linkages are inherently unstable because they are susceptible to hydrolysis. Although phospho-chey can catalyze its own dephosphorylation (shortening the half-life of the the phospho-aspartate bond to seconds), CheZ acts to reduce this half-life even further [60, 62, 193]. CheZ helps to increase the rate of dephosphorylation by positioning a water molecule in the correct orientation to promote a nucleophilic attack on the phospho-aspartyl linkage of phospho-chey [193]. A 24 kda protein, CheZ functions as a dimer [161, 193]. Genetic studies have shown that chez null mutants have a severe bias toward tumbling and are not capable of chemotaxis [126]. Overexpression of CheZ also renders the cells non-chemotactic, but in this case due to an extreme smooth-swimming bias [85]. A detailed view of the CheZ-CheY interaction results from the crystal structure of CheZ complexed with CheY, Mg 2+, and the phosphoryl analogue BeF - 3 [59]. The Adaptation Pathway. The adaptation pathway (involving CheA phosphorylation of CheB) is responsible for enabling E. coli cells to detect and respond to a wide concentration range of chemotactic stimuli. In the case of aspartate, E. coli cells can detect concentrations as low as 5 nanomolar yet remain responsive to small concentration changes at background levels as high as 1 millimolar [14, 64, 140]. The cell senses gradients of attractants/repellents using a mechanism that involves time-based comparisons of the methylation state of the receptors to the amount of bound ligand (Figure 1-2) [107]. Two proteins, CheR and CheB, function in the adaptation pathway by catalyzing the reversible methylation and demethylation of key positions on the 30
49 chemoreceptors. These two proteins can both be found in the large receptor:chew:chea signaling complexes located at the poles of E. coli cells [9]. CheR. CheR is a 30 kda, monomeric methyltransferase that uses the methyl source S- adenosyl-methionine to methylate four specific glutamate side chains within the cytosolic portion of the receptors. This reaction forms γ-glutamyl methylesters [143]. The crystal structure of CheR shows a two-domain protein. The N-terminal domain is thought to mediate receptor binding as CheR can bind to a specific helix of the receptor proteins. The C-terminal domain binds the receptor pentapeptide "NWETF", a motif found at the C-terminal end of the major chemoreceptors Tar and Tsr. The active site of CheR lies between these two domains [45, 50]. CheB. CheB is a methylesterase that is responsible for removing the methyl groups that CheR attaches to the chemoreceptors [167]. Like CheY, CheB can acquire a phosphoryl group from phospho-chea in a His-Asp phosphotransfer [62]. Upon phosphorylation, CheB hydrolyzes the methyl ester groups present on the cytoplasmic domains of the chemoreceptors, thereby producing methanol [167]. CheB also catalyzes a deamidation reaction, removing the amido group from certain glutamine residues of the chemoreceptors, changing them to glutamate [76]. CheB is a two domain, 37 kda protein with an N-terminal regulatory domain and a C-terminal catalytic domain [142]. The regulatory domain resembles CheY and includes a phosphorylation site at Asp56. The C-terminal domain of CheB encompasses the methylesterase active site [46, 189, 31
50 162]. Crystal structures exist for the full-length protein as well as for the 21 kda catalytic domain [46, 189]. CheB's methylesterase active site has been defined, and the basic mechanism of phosphorylation-dependent regulation of this active site has been characterized [46, 189]. In its unphosphorylated state, when CheB is inactive as a methylesterase, its N-terminal domain packs against the C-terminal domain precluding access to the methylesterase active site [46]. Phosphorylation within the N-terminal domain causes subtle changes in the interdomain interface within CheB [72]. These changes not only relieve inhibition of the catalytic domain, but also stimulate the methylesterase activity of CheB beyond the level expected for simply removing the blockade imposed by the N-terminal domain [8]. Studies with cher and cheb mutants have demonstrated the importance of sensory adaptation for the overall efficacy of the chemotaxis system: cher and cheb mutants are incapable of chemotaxis. The phenotypes of cher and cheb null mutants reflect the effects of receptor methylation/demethylation on the signaling properties of the chemoreceptors: over-methylation of the receptors in an E. coli cell (caused by deleting cheb or overexpressing cher) causes the receptors to inappropriately stimulate CheA autokinase activity [159, 167]. The resulting high level of phospho-chey then causes the cell to tumble incessantly and inappropriately. By contrast, under-methylation of the chemoreceptors (caused by deletion of cher or overexpression of cheb) causes the receptors to set CheA autokinase activity at some inappropriately low level [152, 159]. The resulting low level of phospho-chey then means that the mutant cell will spend almost all of its time 'running'. In addition to the bias problems associated with aberrant 32
51 receptor methylation levels, mutants that lack an intact methylation/demethylation system do not have the ability to modulate the signaling properties and ligand-binding affinities of their receptors following detection of a stimulus. So even if such cells do respond to an attractant or repellent, they have no way of turning off that response and cannot detect a chemical gradient [148]. Cellular Stoichiometry for the Components of the Chemotaxis Pathway. The components of the chemotaxis signaling pathway have been quantified with the following in vivo concentrations for E. coli cells grown in minimal media: CheY (12 µm), CheW (14 µm), CheZ (5 µm), CheB (0.4 µm), CheR (0.3 µm), total CheA (9 µm) with approximately 67% CheA L and 33% CheA S, and total chemotaxis receptors (36 µm) (36, 95]. CHEMOTAXIS SYSTEMS IN OTHER BACTERIA Among bacterial species, there are some differences in both the functional and structural aspects of the chemotaxis signal transduction system. In Bacillus subtilis, for example, an increase in attractant concentration causes an increase in phospho-chey concentration levels. This phospho-chey binds the motor proteins to elicit a counterclockwise motion causing the cell to maintain a 'run' [53]. This is opposite to the signaling direction observed in E. coli, where a response to attractants causes a decrease in phospho-chey levels to promote CCW flagellar rotation. Another difference observed in B. subtilis is that its chemotaxis pathway includes several signaling proteins (e.g., CheV and CheD) that are not present in the E. coli system [53, 104]. Even more 33
52 extensive variations on the 'minimal E. coli Che system' are observed in other bacterial species, including the presence of multiple homologues of CheY or CheA, or even multiple complete chemotaxis signal transduction pathways that interact to form a network [104]. For example, the chemotaxis system of Rhodobacter sphaeroides consists of 13 chemoreceptors, 4 CheWs, 4 CheAs, 6 CheYs, 2 CheBs, and 3 CheRs [104, 132]. Although these differences exist among bacterial species, the chemotaxis receptors, CheA, CheW, and CheY appear to be universal among all chemotactic bacteria and archea [176]. Comparative studies of the chemotaxis signaling systems in these different bacteria can provide insights into how these systems function. One interesting (and potentially very important) observation has come to light as a result of such comparative studies. The structures of E. coli CheY and T. maritima CheY are very similar, as are the structures of the E. coli and T. maratima P2 domains (the CheY-binding domain of CheA). Conventional wisdom would suggest that the protein-protein contacts in the CheY:P2 complexes would involve similar protein surfaces (i.e., binding of E. coli CheY to P2 should result from binding interactions that are very similar to those used by T. maritima CheY and P2). However, surprisingly, Park et al. [124] found that the X-ray crystal structure of the T. maritima CheY:P2 complex is quite different from the E. coli CheY:P2 complex. The T. maritima CheY:P2 complex uses different protein surfaces than those utilized by the E. coli complex. This finding suggests that in order to generate an accurate overall view of bacterial chemotaxis signaling, detailed analyses of several systems are required. 34
53 GENERAL GOALS AND SPECIFIC AIMS The overall goal of the research presented in this dissertation is to fill some basic gaps in our current understanding of CheA and CheY function. Chapters 2 and 3 focus on the nucleotide binding reaction of CheA. The central hypothesis for these studies is that the examination of the detailed interactions of CheA with TNP-ATP (a fluorescence nucleotide analogue) could provide insight into the CheA active site and insight into protein-protein interactions within the CheA dimer. Chapter 4 summarizes my efforts to utilize fluorescently labeled versions of CheY (isolated from several different bacterial species) to study CheY phosphorylation and binding reactions. The overall hypothesis tested in this project is that the unique cysteine residue present in two CheY orthologs could be labeled with an environmentally sensitive fluorescent probe that would respond to binding and phosphorylation events. Below, I present a brief overview of the rationale underlying each project and the general conclusions I have reached. Chapter 2. CheA functions as a homodimer and accomplishes its autophosphorylation reaction by having one CheA protomer bind ATP and deliver the γ-phosphoryl group from ATP to a His side chain on the second CheA protomer. In such dimers, protein subunits might interact to generate positive or negative cooperativity (or no cooperativity at all), and such interactions might dictate how CheA functions in living cells. These possibilities have not been examined extensively in previous work. In Chapter 2, I performed equilibrium binding experiments that monitored the fluorescence signal generated when TNP-ATP binds to the active site of monomeric and dimeric versions of 35
54 CheA. My results indicated strong negativity cooperativity for TNP-ATP binding to dimeric CheA. To my knowledge, this work represents the first concerted effort to examine cooperative nucleotide binding in a histidine protein kinase. The fact that most, if not all, HPKs are dimers raises the possibility that cooperative ATP binding interactions are a general feature of histidine protein kinases. Chapter 3. In this chapter, I focused on examining the kinetics of nucleotide binding to the CheA active site. The overall goal here was to use kinetic experiments to define basic features of the mechanism underlying binding of TNP-ATP to CheA and then to compare this mechanism with that proposed previously for binding of unmodified ATP to CheA. As in Chapter 2, I monitored the fluorescence signal produced when TNP-ATP binds to CheA. Using a stopped-flow apparatus, I followed the CheA + TNP-ATP binding and dissociation reactions on a millisecond timescale. I analyzed these data using traditional, "graphical" data manipulations as well as a more modern "global" technique relying on the mathematical software MATLAB. This analysis indicated that the TNP-ATP binding mechanism differs in several respects from the unmodified ATP binding mechanism. I proposed a minimal reaction scheme for CheA binding TNP-ATP that included three consecutive steps, and I related this kinetically-defined mechanism to the structure of the CheA active site to discuss what might be occurring during each of these three steps. 36
55 Chapter 4. This final study focused on extending an approach initially developed by the Stewart lab to study the phosphorylation and binding events of E. coli CheY. Taking advantage of the unique cysteine residue present in Thermotoga maritima CheY and Geobacillus stearothermophilus CheY, I covalently attached an environmentallysensitive fluorescent label (Badan) to these proteins. These Badan-labeled versions of CheY exhibited fluorescence changes when phosphorylated and when exposed to CheA. These fluorescence signals allowed me to define the affinity of TmCheY and GsCheY for CheA. These results pave the way for more detailed analyses that could examine, for example, the CheA-CheY binding kinetics for the G. stearothermophilus and T. maritima proteins. Although the chemotaxis systems of G. stearothermophilus and T. maritima are similar to that of E. coli, there are some intriguing differences that will make detailed comparisons informative. My studies have provided some tools that will be useful for such comparisons. EXPERIMENTAL APPROACHES: GENERAL CONSIDERATIONS The kinetics of CheA phosphorylation and CheA phospho-transfer to CheY have often been studied using 32 P. Though labor-intensive, this technique was used extensively in defining the biochemical properties of the Che proteins. For example, Hess et al., in the late 1980's, were the first group to study phospho-transfer from phospho-chea to CheY by using 32 P-labeled-CheA generated by incubating purified CheA with γ- 32 P-ATP [60-63, 123]. Tawa and Stewart performed a detailed kinetic analysis of CheA's autophosphorylation and dephosphorylation reactions by using 32 P to 37
56 quantify levels of protein phosphorylation [180]. Hirschman et al. used γ- 32 P-ATP to study how active site mutations in CheA affect its phosphorylation rate [69]. Some of the earliest studies of the CheA trans-phosphorylation reaction, performed by Wolfe and Stewart, relied on radioactivity to track and monitor phosphorylation [190]. 32 P provides a very sensitive way to directly monitor CheA phosphorylation. However, using radioactively-labeled ATP does not provide an easily monitored signal reflecting CheA binding ATP, nor does it provide a way to follow the CheA-CheY binding reaction or to investigate the mechanisms underlying these reactions. Fluorescence-based experimental approaches have been useful in circumventing some of these limitations. Such approaches have provided a simple, yet sensitive method for studying CheY phosphorylation and for analyzing some of the binding reactions in the chemotaxis pathway. For example, in the late 1990's, the CheY phosphorylation reaction was examined by monitoring the intrinsic fluorescence of CheY [112]. Stewart and VanBruggen monitored CheY intrinsic fluorescence to examine the association and dissociation kinetics of the CheA-CheY interaction [157]. Strategically introducing a tryptophan residue into the CheA active site enabled the Stewart lab to monitor the kinetics of ATP binding to CheA [154]. Monitoring a protein's intrinsic fluorescence can be complicated by fluorescence from other proteins present in the sample as well as ATP's ability to absorb the UV light required for CheA or CheY intrinsic fluorescence [158]. These limitations provide the motivation for using fluorescent probes that absorb/emit light in a wavelength region where protein intrinsic fluorescence and ATP absorbance do not interfere. 38
57 One example of such an approach uses fluorescent nucleotide analogues, such as TNP-ATP. This fluorescent derivative of ATP enables investigators to directly monitor ATP binding reactions from the nucleotide's perspective. TNP-ATP was used to establish a binding stoichiometry of 2 ATP molecules per CheA dimer [160]. Furthermore, because it competes with ATP for a common binding site, TNP-ATP was useful for analyzing the CheA-ATP binding reaction and the effects of active site mutations on ATP binding [160]. Fluorescently-labeling proteins (by covalently attaching a fluorescent reporter group at a key position) have also provided a way to monitor similar types of reactions but from the protein's standpoint. For example, in 2004, the Stewart lab labeled CheY with an environmentally-sensitive fluorescent probe and established kinetic parameters for autophosphorylation and autodephosphorylation of CheY as well as the kinetics of CheA-CheY phospho-transfer [158]. In my thesis research, I built on these previous works and exploited fluorescence signals to study the CheA-ATP binding reaction and to analyze binding of CheA to CheY. 39
58 Chapter 2: The Nucleotide Analogue TNP-ATP Binds with Negative Cooperativity to the Histidine Kinase CheA. INTRODUCTION The chemotaxis two-component signal transduction system governs the directed movement of bacteria towards favorable chemical conditions and away from harmful chemical environments. Through the cooperative effort of 6 cytoplasmic proteins (CheA, CheW, CheY, CheB, CheR, and CheZ) bacteria are able to monitor and respond to environmental concentrations of various attractants/repellents within 100 milliseconds. This is considerably faster than the time frame utilized by most other two-component systems [21, 140]. All 6 Che proteins are essential to the chemotaxis system, and each has been studied in detail using biochemical and biophysical approaches. In particular, a considerable amount of research has focused on elucidating the biochemical mechanisms utilized by the histidine protein kinase, CheA. CheA, with the aid of CheW, forms signaling complexes with the receptors at the inner membrane surface [108]. Chemoreceptors, embedded in the inner membrane, monitor the environmental concentrations of various attractants/repellents and communicate this information to the histidine protein kinase, CheA. This communication alters CheA autophosphorylation activity [24, 60-63, 123, Reviewed in (155, 168)]. Once CheA is phosphorylated, the phosphate signal is transferred to the response regulator, CheY [60]. Phospho-CheY diffuses from the signaling complexes, through the 40
59 cytoplasm, to the flagellar motors, where it binds to flagellar switch components effecting a change in the rotational direction of these flagella [10, 188]. This regulation of flagellar rotation is an essential feature of how E. coli and many other bacteria accomplish chemotaxis. The lifetime of phospho-chey is determined, in part, by the activity of a phosphatase, CheZ, which catalyzes the dephosphorylation of CheY [62]. Phospho- CheA can also pass its phosphate to the methylesterase, CheB, which, in conjunction with the methyltransferase CheR, promotes sensory adaptation in the chemotaxis system by adjusting the methylation levels of the chemoreceptors in a manner that modulates their signaling abilities and their affinities for chemoattractants and repellents [60, 152, 167]. CheA is arguably the most intensively studied histidine protein kinase. Considerable structural and biochemical information has been gathered for this protein. CheA is a 71 kda, five-domain protein that purifies as a dimer and is likely to operate as a dimer in the cell (Figure 1-7) [36, 50, 55, 95, 144, 168, 172, 173]. The C-terminal, P5 domain binds CheW and the chemotaxis receptors [30, 129]. The P4 domain contains the ATP binding site and active site residues that enable CheA to accomplish autophosphorylation at His48 located within the N-terminal P1 domain [17, 60-63, 123]. The P2 domain is adjacent to P1 and serves as a 'docking site' for CheY (or CheB) as CheY (or CheB) binds to P2 in preparation for the phospho-transfer [173]. The P3 domain is responsible for CheA dimerization [89, 172]. The P3 domain mediates formation of CheA homodimers which can dissociate (K d = µm) [172], but this dissociation of the dimer into monomers is quite slow (t 1/2 = 140 min at 4 C for E. coli CheA) [125]. CheA is likely to function primarily as a 41
60 homodimer in the cell, as CheA monomers are inactive in the autophosphorylation reaction [172]. Furthermore, the dimer equilibrium binding constant is well below the concentration of CheA estimated in the cell (~ 9 µm) [36, 95]. In vitro, conditions can be manipulated to force formation of heterodimers in which, for example, different mutant versions of CheA are paired. Such heterodimers have been used to demonstrate that CheA appears to utilize a trans-phosphorylation mechanism in which the active site of one protomer directs phosphorylation of the P1 domain of the other protomer (Figure 2-1) [174]. Other HPKs, such as EnvZ and NtrB, appear to utilize this transphosphorylation reaction as well [122, 192]. Heterodimers of CheA wt and CheA P3-P4 autophosphorylate more quickly than do homodimers of CheA wt [89]. This observation, in conjunction with the observation that liberated P1 fragments are poorly phosphorylated by full-length CheA molecules, suggest that the two P1 domains present in a CheA homodimer interfere with one another and slow down the trans-phosphorylation reaction [54]. These observations have lead to a number of questions regarding how dimeric CheA functions. Does the CheA dimer utilize both ATP-binding sites as active sites? If CheA, in fact, does use two active sites, do they function independently or in some specific order? [160]. Since CheA serves as a useful model sensor kinase for defining general features of two-component sensor kinases, answers to these questions are not only important for understanding how CheA operates in the chemotaxis system, but also are crucial for understanding how the general class of dimeric histidine protein kinases function. 42

61 A Homodimers of CheA48HQ NO Autophosphorylation Activity B Homodimers of CheA470GK NO Autophosphorylation Activity C Heterodimers of CheA48HQ and 470GK Autophosphorylation Activity 43
62 Figure 2-1. Heterodimers of CheA Demonstrate Trans-Phosphorylation. CheA48HQ lacks the site of phosphorylation [60] whereas CheA470GK has a substitution in the nucleotide binding region (both mutations indicated by the magenta boxes) [129, 165]. (A and B) Homodimers of CheA48HQ or CheA470GK lack the ability to autophosphorylate [62, 123]. (C) Heterodimers of these mutant variants of CheA reestablish autophosphorylation activity. From these experiments, Swanson et al. [174], suggested that phosphorylation at the P1 domain of the G470K mutant was catalyzed by the H48Q mutant in a trans-phosphorylation reaction. 44
63 The CheA autophosphorylation reaction involves a minimum of three steps: (1) ATP must bind to the active site within the P4 domain of the protein; (2) a phosphate group is transferred from ATP to the histidine residue on the P1 domain; and (3) ADP is released [180]. In the absence of chemoreceptors and CheW, CheA autophosphorylation proceeds quite slowly with a k cat = 0.05 s -1 [180]. CheA, in the absence of these other proteins, is referred to as 'uncoupled CheA'. When CheA is present with chemoreceptors and CheW, it forms signaling complexes that include large numbers of receptors, CheW and CheA [145]. In the context of these complexes, steps (1) and (2) are affected; the affinity of CheA for ATP increases (modestly) and the rate of phosphotransfer from ATP to His48 increases dramatically [92]. These effects are observed for receptor:chew:chea complexes formed in the absence of any chemoattractants or repellents. When appropriate chemoattractants are added, their binding to the receptors results in a dramatic inhibition of CheA autokinase activity [24, 121]. This decrease appears to occur within intact receptor:chew:chea complexes and does not involve signal complex dissociation [56]. How the receptors and CheW are able to stimulate or inhibit CheA remains unknown. With the ultimate long-term goal of understanding receptor-mediated regulation of CheA, previous research in the Stewart lab focused on first characterizing uncoupled CheA. The ATP-binding affinity of CheA has been determined by multiple approaches. ATP Using the equilibrium chromatography method of Hummel and Dreyer [73], the K d was determined to be approximately 350 µm (at 25 C) [180]. Analysis of the effect of ATP on CheA autophosphorylation kinetics indicated a K ATP m of ~ 300 µm, a value that 45
64 can be interpreted as indicating a K ATP d of 300 µm for a situation in which ATP binding and dissociation is rapid compared to the chemical event(s) of phosphotransfer from ATP to His48 [180]. Other studies determined the K d using a version of CheA carrying a mutation (F455W) that provided a fluorescent reporter group (the introduced tryptophan mutation) at the active site. These studies determined that the K ATP d was 90 µm (at 25 C) by monitoring fluorescence changes correlating with conformational changes that occurred when CheA bound ATP [154]. Additional studies probed the binding interaction between ATP and CheA using the fluorescent nucleotide analogue, TNP-ATP. When TNP-ATP binds CheA, the fluorescence signal of TNP-ATP is markedly enhanced [160]. Studies used this fluorescence signal to show that CheA binds TNP-ATP 1000-fold more tightly than it does unmodified ATP [69, 160]. Subsequent analysis of the CheA:TNP-ATP crystal structure indicated that this enhanced affinity reflects interaction of the TNP moiety with a hydrophobic pocket adjacent to the ATP binding site (Figure 2-2) [18]. Although this interaction markedly enhances the affinity of CheA for this ligand and likely accounts for the observed change in TNP-ATP fluorescence, it also results in a repositioning of the phosphate groups of the TNP-ATP molecule, to an extent that these groups are no longer accessible to the active site components responsible for catalyzing transfer of the γ- phosphoryl group to His48 of CheA. Thus, TNP-ATP is not a substrate for CheA, but rather serves as a potent inhibitor. Despite these differences between the CheA:ATP and CheA:TNP-ATP interactions, several results indicate that TNP-ATP is a useful probe for understanding 46
 Chemical structure of the fluorescent nucleotide analogue TNP-ATP [2'(3')-O-(2,3,6-trinitrophenyl)adenosine 5'-triphosphate]. (B) Ribbon diagram of the crystal structure of the P4 domain from T.")

65 A B Figure 2-2. Ribbon Diagram of the Crystal Structure of the P4 domain from Thermotoga maritima CheA Bound to the Nucleotide Analogue TNP-ATP. (A) Chemical structure of the fluorescent nucleotide analogue TNP-ATP [2'(3')-O-(2,3,6-trinitrophenyl)adenosine 5'-triphosphate]. (B) Ribbon diagram of the crystal structure of the P4 domain from T. maritima CheA complexed with TNP-ATP. The purple ribbon represents the "ATP lid," a region that undergoes a conformational change upon ATP binding. The red rings represent the adenine ring and sugar backbone of the TNP-ATP molecule. Pink sticks represent the three phosphate moieties and blue represents the hydrophobic trinitrophenyl ring. Due to the extensive interaction between the trinitrophenyl ring with the hydrophobic pocket adjacent to the ATP-binding cavity, the three phosphate moieties are oriented out towards the solvent away from their catalytic residues. This hydrophobic interaction has also been proposed to explain TNP-ATP's greater affinity for CheA. PDB accession code: 1i5d [18]. Figure was produced with the WebLab ViewerLite program. 47
66 CheA:ATP interactions. First, TNP-ATP competes with ATP for the binding site(s) on CheA, suggesting that they share at least some common binding determinants, a conclusion that has been supported by analysis of crystal structures of CheA with ADP and other ATP analogues. Secondly, TNP-ATP demonstrates the same stoichiometry of binding as ATP for CheA (2 per dimer). Finally, when mutations are introduced into the ATP binding region of CheA, binding of TNP-ATP and binding of unmodified ATP are affected in similar ways [160]. Previous work in the Stewart lab analyzed binding of TNP-ATP to CheA making the assumption that the two binding sites of the CheA dimers operated independently and made similar (but not identical) contributions to the observed fluorescence change [160]. In the work described in this chapter, I examined whether these assumptions were valid. My results suggest that the CheA dimer binds two molecules of TNP-ATP and that these two binding events make very different contributions to the observed change in TNP- ATP fluorescence. This finding supports the general idea that there is asymmetry in CheA homodimers, a possibility that has been raised previously to explain observations made not only with CheA [89] but also with another well-characterized HPK, NtrB [74]. In addition, my results indicate that CheA dimers bind TNP-ATP with negative cooperativity. To my knowledge, this represents the first demonstration of nucleotide binding cooperativity for a histidine protein kinase. 48
67 MATERIALS AND METHODS Chemicals and Reagents. 2'(3')-O-(2,4,6-trinitrophenyl)adenosine 5'-triphosphate (TNP- ATP) was purchased from Invitrogen, stored at -80 C, and used under minimal light conditions. Care was taken so that the stock TNP-ATP solutions were made in buffers lacking DTT as DTT was found to negatively affect the molecule's fluorescence. The TNP-ATP concentration was determined spectrophotometrically, using an extinction coefficient of 26.4 mm -1 cm -1 at 408 nm [67]. All other chemicals were reagent grade and were purchased from standard commercial sources. TEKMD buffer (ph 7.5) contained 50 mm Tris HCl, 0.5 mm Na 2 EDTA, 50 mm KCl, 20 mm Mg 2+, 1 mm DTT. TEK+D buffer (ph 7.5) substitutes 10 mm Na 2 EDTA for Mg 2+. TNGKGMD buffer (ph 7.5) contained 50 mm Tris HCl, 25 mm NaCl, 10% glycerol, 50 mm K-glutamate, 10 mm Mg 2+, 0.5 mm DTT. TENGKGD (ph 7.5) substitutes 10 mm Na 2 EDTA for Mg 2+. TEGD buffer (ph 7.5) contains 50 mm Tris, 0.5 mm Na 2 EDTA, 10% glycerol, 0.5 mm DTT. Plasmids. The full-length T. maritima chea cloned into pet28 vector was kindly provided by Sang-Youn Park [124]. Expression plasmids for the T. maritima CheA-P4 domain (residues ) and the E. coli CheA-P4 domain (residues ) were created (by Dr. R. C. Stewart) by cloning a corresponding PCR fragment into the pet28 vector. Full-length E. coli CheA was expressed from a plasmid, pah1, a derivative of par1 [69]. All four proteins carry an N-terminal 6-Histidine tag fusion to simplify purification [158]. To simplify text, this tag has been omitted from the remainder of this 49
68 paper. Previous work in this lab has demonstrated that the His 6 tag does not affect the ATP binding affinity of CheA or CheA autokinase activity [160]. Protein Expression and Purification. The following abbreviations will be used throughout the remainder of this chapter: Full-length T. maritima CheA wt (TmA), fulllength E. coli CheA wt (EcA), T. maritima CheA P4 (TmP4), E. coli CheA P4 (EcP4). pet28:tma, pet28:tmp4, and pet28:ecp4 were transformed into E. coli BL21 λde3 cells (Invitrogen) and grown at 32 C in 4L of Luria broth with 50 µg/ml kanamycin until log phase. For overproduction of EcA, pah1 was transformed into E. coli strain D260 (kindly provided by S. Parkinson [144]) and grown at 32 C in 4L of Luria broth with 100 µg/ml ampicillin. Overproduction of each protein was induced by adding IPTG at a final concentration of 1 mm to the cultures once they entered log phase. Three hours after induction, cells were moved to 4 C, pellets were collected by centrifugation and lysed by sonication in the presence of Halt Protease Inhibitor (Pierce). All further steps were carried out at 4 C. All proteins were purified using Ni-NTA chromatography [70, 89]. An additional purification step was necessary for TmA. Fractions containing TmA were pooled, dialyzed into TEGD buffer and further purified using Affi-Gel Blue chromatography (Bio-Rad). The column was washed with TEGD buffer and then eluted with 2 M NaCl in TEGD buffer. The level of purity for all proteins was visually inspected from Coomassie-stained polyacrylamide gels and determined to be >90% pure. All proteins were stored at -80 C in TEGD buffer. Protein concentrations for full-length CheA proteins were determined spectrophotometrically, using the following extinction 50
69 coefficients [57]: 16.3 mm -1 cm -1 for EcA and 15.9 mm -1 cm -1 for TmA. Concentrations for the P4 proteins were determined by the bicinchoninic acid assay (Pierce). All concentrations listed represent the monomeric concentration of the protein unless otherwise noted. Equilibrium Binding Titrations. Reactions were carried out in either TEKMD or TNGKGMD buffer, in 1 cm x 1 cm quartz fluorescence cuvettes, stirred continuously using a magnetic stir bar, and maintained at 4 C (unless otherwise noted) using a circulating water bath connected to the cuvette holder. Fluorescence emission spectra were recorded using a PTI QuantaMaster instrument measuring counts per second (cps) in digital mode. Emission spectra ( nm, slits at 4 nm) where recorded when the excitation wavelength was set to 410 nm (slits at 4 nm). The samples were shielded from the excitation light between additions. Two major types of equilibrium titrations were performed. "CheA-in-excess" titrations and "TNP-in-excess" titrations are described below. For "CheA-in-excess" titrations, successive aliquots of concentrated, purified E. coli CheA (~ 250 µm of either EcA or EcP4) were added to a 0.1 µm solution of TNP- ATP, and emission spectra were recorded after each addition. One important control for this type of titration was to determine whether the protein samples themselves made any contribution to the observed fluorescence signal under these conditions. I observed a small fluorescence signal (~ 4000 cps for EcA and ~ 7000 cps for TmA) in 10 µm solutions of either EcA or TmA. In 10 µm solutions of EcP4 and TmP4, I observed an 51
70 even smaller signal (~ 1000 cps for EcP4 and ~ 5000 cps for TmP4). In analyzing my CheA-in-excess results, I corrected for these small signals that apparently arose from low levels of a fluorescent contaminant in my protein preparations. Another control experiment (to test the stability of the fluorescent probe) was performed by adding aliquots of buffer to a solution of 0.1 µm TNP-ATP. The fluorescence signal appeared stable throughout these experiments (data not shown). For "TNP-in-excess" titrations, successive additions of TNP-ATP (~ 250 µm) were added to a 0.1 µm solution of CheA (either EcA or EcP4), and emission spectra were recorded after each addition. Control experiments were performed where aliquots of TNP-ATP were added to a buffer-only solution. These experiments were used in the data manipulations to correct for TNP-ATP's intrinsic fluorescence as well as for inner filter effects. For these "TNP-in-excess" titrations, the dilute CheA solution was prepared (on ice) by diluting a concentrated protein stock solution (in which all CheA would be present as homodimers) just before starting the titration. Based on previous work [125], CheA dimers were expected to remain as dimers over the short time course of a titration (20 minutes) because the rate of dimer to monomer dissociation is slow (t 1/2 = 140 minutes for EcA; t 1/2 = 2.5 x 10 5 hours for TmA). Data Manipulation and Analysis. Two emission spectra were collected for each titration step and averaged together (these generally exhibited less than 1% variability). For both types of titration data, manipulations/corrections were necessary prior to analysis. 52
71 (1) TNP-in-excess titrations: The emission intensity at 546 nm at each titration step was corrected for dilution using the following equation: Corrected Emission Change = Volume after Addition Initial Volume * Emission Change (eq. 2-1) The corrected emission changes for the control titrations (i.e., in the absence of CheA) were proportional to the TNP-ATP concentration below 0.4 µm as indicated by the linear relationship observed in plots of Volume-corrected Emission Changes versus TNP-ATP Concentration. These plots deviated from linearity (attributed to inner filter affects [160]) at TNP-ATP concentrations higher than 0.4 µm. Therefore, a correction factor was applied to account for these effects. The correction factor was calculated by determining the ratio of the theoretical fluorescence intensity, (as predicted by extrapolating the linear region of the plots) to the actual observed fluorescence intensity [187]. The emission changes from control experiments were then subtracted from the titrations of CheA with TNP-ATP. (2) CheA-in-excess titrations: Changes in emission intensity were calculated at 546 nm for EcP4 and 540 nm for EcA. The emission intensity changes for each step of the titrations were corrected for dilution according to eq The data were corrected further by subtracting the starting fluorescence of 0.1 µm TNP-ATP in buffer from each step along the titration and by subtracting the small fluorescence signal arising from the protein samples themselves. The corrected data were analyzed using least-squares fitting routines in DYNAFIT [86]. The scripts for analyzing the P4 titration data are presented in Appendix 53
72 A-1, and the scripts for analyzing CheA titration data are presented in Appendix A-2. Titrations using CheA assume a two-site binding model, where the first TNP-ATP molecule binds with a certain binding affinity (K d1 ) and then the second TNP-ATP molecule binds based on the second binding affinity (K d2 ). In these scripts, T.AA refers to one molecule of TNP-ATP bound to dimeric CheA and T.AA.T indicates two molecules of TNP-ATP bound to CheA. The scripts designate molar fluorescence response coefficients which are calculated from the fluorescence counts for each binding state as described in Appendix A. The fluorescence counts for the T.AA state was determined by extrapolating the CheA-in-excess titrations to 'infinite' CheA concentration and by determining the y-axis intercept from reciprocal plots of Corrected Fluorescence Change versus [CheA]. The fluorescence counts for the T.AA.T state was determined by extrapolating the TNP-in-excess titrations to 'infinite' TNP-ATP concentration. The data reported in Figures 2-5 and 2-6 represent averages of two independent experiments analyzed using DYNAFIT to generate K d. This analysis provided results similar to those obtained when I analyzed the datasets individually. The error for each K d value was the standard error of the mean from averaging the K d values generated by DYNAFIT for each dataset. Data analysis for T. maritima CheA titrations at 4 C and E. coli CheA titrations at 25 C. I performed equilibrium binding titrations with T. maritima CheA at 4 C in buffer containing Mg 2+ at [CheA] >> K d, due to the extremely tight binding nature of T. maritima CheA and TNP-ATP. To determine the endpoint fluorescence for each 54
73 titration, I corrected these data according to the methods described in the preceding section (except that inner filter affects were corrected above 1.0 µm). I also performed equilibrium binding experiments with E. coli CheA at 25 C in buffer with and without Mg 2+. I observed a decrease in TNP-ATP's fluorescence over time, which I determined was a result of the presence of the disulfide reducing compound, DTT, in the buffer (see Results). Even so, this decrease did not affect the endpoint fluorescence significanty and therefore I corrected these data according to the methods described in the preceding section, except that inner filter affects were corrected above 1.0 µm. Cross-linking Studies. Cross-linking experiments were performed using proteins and reagents dissolved in HKMD buffer (25 mm Hepes-NaOH, ph 7.5, 100 mm KCl, 5.0 mm MgCl 2, 0.5 mm DTT) at 25 C, following the method detailed by Surrette et al. [172]. Solutions and proteins were kept at 4 C until ready to be used. Protein stocks were thawed, diluted and exchanged into HKMD buffer using desalting columns from Pierce Biotechnology. Further dilutions were performed in HKMD buffer to achieve the final reaction concentrations. The cross-linking agent, dithiobis(succinimidyl propionate) (5.0 mg/ml in Me 2 SO made fresh that day) was added to the reactions at a final concentration of 0.2 mg/ml. After 2 hours, the reactions were stopped with the addition of Tris-HCl and Lysine (50 mm and 10 mm final concentrations, respectively). Control experiments were run with Tris-HCl and Lysine added before the DSP cross-linking agent. Aliquots at various protein concentrations were run on a 12% SDS- 55
74 polyacrylamide gel followed by staining with Sypro Orange (Molecular Probes) according to the product's instruction manual. After staining for 1 hour, each gel was rinsed briefly with 7.5% acetic acid solution and then viewed using a BioRad 300 nm ultraviolet transilluminator. The image shown in Figure 2-17 was acquired using an exposure time of 1.5 seconds with no further modifications of the default settings. The protein standards in this image are BioRad low molecular weight standard, product #
75 RESULTS I investigated binding of TNP-ATP to the following four proteins: full-length T. maritima CheA wt (TmA), full-length E. coli CheA wt (EcA), T. maritima CheA P4 (TmP4), E. coli CheA P4 (EcP4). These abbreviations (TmA, EcA, TmP4, and EcP4) will be used in place of the longer names throughout the rest of this thesis. The Two Nucleotide Binding Sites of CheA Homodimers Generate Unequal Fluorescence Changes when TNP-ATP Binds. The nucleotide analogue, TNP-ATP, when placed in an aqueous solution, has a weak fluorescence signal. However when bound to CheA, this signal is markedly enhanced [160 and Figure 2-3]. Previous experiments have used this signal change as a way to measure the stoichiometry of nucleotide binding (2 TNP-ATP molecules per CheA dimer) and to examine the effects of various active site mutations [69, 160]. Previous analysis suggested that the first and second binding events on a CheA homodimer altered the TNP-ATP fluorescence by nearly equal amounts, but this conclusion required several assumptions. To examine more rigorously the properties of the two binding events, I compared the TNP-ATP fluorescence signal generated under two sets of conditions: (1) when CheA was provided in great excess over TNP-ATP (conditions designed to generate CheA dimers in which only a single molecule of TNP- ATP was bound, referred to as T.AA), and (2) when TNP-ATP was provided in great excess over CheA (conditions designed to generate CheA dimers in which both nucleotide binding sites were occupied by TNP-ATP, referred to as T.AA.T). Figure 2-3A shows the fluorescence emission spectral changes when a limiting amount of TNP- 57
76 A B Figure 2-3. Fluorescence emission spectrum of the CheA:TNP-ATP complex when EcA (A) or TNP-ATP (B) is in excess at 4 C. Spectra were recorded for samples in TEKMD buffer using λ ex = 410 nm. (A) Fluorescence emission spectrum of 0.1 µm TNP-ATP in the presence (solid line) and absence (dotted line) of ~ 10 µm EcA. The change in fluorescence intensity is taken at 540 nm. (B) Fluorescence emission spectrum of 10 µm TNP-ATP in the presence (solid line) and absence (dotted line) of 0.05 µm EcA dimer. The dotted line reflects TNP-ATP's intrinsic fluorescence. The change in fluorescence intensity is taken at 546 nm. Black lines represent buffer only. Data were corrected for inner filter effects and dilution according to the Materials and Methods section. 58
77 ATP (0.1 µm) is provided with excess dimeric CheA (5 µm dimer concentration of EcA). Figure 2-3B, shows the fluorescence emission spectral changes for a limiting amount of CheA (0.05 µm EcA dimers) in the presence of excess TNP-ATP (10 µm). The spectra shown in Figures 2-3A and 2-3B represent 'endpoints' of titrations; further additions of protein or ligand, respectively, did not give rise to further changes indicative of complex formation (see Figure 2-6). Comparison of the fluorescence change at the completion of these two different titrations indicates a clear difference, suggesting that the first and second binding events have quite different effects on the fluorescence properties of TNP-ATP. One way to interpret these results is that the two nucleotide binding sites in CheA homodimers are not equivalent; one site generates a large change in TNP-ATP fluorescence while the second site does not. In such a scenario, in my TNP-in-excess experiments, binding of the first TNP-ATP molecule to the CheA dimer would be associated with a molar fluorescence response coefficient (MFC) of 141,000 cps µm -1 (see Appendix A); then binding of the second TNP-ATP molecule does not generate its own fluorescence signal and causes a decrease in the molar fluorescence coefficient of the previously bound TNP-ATP molecule. This interpretation suggests that there is a fundamental difference between the two nucleotide binding sites of the CheA dimer. An alternative interpretation follows from the assumption that the two nucleotide binding sites are equivalent at the start of the experiments (before ligand addition), but that when the first TNP-ATP molecule binds, it sets in motion interactions between the CheA protomers in the dimer that alter the properties of the second nucleotide binding site; once 59
78 the second molecule of ligand has bound, both sites are equivalent, affecting one another in identical ways. In this case, binding of the first TNP-ATP molecule has a MFC of 141,000 cps µm -1 ; then binding of the second molecule creates two equivalent TNP-ATP bound sites, each with a MFC of 50,000 cps µm -1. Both models require that binding of the second TNP-ATP molecule effects a change in the environment of the first TNP-ATP molecule such that its fluorescence emission decreases; such a situation implies communication between the two binding sites. The two possible models described above (pre-existing asymmetry in homodimers vs. induced asymmetry) are considered further in the Discussion section. This apparent asymmetry in a homodimer was unexpected. In the following Results subsections, I followed up this surprising observation, first by using a monomeric fragment of CheA (just the P4 domain) to independently assess the fluorescence contribution of CheA to which a single TNP-ATP molecule has bound. Then, I returned to experiments with dimeric CheA and consider the possibility that the two nucleotide binding sites of the dimer interact (i.e., communicate) to generate negative cooperativity. Equilibrium Binding Titrations with the P4 Domain from E. coli CheA Defines the Spectral Contribution and Binding Affinity for the First Nucleotide Binding Site. I monitored the fluorescence signal change when TNP-ATP bound a truncated version of CheA which lacks the dimerization domain. As above, I analyzed the results of titrations in which TNP-ATP was in excess of EcP4 and experiments in which EcP4 was in excess of TNP-ATP (Figure 2-4 and 2-5). The magnitude of the final fluorescence change was 60
79 A B Figure 2-4. Fluorescence emission spectrum of the P4:TNP-ATP complex when EcP4 (A) or TNP-ATP (B) is in excess at 4 C. Spectra were recorded for samples in TEKMD buffer using λ ex = 410 nm. (A) Fluorescence emission spectrum of 0.1 µm TNP-ATP in the presence (solid line) and absence (dotted line) of ~ 10 µm EcP4. (B) Fluorescence emission spectrum of 10 µm TNP-ATP in the presence (solid line) and absence (dotted line) of 0.1 µm EcP4. The dotted line reflects TNP-ATP's intrinsic fluorescence. The change in fluorescence intensity is taken at 546 nm for both (A) and (B). Black lines represent buffer only. Data were corrected for inner filter effects and dilution according to the Materials and Methods section. 61
80 Figure 2-5. Results of fluorescence-monitored titrations of EcP4 and TNP-ATP at 4 C. The change in emission intensity at 546 nm was determined after each of a series of either TNP-ATP additions to 0.1 µm EcP4 (blue) or EcP4 additions to 0.1 µm TNP-ATP (red) in TEKMD buffer. The solid lines show the computer-generated best fit of the data assuming a simple, one-site binding equation in DYNAFIT. TNP-in-excess (blue): K d = 0.25 ± 0.03 µm. CheA-in-excess (red): K d = 0.23 ± 0.01 µm. The error bars indicate the standard error of the mean for each data point from two independent experiments. Data were corrected according to the Materials and Methods section. 62
81 equivalent for these different titrations, a situation that differs from that described above for the experiments involving dimeric, full-length CheA (Figure 2-3). The observed MFC for the P4:TNP-ATP complex (150,000 cps µm -1 ) corresponded well with that defined for dimeric CheA in which a single site is occupied by TNP-ATP. Thus, these results were consistent with the interpretation that binding of the first TNP-ATP molecule to a CheA dimer has a high fluorescence coefficient. The results of the titrations in Figure 2-5 were analyzed using the least-squares regression routine in DYNAFIT (Appendix A-1) to define the K d value of the P4:TNP-ATP complex as 0.24 ± 0.01 µm. TNP-ATP Binding by E. coli CheA Dimers Exhibits Negative Cooperativity. Results presented in the previous two subsections indicated that the two nucleotide binding sites of the CheA dimer are either not equivalent or interact in some manner that causes them to generate very different effects on the fluorescence emission properties of TNP-ATP. In this subsection, I used the information (molar fluorescence response coefficients) generated in the preceding sections to interpret the results of the fluorescence-monitored titrations of dimeric CheA with TNP-ATP (and vice versa). The blue data set in Figure 2-6 summarizes the results obtained when sequential aliquots of the ligand TNP-ATP were added to dimeric EcA. This experiment was designed to create conditions (near the end of the titration), favoring formation of CheA dimers in which both ATP-binding site were occupied by TNP-ATP. The corresponding, 'reverse' titration (designated with the red color) involved titrating a limiting amount of 63
82 Figure 2-6. Results of fluorescence-monitored titrations of EcA and TNP-ATP at 4 C. The change in emission intensity at 546 nm (blue) and 540 nm (red) was determined after each of a series of either TNP-ATP additions to 0.1 µm EcA (blue) or EcA additions to 0.1 µm TNP-ATP (red) in TEKMD buffer. The solid black line (blue data points) show the computer-generated best fit of the data assuming a two-site binding model using DYNAFIT. TNP-in excess (blue): K d1 = 0.44 ± 0.05 µm and K d2 = 16.2 ± 7.4 µm. The solid black line (red data points) is the computer-generated best fit of the data to a singlesite binding model using DYNAFIT. CheA-in-excess (red): K d = 0.53 ± 0.02 µm. The error bars indicate the standard error of the mean for each data point from two independent experiments. Data were corrected according to the Materials and Methods section. 64
83 the ligand, TNP-ATP, with the enzyme CheA (CheA is now in excess). In this titration, I pushed the binding equilibrium so that at the end of the titration, only one ATP-binding site within the CheA dimer was occupied by TNP-ATP. After correcting these data for dilution and inner filter effects (as described in Materials and Methods), I analyzed them using the least-squares regression feature of the program DYNAFIT (Appendix A-2) [86]. This analysis generated best-fit estimates for the K d values associated with binding of the first and second molecule of TNP-ATP to the CheA dimer. DYNAFIT requires input of an explicit model describing the binding equilibrium. To fit my results, I input the following simple two-site binding mechanism; + T AA + T T.AA T.AA.T K d1 K d2 (eq. 2-2) and I provided the fitting routine with values for the molar fluorescence coefficients for both the one and two-site bound nucleotide species (values derived from Results in the preceding sections: MFC T.AA = 150,000 cps µm -1 ; MFC T.AA.T = 100,000 cps µm -1 ; Appendix A-2). Fits for the TNP-in-excess datasets indicated negative cooperativity (K d1 = 0.44 ± 0.05 µm and K d2 = 16.2 ± 7.4 µm). For the CheA-in-excess experiment, I fit the binding curve to a single-site model (since basically just the first step of eq. 2-2 was operative under my experimental conditions). In theory, such an experiment could provide information about the second binding step for data collected at [CheA] < [TNP- ATP]; however, given the low affinity of this step (K d2 > 10 µm) and the CheA 65
84 concentration range I employed, this experiment would not be expected to generate any significant level of T.AA.T (eq. 2-2). Asymmetry in the Interactions of TNP-ATP with Thermotoga maritima CheA Dimers. The surprising results obtained in my analysis of TNP-ATP binding to E. coli CheA dimers led me to ask: Are the unexpected features of E. coli CheA (unequal spectral contributions; apparent cooperativity) unique to E. coli CheA, or do they also apply to CheA from other bacteria? To answer this question, I examined the interaction of TNP- ATP with Thermotoga maritima CheA, a protein that has been studied in some detail and for which detailed three-dimensional structural information is available. The change in fluorescence signal observed when TNP-ATP is provided with a great excess of TmA (Figure 2-7A) is greater than the magnitude of the change observed when a limiting concentration of TmA is provided with an excess of TNP-ATP (Figure 2-7B). These results suggest than when the first molecule of TNP-ATP binds TmA, a greater spectral change (MFC ~ 120,000 cps µm -1 ) is observed than when the second molecule of TNP- ATP binds (MFC ~ 20,000 cps µm -1 ), similar to the situation observed with EcA. To confirm the high fluorescence coefficient of TmA occupied by a single TNP- ATP molecule, I examined the fluorescence change generated when TNP-ATP binds the monomeric version of the CheA catalytic domain, TmP4, as I had done previously for EcP4. Figure 2-8 presents emission scans of TNP-ATP in the presence of excess TmP4 (Figure 2-8A) and TmP4 in the presence of excess TNP-ATP (Figure 2-8B). The observed changes in TNP-ATP fluorescence emission intensity exhibited similar 66
85 A B Figure 2-7. Fluorescence emission spectrum of the CheA:TNP-ATP complex when TmA (A) or TNP-ATP (B) is in excess at 4 C. Spectra were recorded for samples in TEKMD buffer using λ ex = 410 nm. (A) Fluorescence emission spectrum of 0.1 µm TNP-ATP in the presence (solid line) and absence (dotted line) of 3 µm TmA. (B) Fluorescence emission spectrum of 3 µm TNP-ATP in the presence (solid line) and absence (dotted line) of 0.05 µm TmA dimer. The dotted line reflects TNP-ATP's intrinsic fluorescence. The change in fluorescence intensity is taken at 546 nm for both. Black lines represent buffer only. Data were corrected according to the Materials and Methods section. 67
86 A B Figure 2-8. Fluorescence emission spectrum of the P4:TNP-ATP complex when TmP4 (A) or TNP-ATP (B) is in excess at 4 C. Spectra were recorded for samples in TEKMD buffer at 4 C using λ ex = 410 nm. (A) Fluorescence emission spectrum of 0.1 µm TNP- ATP in the presence (solid line) and absence (dotted line) of 3 µm TmP4. (B) Fluorescence emission spectrum of 3 µm TNP-ATP in the presence (solid line) and absence (dotted line) of 0.1 µm TmP4. The dotted line reflects TNP-ATP's intrinsic fluorescence. The change in fluorescence intensity is taken at 546 nm for both. Black lines represent buffer only. Data were corrected for inner filter effects and dilution according to the Materials and Methods section. 68
87 magnitudes for these two situations (MFC ~ 150,000 cps µm -1 ) and compared well with the magnitude of fluorescence change observed when TNP-ATP is titrated with an excess of TmA (Figure 2-7A). I also analyzed equilibrium binding titrations of TmP4 with TNP-ATP (Figure 2-9) in an attempt to define the K d for the P4:TNP-ATP complex. Analysis of these results indicated a very high affinity for this binding interaction, making it difficult to generate an accurate estimate for K d. Note, for example, that the titration profile shown in Figure 2-9, exhibits little or no curvature. This is the expected outcome for a titration performed using P4 concentrations significantly higher than K d [51]. Attempts to perform similar experiments at lower protein concentrations were unsuccessful due to the correspondingly lower fluorescence signal levels. Bilwes et al. [18] have made similar observations and arrived at an upper limit estimate of 0.01 µm for the K d of the TmP4:TNP-ATP complex. I also tried to measure the binding affinities of both nucleotide binding sites found in full-length T. maritima CheA (i.e., for the homodimer). TmA bound TNP-ATP with considerably higher affinity than did EcA. I performed equilibrium binding titrations of TmA with TNP-ATP (and vice versa) in an attempt to define the K d for the TmA:TNP- ATP complex (Figure 2-10). Analysis of these results indicated titration profiles that were similar to those observed for my TNP-ATP titrations of TmP4 (little or no curvature), and once again, this was the expected outcome for a titration using TmA concentrations significantly higher than the K d. In a further attempt to define the K d, I performed an equilibrium binding titration, titrating a diluted concentration of TmA 69
88 Figure 2-9. Results of fluorescence-monitored titrations of TmP4 and TNP-ATP at 4 C. The change in emission intensity at 546 nm was determined after each of a series of either TNP-ATP additions to 0.1 µm TmP4 (blue) or TmP4 additions to 0.1 µm TNP- ATP (red) in TEKMD buffer. Due to the tight binding nature of TmP4 with TNP-ATP, the true K d values could not be obtained from these types of experiments. The error bars indicate the standard error of the mean for each data point from two independent experiments. Data were corrected according to the Materials and Methods section. 70
89 Figure Results of fluorescence-monitored titrations of TmA and TNP-ATP at 4 C. The change in emission intensity at 546 nm was determined after each of a series of either TNP-ATP additions to 0.1 µm TmA (blue) or TmA additions to 0.1 µm TNP-ATP (red) in TEKMD buffer. Due to the tight binding nature of TmA and TNP-ATP, the true K d values could not be obtained from these types of experiments. The error bars indicate the standard error of the mean for each data point from two independent experiments. Data were corrected for dilution, TNP-ATP's intrinsic fluorescence and inner filter effects according to the Materials and Methods section. 71
90 (0.015 µm dimer) with TNP-ATP. As shown in Figure 2-11, fitting this data to a singlesite binding equation gave a K d value of ± µm. In this experiment the concentration of TmA exceeded the K d value to an extent that precluded analysis to accurately define K d, a finding that was not unexpected based on previous work [18]. The results presented in this section demonstrate that binding of the first molecule of TNP-ATP to TmA dimers exhibits a fluorescence change that greatly exceeds that which is associated with binding of the second molecule. This difference is similar to that observed with EcA, but appears to be even more striking with the Thermotoga protein. Unfortunately, the very tight affinity of the binding interaction between the Thermotoga proteins and TNP-ATP made it impossible to determine whether the two nucleotide binding sites of TmA exhibit cooperativity in the same manner that I observed with EcA. Asymmetry in Binding Sites is also Apparent at 25 C. Since all previous work looking at E. coli CheA binding ATP as well as catalytic turnover was done at 25 C, I wanted to determine if the same disparity in molar fluorescence coefficients (when comparing the first and second binding events) that I observed at 4 C was present at this higher temperature. In Figure 2-12, the fluorescence signal change observed when TNP-ATP was provided with an excess of EcA (Figure 2-12A) was greater than the magnitude of the change observed when a limiting concentration of EcA was provided with an excess of TNP-ATP (Figure 2-12B). These results confirmed those obtained at 4 C and 72
91 Figure Results of fluorescence-monitored titrations of diluted TmA with TNP-ATP at 4 C. The changes in emission intensity at 546 nm were determined after each of a series of TNP-ATP additions to µm TmA dimer in TEKMD buffer. Little curvature is seen at this low TmA concentration. The data were fit to a single-site binding equation (Appendix A) with a K d value of ± µm. The error bars indicate the standard error of the mean for each data point from two independent experiments. Data were corrected for dilution as well as TNP-ATP's intrinsic fluorescence. Inner filter effects were minimal over this concentration range and therefore not corrected. 73
92 A B Figure Fluorescence emission spectrum of the CheA:TNP-ATP complex when EcA (A) or TNP-ATP (B) is in excess at 25 C. Spectra were recorded for samples in TNGKGMD buffer using λ ex = 410 nm. (A) Fluorescence emission spectrum of 1 µm TNP-ATP in the presence (solid line) and absence (dotted line) of 12 µm EcA. (B) Fluorescence emission spectrum of 12 µm TNP-ATP in the presence (solid line) and absence (dotted line) of 0.05 µm EcA dimer. The dotted line reflects TNP-ATP's intrinsic fluorescence. The change in fluorescence intensity is taken at 540 nm for both. Black lines represent buffer only. Data were corrected for inner filter effects and dilution according to the Materials and Methods section. 74
93 suggested that when the first molecule of TNP-ATP bound EcA, a greater spectral change was observed than when a second molecule bound. To confirm this apparent asymmetry in binding sites observed for EcA, I examined the fluorescence change generated when TNP-ATP bound to monomeric EcP4 at 25 C. Figure 2-13 presents emission scans of TNP-ATP in the presence of excess EcP4 (Figure 2-13A) and EcP4 in the presence of excess TNP-ATP (Figure 2-13B). The observed changes in TNP-ATP fluorescence emission intensity were comparable for these two situations. I performed equilibrium binding titrations of both EcP4 with TNP-ATP (Figure 2-14) and EcA with TNP-ATP (Figure 2-15) at 25 C in an attempt to determine the K d for the CheA:TNP-ATP complexes. Analysis of these results was complicated by the instability of the TNP-ATP fluorescence at 25 C, apparently resulting from the reaction of the TNP-ATP with the reducing agent, DTT, present in my assay buffer (to maintain the cysteine side chains of CheA in a reduced, thiol state [41]). To further explore this reaction, I monitored TNP-ATP's fluorescence (~ 75 µm) in buffer with and without 1 mm DTT at both 25 C and at 4 C. In buffer with DTT, after 20 minutes, TNP-ATP's fluorescence decreased by 17% (at 25 C) and 2% (at 4 C). In buffer lacking DTT, after 20 minutes, TNP-ATP's fluorescence decreased by about 0.1% at 25 C, and there was no detectable change for the TNP-ATP sample at 4 C. These results indicated that, during my 25 C titrations (performed in the presence of DTT), the TNP-ATP fluorescence signal was decaying as the titration progressed. Because of this, I did not perform a detailed, binding analysis of these data, but rather just used them to confirm that CheA 75
94 A B Figure Fluorescence emission spectrum of the CheA:TNP-ATP complex when EcP4 (A) or TNP-ATP (B) is in excess at 25 C. Spectra were recorded for samples in TNGKGMD buffer using λ ex = 410 nm. (A) Fluorescence emission spectrum of 1 µm TNP-ATP in the presence (solid line) and absence (dotted line) of 12 µm EcP4. (B) Fluorescence emission spectrum of 12 µm TNP-ATP in the presence (solid line) and absence (dotted line) of 1 µm EcP4. The dotted line reflects TNP-ATP's intrinsic fluorescence. The change in fluorescence intensity is taken at 540 nm for both. Black lines represent buffer only. Data was corrected according to the Materials and Methods section. 76
95 Figure Results of fluorescence-monitored titrations of EcP4 and TNP-ATP at 25 C. The change in emission intensity at 540 nm was determined after each of a series of either TNP-ATP additions to 1 µm EcP4 (blue) or EcP4 additions to 1 µm TNP-ATP (red) in TNGKGMD buffer. Due to the TNP-ATP instability at 25 C, I did not pursue an in-depth analysis of these data. Only one experiment is displayed per dataset. Data were corrected according to the Materials and Methods section. 77
96 Figure Results of fluorescence-monitored titrations of EcA and TNP-ATP at 25 C. The change in emission intensity at 540 nm was determined after each of a series of either TNP-ATP additions to 1 µm EcA (blue) or EcA additions to 1 µm TNP-ATP (red) in TNGKGMD buffer. Due to the TNP-ATP instability at 25 C, I did not pursue an indepth analysis of these data. Only one experiment is displayed per dataset. Data were corrected according to the Materials and Methods section. The endpoints from each titration corroborate my results with EcA binding TNP-ATP at 4 C. 78
97 dimers with a single TNP-ATP molecule bound exhibited a higher fluorescence coefficient than did CheA dimers in which both sites were occupied by TNP-ATP. Binding Studies in the Absence of Mg 2+. Since magnesium has been shown to affect the ATP binding mechanism in E. coli CheA [154], I was curious whether this divalent ion affected the fluorescence coefficients of EcA (or EcP4) when provided with excess TNP- ATP. I performed equilibrium binding titrations of EcP4 with excess TNP-ATP (Figure 2-16A) and EcA with excess TNP-ATP (Figure 2-16B) at 25 C in buffer lacking Mg 2+. I compared these titrations with the equilibrium binding titrations discussed in the preceding subsection (where EcP4 and EcA were titrated with excess TNP-ATP at 25 C in buffer containing Mg 2+ ). The data from equilibrium binding titrations performed in buffer lacking Mg 2+ demonstrated similar 'endpoints' when compared to the titrations performed in buffer containing Mg 2+. These results suggest that Mg 2+ does not have a significant effect on the fluorescence coefficient of dimeric CheA bound by two molecules of TNP-ATP. Cross-linking Experiments Confirm the Dimeric State of CheA and the Monomeric State of P4. Previous work indicated that in my binding experiments, full-length CheA should have been present as a dimer, and CheA-P4 should have been monomeric. However, I wanted to confirm these expectations. In particular, I was concerned about the monomerdimer status of P4. This CheA fragment completely lacks the dimerization domain; however, it crystallizes as a dimer (albeit one that uses protein-protein contacts that are 79
98 A B Figure Results of fluorescence-monitored titrations of EcP4 and EcA with TNP- ATP at 25 C in buffer lacking Mg 2+. (A) The change in emission intensity at 540 nm was determined after each of a series of TNP-ATP additions to 1 µm EcP4 in TNGKGD buffer with (blue) and without (orange) Mg 2+. (B) The change in emission intensity at 540 nm was determined after each of a series of TNP-ATP additions to 1 µm EcA in TNGKGD buffer with (blue) and without (orange) Mg 2+. Only one experiment is displayed per dataset. Data were corrected for dilution, TNP-ATP's intrinsic fluorescence and inner filter effects according to the Materials and Methods section. 80
99 quite different from those utilized in full-length CheA dimers and that likely is present only at the very high protein concentrations utilized for crystal production). Therefore, I performed cross-linking experiments as a way to assess the dimer versus monomer status of my proteins. This approach had been used previously in the Stock lab [172] and in this lab [68] to determine the approximate K d for the dimer-to-monomer equilibrium (K d = µm) for full-length CheA. This value has been confirmed by more rigorous analytical ultracentrifuge studies [83]. My results (Figure 2-17) indicate that both EcP4 and TmP4 exist as monomers in the concentration range µm. My binding experiments were performed using P4 concentrations at 0.1 µm, so these cross-linking results support my analysis of these titrations which used the assumption that these CheA fragments were monomeric. One caveat for this conclusion is that I had to perform the cross-linking reactions at 25 C (the cross-linker did not react well with the proteins at 4 C), so I have to extrapolate my 25 C conclusion to the 4 C binding studies. Despite this caveat, it does seem unlikely that P4 would dimerize to any significant extent at 4 C at protein concentrations in the range between µm (the concentration range used for my equilibrium binding experiments). Another concern related to CheA dimerization arises from considering the details of my titrations of full-length CheA at low concentration (~ 0.1 µm) with TNP-ATP. Under these conditions, CheA dimers are expected to dissociate (at least partially) to form monomers. Yet, I analyzed these data to determine the binding properties of the CheA dimers. Was this analysis justified? The EcA and TmA present in my 81

 at 5 µm. Lanes 8 and 9: TmP4 (monomer is ~ 23 kda) at 1 µm. Lanes 10 and 11: TmP4 at 10 µm. Lanes 12 and 13: TmP4 at 50 µm.")
100 Figure Cross-linking studies show that both EcP4 and TmP4 do not dimerize over a range of concentrations. Cross-linking experiments were performed at 25 C according to the Materials and Methods section. Aliquots from these reactions were run on a 12 % SDS-polyacrylamide gel. Each pair consists of a control (unlinked) reaction followed by the cross-linked reaction. Lane 1: Low molecular weight standard. Lanes 2 and 3: EcP4 (monomer is ~ 22 kda) at 10 µm. Lanes 4 and 5: EcP4 at 50 µm. Lanes 6 and 7: EcA (monomer is ~ 76 kda) at 5 µm. Lanes 8 and 9: TmP4 (monomer is ~ 23 kda) at 1 µm. Lanes 10 and 11: TmP4 at 10 µm. Lanes 12 and 13: TmP4 at 50 µm. EcA is shown to dimerize under these experimental conditions. P4 samples show no dimerization at 1 µm or 10 µm and an insignificant amount of dimerization at 50 µm; a concentration that is 500 times higher than that used in my equilibrium titrations. 82
101 concentrated stock solutions (> 200 µm) would certainly be primarily dimeric, but what might happen when the concentrated protein is diluted extensively immediately prior to the binding experiments? Park et al. monitored the rate at which TmA and EcA dissociate into their monomeric subunits [125]. By extrapolating the linear Eyring plots presented in their paper, I can predict that the time it takes for half of the population of TmA dimers to dissociate to monomers is 2.5 x 10 5 hours at 4 C. The time required for half the population of EcA dimers to dissociate to monomers at 4 C is 140 minutes. I was meticulous in ensuring that my equilibrium titrations did not extend over 20 minutes from initial enzyme dilution to final emission scan recorded. Over this time range, both TmA and EcA are expected to remain dimers. 83
102 DISCUSSION CheA purifies as a homodimer, and it is thought to function as a homodimer in cells [172]. Each protomer of the dimer has an ATP binding site, and in the threedimensional structure of T. maritima CheA, these binding sites are separated by 90 Å with no obvious linkage between them (Figure 1-8) [17]. Thus, each dimer can bind two molecules of ATP, or two molecules of the fluorescent ATP analogue, TNP-ATP. Previous work appeared to indicate that the two ATP binding sites functioned independently [160]. Although this general conclusion (lack of cooperativity) was not rigorously tested, it did not seem unreasonable given the physical separation of the two binding sites and the absence of any indications of cooperativity in studies of the effect of ATP concentration on CheA autophosphorylation kinetics [160, 180]. Contrary to these previous assumptions (that the two ATP binding sites of the CheA dimer are equivalent and non-interacting), the results presented in this chapter indicate that there is asymmetry in the interaction of CheA homodimers with TNP-ATP. Specifically, binding of the first TNP-ATP molecule to the first ATP-binding site of a CheA dimer differs from the second binding event in two ways: (1) the first binding event generates a larger change in the fluorescence emission of bound TNP-ATP compared to the second binding event; and (2) the first binding event has considerably higher affinity than the second binding event. What underlies these differences? One possibility is that, although the two protomers present in CheA homodimers have very similar structure/architectures, the ATP-binding sites in the two protomers differ in some fundamental way (i.e., pre-existing asymmetry). 84
103 A second possibility is that the two binding sites are initially identical but are linked through cooperative interactions (i.e., induced asymmetry). To consider the possibility of pre-existing asymmetry, I examined the crystal structure of the T. maritima CheA fragment called CheAΔ289 [17]. This structure shows the P3-P4-P5 domains of CheA crystallized as a dimer in which the two protomers have very similar overall structures, but there are some modest differences that Bilwes et al. [17] revealed by superimposing the two protomers of the P3-P4-P5 crystal structure. These differences reflect alterations in the relative positioning of the three domains, but they do not indicate differences in the ATP-binding sites. For example, in one protomer a "closed" conformation exists where the flexible linker region between the kinase domain and the regulator domain impinges on the linker region between the dimerization domain and the kinase domain. An "open" conformation exists in the other protomer, where both linkers appear to maintain their distance. These observed differences are consistent with the idea that the domains can be repositioned by shifting the flexible linkers connecting the domains. It is important to note that although detailed structural information about CheA comes from studies of T. maritima CheA, most of the functional information about CheA comes from biochemical assays that utilize CheA from Salmonella typhimurium or E. coli CheA. The T. maritima equilibrium binding studies that I presented in this chapter demonstrate that the apparent asymmetry observed for TNP-ATP binding to E. coli CheA also occurs with T. maritima CheA. Therefore, the possible structural basis for asymmetry discussed above should apply to both the E. coli and T. maritima proteins. 85
104 The asymmetry evident in the CheA crystal structure might be responsible for the spectral differences that I observed when TNP-ATP bound the first and second ATPbinding sites. For example, the "open" and "closed" conformations might affect the environment surrounding the TNP fluorophore in the CheA:TNP-ATP complex. Unfortunately, it is not possible to use x-ray crystallography to directly analyze this asymmetry when TNP-ATP binds CheA P3-P4-P5 because the CheAΔ289 protein does not crystallize in the presence of TNP-ATP (or any other ATP derivative), and existing CheAΔ289 crystals cracked when nucleotides were added to them [18]. The only crystal structures available for nucleotide-bound CheA involve just the isolated P4 domain, for which observing domain-domain interactions is not possible. Nevertheless, the preexisting asymmetry observed in the P3-P4-P5 crystal structure might account for the spectral differences (comparing binding to site 1 versus site 2) in both the E. coli proteins and T. maritima proteins. This pre-existing asymmetry could also be the basis for the difference in binding affinities at each ATP binding site. However if this were the case, then the second (low affinity) ATP-binding site would effectively be "dormant" (i.e., unused) under normal intracellular conditions where [ATP] would be significantly less than the K d for this binding interaction. A second possible explanation for the observed asymmetry in the CheA ATPbinding sites involves induced asymmetry. In this scenario, the two binding sites of the CheA homodimer are initially identical but are linked so that the first binding event changes the affinity at the second binding site, located some 90 Å away. The model that has traditionally been useful for discussing induced conformational changes that lead to 86
105 allosteric cooperativity is the KNF or "sequential" model of cooperativity [43, 81, 82]. When applied to the CheA situation (a homodimer), the KNF model would assume that the CheA protomers exist in a high affinity/high fluorescence conformation in the absence of bound ligands. When TNP-ATP binds one protomer of the dimer, this binding induces a conformational change in that protomer, and this in turn causes the other protomer to adopt a conformation with both lower fluorescence and lower affinity for TNP-ATP [82]. Both of these scenarios (pre-existing asymmetry and induced asymmetry) are depicted in Figure The P4 (monomeric) results suggest that these monomers are acting similar to the first binding site of dimeric CheA. The P4 monomers demonstrated a high fluorescence when binding TNP-ATP, comparable to the fluorescence observed when dimeric CheA had only one site filled by TNP-ATP (from the CheA-in-excess titrations). In addition, the K d from the P4 titrations is close to K d1 for dimeric CheA binding TNP-ATP. The question remains as to whether or not CheA binds unmodified ATP with negative cooperativity in the same manner as observed for TNP-ATP. One can view the TNP-ATP ligand as being an ATP molecule with an additional trinitrophenyl ring. If the ATP part of the molecule interacts with the same binding site as does unmodified ATP, it would seem likely that negative cooperativity would apply in both cases. However, closer inspection of the TNP-ATP binding interactions at the CheA active site indicates that they are somewhat different from those utilized by ATP. The adenine rings from TNP-ATP, ADPNP, ADPCP, and ADP all bind the active site in a similar conformation, but the ribose sugar ring from TNP-ATP adopts a different conformation than that 87
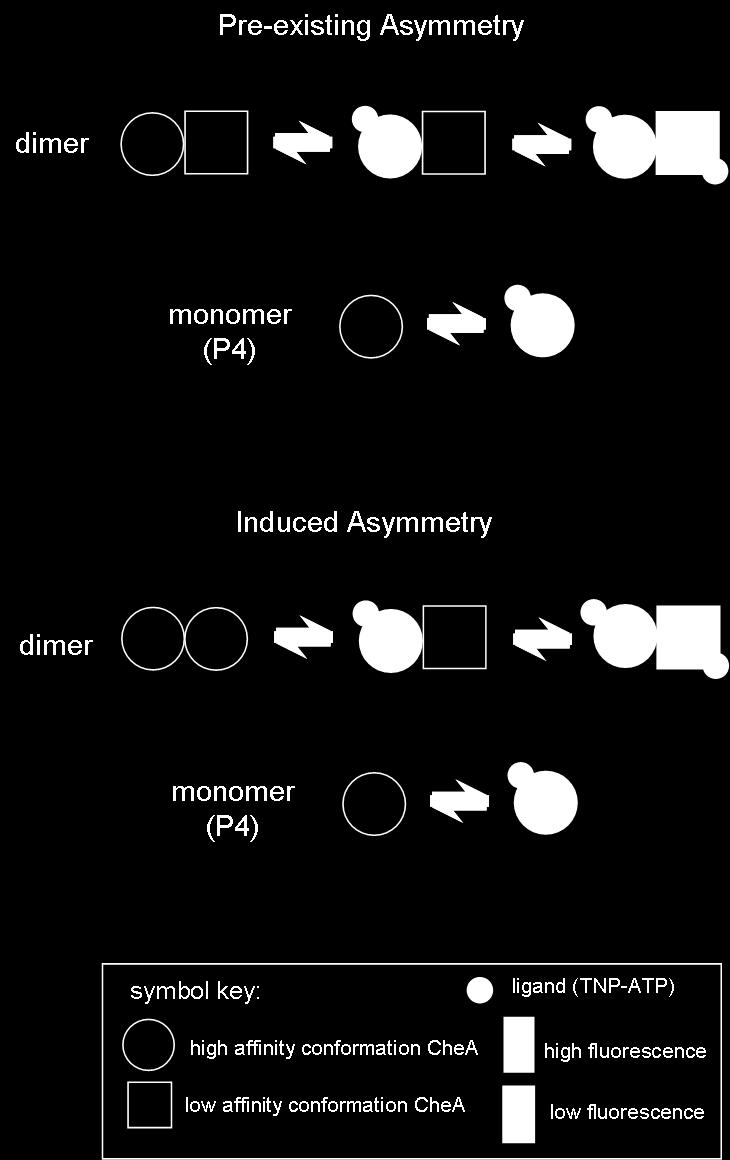
106 A B 88
107 Figure Two Models Depicting CheA Asymmetry. (A) This model is used to describe how pre-existing asymmetry can account for the fluorescence and affinity asymmetry observed in dimeric CheA. Both a high affinity/high fluorescence binding site and a low affinity/low fluorescence binding site exist in the CheA dimer whether ligands are present or absent. (B) The induced fluorescence asymmetry scenario is modeled after the KNF or 'sequential' allosteric model. Here, both binding sites in dimeric CheA exist in a high fluorescence/high binding affinity state when no ligands are bound. When one ligand binds the first binding site a conformational change is communicated to the second binding site that results in lower fluorescence and lower binding affinity at this second site. [Adapted from (43)]. 89
108 observed in the other nucleotides [18]. One consequence of this unusual ribose conformation is that TNP-ATP is capable of establishing only a portion of the multiple binding contacts utilized by ATP. One or more of these retained contacts (i.e., shared by TNP-ATP and ATP) would have to be the trigger(s) for generating the conformational change responsible for cooperativity, if it is in fact true that ATP and TNP-ATP give rise to the same conformational change. What would be the driving force behind CheA evolving a negative cooperative mechanism for nucleotide binding? One possibility is that negative cooperativity could promote a one-active-site-at-a time scenario. If the same ratio between K d1 and K d2 for TNP-ATP binding (~ 40) also applies for unmodified ATP, then for ATP binding, K d1 would be 300 µm while K d2 would be 12 mm. This is considerably higher than the concentration of ATP estimated to be in the cell (~ 3 mm) [22]. Therefore, at any one time in the cell, CheA would most likely have only one ATP-binding site filled. Asymmetry has been observed in the autophosphorylation reaction of the CheA dimer. Levit et al. [89] showed that the rate of autophosphorylation increases dramatically with CheA heterodimers (full-length wild-type CheA protomer paired with the truncated CheA P3-P4 ) as compared with wild-type CheA homodimers. Therefore, by removing the P1/P2 domains from one protomer, the P1 domain on the other protomer is more easily phosphorylated. In other words, the P1/P2 domain of one protomer hinders phosphorylation on the opposite protomer, thereby causing a "half-of-sites" reactivity situation [89]. Bilwes et al. suggested that this could arise when autophosphorylation of one CheA protomer is inhibited by the "closed" conformation observed in the crystal 90
109 structure of CheAΔ289, as the P5 regulatory domain may interfere with P1 binding the kinase domain in one protomer of each CheA dimer [17]. Negative cooperativity in ATP binding could also contribute to half-of-sites reactivity but via a distinct mechanism: only one of the two active sites would be functional at any given time because only one would have bound ATP. CheA is not the first two-component sensor kinase to demonstrate asymmetry between the two protomers in a dimer. The sensor kinase, NtrB, from the twocomponent system that regulates gene expression in response to nitrogen availability, demonstrates asymmetric equilibria in the phosphorylation reactions of the first and second subunits [74]. It is unclear whether this asymmetry reflects different ATPbinding affinities in the two protomers of the NtrB dimer. In summary, the results in this chapter support the idea that asymmetry exists in the ATP-binding sites within the two subunits of the CheA dimer. In the case of E. coli CheA, the two ATP binding sites communicate to produce negative cooperativity when binding TNP-ATP. This discovery could have important implications for understanding why CheA exists as a dimer in the cell and how the CheA dimer functions during the autophosphorylation reaction. In the future, it will be important to examine whether CheA dimers from other bacterial species also exhibit cooperativity, as would be expected if this mechanism is an important feature of the chemotaxis pathway. Further work applying this type of analysis to sensor kinases in other two-component signaling systems could also lead to new insights regarding the general class of histidine protein kinases. 91
110 Chapter 3: Kinetics of TNP-ATP Binding to CheA. INTRODUCTION Adenosine triphosphate has been termed the "universal energy currency" in living cells. In some processes, the energy available from hydrolysis of the ATP high energy phosphate groups is used to 'drive' reactions that otherwise would be energetically unfavorable. However, there is another important use for ATP in biological systems: the high energy γ-phosphate group can provide the energy to promote key conformational changes in some proteins when these proteins are covalently modified via phosphorylation. This is a common situation in signal transduction pathways: a receptor regulates the activity of a protein kinase that, in turn, regulates the activity of downstream effector proteins by altering their conformations via phosphorylation [119]. When studying such systems, often it is useful to monitor the binding of ATP to the kinases and phosphorylation of the individual proteins. Phosphorylation events can be monitored in a straightforward manner using ATP carrying radioactive phosphate(s). Monitoring the binding of ATP to a protein is a more difficult task. For example, binding events do not necessarily generate a readily observable signal, and using radiolabeled ATP, although possible, often does not provide a way to study rapid binding events or to investigate the mechanisms of binding reactions. The synthesis and characterization of trinitrophenylated nucleotide analogues have facilitated such binding studies. Monitoring changes in the fluorescence signal emitted by these nucleotide derivatives when they interact with some proteins allows visualization of binding events [Reviewed in (66)]. 92
111 TNP-ATP, (2',3'-O-(2,4,6-trinitrocyclohexadienylidene) adenosine 5'- triphosphate), first synthesized and reported by Toshiaki Hiratsuka in 1973, is a fluorescent nucleotide analogue that has been used to study numerous ATP-utilizing proteins (Figure 2-2). Excitation of the TNP fluorophore of this molecule with light of appropriate wavelength (maximal excitation at ~ 408 nm) gives rise to fluorescence in the nm range [67]. This molecule is weakly fluorescent in aqueous solutions, but this fluorescence is sensitive to its environmental surroundings and can be enhanced dramatically in hydrophobic environments [65]. Tracking TNP-ATP fluorescence has enabled detailed studies of ligand binding to a host of enzymes, including F-type ATPases, DNA helicases, and kinases [66, 101, 102]. Importantly, monitoring fluorescence changes associated with TNP-ATP binding can be accomplished on a very rapid timescale, and this has enabled researchers to analyze binding kinetics as a way to define the mechanisms underlying binding reactions. TNP-ATP has been used to study ATP-binding by CheA, the histidine kinase that functions in the bacterial chemotaxis system [160]. The chemotaxis signal transduction pathway is responsible for regulating the swimming behavior of prokaryotes in response to environmental stimuli (Figure 1-5) [Reviewed in (7, 50, 155, 168)]. CheA is thought to function as a dimer in which each protomer binds ATP and directs phosphorylation of its partner protomer. In cells, CheA interacts closely with another protein, CheW, and several chemotaxis receptor proteins to form large signaling complexes located at the poles of the bacterial cell (Figure 1-3) [55, 56, 108, 172]. In these complexes, the cellsurface receptors modify the autophosphorylating activity of CheA (via an unknown 93
112 mechanism) in response to changes in environmental concentrations of attractants and repellents [24, 60-63, 123]. The phosphate signal is transferred from CheA to either of two response regulator proteins, CheY or CheB [60]. When CheY becomes phosphorylated, phospho-chey diffuses through the cytoplasm and then binds to protein components of the flagellar motor. This binding event increases the probability that the swimming cell will 'tumble' (i.e., change direction by somersaulting) [10, 188]. Phospho- CheB functions as a methylesterase and is part of the sensory adaptation pathway of the chemotaxis system [167]. Over the past decade, research in several laboratories has focused on understanding the structure and function of CheA as a 'model system' for understanding the large superfamily of sensor histidine kinases (HPKs) that are abundant in prokaryotes. CheA is a 71 kda protein (654 amino acids for E. coli CheA) consisting of five domains (P1-P5) (Figure 1-7) [50, 144, 168, 173]. Each domain has a defined structure and a defined function [Reviewed in (50, 168)]. The P4 domain binds ATP and catalyzes the phosphorylation of the N-terminal P1 domain. This appears to be a transphosphorylation reaction in which P4 of one protomer directs phosphorylation of P1 on the other protomer within the dimer [60-63, 89, 123, 174, 190]. The P2 domain is located immediately adjacent to P1 and is responsible for binding CheY or CheB, which then receive the phosphate from the P1 domain [62, 173]. P5 binds the receptors, with the help of CheW, to form the signaling complexes described above [30]. P3 is responsible for CheA dimerization [172]. 94
113 The ATP binding pocket within the P4 domain includes four sequence motifs (N box, G1 box, F box, G2 box) that are highly conserved in the HPK superfamily (Figure 1-9A) [3, 17]. The region of P4 flanked by the F box and G2 box has been termed the "ATP lid." This lid region contains a flexible loop that appears to undergo significant conformational changes when CheA binds ATP [18]. Multiple crystal structures have been solved for CheA, including a crystal structure of the ATP-binding domain (P4) of CheA empty, bound to ADPCP, and bound to TNP-ATP (Figure 1-9B) [17, 18]. Several genetic and biochemical studies have elucidated the function of CheA within the chemotaxis signal transduction pathway [60-63, 69, 112, 123, 153, 154, , 160, 180, 181]. The catalytic mechanism for CheA autophosphorylation involves a minimum of three steps: ATP binding, phospho-transfer from ATP to His48, and ADP release from the phosphorylated protein [180]. In vitro, the phospho-transfer step for purified CheA (in the absence of any additional chemotaxis proteins) is rate limiting and quite slow (k cat = 0.05 s -1 ) [180]. This rate could not account for the rapid signal transduction events that were known to take place in cells: cells respond to attractants and repellents in less than a tenth of a second, and so P-CheY must be generated/destroyed on a sub-second time-scale [21, 140]. However, when CheA is allowed to form signaling complexes by binding to CheW and chemoreceptor proteins, it has a dramatically enhanced autophosphorylation activity (k cat ~ 60 s -1 ) [90] that is fast enough to account for the rapid adjustments of CheY phosphorylation that underlie chemotaxis signal transduction [24, 114]. These findings led to a nomenclature that reflects the different 'activity states' possible for CheA: "uncoupled CheA" has low autokinase activity because 95
114 it is not part of the CheA-CheW-receptor signaling complexes; "coupled CheA" refers to CheA that is present in signaling complexes. Coupled CheA, in the absence of any chemical attractants or repellents, has high autokinase activity (k cat ~ 60 s -1 ) [90]; in the presence of chemoattractants, the receptors in these complexes drastically inhibit CheA activity (k cat ~ s -1 ) [6, 23]. Previous work in our lab has focused on understanding the ATP binding step of the autophosphorylation reaction. An approximate affinity for ATP binding by CheA has been determined (K d = 300 µm at 25 C) [180]. Further studies indicated that 'the binding step' actually involves at least two distinct steps for ATP binding [154]. These studies used a version of CheA that had been genetically engineered to position a tryptophan residue (a F455W substitution) within the "ATP lid" region. This version of CheA then served as a fluorescent reporter to monitor conformational changes occurring at the ATP binding site caused by nucleotide binding. Another approach taken in this lab for studying CheA-ATP interactions has involved using the fluorescent ATP analogue, TNP-ATP [69, 160]. CheA, as well as some other protein kinases, binds TNP-ATP with greater affinity than it does the natural substrate, ATP [66]. For CheA, this affinity difference is about 1000-fold [69, 160]. Although TNP-ATP is utilized as a substrate by some protein kinases, CheA cannot autophosphorylate using TNP-ATP as the phosphodonor [66, 160]. Nonetheless, TNP- ATP has been useful in several investigations of CheA-ATP interactions. For example, Ann Hirschman in this lab used TNP-ADP to examine the effect of several mutations on the ATP-binding ability of the CheA active site [69]. Additional work demonstrated that 96
115 TNP-ATP competes with ATP for the CheA active site and that active site mutations affect the ability of the protein to bind ATP and TNP-ATP in similar ways [160]. The fluorescence changes observed when TNP-ATP binds to CheA were also used to establish the stoichiometry of ATP binding: two binding sites per CheA dimer [160]. In Chapter 2, I extended this approach to determine that these two binding sites exhibit negative cooperativity. Here in Chapter 3, I followed up on those findings by examining the kinetics of the binding interaction between CheA and TNP-ATP. At the outset of these studies, I had hoped this analysis of binding kinetics would lead to a more complete understanding of these cooperative interactions. However, analyzing binding events at two linked binding sites in CheA dimers had the potential to be very complicated. Therefore, I first set out to analyze, in detail, a simpler situation: binding of TNP-ATP to a monomeric version of CheA, the isolated P4 domain. I found that even this 'simple' scenario is quite complicated, involving three sequential steps in some instances. Because of this complexity, I did not pursue detailed analysis of the kinetics of TNP-ATP binding to CheA dimers, although I did perform a semi-quantitative analysis that allowed comparison with the P4 binding results. For my detailed analysis of TNP-ATP binding kinetics, I made use of the P4 domain from Escherichia coli CheA and P4 from CheA of the extreme thermophile Thermotoga maritima. The latter is attractive because detailed structural information is available for P4:nucleotide complexes. The overall goal was to create a 'reaction scheme' or 'kinetic model' in which I specified the minimal number of steps and reaction intermediates to account for my observations. A related goal was to estimate the 97
116 magnitudes of the rate constants that determine how quickly one reaction intermediate converts to the next. My initial analysis involved traditional "graphical" methods [170] to define the general features of the reaction scheme for TNP-ATP binding to P4. I then used this information to structure a "global" computation analysis [130] that helped to define more rigorously some of the rate constants in my model. In the Discussion, I relate my model to the structure of the CheA active site available for the P4 domain from T. maritima CheA. 98
117 MATERIALS AND METHODS Chemicals and Reagents, Plasmids, Protein Purification. See Chapter 2. Rapid Reaction Measurements. Stopped-flow fluorescence experiments were performed using the SF-2004 stopped-flow instrument designed by KinTek. The dead-time of this instrument was determined to be at 2 ms by using the Massey procedure [34]. The excitation wavelength was set at 410 nm with slits at 1.56 mm (10 nm bandpass) and the emitted light was monitored at >515 nm (using an OG515 long-pass cutoff filter). The experiments were run at 4 C unless specified in the text. When required, MgCl 2 was added to the reaction buffers at a final concentration of 20 mm immediately before use. For the association kinetics experiments, CheA was diluted into TEDKM or TED+K buffer to a desired concentration immediately before use and kept on ice for all experiments. TNP-ATP was diluted into TEKM or TE+K buffer (no DTT) to the desired concentration immediately before use, verified spectrophotometrically, and kept on ice. A typical association reaction consisted of TNP-ATP (at various concentrations) shot against a 1 µm solution of CheA (all concentrations listed are after mixing unless otherwise indicated). At each concentration of TNP-ATP, a baseline was obtained by shooting TNP-ATP versus buffer. The fluorescence of TNP-ATP created some experimental difficulties by causing a high 'background' signal on top of which the rapid fluorescence changes of interest were superimposed. Because of this, I occasionally had to adjust the PMT voltage when changing from one TNP-ATP solution to a higher one 99
118 (to keep the signal on-scale). Specifically, for the TNP-ATP concentrations up to a final concentration of 30 µm with TmP4 and 15 µm with TmA, EcA, or EcP4, I set the PMT voltage to 900 volts. Higher TNP-ATP concentrations required a lower PMT voltage (800). Data were collected using the KinTek software with the number of data points (1000 total) split evenly between two different time scales, a faster time scale ( < 0.1 seconds) and a slower time scale (from 0.1 to 1.0 seconds). Due to signal averaging and the different timescales, more signal noise was visible in the fast phase. This was unavoidable shots were collected and averaged to generate a time course to determine the observed rate constant for each experiment. Each experiment described here was repeated at least twice using independently prepared protein mixtures and TNP- ATP solutions. A typical dissociation reaction required a preformed complex of TNP-ATP:CheA. A solution of 2 µm TNP-ATP and 20 µm CheA was made in either TEDKM or TED+K buffer and placed on ice for 5-10 minutes. ATP was diluted into either TEDKM or TED+K buffer and placed on ice before use. Each dissociation reaction was performed using 50 mm ATP and then repeated at 100 mm ATP using a PMT voltage of 900 (concentrations listed before mixing) shots were collected and averaged to determine the observed rate constant for the observed fluorescence decrease. A baseline (or expected endpoint) was obtained by reacting 2 µm TNP-ATP against 100 mm ATP in TEDKM buffer and by also taking into account a small fluorescence signal arising from the protein preparations in the absence of TNP-ATP. 100
119 Data Analysis and Fitting. Data analysis consisted of two different methods: a graphical analysis [170] and a global analysis [130]. For the graphical analysis, data were manipulated using the SigmaPlot mathematical software or the data analysis software supplied with the KinTek instrument. For the association kinetics, a blank TNP-ATP time course was subtracted from each experimental time course (such that the signal shown in the figures reflects the fluorescence change due to binding events). The fast phase was isolated (i.e., the slow phase was cut off), and the first two milliseconds from each time course were ignored (because they included the end-of-flow of solutions into the observation chamber). I determined the pseudo-first order rate constant by fitting the isolated phase to a single exponential equation using SigmaPlot: f = y0 + a*(1-e b*x ) (eq. 3-1) The resulting k obs vs. [CheA] plots were fit to the following hyperbolic equation: F = y 0 + (a*x)/(b+x) (eq. 3-2) The slow phase from each time course was isolated (i.e., the fast phase data points were deleted) and fit to a single exponential equation (eq. 3-1) using the KinTek data analysis software. The parameters reported are the average of two independent data sets. The error on each parameter is usually the error generated from averaging the parameters from each individual dataset. Occasionally, if the fit error is larger, that statistic was reported. The global analysis required the use of MATLAB software distributed by MathWorks ( The scripts used in this analysis are included in Appendix B. Global optimization was performed on the association and dissociation 101
120 kinetics of TNP-ATP binding TmP4 and EcP4. Two experimental datasets were optimized individually, and the parameters for each dataset were presented. An overview of the fitting routine for each protein is as follows. Step 1: The association binding kinetics were fit globally to a specific mechanism with the computer program searching for all rate constants as well as fluorescence coefficients. Step 2a: The refined rates from Step 1 were used to simulate a dissociation reaction. The simulation was inspected by eye and it was determined in both T. maritima and E. coli that the simulation did not describe the observed kinetics. Step 2b: The dissociation reaction was then fit to a specific mechanism with certain rate constants held constant while refining the other rate constants (as described in the Results section) and that fit was verified by eye. Step 3: The refined rate constants from Step 2b as well as the fluorescence coefficients from Step 1 were held constant in a final fit of the association kinetics in order to further refine the remaining rate constants. In order to fit simultaneously the association binding data from the TNP-ATP concentration series, I included only time courses obtained at the same PMT voltage. Each time course underwent the following data manipulations: (i) a blank TNP-ATPonly time course at each concentration was subtracted from the respective CheA + TNP- ATP time course; (ii) a correction for inner filter effects was applied; and (iii) the endpoint of each time course was manually adjusted to end at the same fluorescence. After the inner filter corrections, I observed that as the concentration of TNP-ATP varied, the time courses appeared to end at the same fluorescence. Since the global analysis was sensitive to the endpoints, I minimized the variation in each time course by adjusting the 102
121 trace so that all endpoints ended at the same fluorescence. In all cases this final adjustment was less than 0.1 units. Each fitting routine for both the TmP4 and EcP4 association kinetics (Step 1 and 3) assumes a 3-step binding mechanism (mech. 3-3 presented in Results section). To fit the dissociation reactions (Step 2), I used the data obtained using 100 mm ATP substrate. The data were modified so that each time course ended at zero fluorescence. For both the TmP4 and EcP4 series, each fitting routine initially assumed a three-step dissociation mechanism (mech. 3-5, further described in the Results section). The rate constants obtained from the TmP4 data using this model were used in the fitting routine for the association data (Step 3) and provided a good fit. However, the rate constants obtained from fitting the EcP4 dissociation data did not provide a satisfactory fit when used in Step 3. As described in the Results, I modified the dissociation mechanism to two steps (mech. 3-6). This model drastically improved the fits for EcP4. 103
122 RESULTS I used a rapid reaction instrument (a stopped-flow spectrofluorometer) to examine TNP- ATP binding to the following proteins: full-length CheA from E. coli (EcA), full-length CheA from T. maritima (TmA), the P4 domain of E. coli CheA (EcP4), and the P4 domain of T. maritima CheA (TmP4). For each of these proteins, I analyzed the binding reaction in the presence and absence of Mg 2+, which is necessary for CheA autophosphorylation and which has been shown to influence the ATP-binding mechanism of E. coli CheA derivative F455W [154]. The results obtained in the absence of Mg 2+ were simpler, so I present them first before considering the plus-mg 2+ results, and then I turn to TNP-ATP binding to full-length CheA dimers. The Kinetics of CheA Binding TNP-ATP in the Absence of Mg 2+. CheA binds ATP with a one-step reaction mechanism in the absence of Mg 2+ and a two-step mechanism in the presence of this divalent ion [154]. As Mg 2+ apparently complicates the nucleotide binding mechanism of CheA, I first monitored TmP4 binding TNP-ATP in the absence of Mg 2+. These experiments were performed at 4 C because the reactions were too fast to monitor at 25 C even using a stopped-flow instrument (they were essentially complete within the instrument dead-time). The lower reaction temperature also allowed me to relate my results to the binding analyses in Chapter 2. Figure 3-1A is an example of a time course obtained following rapid mixing of TmP4 with excess TNP-ATP. These data were fit well by a single-exponential equation (with a zero y-axis intercept) that defined a pseudo-first order rate constant (k observed ). Using this approach, I examined the binding 104
123 A B Figure 3-1. Kinetics of TmP4 binding TNP-ATP in the absence of Mg 2+. (A) Fluorescence stopped-flow measurements of the emission intensity of TNP-ATP (λ ex = 410 nm, λ em = 515 nm) were made after rapidly mixing 1 µm TmP4 with 2 µm TNP-ATP in TED+K buffer at 4 C (concentrations listed are after mixing). Analysis of the time course as a single-exponential rise indicated k observed = 164 s -1. The solid line depicts the computer generated best fit that defined this k obs value. The time course depicted by black circles is TNP-ATP by itself. (B) Analysis of the effect of TNP-ATP concentration on the rate of complex formation. The plot of k obs versus TNP-ATP concentration indicates saturation kinetics and is fit well by a single exponential equation (black line) with a zero y-axis intercept and defined by a maximal (extrapolated) k obs value of 970 ± 180 s -1 (k max ) and a half-maximal k obs value (K d kin ) at a TNP-ATP concentration 8 ± 3 µm. Error bars indicate the standard error of the mean for data points representing averages from two independent experiments. 105
124 kinetics for reactions using several different TNP-ATP concentrations (ranging from 2 µm to 18 µm). The dependence of k obs on TNP-ATP concentration exhibited saturation kinetics (Figure 3-1B) and defined a maximal (extrapolated) rate constant of 970 ± 180 s -1 (hereafter referred to as k max ), and a k obs value equal to half of k max at a TNP-ATP concentration of 8 ± 3 µm (hereafter referred to as the 'kinetically defined K d ' or K kin d ). The simplest reaction scheme that can account for these results is a two-step reaction mechanism; k 1 k 2 E + S ES EP k -1 k -2 (mech. 3-1) in which the enzyme, CheA (E), binds the substrate, TNP-ATP (S), in the first step to form an initial complex (ES) which is spectrally silent. In the second step, ES undergoes a conformational change to the final complex (EP) which has enhanced fluorescence emission. The observable parameters extracted from Figure 3-1B (K kin d, k max, y-axis intercept) can be related to the rate constants for the individual rate steps (k 1, k -1, k 2, k -2 ) (Table 3-1) of the two-step binding mechanism (mech. 3-1) according to the following equation [170]: k obs = k 1 [S] (k 2 + k -2 ) + k -1 k -2 k 1 [S] + k -1 + k 2 (eq. 3-3) k -1 k where at infinite [S], k -2 max = k 2 (if k 2 >> k -2 ) and the y-axis intercept =. k -1 + k 2 For a rapid equilibrium situation (k -1 >> k 2 ), the y-axis intercept would be equal to k -2. In this two-step mechanism, if k 2 >> k -2 then the kinetically defined K d would be equal to the following expression: 106
125 Table 3-1 Parameters extracted from the kinetic analysis of TmP4 binding to TNP-ATP in the absence of Mg 2+ as they relate to a 2-step binding mechanism: k 1 k 2 E + S ES EP k -1 k -2 Parameter Value Standard Deviation K d kin (µm) 8 3 k 2 (s -1 ) k -2 (s -1 )
126 K d kin k -1 + k 2 k 1 (eq. 3-4) Estimating the k -2 value from association kinetics data can be difficult because it involves extrapolating a presumed hyperbola to define the y-axis intercept (at zero ligand concentration) [170]. To define more rigorously this value, I also performed experiments designed to directly observe dissociation of the TmP4:TNP-ATP complex in the absence of Mg 2+ (Figure 3-2). To do this, I used the stopped-flow instrument to rapidly mix a pre-equilibrated solution of TmP4:TNP-ATP complex with a large excess of ATP and then monitored the ensuing fluorescence decrease reflecting dissociation of TNP-ATP ATP from the protein complex. Since the relative affinities of CheA for ATP (K d = µm) and TNP-ATP (K TNP-ATP d = 0.2 µm) [69] differ by 1000-fold, I used a large excess (25,000 to 50,000-fold) of ATP to ensure the dissociation reaction went to completion. The dissociation time courses were fit to a single exponential equation and indicated a k obs = 0.60 ± 0.01 s -1. In Table 3-1, I assigned this value to k -2 (the step that converts EP to ES). In analyzing the dissociation time course, I noted that the final endpoint of the reaction came close to, but did not quite reach, the signal level anticipated for complete dissociation of the TmP4:TNP-ATP complex. I discuss the potential significance of this in Appendix C. I also examined the association and dissociation kinetics for the interaction of TNP-ATP with the P4 domain of E. coli CheA (EcP4) in buffer lacking Mg 2+ at 4 C. Figure 3-3A is an example of a time course obtained when rapidly mixing EcP4 with 108
127 Figure 3-2. Kinetics of TmP4:TNP-ATP complex dissociation in the absence of Mg 2+. Fluorescence stopped-flow measurements were performed to monitor the fluorescence emission intensity of TmP4:TNP-ATP complex upon rapid mixing with an excess of ATP. The gray circles represent the fluorescence change when a pre-equilibrated solution of 1 µm TNP-ATP and 10 µm TmP4 was rapidly mixed with 50 mm ATP in TEK+D buffer at 4 C (concentrations listed are after mixing). The black circles represent the baseline when 1 µm TNP-ATP was mixed with 50 mm ATP and include the small adjustment for the fluorescence signal arising from just the protein solution. The displayed time courses represent an average of 10 successive shots. The data were fit by a single exponential equation to give a k obs value of ± s -1. Dissociation experiments performed at both 25 mm and 50 mm ATP gave equivalent results. The k obs value for the 25 mm ATP reaction was ± s
128 A B Figure 3-3. Kinetics of EcP4 binding TNP-ATP in the absence of Mg 2+. (A) Fluorescence stopped-flow measurements were made after rapidly mixing 1 µm EcP4 with 2 µm TNP-ATP in TED+K buffer at 4 C (concentrations listed are after mixing). Analysis of the time course as a single-exponential rise indicated k observed = 106 s -1. The solid lines depict the computer generated best fit that defined this k obs value. The time course depicted by black circles is TNP-ATP by itself. (B) Analysis of the effect of TNP- ATP concentration on the rate of complex formation. The plot of k obs versus TNP-ATP concentration is fit well by a line having a slope of 52 µm -1 s -1 and a zero y-axis intercept. Error bars indicate the standard error of the mean for data points representing averages from two independent experiments. 110
129 excess TNP-ATP. These data were fit well by a single-exponential equation that defined a pseudo-first order rate constant (k observed ). The dependence of k obs on TNP-ATP concentration exhibited a linear relationship with a y-axis intercept of close to zero (Figure 3-3B); there was no indication of the saturation kinetics as I had observed for TmP4 binding TNP-ATP (Figure 3-1B). The simplest reaction scheme to account for this linear dependence of k obs on [TNP-ATP] is a one-step (reversible) mechanism; E + S k 1 k -1 ES (mech. 3-2) in which k -1 is small. However, in the following subsections, I describe that EcP4 and TmP4, in the presence of Mg 2+, appear to bind TNP-ATP with similar kinetic mechanisms. Therefore, it is reasonable to suggest that, in the absence of Mg 2+, EcP4 binds TNP-ATP with a two-step mechanism similar to TmP4 binding TNP-ATP, but that my highest TNP-ATP concentrations did not begin to approach the K d. The apparent linearity in the EcP4 plot may just be a result of 'looking' at the start of a saturation curve where the data approximate a linear dependence. Although I attempted to analyze time courses at higher TNP-ATP concentrations, these reactions were so fast that they were essentially complete within the dead-time of the instrument and provided no useful information. I also measured the rate of dissociation of the EcP4:TNP-ATP complex in the absence of Mg 2+ (Figure 3-4). These data were fit to a single exponential equation with a k obs = 9.1 ± 0.1 s -1. As described above for the TmP4:TNP-ATP dissociation experiment, I noted that the final endpoint fluorescence did not quite reach the anticipated 111
130 Figure 3-4. Kinetics of EcP4:TNP-ATP complex dissociation in the absence of Mg 2+. Fluorescence stopped-flow measurements were performed to monitor the fluorescence emission intensity of EcP4:TNP-ATP complex upon rapid mixing with an excess of ATP. The gray circles represent the fluorescence change when a pre-equilibrated solution of 1 µm TNP-ATP and 10 µm EcP4 was rapidly mixed with 50 mm ATP in TEK+D buffer at 4 C (concentrations listed are after mixing). The black circles represent the baseline when 1 µm TNP-ATP was mixed with 50 mm ATP and include the small adjustment for the fluorescence signal arising from just the protein solution. The displayed time courses represent an average of 10 successive shots. The data were fit by a single exponential equation with a k obs value of 9.1 ± 0.1 s -1. Dissociation experiments performed at 25 mm and 50 mm ATP gave equivalent results. The k obs value for the 25 mm ATP reaction was 10.8 ± 0.1 s
131 endpoint expected for complete dissociation of the EcP4:TNP-ATP complex, and this is discussed in Appendix C. The Kinetics of TmP4 Binding TNP-ATP in the Presence of Mg 2+. X-ray crystallography studies by Bilwes et al. [18] showed that the type of divalent ion (Mg 2+ or Mn 2+ ) alters the conformation of the active site. The Stewart lab recently showed that Mg 2+ influences the ATP binding mechanism for a CheA derivative (CheA F455W ). In the absence of Mg 2+, CheA F455W binds ATP with a single step whereas in the presence of Mg 2+ the binding mechanism involves (at a minimum) two reversible steps [154]. Previous work indicated that Mg 2+ does not affect the binding affinity of the CheA:TNP-ATP interaction [69, 160], but might it affect the binding kinetics? To address this question, I performed experiments similar to those described in the previous section, monitoring the rapid fluorescence change when TmP4 bound TNP-ATP, but in buffer containing 20 mm Mg 2+. Over a series of TNP-ATP concentrations, I observed a biphasic time course: a single representative time course is presented in Figure 3-5. The biphasic ("up-down") nature of this reaction was different from what I had observed for the binding reaction in the absence of Mg 2+, where all time courses were monophasic signal increases. A biphasic time course could reflect two sequential conformational changes in the binding reaction, which suggests a two-step mechanism (mech. 3-1); the initial fast phase was complete in less than 0.1 seconds and formed the first complex intermediate (ES) with a fluorescence coefficient (FC) of 1.9 units; and the slower, second phase was complete within 1.0 seconds, forming a second complex (EP) having a FC of 1.6 units. 113
132 Figure 3-5. Biphasic time course observed for TmP4 binding TNP-ATP in the presence of Mg 2+. A fluorescence stopped-flow experiment was performed to monitor the fluorescence emission intensity of 15 µm TNP-ATP immediately after rapid mixing with 1 µm TmP4 (concentrations listed are after mixing) in TEKMD buffer at 4 C. This time course represents an average of 10 successive shots, each containing 1000 data points equally divided between the two different time scales. At this concentration of TNP- ATP, the initial fast phase ends at about 0.03 seconds, while reaching a maximum fluorescence of 1.9 units. A second, slower phase is observed from 0.03 seconds to 1.0 seconds. During this phase, the fluorescence signal decreases and ends at 1.6 units. Data were corrected as described in the Experimental Methods. 114
133 Initially, I fit each biphasic time course to a double exponential equation (the sum of two exponential processes), but at high substrate concentrations, this equation did not fit the data well. Therefore, I resorted to analyzing each phase independently. The fast phase of each time course (< 0.1 seconds) fit well to a single exponential equation which defined the k obs (Figure 3-6A). The dependence of k obs on TNP-ATP concentrations indicated saturation at high TNP-ATP levels and defined a hyperbolic dependence with a k max value of 1500 ± 650 s -1, a K kin d value of 105 ± 60 µm, and a nonzero y-axis intercept of 17 ± 8 s -1. When compared to the parameters obtained from the TmP4:TNP-ATP binding kinetics in the absence of Mg 2+, the K kin d is about 10-fold greater while the k max is close to 2-fold greater in the presence of Mg 2+. The results for the fast phase alone (without considering the slow phase fluorescence decrease) are consistent with a two-step reaction mechanism. Therefore, for the overall binding reaction in the presence of Mg 2+, a three-step mechanism (mech. 3-3) is required to explain these observed binding kinetics; two steps in the fast phase (fluorescence increase) and a third step accounting for the slow phase (fluorescence decrease): k 1 k 2 k 3 E + S ES ET EP k -1 k -2 k -3 (mech. 3-3) where E is enzyme (TmP4 or EcP4), S is substrate (TNP-ATP), ES is the first binding intermediate, ET is the second binding intermediate and EP is the final complex. (Note that although this scheme uses different symbols (S, T, P) to designate the TNP-ATP during the different steps, this is not meant to imply any change in the chemical 115

134 A B Figure 3-6. Kinetic analysis of the fast phase from biphasic time courses obtained from TmP4 binding TNP-ATP. Time courses were recorded after rapidly mixing 1µM TmP4 with excess TNP-ATP in TEKMD buffer at 4 C. (A) The fast phase of each time course at various TNP-ATP concentrations was fit to a single exponential equation (black line) to obtain the following rate constants: 2 µm TNP-ATP (purple) with k obs = 41.2 ± 0.6 s -1, 4 µm TNP-ATP (green) with k obs = 83.6 ± 1.4 s -1, 15 µm TNP-ATP (blue) with k obs = ± 10.8 s -1. Data were corrected as described in the Materials and Methods section. The black circles represent a baseline of just TNP-ATP after correction for intrinsic fluorescence. (B) Effect of TNP-ATP concentration on the k obs value. The data were fit by a simple hyperbolic function with the following parameters: y-axis intercept = 17 ± 8 s -1, K d kin = 105 ± 60 µm, and k max = 1500 ± 650 s
135 status of the TNP-ATP molecule. Its fluorescent properties are changing, but I am not implying that TNP-ATP is undergoing conversion from substrate to product). Turning to the slow phase of the biphasic time courses, I analyzed just the downward phase of each time course at each TNP-ATP concentration and fit each time course to a single exponential equation to define k obs (Figure 3-7A). The k obs value (k obs = 11.2 ± 2.3 s -1 ) did not appear to vary with TNP-ATP concentration (Figure 3-7B). This result was consistent with a first order reaction. In the proposed three-step mechanism (mech. 3-3), this corresponds to the ET complex undergoing conversion to the final EP complex, which has slightly less fluorescence than ET. In this scenario, the k obs from my analysis of the slow phase would be equal to k 3 + k -3. The kinetics of TNP-ATP dissociation from the nucleotide bound complex can be useful for determining the magnitude of k 3 and k -3. Figure 3-8 shows the fluorescence change observed when I rapidly mixed a pre-equilibrated solution of TmP4:TNP-ATP complex with excess ATP. These data fit well to a single exponential equation with k obs = 0.22 ± 0.04 s -1. Assigning k -3 as 0.2 s -1, k 3 would equal 11 s -1. Since k 3 is about 50-fold faster than k -3, these relative rates lend support to the idea that when TNP-ATP levels exceed the TmP4 concentration, most of the TmP4:TNP-ATP complex exists as EP at equilibrium. The parameters extracted from the TmP4 kinetics are related to rate constants for the individual steps in the reaction mechanism and listed in Table 3-2. The Kinetics of EcP4 Binding TNP-ATP in the Presence of Mg 2+. I also monitored the effect of Mg 2+ on the kinetics of TNP-ATP binding to EcP4. As described above, I 117
136 A B Figure 3-7. Kinetic analysis of the slow phase from biphasic time courses obtained from TmP4 binding TNP-ATP. (A-inset) Full biphasic time courses at various TNP-ATP concentrations show that the decrease in fluorescence is consistent over various TNP- ATP concentrations: pink (7.5 µm), blue (15 µm), red (30 µm). Concentrations listed are after mixing. The data are offset for clarity. (A) The slow phase of the 7.5 µm TNP- ATP time course was isolated and fit to a single exponential equation (black line) with k obs = 10.4 ± 0.7 s -1. (B) Effect of TNP-ATP concentration on the k obs value from analyzing the slow phase of each biphsic time course at each TNP-ATP concentration. The k obs values show no change over TNP-ATP concentration with a mean k obs value of 11.2 ± 2.3 s
137 Figure 3-8. Kinetics of TmP4:TNP-ATP complex dissociation in the presence of Mg 2+. Fluorescence stopped-flow measurements were performed to monitor the fluorescence emission intensity of TmP4:TNP-ATP complex upon rapid mixing with an excess of ATP. The red circles represent the fluorescence change when a pre-equilibrated solution of 1 µm TNP-ATP and 10 µm TmP4 was rapidly mixed with 50 mm ATP in TEKMD buffer at 4 C (concentrations listed are after mixing). The black circles represent a baseline when 1 µm TNP-ATP was mixed with 50 mm ATP, taking into account the small fluorescence signal from the protein sample. 5 successive shots were averaged to produce the above time course. The data were fit by a single exponential equation with a k obs value of ± s -1. Dissociation experiments performed at 25 mm and 50 mm ATP gave equivalent results. The k obs value at 25 mm ATP is ± s
138 Table 3-2 Parameters extracted from the kinetic analysis of TmP4 binding to TNP-ATP in the presence of Mg 2+ as they relate to a 3-step binding mechanism: k 1 E + S ES ET EP k 2 k 3 k -1 k -2 k -3 Parameter Value Standard Deviation K d kin (µm) k 2 (s -1 ) k -2 (s -1 ) 17 8 k 3 (s -1 ) k -3 (s -1 ) FC ET FC EP Best Residual of the Norm
139 performed a set of binding reactions at varying concentrations of TNP-ATP and monitored the rapid fluorescence changes. I observed a biphasic time course at each concentration of TNP-ATP (Figure 3-9) with the initial fast phase (completed by 0.03 seconds) reaching a maximum fluorescence value of 1.1 units, and then this was followed by a slower phase (from 0.03 to 0.6 seconds), in which the fluorescence signal decreased to approximately 0.9 units. Analysis of the fast phase indicated that it was fit well by a single exponential equation at each TNP-ATP concentration. This analysis defined a k obs value at each TNP-ATP concentration (Figure 3-10A). The dependence of k obs on TNP- ATP concentration indicated saturation at high TNP-ATP levels (Figure 3-10B), similar to the situation that I observed with the TmP4 protein. The hyperbolic dependence of k obs on TNP-ATP concentration indicated the following parameters: k max = 2200 ± 700 s -1, K kin d = 125 ± 50 µm, and y-axis intercept = 6 ± 9 s -1. The simplest reaction scheme that can account for both the biphasic time courses and the saturation kinetics observed for the isolated fast phase is a three-step mechanism as determined for TmP4 in the previous subsection (mech. 3-3). I fit the slow phase of each time course to a single exponential equation to obtain k obs values; these values were not affected by TNP-ATP concentration (average k obs = 6.4 ± 0.5 s -1 ) (Figure 3-11). This is similar to the situation observed for the slow phase of the TmP4 reactions. Overall, my results with EcP4 support the idea that the three-step mechanism defined for TmP4 (mech. 3-3) also applies for EcP4 binding TNP-ATP. As described above for the TmP4 protein, I examined the kinetics of TNP-ATP dissociation from EcP4 (Figure 3-12) by monitoring the fluorescence decrease following 121
140 Figure 3-9. Biphasic time course observed for EcP4 binding TNP-ATP. A fluorescence stopped-flow experiment was performed to monitor the fluorescence emission intensity of 15 µm TNP-ATP immediately after rapid mixing with 1 µm EcP4 (concentrations listed are after mixing) in TEKMD buffer at 4 C. At this concentration of TNP-ATP, the initial fast phase ends at about 0.03 seconds and reaches a maximum fluorescence of 1.1 units. A second, slower phase is observed from 0.03 seconds to 0.6 seconds. During this phase, the fluorescence signal decreases and ends at 0.9 units. Data were corrected as described in the Materials and Methods section. 122

141 A B Figure Kinetic analysis of the fast phase from biphasic time courses obtained from EcP4 binding TNP-ATP. Time courses were recorded after rapidly mixing 1µM EcP4 with excess TNP-ATP in TEKMD buffer at 4 C. (A) The fast phase of each time course at various TNP-ATP concentrations was fit to a single exponential equation (black line) to obtain the following rate constants: 2 µm TNP-ATP (purple) with k obs = 37.8 ± 0.6 s -1, 4 µm TNP-ATP (green) with k obs = 73.4 ± 1.7 s -1, 15 µm TNP-ATP (blue) with k obs = ± 18.3 s -1. Data were corrected as described in the Materials and Methods. The black circles represent a baseline of just TNP-ATP after correction for intrinsic fluorescence. (B) Effect of TNP-ATP concentration on the k obs value. The data were fit by a simple hyperbolic function with the following parameters: y-axis intercept = 6 ± 9 s -1, K d kin = 125 ± 55 µm, and k max = 2200 ± 700 s
142 A B Figure Kinetic analysis of the slow phase from biphasic time courses obtained from EcP4 binding TNP-ATP. (A-inset) Full time courses at various TNP-ATP concentrations show the change in fluorescence when 1 µm EcP4 is rapidly mixed with 15 µm TNP-ATP (pink) or when 5 µm EcP4 is mixed with 30 µm (blue) or 45 µm (red). The change appears consistent at each TNP-ATP concentration. Concentrations listed are after mixing. The data are offset for clarity. (A) The slow phase of the 30 µm TNP-ATP time course was isolated and fit to a single exponential equation (black line) with k obs = 17.2 ± 0.6 s -1. (B) Effect of TNP-ATP concentration on the k obs value from analyzing the slow phase portion of each time course at each TNP-ATP concentration. The k obs values show no change over TNP-ATP concentration with a mean value of 11.2 ± 2.3 s
143 Figure Kinetics of EcP4:TNP-ATP complex dissociation in the presence of Mg 2+. Fluorescence stopped-flow measurements were performed to monitor the fluorescence emission intensity of EcP4:TNP-ATP complex upon rapid mixing with an excess of ATP. The red circles represent the fluorescence change when a pre-equilibrated solution of 1 µm TNP-ATP and 10 µm EcP4 was rapidly mixed with 50 mm ATP in TEKMD buffer at 4 C (concentrations are after mixing). The black circles represent the baseline when 1 µm TNP-ATP was mixed with 50 mm ATP, taking into account the small fluorescence signal from the protein sample. The displayed time courses represent an average of 10 successive shots. The data were fit by a single exponential equation with a k obs value of 6.90 ± 0.03 s -1. Dissociation experiments were performed at two different ATP concentrations to ensure the reaction has gone to completion. The k obs value at 25 mm ATP is 5.90 ± 0.03 s
144 Table 3-3 Parameters extracted from the kinetic analysis of EcP4 binding to TNP-ATP in the presence of Mg 2+ as they relate to a 3-step binding mechanism: k 1 E + S ES ET EP k 2 k 3 k -1 k -2 k -3 Parameter Value Standard Deviation K d kin (µm) k 2 (s -1 ) k -2 (s -1 ) 6 9 k 3 (s -1 ) 11 3 k -3 (s -1 ) FC ET FC EP Best Residual of the Norm
145 mixing of a large concentration of ATP with pre-formed complex of EcP4 and TNP-ATP in the presence of 20 mm Mg 2+. Fitting these data to a single exponential equation, I found k obs = 6.40 ± 0.05 s -1. Table 3-3 relates the observed kinetic parameters obtained from the kinetic analysis of EcP4 binding TNP-ATP to the rates constants for the individual steps in the three-step reaction mechanism. A major difference between the rate constants for the TmP4 binding mechanism and the EcP4 mechanism is that k 3 and k -3 in the EcP4 binding reaction have very similar magnitudes, whereas with TmP4, there was a 50-fold difference between these two rate constants. This observation suggests that at the completion of this TNP-ATP binding reaction, when TNP-ATP levels exceed the EcP4 concentration, similar concentrations of the second intermediate, ET, and the final product, EP, would exist. This differs from the situation described above for TmP4, where almost all of the TmP4:TNP-ATP complex is expected to be in the final complex (EP). TNP-ATP Binding Dynamics with CheA Dimers from T. maritima and E. coli. The experiments described above examined TNP-ATP interactions with the isolated P4 domain of CheA, which is monomeric. Full-length CheA dimers have two nucleotide binding sites that exhibit negative cooperativity [Chapter 2]. Thus, there was a possibility that examining TNP-ATP binding to CheA dimers could provide some insight into site to site interactions. Therefore, I used fluorescence-monitored TNP-ATP binding reactions to determine whether there were any qualitative/quantitative differences in the reaction kinetics with full-length CheA dimers compared to P4 monomers. First, I 127
146 monitored TNP-ATP binding to CheA dimers from T. maritima (TmA) at 4 C in buffer containing Mg 2+. Time courses obtained at a series of TNP-ATP concentrations were biphasic in a manner similar to that observed for binding reactions using TmP4. As above, I analyzed the fast phase separately from the slow phase. The fast phase of each time course fit well to a single exponential equation and defined the k obs value (Figure 3-13A). A plot of k obs versus TNP-ATP concentration showed the rate saturating at high concentrations of TNP-ATP (Figure 3-13B). The hyperbolic dependence of k obs on substrate concentration was characterized by k max = 1250 ± 270 s -1, K kin d = 80 ± 30 µm with a y-axis intercept of 20 ± 20 s -1. These kinetic parameters are comparable to those observed with TmP4. I then analyzed the slow phase from each time course, fitting each reaction to a single exponential equation to determine k obs (Figure 3-14A). These k obs values did not vary with substrate concentration (Figure 3-14B) and had an average k obs value of 7.9 ± 2.6 s -1, once again comparable to the observed rate constant from the TmP4 binding kinetics. The simplest reaction scheme to account for the observed kinetics from both the fast phase (the k obs values demonstrating a hyperbolic dependence on the substrate concentration) and the slow phase (no variation in k obs values observed over TNP-ATP concentration) suggests a three-step mechanism for TmA binding TNP-ATP. In summary, I observed very little difference between the reaction kinetics obtained for TmA versus TmP4, and I concluded that both the truncated version of T. maritima CheA as well as the dimer binds TNP-ATP in a minimum of three steps. One difference I did observe between TmA and TmP4 binding kinetics was the fluorescence intensity: the fluorescence increase observed for binding of TNP-ATP to 128

147 A B Figure Kinetic analysis of the fast phase from biphasic time courses obtained from TmA binding TNP-ATP. Time courses were recorded after rapidly mixing 1µM TmA with excess TNP-ATP in TEKMD buffer at 4 C. (A) The fast phase of each time course at various TNP-ATP concentrations was fit to a single exponential equation (black line) to obtain the following rate constants: 2 µm TNP-ATP (purple) with k obs = 46 ± 3 s -1, 4 µm TNP-ATP (green) with k obs = 78 ± 5 s -1, 15 µm TNP-ATP (blue) with k obs = 218 ± 30 s -1. Data were corrected as described in the Materials and Methods. The black circles represent a baseline of just TNP-ATP after correction for intrinsic fluorescence. (B) Effect of TNP-ATP concentration on the k obs value. The data were fit by a simple hyperbolic function with the following parameters: y-axis intercept = 20 ± 20 s -1, K d kin = 80 ± 30 µm, and k max = 1250 ± 270 s
 Full time courses at various TNP-ATP concentrations show the change in fluorescence when 1 µm TmA is rapidly mixed with 15 µm TNP- ATP (pink) or when 5 µm TmA is mixed with 30 µm (blue) or")
148 A B Figure 3-14: Kinetic analysis of the slow phase from biphasic time courses obtained from TmA binding TNP-ATP. (A-inset) Full time courses at various TNP-ATP concentrations show the change in fluorescence when 1 µm TmA is rapidly mixed with 15 µm TNP- ATP (pink) or when 5 µm TmA is mixed with 30 µm (blue) or 45 µm (red). The change appears consistent at each TNP-ATP concentration. Concentrations listed are after mixing. The data are offset for clarity. (A) The slow phase of the 30 µm TNP-ATP time course was isolated and fit to a single exponential equation (black line) with k obs = 9.3 ± 1.0 s -1. (B) Effect of TNP-ATP concentration on the k obs value from analyzing the slow phase portion of each time course at each TNP-ATP concentrations. The k obs values show no change over TNP-ATP concentration with a mean value of 7.9 ± 2.6 s
149 TmA was considerably lower than that observed with TmP4. For example, when 4 µm TNP-ATP was rapidly mixed with 1 µm TmP4, the reaction time course displayed a fluorescence change of 1.75 units (Figure 3-6A). This same reaction performed with TmA displayed a fluorescence change of only 0.25 units (note the reaction rates were comparable for these two reactions) (Figure 3-13A). I noted a similar difference in intensity at each time course at each TNP-ATP concentration. The diminished fluorescence change for TNP-ATP binding to CheA dimers made the data analysis of rapid time courses more difficult (less signal to monitor, so an increase in statistical error in the parameters I extracted from the kinetic data). The TNP-ATP binding kinetics for full-length E. coli CheA also suggested a three-step mechanism. Time courses at various TNP-ATP concentrations showed a biphasic ("up-down") change in fluorescence. The fast phase from each time course was fit to a single exponential equation, and the resulting observed rate constants were plotted versus TNP-ATP concentration (Figure 3-15). The k obs value was affected by substrate concentration and this relationship defined a hyperbolic dependence characterized by the following parameters: k max = 970 ± 360 s -1, K kin d = 75 ± 45 µm, and y-axis intercept = 9 ± 15 s -1. These parameters are comparable to those obtained with EcP4, though k max for EcA appears to be half as fast as that observed with EcP4. I analyzed the slow phase of each time course (Figure 3-16), fitting each to a single exponential. The observed rate constants were not affected by TNP-ATP concentration and exhibited an average k obs value of 12.4 ± 2.5 s -1, comparable to the rate constant observed with EcP4. Also, as observed for the TmP4/TmA reactions, EcA binding TNP-ATP produced a smaller 131

150 A B Figure 3-15: Kinetic analysis of the fast phase from biphasic time courses obtained from EcA binding TNP-ATP. Time courses were recorded after rapidly mixing 1µM EcA with excess TNP-ATP in TEKMD buffer at 4 C. (A) The fast phase of each time course at various TNP-ATP concentrations was fit to a single exponential equation (black line) to obtain the following rate constants: 2 µm TNP-ATP (purple) with k obs = 30.5 ± 0.8 s -1, 4 µm TNP-ATP (green) with k obs = 54.3 ± 1.6 s -1, 15 µm TNP-ATP (blue) with k obs = ± 15.9 s -1. Data were corrected as described in the Materials and Methods. The black circles represent a baseline of just TNP-ATP after correction for intrinsic fluorescence. (B) Effect of TNP-ATP concentration on the k obs value. The data were fit by a simple hyperbolic function with the following parameters: y-axis intercept = 9 ± 15 s -1, K d kin = 75 ± 45 µm, and k max = 970 ± 360 s
151 A B Figure 3-16: Kinetic analysis of the slow phase from biphasic time courses obtained from EcA binding TNP-ATP. (A-inset) Full time courses at various TNP-ATP concentrations show the change in fluorescence when 1 µm EcA is rapidly mixed with 15 µm TNP- ATP (pink) or when 5 µm EcA is mixed with 30 µm (blue) or 45 µm (red) TNP-ATP. The change appears consistent at each TNP-ATP concentration. Concentrations listed are after mixing. The data are offset for clarity. (A) The slow phase of the 30 µm TNP-ATP time course was isolated and fit to a single exponential equation (black line) with k obs = 15.2 ± 0.6 s -1. (B) Effect of TNP-ATP concentration on the k obs value from analyzing the slow phase portion of each time course at each TNP-ATP concentration. The k obs values show no change over TNP-ATP concentration and the mean is 12.4 ± 2.5 s
152 fluorescence signal change than that observed when EcP4 bound TNP-ATP. When 4 µm TNP-ATP was rapidly mixed with 1 µm EcP4, the reaction time course displayed a fluorescence change of 1.0 units (Figure 3-10). This same reaction performed with EcA displayed a fluorescence change of only 0.6 units (Figure 3-15). These results are also consistent with my previous observations based on equilibrium binding titrations of the CheA dimer [Chapter 2]. I monitored the kinetics of TNP-ATP dissociation from both TmA and EcA. When preformed CheA:TNP-ATP complex was shot against excess ATP, the k obs value for TmA was 0.22 ± 0.02 s -1 whereas k obs for EcA was 5.8 ± 0.5 s -1 (Figure 3-17). These observed rate constants were similar to those observed with TmP4 and EcP4. These rapid reaction experiments in this Results subsection followed the binding of two TNP-ATP molecules to dimeric CheA. Since TNP-ATP was present in excess over CheA, these experiments pushed the binding equilibrium so that at the end of the reaction both ATP binding sites on the CheA dimer were occupied in the final steadystate equilibrium mixture. Since I followed time courses leading up to steady-state, it is noteworthy that I did not see any evidence for two classes of binding sites (such as a high affinity/high fluorescence site and a low fluorescence/low affinity site). One possibility was that I would see CheA dimers with one TNP-ATP bound as a high fluorescence intermediate along the pathway to generating the fully bound dimer. Also, in the off-rate (dissociation) experiments, one possible outcome would have been observing a biphasic time course that would indicate two classes of binding sites. But I did not observe any such direct evidence of two distinct binding sites in CheA dimers. 134
153 A B Figure Kinetics of dissociation for TNP-ATP bound CheA dimers from either T. maritima or E. coli. Fluorescence stopped-flow measurements were performed to monitor the fluorescence emission intensity of TNP-ATP bound CheA dimers upon rapid mixing with excess ATP. The red circles represent the fluorescence change when a preequilibrated solution of 1 µm TNP-ATP and 10 µm TmA (A) or EcA (B) was rapidly mixed with 50 mm ATP in TEKMD buffer at 4 C (concentrations listed are after mixing). The black circles represent the baseline when 1 µm TNP-ATP was mixed with 50 mm ATP and takes into account the small fluorescence signal arising from the protein sample. The displayed time courses represent an average of 7-10 successive shots. The data were fit by a single exponential equation with a k obs value of ± s -1 (TmA) and 6.40 ± 0.03 s -1 (EcA). Dissociation experiments performed at 25 mm and 50 mm ATP gave equivalent results. The k obs values at 25 mm ATP were ± s -1 (TmA) and 5.30 ± 0.02 s -1 (EcA). 135
154 Globally Fitting Kinetic Data. The goal of the graphical analysis described above, was to determine the number of kinetic steps involved in the TNP-ATP binding mechanism as well as to define approximate values of the rate constants for those steps. From this analysis, I was able to determine that both the T. maritima CheA and E. coli CheA proteins bind TNP-ATP in a minimal three-step reaction mechanism. I extracted parameters from the kinetic analysis (Table 3-2 for TmP4 and Table 3-3 for EcP4) and applied these parameters as rate constants to the individual steps in this three-step mechanism. Using the mathematical software, MATLAB, I was able to simulate an experiment consisting of a series of rapid binding reactions between CheA and TNP-ATP at various TNP-ATP concentrations. I used the rate constants from the graphical analysis in the proposed three-step mechanism for an initial simulation. If the rate constants obtained from the graphical analysis were close to the actual values, then the simulated curves (time courses) should have closely followed the experimental data. I performed a simulation for TmP4 binding TNP-ATP using the proposed rate constants and the proposed three-step mechanism and compared that simulation to the experimental data (Figure 3-18). The simulated curves corresponding to the highest TNP-ATP concentrations followed the experimental data fairly well, but the curves for experiments with lower TNP-ATP concentrations differed noticeably from the experimental data. The "goodness of fit" can be quantified as the sum of squares of the residuals (i.e., the best residuals of the norm or best_r), where residuals are estimates of experimental error computed as the difference between the simulated data and the experimental data 136
155 Fluorescence > 515nm (arbitrary units) Time (seconds) Figure Comparison of a set of simulated reaction curves to the experimental time courses for TmP4 binding TNP-ATP. Experimental time courses were taken from the TmP4 binding reactions in Figures 3-6, 3-7; 1 µm TmP4 rapidly mixed with 2 µm (purple), 4 µm (green), 8 µm (pink), 15 µm (blue), and 30 µm (red) TNP-ATP. All five time courses were collected at the same PMT voltage (900) and the data were corrected as described in the Materials and Methods. The black lines are reaction curves simulated by MATLAB assuming a three-step mechanism (mech. 3-3) with rate constants and fluorescence coefficients from Table 3-2. The best_r for this simulation is equal to 70. If there was no difference between experimental and simulated data, the best residual would be equal to
156 [84]. A lower best_r value represents a better fit [71, 130]. For the simulation comparison in Figure 3-18, the best_r value is 70 (this statistic is presented in Table 3-2 with the rate constants estimated from the graphical analysis). The discrepancy between the simulated curves and experimental data may arise from some of the assumptions that are inherent to the process of extracting rate constants from the graphical analysis. These assumptions are further explored in the Discussion section. My goal was to use MATLAB, and a numerical approach (thereby bypassing most of these assumptions) to: (1) test and confirm the three-step binding mechanism, and (2) refine the rate constants for the individual reaction steps so that the simulated curves more accurately followed the experimental data. In order to fit the experimental data using the MATLAB program, I modified a script originally developed by Dr. Smita Patel [130, presented in Appendix B]. In my modified script, a system of differential equations mathematically described the threestep TNP-ATP binding mechanism. An ordinary differential equations solver (ODE15s), supplied by MATLAB, solved this system of equations and calculated the change in fluorescence according to the following equation; f = a* ET + b*ep (eq. 3-5) where ET is the second complex intermediate, EP is the final complex product (refer to mech. 3-3), and 'a' and 'b' are fluorescence coefficients for each complex. MATLAB was able to fit all the time courses for a concentration series simultaneously according to the three-step mechanism. Below, I refer to this simultaneous fitting as an "optimization." Optimizations can be performed on a dataset in order to find rate constants that provide 138
157 the best fit. The script begins by randomizing the starting values for the rate constants and continues to refine these rate constants until the program finds the best fit as determined by least squares regression. The optimization terminates when the rate constants change by less than 0.01%. In order to test the binding mechanism and refine the rate constants, I found it informative to fit both association and dissociation experiments for TmP4. Below I refer to this type of analysis as a "global" analysis. I found it important to analyze multiple types of kinetic experiments (i.e., association and dissociation experiments) in order to find the most accurate rate constants. If a set of rate constants can simulate curves that mimic the association experiments yet do a poor job of mimicking the dissociation experiments, then a problem exists in either the magnitude of the rate constants or the mechanism itself. My goal was to identify a set of rate constants that could be used to simulate both the association and dissociation experiments accurately. The first step in my global analysis was to fit the kinetic data from the TmP4 + TNP-ATP association reaction (Figure 3-19). My only assumptions in this initial attempt were: (1) that the binding mechanism had three consecutive reversible steps; and (2) that the ES complex was 'spectrally silent' (made no contribution to the observed change in TNP-ATP fluorescence). I did not impose any sort of 'restraints' on the 6 rate constants, nor on the fluorescence coefficients of the ET and EP complexes. Two independent experimental datasets (Dataset I and Dataset II) were optimized, and the final rate constants for each step are presented in Table 3-4. An important general observation from this initial optimization is that the program found rate constants that produced a 'fit' 139
158 Fluorescence > 515nm (arbitrary units) Time (seconds) Figure Optimization performed by MATLAB on the experimental data from TmP4 binding to TNP-ATP. The time courses from TmP4 binding TNP-ATP were fit using the script in Appendix B-1. The TNP-ATP concentrations for each time course were described in Figure This optimization required the assumption that TNP-ATP binding occurs in a three-step mechanism (mech. 3-3). The program "found" values for all six rate constants as well as fluorescence coefficients for ET and EP (see Table 3-4). The best_r value was 3.5 for this fit, considerably better than the previously estimated value of 70. Twenty-four optimization cycles were computed for these results. 140
159 Table 3-4 Kinetic parameters for TNP-ATP binding to TmP4 as optimized by MATLAB. These parameters assume a three-step mechanism. Parameters are displayed for two independent datasets. Twenty-four optimization cycles were computed for these results. TmP4 Dataset I TmP4 Dataset II Parameter Value S.D. Parameter Value S.D. k 1 (µm -1 s -1 ) k k - 1 (s -1 ) 13,907 16,747 k -1 13,252 16,193 k 2 (s -1 ) 2, k 2 1, k -2 (s -1 ) k k 3 (s -1 ) k k -3 (s -1 ) k FC ET FC ET FC EP FC EP Best Residual of the Norm 3.0 Best Residual of the Norm
160 that was dramatically better than the initial simulation in Figure 3-18 (which used rate constants extracted from the graphical analysis). This improved fit had a best_r value (3.0 for Dataset I and 3.5 for Dataset II) that was considerably lower than the r value (70) obtained using the graphically determined rate constants. The optimization found fluorescence coefficients similar to those resulting from the graphical analysis. Also, the optimization of Datasets I and II generated comparable values for k 1 and k -1, although these values have large errors associated with them. Interestingly, the ratio of these estimated values (k -1 /k 1 ) predicts a K d of 80 µm for the ES complex, a value that is comparable to the K kin d from the graphical analysis (105 µm). The rate constants for k 2, k -2, and k 3 from both Dataset I and II are close to those defined by graphical analysis, but the MATLAB estimates predict a somewhat faster rate of ES to ET conversion (k 2 ) and a slower rate for the reverse of this step (k -2 ). For one rate constant (k -3 ), however, the MATLAB estimate (0.03 s -1 ) was 10-fold slower than that determined from fitting the dissociation experiment using the graphical analysis (0.2 s -1 ). So far, my MATLAB analysis has focused exclusively on the association reaction kinetics. The next step in my global analysis was to use the rate constants from this MATLAB optimization (Table 3-4) to simulate the time course of a dissociation reaction for the TmP4:TNP-ATP complex. In order to simulate this reaction, MATLAB required input of a hypothetical reaction scheme. For these dissociation experiments, unmodified ATP was used to "trap" the binding site as soon as TNP-ATP dissociates. The mechanism describing this situation is presented in mech. 3-4; 142
161 k -3 k -2 k -1 EP ET E S E + S k 3 k 2 k 1 E + ATP k f E.ATP k r (mech. 3-4) The top line in this scheme is just the reverse of mechanism 3-3. In the second line of this reaction scheme, once the TmP4:TNP-ATP complex has dissociated into TmP4 and TNP-ATP, TmP4 immediately reacts with ATP to form TmP4:ATP. The large excess of ATP available for this step makes it essentially non-reversible and very rapid compared to the preceding steps. In order to simplify the mechanism in the MATLAB script, I eliminated this second equation and made the dissociation of the ES complex into E and S substrates non-reversible: k -3 k -2 k 3 k 2 k -1 EP ET E S E + S (mech. 3-5) The simulated dissociation time course (using Table 3-4 rate constants) did not accurately mimic the experimental results (Figure 3-20). By changing the magnitudes of k 1 thru k -3, and repeating these simulations, I found that if k -3 was closer to our previous estimate of 0.2 s -1, the simulation would more closely match the experimental dissociation data. I modified the MATLAB script to hold k 1, k -1, k 2, k -2, and k 3 constant and allowed the fitting routine to optimize k -3. This approach generated an estimate of k -3 = ± s -1 (Figure 3-21). This result suggests that in our graphical analysis it may have been naïve to assign the observed rate of dissociation to a single rate-limiting step in the binding reaction. Rather, in the reaction mechanism, the slowest step may be 143
162 Fluorescence > 515nm (arbitrary units) Time (seconds) Figure MATLAB Simulation of the hypothetical dissociation of the TmP4:TNP- ATP complex. The black curve is a simulation of the fluorescence emission changes from the dissociation of a hypothetical TmP4:TNP-ATP complex using the rate constants from Table 3-4 and using a modified version of the script in Appendix B-2 (modify to simulate only, not fit the data). The red circles are the data originally presented in Figure 3-8. Data have been corrected as described in the Materials and Methods. This simulation used the assumption that the TmP4:TNP-ATP complex dissociates in a threestep mechanism (mech. 3-5). 144
163 Fluorescence > 515nm (arbitrary units) Time (seconds) Figure Fitting optimization performed by MATLAB on the dissociation data for TmP4:TNP-ATP. The data originally presented in Figure 3-8 were fit by MATLAB using the script in Appendix B-2. The black line represents the fit from the MATLAB optimization. This optimization required the assumption that the TmP4:TNP-ATP complex dissociates in a three-step mechanism (mech. 3-5). For this optimization, k -1, k 2, k -2, and k 3 from Table 3-4, Dataset I, were held constant and the program "found" the value for k -3 as ± s -1. Using rate constants from Dataset II, the program "found" k -3 = ± s -1. The best _r for both fits was 0.1. Seventeen optimization cycles were computed for these results. Data were corrected as described in the Materials and Methods. 145
164 0.8 s -1 but the overall rate of dissociation (0.2 s -1 ) is slower than this because it also includes other steps. By performing multiple simulations, I found that simulations of the dissociation time courses were very sensitive to the magnitude of k -3, but the values of the other rate constants had only minor effects. The next question I addressed was whether MATLAB simulations of association kinetics could accommodate the k -3 value generated by the analysis of the dissociation reaction discussed above. Table 3-5 summarizes the best parameters generated by MATLAB optimization when k -3 was held constant (at 0.8 s -1 ) and the remaining five rate constants were allowed to vary. Figure 3-22 shows the time courses generated by MATLAB using this optimized set of rate constants. The overall agreement between the simulations and the data (by visible inspection and reflected by the low best_r value) indicate that a k -3 value of 0.8 s -1 could certainly be accommodated without creating problems in fitting the association kinetics. In this final set of globally optimized rate constants, there are several details worth noting. First, it is possible to use these rate constants to calculate an overall predicted K d for the entire three-step binding equilibrium [K d = (k -1 k -2 k -3 )/(k 1 k 2 k 3 )]. This calculation predicts a value of ~ µm, which is not far off from the estimated K d value of ~ 0.01 µm derived from analysis of equilibrium binding experiments [Chapter 2]. Second, it is interesting to note that the optimized k -1 value is significantly larger than the estimated value for k 2. This is important because it is the defining feature of a 'rapid equilibrium' reaction (k -1 >> k 2 ). Unfortunately, the standard deviations for the k 1 and k -1 values are very large, so it is not possible to firmly conclude that rapid equilibrium 146

165 Fluorescence > 515nm (arbitrary units) Fluorescence > 515nm (arbitrary units) Time (seconds) Time (seconds) Figure Final optimization performed by MATLAB on the association binding data for TNP-ATP and TmP4. This optimization used the script in Appendix B, keeping k -3, FC ET, and FC EP from Dataset II constant. The program "found" values for the remaining rate constants to give the best fit. Two independent experimental datasets were optimized and the refined parameters for each dataset are presented in Table 3-5. The best_r for this refined optimization was considerably lower than in my initial simulation (~ 4 vs 70). Eight optimization cycles were computed for these results. 147
166 Table 3-5 Refined kinetic parameters for TmP4 binding TNP-ATP as optimized by MATLAB. These parameters are the result of the fitting in Figure The rate constant for k -3 as well as the values for FC ET and FC EP were held constant while the program refined the remaining rate constants. Parameters are displayed for two independent datasets. Eight optimization cycles were computed for these results. TmP4 Dataset I TmP4 Dataset II Parameter Value S.D. Parameter Value S.D. k 1 (µm -1 s -1 ) k k -1 (s -1 ) 9,710 9,224 k -1 16,668 27,374 k 2 (s -1 ) 1, k 2 2, k -2 (s -1 ) k k 3 (s -1 ) k k -3 (s -1 ) 0.8 Hold k Hold FC ET Hold FC ET Hold FC EP Hold FC EP Hold Best Residual of the Norm 3.8 Best Residual of the Norm
167 conditions apply. However, despite the high standard deviations, the k 1 and k -1 values from analysis of Dataset I and Dataset II are not very different, and for both datasets the ratio of k -1 /k 1 is close to a value of 80 µm, which is comparable to the K kin d value defined in my initial graphical analysis (100 µm). This agreement lends support to the idea that the TNP-ATP binding reaction is a 'rapid equilibrium' type of mechanism. I performed a similar global analysis with the kinetic data from EcP4 binding TNP-ATP. The rate constants from the graphical analysis (Table 3-3) were used to simulate a series of rapid binding reactions between EcP4 and TNP-ATP at various concentrations. Comparing these simulated time courses to the experimental data indicated that, at lower TNP-ATP concentrations, the simulated time courses did not adequately describe the experimental data (Figure 3-23), and the best_r for this simulation was 9.5 (Table 3-3). Although this 'r' value was considerably lower than that reported for the initial TmP4 fits (best_r value ~ 70), it is important to emphasize that this difference is influenced by my using a smaller data set for the EcP4 analysis (four TNP- ATP concentrations for EcP4 but five TNP-ATP concentrations for TmP4). In the first step of the global analysis, I performed an optimization to improve the fit of the experimental data by refining all 6 rate constants and both fluorescence coefficients (Figure 3-24). The parameters for optimizations of two independent experimental datasets are reported in Table 3-6. The optimization improved the fit as seen "by eye" and as indicated by the lower best_r value ( ). For the second step of the EcP4 global analysis, I used these refined rate constants to simulate a dissociation time course. Initially, I used the same reaction mechanism as 149
168 Fluorescence > 515nm (arbitrary units) Time (seconds) Figure Comparison of a set of simulated reaction curves to the experimental time courses for EcP4 binding TNP-ATP. Experimental time courses were taken from the EcP4 binding reaction in Figures 3-10, 3-11; 1 µm EcP4 rapidly mixed with 2 µm (purple), 4 µm (green), 8 µm (blue), and 15 µm (red) TNP-ATP. All four time courses were collected at the same PMT voltage (900) and the data were corrected as described in the Materials and Methods. The black lines are reaction curves simulated by MATLAB assuming a three-step mechanism (mech. 3-3) and rate constants and fluorescence coefficients from Table 3-3. The best_r for this simulation is equal to
169 Fluorescence > 515nm (arbitrary units) Time (seconds) Figure Optimization performed by MATLAB on the experimental data from EcP4 binding to TNP-ATP. The time courses from EcP4 binding TNP-ATP were fit using the script in Appendix B-1. The TNP-ATP concentrations for each time course were described in Figure This optimization required the assumption that TNP-ATP binding occurs in a three-step mechanism (mech. 3-2). The program "found" values for all six rate constants as well as fluorescence coefficients for ET and EP (see Table 3-6). The best_r for this fit was close to 2, better than the previously estimated value of 9. Seven optimization cycles were computed for these results. 151
170 Table 3-6 Kinetic parameters for EcP4 binding TNP-ATP as optimized by MATLAB. These parameters assume a three-step mechanism. Parameters are displayed for two independent datasets. Seven optimization cycles were computed for these results. EcP4 Dataset I EcP4 Dataset II Parameter Value S.D. Parameter Value S.D. k 1 (µm -1 s -1 ) k k -1 (s -1 ) 7,507 8,071 k -1 11,314 16,352 k 2 (s -1 ) k 2 1, k -2 (s -1 ) k k 3 (s -1 ) k k -3 (s -1 ) k FC ET FC ET FC EP FC EP Best Residual of the Norm 1.7 Best Residual of the Norm
171 presented for TmP4 (mech. 3-5), however the simulation did not accurately describe the experimental results. I noticed that the graphically-defined dissociation rate constant was equal to 7 s -1 whereas, both k -2 and k -3 were optimized at values considerably less than 7 (k -2 = 0.5, k -3 = 0.9; Dataset II) as show in Table 3-6. Therefore, I fit the dissociation data "floating" k -2 and k -3, but when I used these refined rate constants in step 3 of the global analysis, the fits were poor (Refer to Materials and Methods for step descriptions). Interestingly, if I fit the dissociation data to a two-step mechanism (mech. 3-6) and floated k -2 and k -3 (Figure 3-25, Table 3-7), the refined rate constants for these two steps allowed me to proceed with step 3 of my global analysis. k -3 EP ET E + T k 3 k -2 (mech. 3-6) I explore the significance of these two different mechanisms in the fitting routines for both EcP4 and TmP4 in Appendix C. The final step in my global analysis of the EcP4 binding data was to optimize a fit of the association data holding k 2, k -2, k 3, k -3, and both fluorescence coefficients constant. Since the magnitudes for k -2, k 3, k -3 are very close to each other, the best fits using the MATLAB program required holding all four values constant (see Appendix C). The optimization is presented in Figure 3-26 and the parameters for both datasets are presented in Table 3-8. Overall, the best_r has decreased compared to my initial simulation and visually, the fit follows the experimental data. Using these rate constants, I calculated an overall predicted K d for the binding equilibrium [K d = (k -1 k -2 k -3 )/(k 1 k 2 k 3 )]. 153
172 Fluorescence > 515nm (arbitrary units) Time (seconds) Figure Fitting optimization performed by MATLAB on the dissociation data for EcP4:TNP-ATP. The data originally presented in Figure 3-12 were fit by MATLAB using the script in Appendix B-2. The black line represents the fit from the MATLAB optimization. This optimization required the assumption that EcP4:TNP-ATP complex dissociates in a two-step mechanism (mech. 3-5). For the above optimization, k 3 from Table 3-6 Dataset I, was held constant and the program "found" values for k -2 and k -3. The optimization results for both Dataset I and II are presented in Table 3-7. Nine optimization cycles were computed for these results. Data were corrected as described in the Materials and Methods. 154
173 Table 3-7 Kinetic parameters for the dissociation of EcP4:TNP-ATP complex as optimized by MATLAB. These parameters assume a two-step dissociation mechanism. Parameters are displayed for two independent datasets. Nine optimization cycles were computed for these results. EcP4 Dataset I EcP4 Dataset II Parameter Value S.D. Parameter Value S.D. k -2 (s -1 ) k k -3 (s -1 ) k Best Residual of the Norm 0.2 Best Residual of the Norm

174 Fluorescence > 515nm (arbitrary units) Fluorescence > 515nm (arbitrary units) Time (seconds) Time (seconds) Figure Final optimization performed by MATLAB on the association binding data for TNP-ATP and EcP4. This optimization used the script in Appendix B-3, keeping k 2, k -2, k 3, k -3, FC ET,and FC EP from Dataset I constant. The program "found" values for k 1 and k -1 to give the best fit. Two independent experimental datasets were optimized and the refined parameters for each dataset are presented in Table 3-8. The best_r for this refined optimization was lower than in my initial simulation (5 versus 9.5). Ten optimization cycles were computed for these results. 156
175 Table 3-8 Refined kinetic parameters for EcP4 binding TNP-ATP as optimized by MATLAB. These parameters are the result of the fitting in Figure The rate constants for k 2, k -2, k 3, k -3, as well as FC ET,and FC EP were held constant while the program refined k 1 and k -1. Parameters are displayed for two independent datasets. Ten optimization cycles were computed for these results. EcP4 Dataset I EcP4 Dataset II Parameter Value S.D. Parameter Value S.D. k 1 (µm -1 s -1 ) k k -1 (s -1 ) k k 2 (s -1 ) 608 Hold k 2 1,119 Hold k -2 (s -1 ) 21.3 Hold k Hold k 3 (s -1 ) 12.5 Hold k Hold k -3 (s -1 ) 11.9 Hold k Hold FC ET Hold FC ET Hold FC EP Hold FC EP Hold Best Residual of the Norm 5.0 Best Residual of the Norm
176 The calculated value of µm is comparable to the K d value indicated by equilibrium binding experiments (K d ~ 0.2 µm) [Chapter 2]. 158
177 DISCUSSION Previous investigations of ATP binding to CheA exploited a fluorescent reporter group introduced at the active site (CheA F455W ). Those studies indicated a simple one-step equilibrium for the binding reaction in the absence of Mg 2+ (Figure 3-27A): CheA + ATP k 1 k -1 CheA : ATP (mech. 3-7) In the presence of Mg 2+, the minimal reaction scheme that could account for the observed kinetics was more complicated, involving two reversible steps (Figure 3-27B): k 1 CheA + Mg 2+ -ATP CheA : Mg 2+ -ATP (CheA : Mg 2+ -ATP)* k 2 k -1 k -2 (mech. 3-8) These mechanisms provide a framework for discussing the mechanism that underlies binding of TNP-ATP to CheA. In this Discussion, I will attempt to answer three questions about the TNP-ATP mechanism. First, I will compare my results for TNP-ATP binding to the two reaction schemes shown above with the goal of answering the question: Is the binding mechanism for association of this potent CheA inhibitor essentially the same as that observed with unmodified ATP, or are there significant differences? Next, I will compare the no-mg 2+ mechanism and the plus-mg 2+ mechanism for TNP-ATP binding to address the question: What aspect(s) of TNP-ATP binding does Mg 2+ influence? Finally, I will conclude this discussion by making some general comments about the two approaches I used for analyzing my results (graphical versus global numerical fitting) to address the question: What are the strengths and weaknesses 159
178 of these two approaches? In discussing the first two questions listed above, it will be useful to consider what may be taking place at the CheA active site during specific steps in the binding mechanism, so I will consider how my findings relate to the active site structure revealed in the crystal structure of TmP4:TNP-ATP complex (Figure 2-2) [18]. Comparing TNP-ATP and ATP: The Binding Mechanisms in the Absence of Mg 2+. My results support the conclusion that CheA binds TNP-ATP with a two-step mechanism in the absence of Mg 2+. This differs from the one-step mechanism utilized by CheA when it binds 'normal' ATP in the absence of Mg 2+ [154]. It is attractive to consider the possibility that the TNP-ATP mechanism just adds one more step to the basic ATP binding mechanism (Figure 3-27A versus 3-28A). In this scenario (summarized in Figure 3-28A), the ATP part of TNP-ATP would bind to the active site first, followed by an additional step to position the TNP portion into a hydrophobic pocket adjacent to the ATP binding site; this second step would generate a fluorescence change because it places the trinitrophenyl ring in a hydrophobic environment. My results provide some support for this relatively simple model. If the first step of the TNP-ATP binding mechanism does, in fact, reflect binding interactions involving the ATP segment of TNP- ATP, then the affinity of this interaction should match that of a bona fide CheA:ATP complex. Unfortunately, the numbers that would allow me to directly test this simple prediction are not immediately available, but I can infer these values by making a few assumptions. Consider first the affinity (K d of ~ 8 µm) of the ES complex formed in the 160
179 TNP-ATP binding reaction (Figure 3-1). The K d kin value for this two-step reaction scheme (mech. 3-9): k 1 CheA + TNP-ATP CheA:TNP-ATP (CheA:TNP-ATP)* k -1 k 2 (mech. 3-9) should be defined by the following relationship: K d kin k -1 + k 2 k 1 (eq. 3-6) If k -1 >> k 2, then this expression reduces to K kin d = k -1 /k 1. This is the definition of a 'rapid equilibrium' situation, and if it applies here, then my K kin d value provides an estimate of the affinity of the ES complex. Now, how does this compare to the K d of the P4:ATP complex, measured, for example, by equilibrium binding titrations? Here again, I have to make a few assumptions to come up with a number. Bilwes et al. measured a K d value of 14 ± 5 µm for the TmP4:ATP complex, but there are two complications: the experiment was performed in the presence of Mg 2+ (which would be expected to decrease K d from the value in the absence of Mg 2+ ) and it was performed at 25 C (which could be expected to increase K d relative to the 4 C value that I need to make my comparison). If I use the effects of Mg 2+ and temperature on E. coli CheA:ATP complex as a guide [154], these two competing effects would essentially negate one another, and so I would predict a K d of 15 µm for the TmP4:ATP complex at 4 C in the absence of Mg 2+. This is intriguingly close to my kinetically defined K d value of 8 µm for the ES complex in the TNP-ATP binding reaction. In theory, similar comparisons (between K kin d for the ES complex and the K d determined from equilibrium binding titrations) for EcP4 could also 161
180 be informative in testing the two-step model for P4 binding TNP-ATP in the absence of Mg 2+, but unfortunately my results did not define a K kin d for the E. coli ES complex (the observed rate did not exhibit saturation kinetics over the accessible concentration range. I would have predicted a K d of ~ 1 mm based on the affinity of CheA for ATP [180]). Nonetheless, the results with TmP4 do provide some support for the model depicted in Figure 3-28A. In assessing this model, it also is interesting to consider the question: Why does TNP-ATP bind with an affinity that exceeds that of regular ATP by a factor of greater than 1,000? Presumably, this involves binding contacts between the protein and the trinitrophenyl portion of TNP-ATP. In the model of Figure 3-28A, I estimated a k 2 value of ~ 1,000 s -1 and a k -2 value of 0.6 s -1 (Table 3-1) for the interconversion of the ES and EP complex with TmP4. The ratio of these values (1,700) could account for the overall increased affinity of TNP-ATP for CheA. In other words, the second step in this model (the step that gives rise to the large change in TNP fluorescence) is very fast, as one might expect for a step that involves simply shifting the position of the trinitrophenyl ring within the binding site (a step taking place after the diffusion-limited entry of the ligand into the active site), and this would generate new binding contacts that account for the increased affinity of TNP-ATP (relative to ATP). The reverse of this step (k -2 ) is slow (as might be expected for a step that involves breaking numerous contacts that contribute to the overall high affinity). 162
181 Comparing TNP-ATP and ATP: The Binding Mechanisms in the Presence of Mg 2+. For the TNP-ATP binding reaction in the presence of Mg 2+, the minimal reaction scheme that could account for my observations involved three consecutive steps. What is happening during these three steps? A useful starting point here is to consider first the binding reaction for regular ATP. In the presence of Mg 2+, this involves rapid formation of a low-affinity CheA:ATP complex followed by a second step in which the ATP-lid region of the protein and Mg 2+ interact with the polyphosphate groups of ATP to generate a higher-affinity complex. So, by analogy, perhaps the TNP-ATP binding reaction would involve two rapid binding steps that do not involve Mg 2+ followed by a third step in which Mg 2+ does play a key role. In other words, the first two steps of the plus-mg 2+ mechanism would essentially be the same as the two steps of the no-mg 2+ TNP-ATP binding mechanism. However, on closer inspection, this idea is not supported by my results. Specifically, I observed that the K kin d for this first step of the plus-mg 2+ reaction is 85 ± 25 µm, which is significantly greater than my estimated K d (8 µm) for the ES complex in the no- Mg 2+ TNP-ATP binding mechanism. In theory, one could account for an increase in K kin d if Mg 2+ caused a large (~ 10-fold) increase in k 2 (mech. 3-9) as required by the expression (eq. 3-6): K d kin k -1 + k 2 k 1 However, the k 2 (k max ) values for TmP4 binding TNP-ATP both in the presence and absence of Mg 2+ are similar (a 2-fold difference at most). These results support the idea that Mg 2+ influences the first step of the TNP-ATP binding reaction as well as introduces 163
182 a third step. Thus, overall, there does not appear to be a simple relationship between the no-mg 2+ and plus-mg 2+ TNP-ATP binding mechanisms. Mg 2+ does more than just create an additional step. Moreover, in comparing the plus-mg 2+ binding mechanisms for regular ATP and TNP-ATP, there does not appear to be a simple relationship in that the TNP-ATP mechanism does not have clearly defined steps involving primarily the ATP segment of the molecule followed by steps involving the TNP portion. The possible effects of Mg 2+ at the molecular level are considered below. How Does Mg 2+ Affect TNP-ATP Binding Kinetics? The ability of Mg 2+ to influence the kinetics of TNP-ATP binding was surprising for two reasons: (1) in the TmP4:TNP-ATP complex analyzed by Bilwes et al. [18], there is no Mg 2+ (i.e., no electron density attributable to Mg 2+ ), although the crystallization conditions certainly did include Mg 2+, (2) Mg 2+ has no significant effect on the overall affinity of CheA for TNP-ATP [69, 160, Figure 2-16]. Yet Mg 2+ clearly affected the binding kinetics in my experiments. Specifically, Mg 2+ affected the affinity of the ES complex and gave rise to an additional step in the binding mechanism. So what could Mg 2+ be doing at a molecular level that could account for all these observations? Below, I first offer some possible ways that Mg 2+ could interact with the ATP portion of TNP-ATP to affect binding kinetics (without influencing the overall affinity). Then I will turn my attention to how Mg 2+ might influence the TNP portion of this ligand to alter the reaction mechanism. For both possibilities, I will focus my discussion on how the proposed Mg 2+ -ligand interactions could account for two key observations: (1) Mg 2+ decreases the affinity of the ES 164
183 complex; and (2) Mg 2+ expands the TNP-ATP binding mechanism from two steps to three. Interactions between the polyphosphate groups of ATP and Mg 2+ (and similar divalent metal ions) are well characterized [18, 119, 154], and for many kinases, such interactions involve Mg 2+ serving as a bridging ligand that tethers the phosphates to specific active site groups. In CheA (and related members of the GHL superfamily), Mg 2+ forms bridges between the polyphosphates and a conserved Asn side chain (N409 in T. maritima CheA) [18]. In addition, in TmP4:nucleotide complexes (ADP, ADPNP, and ADPCP), two positions of the Mg 2+ coordination sphere are occupied by water molecules that form hydrogen bonds with active site side chains (H405 and R408). Another important contact in CheA involving the phosphates is a hydrogen bond between H413 and the ß-phosphate of these bound nucleotides. Additional contacts between CheA side chains and the ribose and adenine rings of these nucleotides also support binding: interactions with the adenine rings involve a hydrophobic surface formed by side chains extending from a ß-sheet region as well as a hydrogen-bond between the adenine amino group and the side chain of D449. One striking feature of the TmP4:TNP-ATP complex is that most of these binding contacts (observed in P4 complexes with Mg 2+ - ADP, Mg 2+ -ADPCP, and Mg 2+ -ADPNP) are absent. Their absence results from the conformation adopted by the TNP-ATP molecule when it binds to CheA, a conformation that differs significantly from that adopted by other bound nucleotides. In particular, the different conformation of the ribose component of TNP-ATP changes the relative positions of the polyphosphates, ribose, and adenine components. This conformation 165
184 allows the trinitrophenyl part of TNP-ATP to interact extensively with a hydrophobic binding pocket adjacent to the ATP-binding site, but it also positions the polyphosphate groups so that they point away from the ATP-binding site. As a result, most of the binding contacts with the polyphosphate region of the nucleotides are lost (only the H- bond between H413 and the ß-phosphate remains), although the altered conformation does still allow near-normal contacts between the active site and the adenine rings of TNP-ATP. In this light, it is interesting to speculate that Mg 2+ might initially interact with the polyphosphate groups of TNP-ATP in ways that mimic the 'normal' interactions seen with ADP, ADPCP, and ADPNP. These interactions would promote (temporarily) at least some of the normal ATP-like binding interactions with the CheA active site, but they would hinder formation of the nucleotide/protein conformation that ultimately enables very tight binding of the TNP portion of the ligand. This situation would create a kind of molecular 'tug-of-war' in which contacts that, for normal ATP, would promote binding, but that for TNP-ATP would actually diminish the overall affinity of the complex. The proposed Mg 2+ interaction with the polyphosphate groups of TNP-ATP would account for the Mg 2+ -effect on K kin d (increasing it from 8 to 80 µm) for the first step of the three-step binding mechanism (which generates ES). The other major effect of Mg 2+ was to introduce an additional step into the binding mechanism. How might Mg 2+ -polyphosphate interaction account for this? Here, it is important to remember the final structure of the CheA:TNP-ATP complex does not appear to include a tightly bound Mg 2+. So perhaps, this third step reflects dissociation of Mg 2+ from this complex (ET), an event that could effectively put an end to the molecular 166
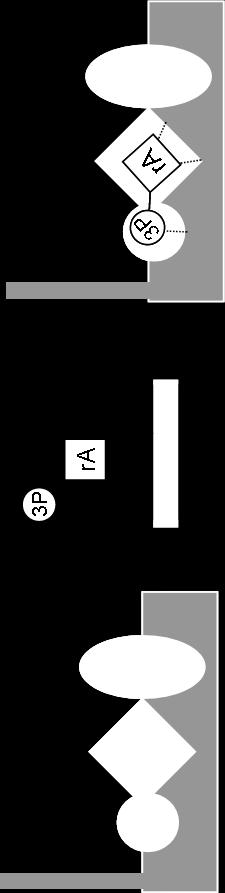

185 A B 167
186 Figure Schematic diagram of the CheA active site depicting the mechanism of CheA binding ATP in the absence and presence of Mg 2+. (A) In the absence of Mg 2+, CheA F455W binds ATP with a simple, one-step reversible mechanism. ra denotes the ribose/adenine portion of ATP, whereas 3P represents the polyphosphates. Grey boxes represent the CheA active site. (B) In the presence of Mg 2+, CheA binds ATP in twosteps. The data suggests a reaction mechanism with the first step of this two-step mechanism similar to the one-step ATP binding mechanism observed in the absence of Mg 2+ (a spectrally silent, low affinity step). The second step of this two-step mechanism is Mg 2+ -dependent, has higher affinity, and results in an increase in fluorescence (denoted by the green color). This increase in fluorescence has been attributed to a conformational change where the ATP lid region closes on top of the bound nucleotide facilitating catalysis [Adapted from information presented in (154)] 168
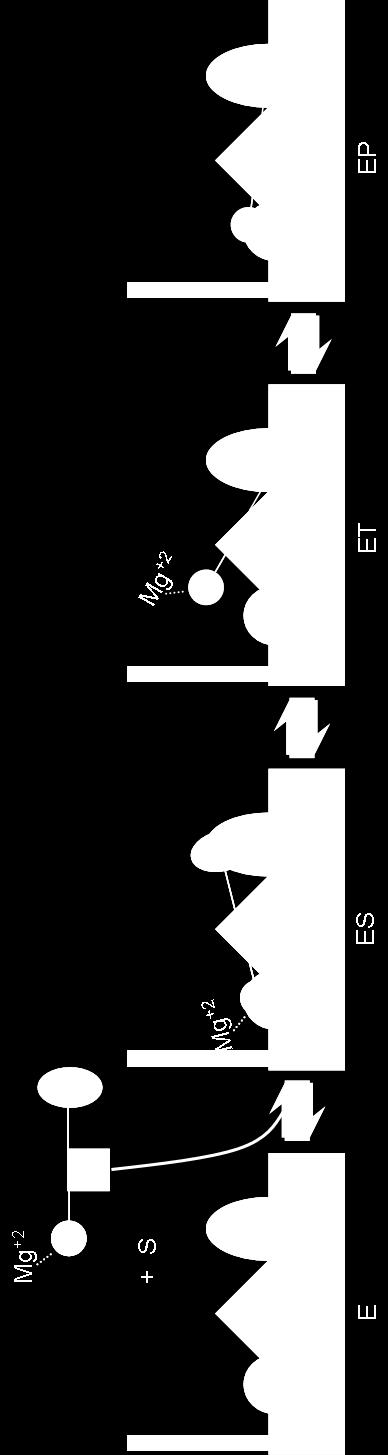
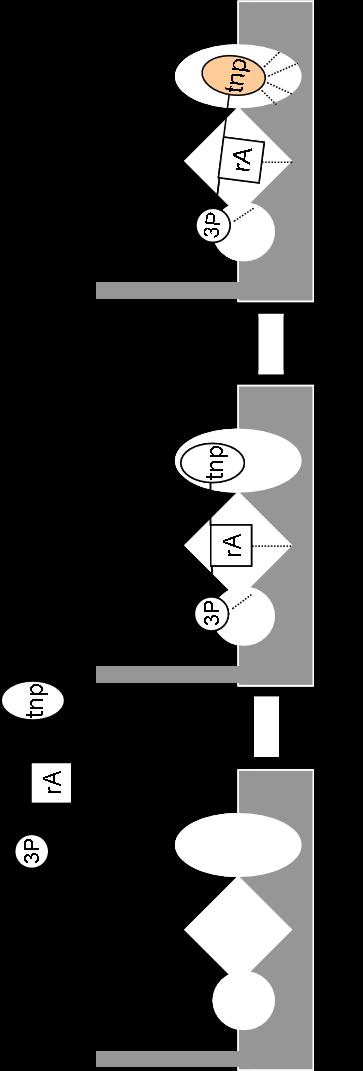
187 A B 169
188 C 170
189 Figure Model of the CheA active site depicting possible ways TNP-ATP binds in the absence and presence of Mg 2+. (A) In the absence of Mg 2+, CheA binds TNP-ATP in a two-step mechanism. In this model, the first step could involve the ATP portion of TNP-ATP binding the active site of CheA, giving rise to the ES complex. The second step, which gives rise to a fluorescence signal, positions TNP into the hydrophobic pocket adjacent to the active site to generate the final EP complex. (B) In the presence of Mg 2+, CheA binds TNP-ATP in three steps. In this model, Mg 2+ may initially interact with the polyphosphate groups of TNP-ATP causing a molecular 'tug-of-war'. (C) This third model suggests that Mg 2+ may act to shield the negative charges on the nitro group of the trinitrophenyl ring. See text for complete details. 171
190 tug-of-war described above, allowing a complex of higher affinity to form (EP). The basic ideas described in these paragraphs are summarized pictorially in Figure 3-28B. Yet another possibility for the molecular interactions underlying the effect of Mg 2+ on TNP-ATP binding kinetics is that Mg 2+ might interact in some way with the trinitrophenyl component of the ligand. The crystal structure of TmP4 bound to TNP- ATP shows the TNP ring sandwiched between three hydrophobic residues on one helix (I454, I459, L486) and two amphipathic lysine residues on another helix (K458, K462) [18]. It is conceivable that electrostatic attraction between the lysine side chains and the nitro groups of the TNP could accelerate the binding reaction (e.g., formation of the ET complex) even though these interactions would eventually disappear in favor of stronger hydrophobic interactions as ET converted into the final complex. In the no- Mg 2+ reaction, the electrostatic interactions would contribute, but in the plus-mg 2+ binding reaction, Mg 2+ could shield the nitro groups and diminish the lysine-nitro group electrostatic contributions. To form the final high affinity complex, the Mg 2+ would dissociate so that the most effective combination of hydrophobic binding contacts would be possible within the TNP binding pocket. The basic features of this model are summarized in Figure 3-28C. This possibility is inspired by the complementary charges of Mg 2+ and the oxy moieties of the nitro groups of TNP-ATP. A search for nitro-mg 2+ interactions in chemical/biochemical literature did not reveal any clear precedents. What are the Strengths and Weaknesses of Using Graphical and Global Approaches to Analyze Kinetics Data to Infer a Reaction Mechanism? The final portion of this 172
191 discussion will focus on a comparison of the two different types of analyses I performed in order to assign rate constants to the various steps in the kinetic reaction mechanism. The graphical analysis is based on relating the observed kinetic parameters extracted from graphs of the kinetic data and relating those parameters to the rate constants for the individual steps (k 1, k -1, k 2, k -2, k 3, k -3 ) of a reaction mechanism. This method requires some simplifying assumptions to get from a differential equation describing the change in the concentration of a product over time to an integrated equation that is useful for graphical analysis [51, 170]. The global analysis solves for the unknown rate constants using a numerical integration approach that does not require any simplifying assumptions to reduce the complexity of a set of differential equations written to describe the reaction mechanism. The graphical approach and the global analysis present distinct advantages and disadvantages when analyzing kinetic information for insight into a reaction mechanism. The graphical approach is a simple and quick method for establishing both the number of minimal steps required for the reaction mechanism as well as for assigning rate constants to the individual steps within the reaction pathway. However, this approach requires assuming a rapid-equilibrium condition or the steady-state equilibrium condition. For example, in order to present an analytical solution to a set of differential equations describing the following reaction mechanism; k 1 k 2 A + B C D k -1 k -2 (mech. 3-10) 173
192 it is necessary to apply the steady-state assumption as described in equation 3-7: k 1 (A)(B) + k -2 (D) = (k -1 + k 2 ) (C) (eq. 3-7) Alternatively, an analytical solution can be reached using the rapid equilibrium assumption that k -1 >> k 2 and the following equation; k 1 (A)(B) + k -2 (D) k -1 (C) k 2 (C) = 0 (eq. 3-8) Although this approach generated some important pieces of information (e.g., the minimal number of steps and the approximate values of some of the component steps), I found that the values for the rate constants did not do an adequate job of recreating the data during my computer simulations. This situation led me to pursue a global analysis of my kinetic data with the goal of obtaining more accurate estimates of the rate constants of the individual steps within the reaction mechanism so that simulated timecourses could more accurately describe the experimental data. The global analysis provides certain advantages over the graphical analysis. One key difference is that the global analysis relies on fewer assumptions, requiring only the assumption that TNP-ATP binds CheA in three-steps (a specific model is required in order to write the series of differential equations that describe the kinetic mechanism of binding) and the assumption of which complexes in the reaction mechanism contribute to the fluorescence signal. Given the set of differential equations, the computer then applies brute-force to vary the magnitudes of the rate constants, calculate the expected reaction time course with each new combination of rate constants, compare the simulated time course to the actual observed time courses (the data), and then move on to try another set of rate constants. This process occurs iteratively until the 174
193 program finds that to improve the fit the rate constants are varying by less than 0.01%. At that point, the final set of rate constants is stored, the residual of the norm is recorded, and the process repeats with different starting parameters. This process can be repeated for days at a time, performing countless simulations, while randomizing the starting parameters to ensure that the program has found the global minimum, with the smallest residuals of the norm. I used the mathematical program, MATLAB, to perform this numerical integration and as an added benefit, I adjusted the program to simulate multiple time courses for reactions changing both substrate concentrations and the magnitude of the rate constants to explore how changes in these variables and parameters could affect the reaction profiles. Finally, this approach allowed me to visually inspect and confirm how well the rate constants and mechanism described the experimental data. The global analysis does have some limitations. In particular, it did not help to pin down the values of k 1 and k -1 (probably due to the fact that the first step did not generate a distinct fluorescence signal). Therefore I was unable to determine rigorously whether the rapid equilibrium assumption is valid for this binding mechanism. In addition, I observed that the global analysis had difficulty pinpointing reverse rate constants when analyzing the association kinetic data (and vice versa). This difficulty also exists with the graphical analysis. Another limitation of the global analysis is that it requires prior knowledge about the reaction mechanism (how many steps are involved and which reaction intermediates contribute to the fluorescence signal). Since the graphical analysis provided a way for establishing a mechanism, it was to my advantage 175
194 to use both types of data analysis when deciphering the mechanism of TNP-ATP binding CheA. Future work might build on my results to define more clearly how dimeric CheA functions within the chemotaxis signal transduction pathway. For example, this might involve determining the kinetic mechanism for binding for both the strong and weak ATP-binding sites within the CheA dimer, in a manner analogous to the PriA studies of Lucius et al. [102]. A related question is whether the properties of these binding sites are affected when CheA interacts with CheW and the chemotaxis receptor proteins in signaling complexes. 176
195 Chapter 4: Exploiting the Naturally Occurring Cysteine in CheY Homologues. INTRODUCTION The chemotaxis signal transduction system in Escherichia coli governs the movement of a cell towards favorable environments with higher concentrations of attractant chemicals and away from harmful environments with higher concentrations of repellent chemicals. Cells accomplish this movement by changing the frequency of tumble events (generated by changes in the rotational direction of the flagella) when swimming. In response to changes in the quality of the environment, receptors embedded within the inner membrane of the cell modulate the autophosphorylation activity of the sensor kinase, CheA. CheA autophosphorylates and then transfers that phosphate to the response regulator, CheY. Phospho-CheY diffuses through the cell and binds to the FliM protein, a component of the flagellar motor switch. Upon binding phospho-chey, the flagellar motor reverses rotation from counterclockwise to clockwise which results in the cell tumbling. CheY is dephosphorylated by CheZ. In E. coli cells, in response to an increase in the concentration of attractants, the autophosphorylation activity of CheA decreases which, in turn, causes the levels of phospho-chey to drop. This response results in fewer tumbles and longer swimming runs enabling the cell to move up a gradient of attractants [Reviewed in (168)]. In the chemotaxis signaling pathway, a key phospho-transfer reaction involves phospho-his48 of CheA and the carboxylate group of Asp57 in CheY [62]. Both the 177
196 CheA and CheY proteins have been studied in detail. The histidine protein kinase, CheA, is composed of five domains (P1-P5): P3- P5 are responsible for dimerization, ATP binding, and interactions with the receptors; P2 binds CheY and Che B (a separate response regulator which functions in the adaptation system of the chemotaxis pathway); and P1 contains the phosphorylatable His residue (Figure 1-7) [55, 144, 168, 173]. The response regulator, CheY is a globular protein that is capable of receiving the phosphate from CheA as well as catalyzing its own phosphorylation by small-molecule phosphodonors such as acetyl phosphate and phosphoramidate (although this phosphorylation is considerably slower than with phospho-chea) [112]. The CheA- CheY His-Asp phosphotransfer occurs 100 to 1000-fold faster than analogous His-Asp phospho-relays involving proteins from other (non-chemotaxis) two-component signal transduction pathways [157]. The structure of CheY consists of 5 α/ß folds (Figure 4-2). The active site (containing the phosphorylatable Asp57) lies in a cleft formed by ß1, ß3, and ß5, and is exposed to the solvent [99, 163, 164]. A crystal structure of Mg 2+ -CheY shows that three highly conserved Asp residues (Asp12, Asp13, and Asp57) at the active site, along with three water molecules, coordinate Mg 2+, which is essential to the CheY phosphorylation reaction [103, 164]. A crystal structure of phospho-chey has yet to be determined, due to the extremely short half-life of the phospho-aspartate linkage (~ 10 seconds) [62]. Yan et al. have discovered that beryllofluoride (BeF - 3 ), when bound to response regulators such as NtrC, OmpR and CheY, can mimic the phospho-aspartate formation thereby - generating stable versions of the active states for these proteins [191]. The CheY:BeF 3 178
197 complex has been crystallized, enabling analysis of the structure of "activated" CheY [59]. The CheA-CheY phospho-transfer reaction requires the following steps: (1) CheY must first bind to the P2 domain of CheA, (2) a phosphate is transferred from His48 within the P1 domain of CheA to Asp57 within CheY, and (3) phospho-chey releases CheA. The Stewart lab has examined the first step of this phospho-transfer reaction (CheY binding CheA) by monitoring the intrinsic fluorescence of CheY when binding to CheA. The CheY intrinsic fluorescence signal (emitted from a single Trp residue) was used to examine the rapid kinetics of CheY binding to the isolated P2 domain of CheA as well as CheY interactions with CheA from which the P2 domain had been deleted [156, 157]. A drawback of using CheY intrinsic fluorescence is that CheA emits overlapping fluorescence that can complicate the results. To circumvent this problem, the Stewart lab modified CheY by covalently attaching an environmentallysensitive fluorophore, Badan [6-bromoacetyl-2-(dimethylamino) naphthalene] that absorbed and emitted light at longer wavelengths where the intrinsic fluorescence of these proteins could not interfere [158]. These studies helped to define the kinetic mechanism of E. coli CheY binding CheA [158]. To generate Badan-labeled CheY, the fluorophore must react with the sulfhydryl group of a cysteine residue [158]. E. coli CheY does not have a cysteine in its primary structure, and so Stewart and VanBruggen generated multiple CheY variants carrying a single cysteine mutation at various positions in the protein's sequence [158]. The position of this cysteine mutation was critical: as an attachment site for Badan, this 179
198 residue needed to position Badan within an environment that changed upon phosphorylation or CheA binding. However, to be useful, the fluorescence label could not be situated in a location that hindered the binding or chemical events of interest. Finding such a position in CheY turned out to be quite difficult. Stewart and VanBruggen made 8 separate cysteine substitutions into CheY and modified each of these with 6 different fluorescent labels, ultimately finding only one position (M17C) and one label (Badan) that met these criteria. Most of the biochemical studies done with CheY have come from studies using E. coli CheY or Salmonella typhimurium CheY. Little is known about the biochemical activities of CheY from other bacteria including numerous "extremophiles" such as the thermophilic bacteria Thermotoga maritima and Geobacillus stearothermophilus. Since CheY from T. maritima and G. stearothermophilus do not contain a Trp residue that could serve as a reporter, it is not possible to use their intrinsic fluorescence to study their phosphorylation and binding reactions. However these two proteins do contain a single cysteine in their primary structure. In this chapter, I exploited this cysteine residue as an attachment site for the Badan fluorophore. I then performed experiments designed to test whether their fluorescence signals could be used to monitor CheY phosphorylation and CheY-CheA binding interactions
199 MATERIALS AND METHODS Sequence Alignments. Sequence identities of Escherichia coli CheY (EcY), Geobacillus stearothermophilus CheY (GsY), and Thermotoga maritima CheY (TmY) were determined using the Blosum62 matrix in the protein Basic Local Alignment Search Tool (BLASTP) version [179]. A search for homologues of EcY was performed within the NCBI Genbank and a multiple sequence alignment was performed by the ClustalW (version 1.82) program using the default settings [38]. A visual examination of the alignment revealed 15 (out of 63 total) homologues contain a cysteine at the position identical to C81 in TmY. Accession numbers for each of the proteins are as follows: T. maritima CheY NP228509; E. coli CheY NP06143; R. centenum AAB71331; C. tetani NP782325; G. kautophilus YP147085; B. subtilis NP389515; B. licheniformis YP091442; O. iheyensis NP692354; B. halodurans D83955; B. cereus ZP ; M. acetivorans NP617961; M. mazei NP988053; A. fulgidus NP069875; H. salinarum G84253; H. marismortui YP136738; M. maripaludis NP The coding sequence for G. stearothermophilus CheY was identified at the University of Oklahoma Genome Center website by BLASTP analysis ( Chemicals and Reagents. TCEP [tris-(2-carboxyethyl)-phosphine] and Badan [6- bromoacetyl-2-(dimethylamino)naphthalene] were purchased from Molecular Probes and stored in the dark at -20 C. Beryllium chloride (BeCl 2 ), sodium fluoride (NaF), and acetyl phosphate (ACP the lithium, potassium salt) were purchased from Aldrich Chemical Company. All other chemicals were reagent grade and were purchased from 181
200 standard commercial sources. TED buffer (ph 7.5 at 25 C) contains 50 mm Tris-HCl, 0.5 mm EDTA, 0.5 mm DTT. TEGD adds 10% glycerol (v/v). TEGDP buffer adds 1 mm PMSF. TNGKG (ph 7.5 at 25 C) contains 25 mm Tris-HCl, 25 mm sodium chloride, 10% glycerol (v/v), and 50 mm potassium glutamate. Where indicated, DTT and PMSF were added immediately before use. Site-Directed Mutants and Plasmids. CheY and CheA proteins used in this chapter were from Escherichia coli, Thermotoga maritima, and Geobacillus stearothermophilus. A cysteine substitution was made into E. coli CheY at site V86 by oligonucleotide-directed mutagenesis as described previously [158]. The CheY proteins from T. maritima and G. stearothermophilus did not require mutagenesis as a cysteine residue was already present at the homologous position. The expression plasmid pet28a (Invitrogen) was used to overexpress TmY, EcY V86C, GsY, T. maritima CheA (TmA) [124], G. stearothermophilus CheA (GsA) and two truncated versions of TmA: TmP1P2 (amino acid residues 1-264) and TmP2 (residues ). E. coli CheA was expressed from a plasmid derivative of pah1. All proteins carry a N-terminal (His) 6 tag fusion to simplify purification. The plasmids carrying TmA were a gift from Sang-Youn Park's and Brian Crane's laboratory at Cornell University. Protein Expression and Purification. E. coli host cells BL21 λde3 (Invitrogen) and expression plasmid, pet28a, were used to overproduce the CheY proteins, T. maritima CheA (TmA) and the isolated domains (P1-P2 and P2) of TmA. These cells were grown 182
201 at 32 C in 4L of Luria broth with 50 µg/ml kanamycin. For overproduction of E. coli CheA, plasmid pah1:eca was transformed into E. coli strain D260 (kindly provided by S. Parkinson [144]) and grown at 32 C in 4L of Luria broth with 100 µg/ml ampicillin. Overproduction of each protein was induced by adding IPTG at a final concentration of 1 mm to the cultures once the cells entered log phase. Three hours after induction, cells were moved to 4 C and pellets were collected by centrifugation. All further steps were carried out at 4 C. Soluble cytoplasmic extracts from cells overexpressing TmY and GsY were generated by sonication in buffer (50 mm Tris-HCl, 5 mm MgCl, 0.1 mg/ml lysozyme, 2 mm ß-ME, ph 8.0) followed by ultracentrifugation. Purification of TmY follows the protocol established by Swanson et al. [175]. A final Ni-NTA affinity chromatography step was added to the purification protocol as described by Levit et al. [89] except the protein was eluted with 150 mm imidazole and 2 mm ß-ME was included in the column buffers to maintain the reduced state of the cysteines. GsY was purified with a Ni-NTA affinity chromatography column as described for TmY, except no heat step was used. GsY fractions eluted from the Ni-NTA column were pooled and dialyzed into TEGD buffer and then further purified by chromatography on DEAE-Sepharose [175]. EcY V86C was expressed and purified as described by Stewart and VanBruggen [158]. All CheY proteins were stored in TEGD buffer at -80 C. Soluble cytoplasmic extracts from cells overexpressing CheA proteins were generated by sonication in buffer (50 mm sodium phosphate, 300 mm NaCl, 5 mm imidizole, 0.1 mm PMSF, ph 8.0), then ultracentrifuged, and the desired protein was 183
202 purified using Ni-NTA chromatography [70, 89]. An additional purification step was necessary for full-length TmA. Fractions containing TmA were pooled, dialyzed into TEGDP buffer and further purified using Affi-Gel Blue chromatography (Bio-Rad). The column was washed with TEGDP buffer and then eluted with 2 M NaCl in TEGDP buffer. All CheA proteins were stored in TEGDP buffer at -80 C. Protein concentrations were determined spectrophotometrically, using the following calculated extinction coefficients [57]: 2.56 mm -1 cm -1 for TmY, 1.28 mm -1 cm - 1 GsY, 8.25 mm -1 cm -1 for EcY V86C, 15.9 mm -1 cm -1 for TmA, 11.5 mm -1 cm -1 for GsA, 16.3 mm -1 cm -1 for EcA, 5.12 mm -1 cm -1 for TmP1P2. Protein concentrations for TmP1P2, TmP2 as well as TmY and GsY, were also verified by use of the microbicinchoninic acid assay (Pierce). Labeling CheY Proteins with Badan. EcY V86C, TmY, and GsY were labeled with Badan according to previously published methods [158]. CheY was dialyzed extensively against 50 mm Tris-HCl, 0.5 mm EDTA, 1 mm TCEP (ph 7.5) to remove the DTT in the storage buffer (DTT reacts with Badan). TCEP was included to maintain the cysteine side chain in a reduced state (TCEP does not react with Badan). To 200 µl of CheY, small aliquots (4 x 20 µl) were added from a 25 mm Badan stock solution (in dimethylformamide) while the sample was slowly mixed. The labeling reaction was kept in the dark for 2 hours at room temperature. ß-ME at a final concentration of 5 mm was added to stop the reaction. The labeled protein was dialyzed extensively (6 x 200 ml) against TED buffer at 4 C while protected from light. 184
203 Stoichiometry of labeling was quantified as described previously [158]; this is described in the Results section. This analysis indicated the following labeling stoichiometries: 0.7 Badan molecules per CheY for TmY, 0.7 for GsY, and 1.4 for EcY V86C. Fluorescence-monitored Phosphorylation and Binding Titrations. Reactions were carried out in 2.5 ml of either TED buffer (phosphorylation reactions) or TNGKG buffer (CheA binding titrations) using 1 cm x 1 cm quartz fluorescence cuvettes. The samples were maintained at 25 C and, except for GsY, were stirred continuously using a magnetic stir bar. Badan-labeled GsY showed sensitivity to continuous stirring and therefore mixing was performed by pipetting the mixture. Fluorescence emission spectra were recorded using a PTI QuantaMaster instrument measuring counts per second (cps). Emission spectra ( nm, slits at 5 nm) where recorded with an excitation wavelength set to 390 nm (slits at 1.5 nm). Emission spectra from phosphorylation reactions were imported into SigmaPlot and corrected for dilution effects (eq. 2-1). A minimum of two independent experiments were performed with similar changes in the emission spectra noted. Data displayed in the figures represent a single experiment. To study the CheY-CheA binding equilibrium, fluorescence-monitored titrations were performed by adding successive aliquots of CheA to a solution of Badan-labeled CheY (hereafter referred to as Bdn-CheY) and the emission spectrum was recorded after each addition. Binding data from these titrations were imported into SigmaPlot, the change in fluorescence was calculated for each addition, and then corrected for dilution effects (eq. 2-1). The corrected data were analyzed using a simple one-site binding 185
204 equation (see Appendix A). All CheA concentrations used in these calculations represent monomeric concentrations. The reported K d values for the CheA-CheY binding equilibria are the average of two independent experiments for each CheA-CheY pair. 186
205 RESULTS The Frequency of a Single Cysteine in CheY Homologues. Wild-type E. coli CheY (EcY) lacks a cysteine in its amino acid sequence. The Stewart lab introduced a single-base substitution at Met17 to genetically engineer EcY to carry a single cysteine residue in its primary structure. Once the protein was purified, the Badan fluorophore was attached to the thiol group of this cysteine to generate Badan-labeled EcY M17C (Bdn-EcY M17C ). This Badan-labeled protein proved to be a sensitive reporter of CheY phosphorylation and the CheA-CheY binding interaction [158]. Some CheY homologues, including CheY from Thermotoga maritima (TmY) and Geobacillus stearothermophilus (GsY) have a single cysteine already present in their primary structures (Figure 4-1A). In order to determine if this cysteine residue is conserved among other homologues of CheY (and to what extent), I used BLASTP [5] to align all the CheY amino acid sequences that I could find in Genbank (63 total). Of these, ~ 25 % had a single cysteine at a common position. In E. coli CheY, this position corresponds to Val86 (Figure 4-1B). Of the remaining 48 homologues, 3 contained cysteines at other locations. Two of these CheYs (Pseudomonas syringue and Chromobacterium violaceum) had a single cysteine at a position homologous to Glu37 of E. coli CheY. The remaining CheY homologue (from Rhodospirillum centenum) had multiple cysteines. I chose two proteins from this list, GsY and TmY, as test cases for further experiments. The Location of the Conserved Cysteine in the Three-Dimensional Structure of T. maritima CheY. The crystal structure of T. maritima CheY shows 5 α/ß folds that are 187
206 A T. maritima --- MGKRVLIVDD AAFMRMMLKD IITKAGYEVA GEATNGREAV EKYKELKPDI 50 G. stearothermophilus --- MAR-VLVVDD AAFMRMMIKD ILTKNGHEVV AEAADGRQAI EKYKETRPDV 49 E. coli MAD KELKFLVVDD FSTMRRIVRN LLKELGFNNV EEAEDGVDAL NKLQAGGYGF 50 VTMDITMPEM NGIDAIKEIM KIDPN--AKI IVCSAMGQQA MVIEAIKAGA 98 VTMDITMPEM DGITALKEIK KIDSN--AKV IMCSAMGQQA MVIDAIQAGA 97 VISDWNMPNM DGLELLKTIR ADGAMSALPV LMVTAEAKKE NIIAAAQAGA 100 KDFIVKPFQP SRVVEALNKV SK KDFVVKPFQA DRVIEAINKT IG SGYVVKPFTA ATLEEKLNKI FEKLGM 129 B Clostridium tetani MSK-VLIVDDAAFMRMMIKDILEKNG-- 25 Geobacillus kautophilus MARVLVVDDAAFMRMMIKDILTKNG-- 25 Bacillus subtilis MAHRILIVDDAAFMRMMIKDILVKNG-- 26 Bacillus licheniformis MAYKILVVDDAAFMRMMIKDILVKNG-- 26 Oceanobacillus iheyensis MGQRILIVDDAAFMRMMIKDILTKND-- 26 Bacillus halodurans MAARILIVDDASFMRMMIKDILTKNG-- 26 Bacillus cereus MAHKILVVDDAMFMRTMIKNLLKSNSE- 27 Methanosarcina acetivorans MAKVLIVDDTAFMRKLLKNILFGAG-- 25 Methanosarcina mazei MAKVLIVDDTAFMRKLLKNILFGAG-- 25 Archaeoglobus fulgidus MPKVLIVDDTAFMRKLLRNILFSGG-- 25 Halobacterium salinanum MAKQVLLVDDSEFMRNLLREILEEE Haloarcula marismortui MPDVLIADDSEFMRNLLREILEED Methanococcus maripaludis MASIVKTMIVDDSAFMRNILKRILSTTNK- 29 C. tetani FEVVGEASNGVKAVELYKTEKP------DVVTMDITMPDMDGIEAVKEIK 69 G. kautophilus HEVVAEAADGRQAIEKYKETQP------DVVTMDITMPEMDGITALKEIK 69 B. subtilis FEVVAEAENGAQAVEKYKEHSP------DLVTMDITMPEMDGITALKEIK 70 B. licheniformis FEVVAEAQDGAQAVEKYKEHSP------DLVTMDITMPEKDGITALKEIK 70 O. iheyensis FEVVDEAQDGNEAIEKFKEHKP------DLVTMDITMPEKDGISALKEIK 70 B. halodurans YDVVGEAHDGEQAVEKYKELSP------DLVTMDITMPEKDGIAALKDIR 70 B. cereus FEVIGEAENGVEAIQKYKELQP------DIVTLDITMPEMDGLEALKEIM 71 M. acetivorans FDIAGEAENGKQAVEMYKGLKP------DVVTMDVVMPEMTGIDALKQIK 69 M. mazei FDIAGEAENGKQAVEMYRTIKP------DVVTMDVVMPEMTGIDALKQIK 69 A. fulgidus FDIAGEAENGKQAVEMYKQLKP------DIVTMDIVMPEMNGIEALKAIK 69 H. salinanum FEIADEAENGVEAVEMYKEYDP------DLVMMDIVMPIRDGIEATSEIK 69 H. marismortui HEIVGEVENGVEAVEVFKEEGP------DLVMMDIVMPIRDGIEATDEIK 68 M. maripaludis YVVIGEAANGADAIKMAEELQP------DLISMDIVMPETDGITATKAIK 73 C. tetani SID--PDAKVIMCSAMGQQTMVMDAIKAGAKDFIVKPFQPDRVLEAIKKVIG G. kautophilus KID--SNAKVIMCSAMGQQAMVIDAIQAGAKDFVVKPFQADRVIEAINKTIG B. subtilis QID--AQARIIMCSAMGQQSMVIDAIQAGAKDFIVKPFQADRVLEAINKTLN B. licheniformis EID--PQAKIIMCSAMGQQSMVIDAIQAGAKDFIVKPFQADRVMEAINKTLS O. iheyensis QFD--SEAKIIMCSAMGQQAMVIDAIQAGAKDFIVKPFQADRVIEAIQKALS B. halodurans AID--PNAKVIMCSAMGQQAMVIDAIQAGAKDFIVKPFQADRVIDAIQKTLGA B. cereus KID--SSAKVVICSAMGQQGMVLDAIKGGAKDFIVKPFQADRVIEALTKVANS M. acetivorans ALD--KDAKIVMCTAIGQENIVKTAIKLGARGYIIKPFQAPKVIEEIKKVIGA M. mazei TAD--KDAKIVMCTAIGQENIVKTAIKLGARGYIIKPFQAPKVIEEIKKVVGE A. fulgidus KID--PSAKVVMCTAVGQEQMVKAAIKLGAKGYIVKPFQAPKVIEELKKVAGMG H. salinanum EFD--AGAHIIMCTSIGQEEKMKKAVKAGADGYITKPFQKPSVMDAISDVLTA H. marismortui SSN--PDANVIMCTSVGQEEKMKEAVKAGADGYITKPFQKPSVMEAIEDVVPS M. maripaludis EKT--PEIKIVMCTSVDQEQKMIDAVNAGADGYIVKPFQAPKILEQFNKLFP
207 Figure 4-1. Sequence alignments of CheY Homologues. (A) CheY sequences from T. maritima, G. stearothermophilus, and E. coli were aligned using the Blosum62 matrix in the protein Basic Local Alignment Search Tool (BLASTP) version This analysis determined that GsY was 34 % identical and TmY was 25 % identical to EcY. (B) A search for homologues of EcY, TmY, and GsY found 13 additional CheYs that contained a single cysteine (highlighted) in their sequences at a position homologous to the cysteine in CheY from T. maritima and G. stearothermophilus [5]. 189
208 oriented in such a way as to form a cleft where the active site (phosphorylation site) is found. The conserved cysteine residue of T. maritima CheY is located within the ß4- sheet fold that lies close to the active site. In a nucleophilic reaction, the thiolate ion of this cysteine attacks the alkyl bromide group of Badan, displacing the bromide, and forming a covalent bond with this fluorophore (Figure 4-2A). Figure 4-2B shows the three-dimensional crystal structure of TmY [183] into which I inserted (manually) a Badan molecule attached to Cys81. In this structure, the fluorophore is oriented close to the phosphorylatable Asp54 (residing in the ß3-sheet fold), with the carboxylate oxygen of Asp54 separated from the center of the naphthalene rings of Badan by ~ 4Å. This possible orientation could bring Badan close enough to the phosphorylation site so that phosphorylation could affect the fluorescence of the Badan fluorophore. In the next subsection, I present the results of my experiments designed to test my hypothesis that Bdn-TmY could act as a sensitive fluorescence reporter of CheY phosphorylation as well as CheA binding. Then, in the following subsections, I label G. stearothermophilus CheY and E. coli CheY V86C with the Badan fluorophore and characterize these labeled proteins when they interact with their substrates. Labeling T. maritima CheY with the Badan Fluorophore. In previous studies, labeling E. coli CheY M17C was a fairly straightforward process. The results of this labeling yielded a stoichiometry of close to 1 Badan molecule per EcY molecule and a SDS-PAGE analysis of Bdn-EcY M17C indicated a single fluorescent band corresponding to the labeled protein when placed under a transilluminator [158]. However, when I labeled TmY with Badan, 190
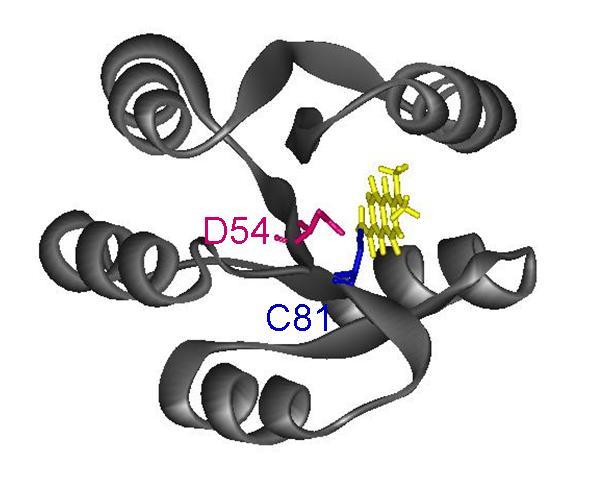
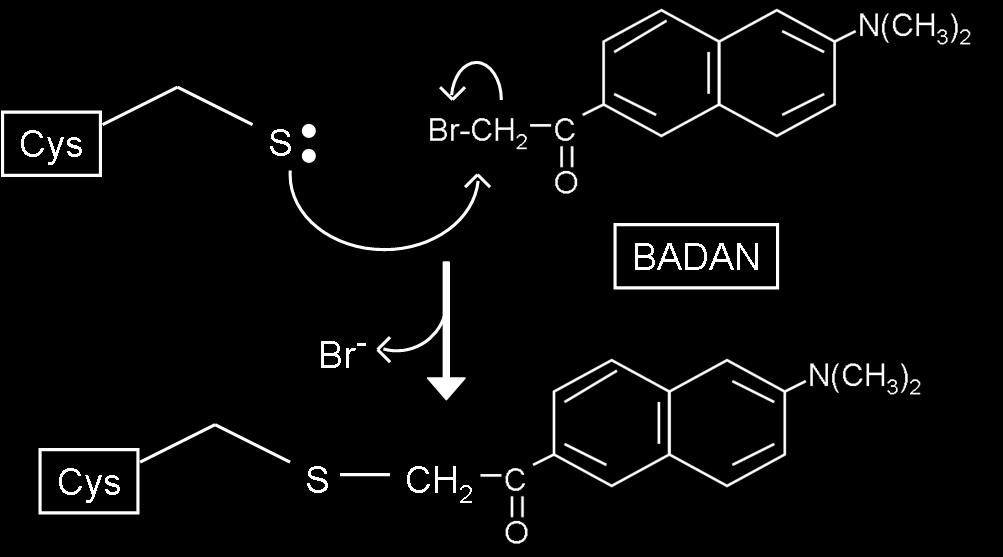
209 A B 191
210 Figure 4-2. Badan-labeled T. maritima CheY. (A) Reaction scheme detailing the chemical reaction between the acetyl(dimethylamino)naphthalene fluorophore group from Badan and the R group of a cysteine residue. (B) Hypothetical three-dimensional structure of Bdn-TmY. The ribbon diagram of the TmY structure was generated in WebLab Viewer Pro with coordinates from PDB file 1TMY (1.9 Å resolution) [183]. In this structure, the side chain, Cys81 is covalently attached to the Badan fluorophore. Badan is drawn to scale relative to the CheY structural elements by use of ViewerPro. In this view, the phosphorylation site, Asp54, lies in front of Cys81. The carboxylate oxygen of Asp54 is separated from the center of the naphthalene rings of Badan by ~ 4 Å. The exact orientation of the fluorophore relative to the rest of CheY is hypothetical and was arrived at by minimizing (visually) steric clashes between the Cys-Badan and the CheY side chains in the immediate vicinity. Numerous alternative orientations are possible. Computer-based energy minimization of Badan-TmY was not attempted. 192
211 this labeling proved to be less efficient than with EcY M17C. Figure 4-3 shows the absorbance spectrum of my final Bdn-TmY product. The broad absorbance peak centered around 380 nm is due to Badan, while the absorbance in the 280 nm range includes contributions from both Badan and TmY tyrosine side chains. As described in the legend to Figure 3-4, this information can be used to calculate the stoichiometry of labeling. This calculation indicated that, at most, 70% of the TmY molecules were labeled. In addition, I performed an SDS-PAGE analysis of Bdn-TmY, and found a substantial amount of free Badan at the dye front (Figure 4-4, lanes 1 and 2). This indicated that not all of the Badan fluorphore in my final Bdn-TmY preparation was covalently attached to the protein. Thus the true labeling stoichiometry was considerably less than 0.7 (perhaps as low as based on the relative intensities of the dye front band and the TmY band in Figure 4-4). The presence of this 'free Badan' in my final Bdn-TmY preparation (despite extensive dialysis) suggested that Badan had a strong noncovalent affinity for TmY. I tried to rid the sample of unattached Badan through further dialysis, but Badan's affinity for TmY was apparently too strong. In addition, I tried to use a small-scale Ni-NTA chromatography column to remove the free Badan, but was unsuccessful. Nonetheless, I decided to proceed with this less-than-ideal labeled protein preparation, using it in experiments designed to test whether this overall labeling strategy was worth pursuing. The presence of noncovalently attached Badan had the potential to greatly complicate analysis of my experiments. Therefore, I examined whether free Badan was affected by Mg 2+, acetyl phosphate, or by free TmY. Figure 4-5 shows the fluorescence 193
212 Absorbance (arbitrary units) Wavelength (nm) Figure 4-3. Absorbance spectrum of Badan-labeled TmY. The absorbance spectrum of Bdn-TmY is used to calculate the stoichiometry of labeling. The stoichiometry is determined by the ratio of the concentration of Badan to the total concentration of TmY. To calculate the concentration of Bdn in the labeled sample, the absorbance reading at 387 nm (the wavelength where Badan absorbs the greatest) is first corrected for the buffer reading and dilution. This reading is then used to calculate the concentration of Badan with Badan's extinction coefficient of 12.9 mm -1 cm -1 and a 0.3 cm cuvette [32]. To calculate the concentration of TmY in the labeled sample, the absorbance reading at 280 nm (where protein absorbs the greatest) is corrected for buffer, dilution and for the contribution of Badan to this peak as Badan also absorbs at 280 nm. This reading is then used to calculate the concentration of TmY in the sample using TmY's extinction coefficient of 2.56 mm -1 cm -1 and a 0.3 cm cuvette. The stoichiometry of this analysis showed that, at the most, 70% of the TmY molecules had the Badan fluorophore attached. 194

213 Figure 4-4. SDS-PAGE analysis of Badan-labeled T. maritima CheY. Samples of Bdn- TmY were run on a 12 % SDS-polyacrylamide gel. Lanes: (1) Ladder, (2) 2.5 µm Bdn- TmY. The gel on the left is stained with Coomassie blue, the gel on the right is the same gel before staining viewed using a UV transilluminator. Notice the free Badan illuminated at the dye front on the gel on the right. The molecular weights standards in Lane 1 are the BenchMark (Invitrogen) prestained ladder; some of these stained proteins are fluorescent under these conditions. 195
214 Figure 4-5. The effect of Mg 2+, acetyl phosphate, and TmY on the fluorescence emission intensity of free Badan. Emission spectra were recorded for free Badan samples in TED buffer at 25 C with λ ex = 390 nm. The black solid line represents 4 µm free Badan. Pink dots represent the emission spectrum of free Badan after the addition of 10 mm MgCl 2 and the short blue dashes represents a further addition of 10 mm acetyl phosphate. 20 µm TmY was also added to the free Badan/Mg 2+ /acetyl phosphate solution (longer green dashes). The dotted black spectrum is the emission spectrum of just TED buffer prior to the addition of free Badan. All spectra have been corrected for small dilution effects. 196
215 emission spectrum of free Badan in the presence of each of these three molecules. In each instance, the emission spectrum appeared to be either completely unaffected or altered only slightly. These results suggested that the free Badan in my Bdn-TmY preparation would not interfere with my attempts to perform an initial characterization of Bdn-TmY. The Effects of Mg 2+ and Phosphorylation on the Fluorescence Emission Spectrum of Badan-Labeled T. maritima CheY. My next goal was to determine whether Bdn-TmY was a sensitive fluorescent reporter of Mg 2+ binding, phosphorylation, and/or CheA binding. Figure 4-6 shows the emission spectrum for this labeled protein in the presence of Mg 2+, acetyl phosphate and beryllofluoride. Bdn-TmY did not appear to be affected by the presence of Mg 2+ but did exhibit a noticeable blue-shift upon the addition of acetyl phosphate. This blue-shift was reproduced (to a greater extent) when I added BeCl 2 and NaF to a solution of Bdn-TmY and Mg 2+. BeCl 2 and NaF form beryllofluoride which, when bound to the active site of CheY, mimics the effects of phosphorylation [39, 191]. I expected a greater fluorescence change with BeF - 3 than with acetyl phosphate because beryllofluoride binds tightly to the CheY active site, converting all of the CheY to an 'activated' state. By contrast, in the presence of acetyl phosphate, I expect CheY to adopt an equilibrium between the unphosphorylated and phosphorylated states, and so only a portion of the population of Bdn-TmY would be phosphorylated. 197
216 Figure 4-6. Effect of phosphorylation and beryllofluoride on the fluorescence emission spectrum of Bdn-TmY. Emission spectra were recorded for Bdn-TmY samples in TED buffer at 25 C with λ ex = 390 nm. The black line represents 0.8 µm Bdn-TmY. Pink dots represent the emission spectrum of Bdn-TmY after the addition of 10 mm MgCl 2, and the short blue dashes represent a further addition of 7.5 mm acetyl phosphate. Long green dashes represent the fluorescence emission spectrum of Bdn-TmY (in the presence of 10 mm MgCl 2 and 10 mm NaF) after the addition of 200 µm BeCl 2. The dotted black line is the emission spectrum of just buffer prior to the addition of Bdn-TmY. All spectra have been corrected for small dilution effects. 198
217 The Effects of T. maritima CheA on the Fluorescence of Badan-labeled TmY. Previous studies in the Stewart lab used Bdn-EcY M17C to study the binding interactions of EcY with CheA. These studies defined the K d of this binding reaction (2 µm) which compared well with the K d reported for CheA binding CheY using isothermal calorimetry [93, 158]. To determine if Bdn-TmY could be used in a similar way, I examined the effect of TmA on the fluorescence emission spectrum of Bdn-TmY (Figure 4-7A). In the presence of TmA, the fluorescence of Bdn-TmY increased, with a maximum change observed at 470 nm. I performed equilibrium binding titrations of Bdn-TmY with TmA by monitoring this signal change (Figure 4-7B). Fitting these data to a single-site binding equation indicated a K d of 0.7 ± 0.2 µm for Bdn-TmY binding TmA. I investigated the possibility that Bdn-TmY fluorescence could be used to monitor TmY binding to two fragments of TmA: (1) a truncated version of CheA containing only the P1 and P2 domains; and (2) a fragment containing just the P2 domain. TmP1P2 and TmP2 affected the fluorescence emission spectrum of Bdn-TmY in similar ways (Figure 4-8A and Figure 4-9A). I performed equilibrium binding titrations of Bdn-TmY with each CheA fragment and monitored the resulting changes in fluorescence at each step along the titration scheme. The results of these titrations yielded binding curves which indicated a K d of 2.1 ± 0.2 µm for the TmP1P2 fragment binding CheY and a higher apparent K d (16.3 ± 2.3 µm) for the P2 domain binding Bdn-TmY (Figure 4-8B and Figure 4-9B). The K d for the Bdn-TmY:TmP1P2 complex formation was about 10-fold higher than the value previously established by Park et al. using ITC (0.20 ± 0.02 µm) [124]. This difference might result from Badan interfering with the binding interaction 199
218 A B TmA (µm) Figure 4-7. Effect of T. maritima CheA on the fluorescence emission spectrum of Bdn- TmY. (A) Emission spectra were recorded for Bdn-TmY samples (0.7 µm) in TNGKG buffer at 25 C in the absence (solid line) and in the presence (dashed line) of 5 µm TmA. The dotted line represents buffer before the addition of Bdn-TmY. (B) Results of fluorescence-monitored titrations of Bdn-TmY with full-length TmA. The change in emission intensity at 470 nm was determined after each of a series of TmA additions to a 0.7 µm Bdn-TmY sample. The solid line on this plot shows the computer-generated best fit of the data to a single-site binding equation as described in the Materials and Methods section. K d = 0.7 ± 0.2 µm. All data have been corrected for dilution effects. Error bars indicate the average data from two independent experiments. 200
219 A B TmP1P2 (µm) Figure 4-8. Effect of TmP1P2 on the fluorescence emission spectrum of Bdn-TmY. (A) Emission spectra were recorded for Bdn-TmY samples (0.5 µm) in TNGKG buffer at 25 C in the absence (solid line) and in the presence (dashed line) of 20 µm TmP1P2. The dotted line represents buffer before the addition of Bdn-TmY. (B) Results of fluorescence-monitored titrations of Bdn-TmY with TmP1P2. The change in emission intensity at 460 nm was determined after each of a series of TmP1P2 additions to a 0.5 µm Bdn-TmY sample. The solid line on this plot shows the computer-generated best fit of the data to a single-site binding equation as described in the Materials and Methods section. K d = 2.1 ± 0.2 µm. All data have been corrected for dilution effects. Error bars indicate the average data from two independent experiments. 201
220 A B TmP2 (µm) Figure 4-9. Effect of TmP2 on the fluorescence emission spectrum of Bdn-TmY. (A) Emission spectra were recorded for Bdn-TmY samples (0.5 µm) in TNGKG buffer at 25 C in the absence (solid line) and in the presence (dashed line) of 40 µm TmP2. The dotted line represents buffer before the addition of Bdn-TmY. (B) Results of fluorescence-monitored titrations of Bdn-TmY with TmP2. The change in emission intensity at 460 nm was determined after each of a series of TmP2 additions to a 0.5 µm Bdn-TmY sample. The solid line on this plot shows the computer-generated best fit of the data to a single-site binding equation as described in the Materials and Methods section. K d = 16.3 ± 2.3 µm. All data have been corrected for dilution effects. Error bars indicate the average data from two independent experiments. 202
221 and/or from differences in the composition of the buffers used for the different experiments. The Fluorescence Properties of Badan-Labeled GsCheY. Because of the difficulties encountered with Badan-labeling TmY, I wanted to determine whether labeling of other CheY homologues would present the same types of problems. As a test case, I purified and labeled CheY from G. stearothermophilus and determined that the stoichiometry of labeling was 0.7 Badan molecules per CheY molecule (similar to my apparent stoichiometry for TmY). SDS-PAGE analysis of this protein showed little to no free Badan in the solution of labeled protein (Figure 4-10). I examined the effects of Mg 2+ and phosphorylating agents on the fluorescence emission spectrum of Bdn-GsY (Figure 4-11). Addition of 10 mm Mg 2+ resulted in significant changes in the emission spectrum of Bdn-GsY, including a large red-shift. Addition of acetyl phosphate to the solution of Bdn-GsY and Mg 2+ resulted in a slight blue-shift relative to the Mg 2+ spectrum. This shift was not observed when acetyl phosphate was added to Bdn-GsY in the absence of Mg 2+, suggesting that it resulted from phosphorylation of CheY. A similar, but more noticeable shift was observed when Bdn-GsY was exposed to beryllofluoride (in the presence of Mg 2+ ). To determine whether Bdn-GsY could be used to monitor binding interactions with G. stearothermophilus CheA (GsA), I examined the fluorescence emission spectrum of Bdn-GsY in the presence of increasing concentrations of purified GsA. Figure 4-12A 203
 Ladder, (2) 100 µm Bdn-GsY (coomassie stain), (3) 100 µm Bdn-GsY (transilluminator).")
222 Figure SDS-PAGE analysis of Badan-labeled G. stearothermophilus CheY. Samples of Bdn-GsY were run on a 17.5 % SDS-polyacrylamide gel. Lanes: (1) Ladder, (2) 100 µm Bdn-GsY (coomassie stain), (3) 100 µm Bdn-GsY (transilluminator). The gel on the left is stained with Coomassie blue, the gel on the right is the same gel before staining viewed under a UV transilluminator. 204
223 Figure Effect of phosphorylation and beryllofluoride on the fluorescence emission spectrum of Bdn-GsY. Emission spectra were recorded for Bdn-GsY samples in TED buffer at 25 C with λ ex = 390 nm. The black line represents 0.2 µm Bdn-GsY. Pink dots represent the emission spectrum of Bdn-GsY after the addition of 10 mm MgCl 2 and the short blue dashes represents a further addition of 5 mm acetyl phosphate. Long green dashes represent the fluorescence emission spectrum of Bdn-GsY (in the presence of 10 mm MgCl 2 and 10 mm NaF) after the addition of 200 µm BeCl 2. The dotted black line is the emission spectrum of just buffer prior to the addition of Bdn-GsY. All spectra have been corrected for small dilution effects. 205
224 A B GsA (µm) Figure Effect of GsA on the fluorescence emission spectrum of Bdn-GsY. (A) Emission spectra were recorded for Bdn-GsY samples (0.2 µm) in TNGKG buffer at 25 C in the absence (solid line) and in the presence (dashed line) of 4 µm GsA. The dotted line represents buffer before the addition of Bdn-GsY. (B) Results of fluorescencemonitored titrations of Bdn-GsY with GsA. The absolute change in emission intensity at 440 nm was determined after each of a series of GsA additions to a 0.2 µm Bdn-GsY sample. The solid line on this plot shows the computer-generated best fit of the data to a single-site binding equation as described in the Materials and Methods section. K d = 3.5 ± 0.8 µm. All data have been corrected for dilution effects. Error bars indicate the average data from two independent experiments. 206
225 shows the fluorescence emission spectrum of 0.2 µm Bdn-GsY in the presence and absence of 4 µm GsA. The presence of GsA caused a significant decrease in fluorescence emission intensity of Bdn-GsY. I used this decrease in fluorescence to monitor GsA binding to Bdn-GsY in equilibrium binding titrations. Analysis of these results (Figure 4-12B) indicated a K d of 3.5 ± 0.8 µm for GsA binding Bdn-GsY. This K d is slightly higher (3-fold) than that determined in the previous section for Bdn-TmY binding TmA. The Fluorescence Properties of Badan-Labeled EcCheY V86C. Since both Bdn-TmY and Bdn-GsY were apparently sensitive fluorescence reporters of phosphorylation and CheA binding, I was curious as to whether this specific location in the CheY molecule could be exploited as a universal attachment site that could be labeled with Badan in any CheY to generate fluorescence reporter proteins. To test this idea, I introduced a V86C substitution into EcY (recall that position 86 of EcY aligns with the single cysteine present in Bdn-TmY and Bdn-GsY). I labeled purified EcY V86C with Badan, achieving an apparent labeling stoichiometry of ~ 1.4 Badan molecules per CheY molecule. I tested whether the labeled protein's fluorescence emission spectrum was affected by Mg 2+, acetyl phosphate, and beryllofluoride. Figure 4-13 shows that when 10 mm Mg 2+ was added to a solution of Bdn-EcY V86C the emission spectrum underwent a slight blue-shift. To test whether Bdn-EcY V86C acted as a fluorescence reporter of phosphorylation, I added acetyl phosphate to a solution of Bdn-EcY V86C in the presence of Mg 2+. This addition resulted in a dramatic change in the shape of the emission spectrum generating a new 207
226 Figure Effect of phosphorylation and beryllofluoride on the fluorescence emission spectrum of Bdn-EcY V86C. Emission spectra were recorded for Bdn-EcY V86C samples in TED buffer at 25 C with λ ex = 390 nm. The black line represents 0.1 µm Bdn-EcY V86C. Pink dots represent the emission spectrum of Bdn-EcY V86C after the addition 10 mm MgCl 2 and the short blue dashes represent a further addition of 10 mm acetyl phosphate. Long green dashes represent the fluorescence emission spectrum of Bdn-EcY V86C (in the presence of 10 mm MgCl 2 and 10 mm NaF) after the addition of 400 µm BeCl 2. The dotted black line shows the emission spectrum of just buffer prior to addition of Badan- EcY V86C. All spectra have been corrected for small dilution effects. 208
227 - emission at shorter wavelengths. I then examined the effect of BeF 3 in the presence of Mg 2+. This produced a shift that was qualitatively similar to that seen with acetyl phosphate but with more fluorescence intensity in the shorter wavelength peak. Figure 4-14 illustrates the effect of EcA on the fluorescence emission spectrum of Bdn- EcY V86C. The addition of EcA caused an overall increase in emission intensity of Bdn- EcY V86C but the shape and λ max of the emission peak (480 nm) were unaffected. I performed equilibrium binding titrations to measure the strength of binding between EcA and Bdn-EcY V86C. A plot of the change in fluorescence intensity as a function of EcA concentration (Figure 4-14B) indicated an approximately linear relationship over this concentration range, with no apparent saturation. Previous experiments (using unlabeled EcY and EcA) indicated a K d of 1-2 µm for this binding interaction. Thus, my results with Bdn-EcY V86C suggest that this labeled protein does not provide a useful reporter of EcA-EcY binding interactions. There are several possible explanations for the apparent low affinity of the EcA:Bdn-EcY V86C binding interaction. The Badan label might, for example, hinder binding (although position 86 is not part of the established binding interface [183]). Alternatively, the observed fluorescence changes might reflect nonspecific effects of protein concentration on fluorescence of Bdn-EcY V86C. Yet another possibility is that 'free Badan' present in the Bdn-EcY V86C sample interacted with EcA to give rise to the observed changes. 209
228 A B EcA (µm) Figure Effect of E. coli CheA on the fluorescence emission spectrum of Bdn- EcY V86C. (A) Emission spectra were recorded for Bdn-EcY V86C samples (0.1 µm) in TNGKG buffer at 25 C in the absence (solid line) and in the presence (dashed line) of 6 µm EcA. The dotted line represents buffer before the addition of Bdn-EcY V86C. (B) Results of fluorescence-monitored titration of Bdn-EcY V86C with EcA. The change in emission intensity at 480 nm was determined after each of a series of EcA additions to a 0.1 µm Badan-EcY sample. The data were corrected for dilution effects. No saturation is observed. 210
229 DISCUSSION I began this project with an examination of the database for CheY homologues and found that out of the ~ 60 sequences, 18 contained single cysteine residues, and for 15 of these, the cysteine was located at a common position in BLASTP alignments. With two of these homologues (T. maritima CheY and G. stearothermophilus CheY), I exploited this naturally occurring single cysteine as an attachment site for the thiolreactive, environmentally-sensitive, Badan fluorophore. I characterized Bdn-TmY and Bdn-GsY and found that both labeled proteins acted as fluorescent reporters of CheY phosphorylation and binding interactions with CheA. Of the remaining 42 CheY homologues from my search (the ones lacking cysteine), each has the possibility of being made into a fluorescent reporter if a single cysteine residue is introduced. To determine whether the site homologous to Cys81 in TmY could be a useful starting point in developing these reporter CheY's, I labeled and characterized EcY V86C. This labeled protein exhibited fluorescence changes under phosphorylating conditions, but it was not useful for studies of CheA binding, exhibiting what appeared to be "non-specific" fluorescence changes. Bdn-EcY V86C underscores some of the inherent problems/challenges that will have to be overcome when using the Badan-label approach to study phosphorylation and protein-protein binding interactions. In this discussion, I will review the major challenges that were encountered with this approach as well as provide a possible solution to these problems. One major problem of using Badan-labeled proteins that has come to light from my experiments is that there is a potential to have unattached Badan in the solution of 211
230 Badan-labeled protein, even after extensive dialysis. I encountered this problem with Bdn-TmY, but not with Bdn-GsY. If free Badan has an affinity for the protein in question and survives attempts to remove it, then interpretation of observed fluorescence changes can be complicated. For example, free Badan could interact with a titrating protein (this may have occurred in my titrations of Bdn-EcY V86C with EcA) and this can make it impossible to analyze equilibrium binding studies. In addition, the presence of free Badan greatly complicates attempts to estimate labeling stoichiometry. Thus, even if the apparent stoichiometry (based on absorbance spectra) is close to 1, labeled protein samples would actually be mixtures of labeled and unlabeled versions of the protein. This situation would present difficulties if the two populations of the protein behave differently (e.g., have different affinities for CheA, etc.). Only by trial and error can one determine if the labeled protein in question will demonstrate this problem. Another potential problem with Badan labeling (or any labeling, for that matter) is the possibility that the bulky covalently attached label can get in the way of important interactions or can impart an unnatural conformation to the protein. This might explain why the K d for Bdn-TmY binding TmP1P2 or TmP2 was 10-fold and 100-fold weaker (respectively) than the K d established using other approaches. I encountered an additional unexpected (and unexplained) technical difficulty with Bdn-GsY. This protein appeared to be very sensitive to stirring. Our normal practice for fluorescence-monitored titrations is to use a small magnetic stir bar to continuously stir the protein sample in the fluorescence cuvette. When Bdn-GsY was subjected to this treatment, its fluorescence emission spectrum decreased significantly 212
231 over time. Therefore, I had to mix samples (such as during titrations) manually by pipetting up and down. This sensitivity to stirring could have been a result of the labeled protein falling out of solution, although I did not notice any obvious precipitate. It is important to note that the challenges described above were specific to individual proteins and may or may not occur with other labeled proteins. The results presented in this chapter, as well as the review of the challenges I encountered, could be treated as a template when characterizing new Badan-labeled proteins (i.e., the labeled protein should be tested for these problems). If the new Badan-labeled protein does appear to demonstrate certain problems, the investigator has the option to switch to another environmentally-sensitive fluorophore. Also, the labeling reactions could be optimized by trying a range of label-to-protein ratios and by using different buffers that could improve the efficiency of labeling and/or decrease the occurance of non-covalent fluorophore interactions. Despite the difficulties described above, I was able to use Bdn-GsY and Bdn- TmY to provide some new information. For example, the data from the equilibrium binding titrations of the Bdn-CheY proteins from T. maritima and G. stearothermophilus with full-length CheA generated dissociation constants that have not been reported previously. These K d values are comparable to that determined for E. coli CheY with EcA. This is somewhat surprising as the natural environment for both TmY and GsY is at high temperature (~ 70 C) compared to the temperature at which EcY functions. One might have expected much tighter binding for the thermophile proteins operating at the 'chilly' temperature of 25 C. Another new insight gained from my studies is that TmY 213
232 may bind the isolated P2 domain from TmA with a weaker affinity than it does either the P1P2 domain or full-length CheA. This is different from the situation in E. coli, where CheY binds P2, P1P2, and full-length CheA with the same affinity [93, 158]. This difference may reflect the fact that, in CheY:P2 complexes, the binding surfaces and relative orientation of TmY and TmP2 are quite different from those of EcY and EcP2 (see Introduction chapter) [124]. The initial characterization of Bdn-TmY and Bdn-GsY presented in this chapter provides a starting point for future work characterizing the chemotaxis system's His-Asp phospho-transfer mechanism in both T. maritima and G. stearothermophilus. Future work could focus on finding less problematic fluorescent labels or possibly using the somewhat flawed Badan-labeled proteins in rapid reaction measurements to define the rate of CheY phosphorylation and/or to investigate the mechanism of CheA:CheY binding in the chemotaxis pathways of T. maritima and G. stearothermophilus. In addition, other CheY homologues containing the unique cysteine residue could be fluorescently labeled and characterized in order to study CheY phosphorylation and the CheA:CheY binding interaction in less well-characterized chemotaxis systems. 214
233 Chapter 5: General Conclusions and Future Directions The results presented in this dissertation provide some insights into the detailed mechanisms utilized by CheA, a histidine protein kinase that is an important component of the bacterial chemotaxis signal transduction pathway. This research involved two interrelated projects that examined CheA-ATP binding interactions by monitoring changes in the fluorescence signal emitted by TNP-ATP when it was bound at the CheA active site. In Chapter 2, I showed that dimeric CheA binds two molecules of TNP-ATP with negative cooperativity. To my knowledge, this work provides the first evidence of cooperativity in the superfamily of histidine protein kinases. In Chapter 3, I studied the kinetic mechanism of TNP-ATP binding to the nucleotide binding site of CheA. My most detailed analysis was for the reaction of TNP-ATP to the single active site of a monomeric version of CheA. My results indicated a three-step mechanism for this binding reaction and found estimates for the rate constants of these three steps. This analysis involved using two approaches, a graphical approach and a numerical integration approach. The former is the 'traditional approach' that has been used extensively since the early days of investigations of enzyme reaction kinetics [51, 170]. The latter is an approach that has been championed more recently by several research groups [130], but has not yet been applied extensively. My results provide a good example of how the two approaches can work synergistically to generate a detailed understanding of a reaction mechanism. 215
234 In this final chapter I will explore the significance of my CheA:TNP-ATP binding results. In the first section, I discuss how the TNP-ATP fluorescence signal could be used to develop an assay/screen to discover new inhibitors of histidine protein kinases. Then, in the next section, I discuss the potential significance of the negative cooperativity exhibited by CheA in binding TNP-ATP: significance for the chemotaxis system as well as for the broader HPK world. In the final section, I consider why it is important to understand binding reaction mechanisms at a detailed level. Throughout these last two sections, I will attempt to highlight important unresolved questions in the chemotaxis field and to discuss experiments that could produce some answers to these questions. Using the Fluorescence of the CheA:TNP-ATP Complex as a Tool for Drug Discovery. To date, only a few inhibitors have been identified for histidine protein kinases of twocomponent systems [100]. The mechanisms of action of these inhibitors remain uncertain [100]. To accelerate discovery of additional HPK inhibitors, the fluorescence signal generated when TNP-ATP binds CheA could be exploited as a useful tool for screening chemical libraries. A screen of these libraries could be easily automated by reading the fluorescence signal in microtiter plates, and this could be used to identify compounds (i.e., likely inhibitors) that bind to the CheA active site. A decrease in the fluorescence of the CheA:TNP-ATP complex may signal competitive binding with the potential inhibitor. This basic approach could be applied to other sensor kinases that generate a good fluorescence signal when binding TNP-ATP, such as EnvZ, the histidine kinase in the prokaryotic osmoregulation two-component system [131]. If a research 216
235 group had access to a panel of such HPK's from a variety of different two-component systems that operate in pathogenic bacteria, this group could screen chemical libraries to identify general and specific inhibitors. Such a screening approach could result in the identification of tight-binding inhibitors of HPKs, and these might provide a starting point for developing novel antimicrobial drugs that target two-component systems of pathogenic bacteria. Cooperativity in CheA-Nucleotide Binding. The observation that the CheA dimer exhibits negative cooperativity when it binds TNP-ATP (and probably unmodified ATP also) might provide a way to examine how the properties of CheA are influenced when CheA dimers are integrated into signaling complexes. In these complexes, the autokinase activity of CheA is regulated by the chemoreceptors in a highly cooperative manner (Hill coefficient ~12 in vivo; ~6 in vitro) [149]. Currently, little is known about the mechanism underlying this regulation. All that is known is that receptors, with the CheW and CheA proteins, form stable signaling complexes at the poles of the cells and that the modulation of CheA activity is not a result of signal complex dissociation and association [56]. Perhaps regulation of CheA autokinase activity involves the receptors imposing regulatory conformational changes on CheA. To explore such possibilities, it would be interesting to examine whether CheA's cooperativity is affected when CheA is allowed to form signaling complexes in the presence of receptors and CheW. Furthermore, it would be interesting to determine whether ligands bound to the receptors influence the degree of cooperativity observed when CheA binds TNP-ATP. 217
236 Future experiments should be directed towards answering three important questions regarding CheA's cooperative binding mechanism: (1) Does CheA bind ATP with the same negative cooperativity that was established for the nucleotide analogue, TNP-ATP; (2) Is cooperativity affected when CheA is 'coupled' with receptors and CheW in the absence of any chemoeffector; and (3) Do 'activated' receptors have an effect on the cooperative nature of CheA binding ATP. To address the first question, equilibrium binding titrations of the type defined in Chapter 2 can be performed using ATP and T. maritima CheA. First, a derivative of TmA must be engineered to carry a tryptophan in the ATP 'lid' region that could make TmA a fluorescent reporter of ATP binding (this protein would be similar to E. coli CheA F455W ). This CheA derivative could then be used in normal and reverse equilibrium binding titrations with ATP. If both the 'normal' and 'reverse' titrations produce an asymmetric fluorescence signal, these titrations can then be analyzed with DYNAFIT using the scripts provided in Appendix A (with the appropriate modifications) to determine the binding affinity at each nucleotide binding site. This approach would more likely work with TmA rather than with the previously characterized EcA F455W [154], as the T. maritima protein has a relatively low K d compared to E. coli CheA (K d >100 µm), and therefore background fluorescence would be minimized. To provide some insight into whether cooperativity in CheA is affected when this protein is part of signaling complexes, signaling complexes can be formed in vitro [26] and then used in equilibrium binding titrations as described in Chapter 2. Analysis of the fluorescence signal due to the "one TNP-ATP bound state" and the "two TNP-ATP 218
237 bound state" could then indicate whether formation of signaling clusters affects the nucleotide-binding affinity, the cooperativity, and the fluorescence asymmetry of the two ATP binding sites in the CheA dimer. To determine whether activated receptors in signaling complexes can affect the degree of cooperativity observed with CheA-nucleotide binding, signaling complexes can be formed using receptor molecules that carry mutations which render the receptors constitutively active [6]. Equilibrium binding titrations of the type described in Chapter 2 can then be performed with TNP-ATP. Results of these titrations can be analyzed and then compared to those obtained from using 'inactive' receptors (described in the previous paragraph). This analysis may determine whether the activity state of receptors in signaling complexes affects the cooperativity observed when CheA binds TNP-ATP, and this could provide some insight into the receptor-mediated regulation of CheA autophosphorylation. Another interesting question regarding CheA cooperativity is: How might CheA transmit information from one binding site to the other? In the crystal structure of the dimerized P3-P4-P5 domains of CheA, the two ATP binding sites are located at opposite poles of the dimer. Any type of communication from one ATP-binding site to the other site must be propagated through the P3 domains of the dimer. One way to explore this communication would be to map allosteric changes using NMR spectroscopy. This approach has recently been employed by Masterson et al. [110] to map the allosteric network in the eukaryotic protein kinase A. This approach could be a useful tool for 219
238 examining in detail the long-range allosteric effects that occur upon TNP-ATP binding to CheA. CheA is the first member in the family of histidine protein kinases for which cooperativity has been demonstrated. Is this a mechanism that is conserved among the HPK family, or is it unique to CheA? A survey of the HPK literature indicates that ATP binding has not been examined in any detail for most HPKs, so it is certainly possible that other HPKs exhibit cooperativity in their interactions with ATP. Future experiments will, I hope, address this issue. It is worth noting that most (if not all) HPK proteins are dimeric proteins and accomplish autophosphorylation using a trans-phosphorylation mechanism similar to that of CheA [100]. A priori, there is no reason why a histidine kinase would have to retain these features, so their retention makes it tempting to speculate that this provides some type of selective advantage over a simpler scenario in which each HPK would operate as a monomer. Perhaps a cooperative dimer affords regulatory opportunities not possible for a simple monomer that lacks cooperativity. As a starting point for answering the question of whether HPK-ATP cooperativity is a conserved feature of two-component systems, experiments similar to those described in Chapter 2 could be applied to EnvZ, a protein that is known to generate a robust fluorescence signal when it binds TNP-ATP [131]. In theory, other HPKs could be explored in a similar manner, but it remains to be determined which of these might bind TNP-ATP and in which circumstances a fluorescence signal can be observed. 220
239 Significance of Deciphering the CheA:TNP-ATP Binding Mechanism. X-ray crystallography and NMR studies of CheA have provided a considerable amount of detail regarding the structure of this protein. In particular, these studies helped establish how the ATP binding pocket is formed, how nucleotide analogues bind this pocket, and how CheA dimerizes [17, 18, 113, 194]. In addition, these structural studies have shed some light on the potential conformational changes that occur within CheA upon binding ATP [18]. However, these structural details of the CheA binding reaction are limited to snapshots of the protein either before the reaction occurs, or at the end of a reaction, and under conditions that are not "normal" for the reaction (e.g. temperature and concentration). In Chapter 3, by monitoring the fluorescence signal changes of the CheA:TNP-ATP complex formation using a stopped-flow instrument, I was able to 'watch' the entire CheA binding reaction in real-time and thereby deduce a three-step mechanism for this reaction. A specific, detailed understanding of the binding mechanism of the CheA:TNP- ATP complex could provide a starting point for further in-depth investigations of how CheA functions and how the chemotaxis system accomplishes regulation of CheA to effect changes in swimming patterns. For example, my results defining the TNP-ATP binding mechanism would enable kinetic competition experiments to study the binding of 'regular' ATP to CheA. The design of these competition experiments would involve rapidly mixing CheA with a solution of TNP-ATP and unmodified ATP. Analysis of these time courses could yield a detailed understanding of the kinetics of ATP binding, but this analysis is only possible because I have generated a detailed understanding of 221
240 TNP-ATP binding to CheA. In addition, above I raised the possibility that the TNP-ATP fluorescence signal could be used as a tool to investigate whether CheA-nucleotide interactions are affected when CheA is part of receptor:chew:chea signaling complexes. Understanding the nature of such effects would, of course, be possible only because the TNP-ATP binding mechanism for CheA (in the absence of these other proteins) has been worked out in detail. The graphical and numerical analyses I performed to define the three-step TNP- ATP binding mechanism demonstrates the synergy of the traditional graphical analysis and the MATLAB numerical integration analysis. A new kinetics program recently released, titled KinTekExplorer, is designed to study complex reaction mechanisms. Although aspects of this program are still under development, the KinTekExplorer program is more user-friendly for the biochemist than the MATLAB program used in this dissertation. This is not to dissuade use of the MATLAB program though, as the statistical analysis, brute-force calculations, and the flexibility/customization of this program are extremely useful to the kineticist. My work with the MATLAB program presented in this dissertation will hopefully provide a framework for future work that requires analysis of complicated kinetic data. 222
241 Appendices Appendix A-1: DYNAFIT scripts for EcP4 titrations "CheA-in-excess" [task] data task = equilibria = fit [mechanism] A + T <===> AT : kd1 dissoc [constants] kd1 = 0.2? [concentrations] T = 0.1 [responses] AT = ? [equilibria] variable A file./ [output] Directory./ [end] 223
242 "TNP-ATP-in-excess" [task] data task = equilibria = fit [mechanism] A + T <===> AT : kd1 dissoc [constants] kd1 = 0.2? [concentrations] T = 0.1 [responses] AT = ? [equilibria] variable T file./ [output] Directory./ [end] 224
243 Appendix A-2: DYNAFIT scripts for EcA titrations "CheA-in-excess" [task] data task = equilibria = fit [mechanism] AA + T <===> AA.T : K1 dissoc AA + T <===> T.AA : K1 dissoc AA.T + T <===> T.AA.T : K2 dissoc T.AA + T <===> T.AA.T : K2 dissoc [constants] K1 = 0.5? K2 = 0.5? [concentrations] T = 0.1 [responses] AA.T = T.AA = T.AA.T = [equilibria] variable AA file./ [output] Directory./ [end] 225
244 "TNP-ATP-in-excess" [task] data task = equilibria = fit [mechanism] AA + T <===> AA.T : K1 dissoc AA + T <===> T.AA : K1 dissoc AA.T + T <===> T.AA.T : K2 dissoc T.AA + T <===> T.AA.T : K2 dissoc [constants] K1 = 0.5? K2 = 0.5? [concentrations] AA = 0.05 [responses] AA.T = T.AA = T.AA.T = [equilibria] variable T file./ [output] directory./ [end] Note: Question marks refer to unknowns for which the program solves. 226
245 Note: Specific molar fluorescence response coefficients are calculated as constants relating concentration to the observed instrumental response (or fluorescence counts) where FC [T] or [AA] = Molar response T.AA molar response accounts for the starting T concentration in the CheA-in-excess titrations: 15,000/0.1 = 150,000 T.AA.T molar response accounts for the starting AA concentration in the TNP-ATP-inexcess titrations: 5,000/0.05 = 100,
246 Single-site binding equation for the following binding equilibrium: E + S K d ES [ES] = ([E tot ] + [S tot ] + K d ) ± ([E tot ] + [S tot ] + K d ) 2 4[E tot ][S tot ] 2[E tot ] Reference: 228
247 Appendix B-1: MATLAB script for global optimization of the association binding kinetics for TmP4 binding TNP-ATP. The following script is a compilation of 'm' files. Each file must be located in the active directory. The program is run from commands written in the notes.m file. Refer to reference [130] for further details. % "notes.m" command file clear diary name format long atime; aflu; aexpdata param = [ *ones(1,5) 1*ones(1,5)]' fsim = asimulate(param, t, C); PlotDS(t, fx, fsim, C,'FirstGraph'); floaters = [1*ones(1,8) 0*ones(1,10)]' ULimits = [Inf*ones(1,18)]' ParLim=[floaters zeros(18,1) param ULimits] fprintf('calling Fit\n'); [ParNew,residual,resnorm,Jac]=fit(t,fx,C,ParLim); [best_r, best_p] = randfit(t,fx,c, ParLim, 0.01) PlotDS(t, fx, fx-residual, C, 'Final') 229
248 % "mech.m" file system of equations to describe a three-step mechanism (mech. 3-2) function OUT = mech(t, y, flag, k) E = y(1); D = y(2); ED = y(3); EP = y(4); ET = y(5); % (Formation) - (Decay) E + D = ED = EP = ET OUT = [ k(2)*ed - k(1)*e*d k(2)*ed - k(1)*e*d k(1)*e*d + k(4)*ep - k(2)*ed - k(3)*ed k(3)*ed + k(6)*et - k(4)*ep - k(5)*ep k(5)*ep - k(6)*et ]; %de %dd %ded %dep %det end % "atime.m" time data file t= [ ]; % "aflu.m" fluorescence data file fx= [ ]; 230
249 % "aexpdata.m" experimental design data file C=[1, 2.25, 992; 1, 4.45, 1981; 1, 7.85, 2962; 1, 15.2, 3929; 1, 29.9, 4880 ]; % columns denote the starting concentrations for E D and last point in each time course % "asimulate.m" simulation file function fsim = asimulate(param, t, C) raten = 8; %number of unknowns: rate constants and FC n = size(c, 1); options = odeset(... 'RelTol', 1e-5,... 'AbsTol', 1e-7,... 'Jacobian', 'off'... ); fsim = [ ]; if length(param) ~= raten + n*2 disp('wrong number of parameters!'); return; end if length(t) ~= C(end,end) disp('wrong number of times'); return; end %SIMULATE ALL TRACES tstart = 1; for i = 1:n tcurr = t(tstart:c(i,end)); tstart = C(i,end) + 1; [tcurr, Y] = ode15s(... 'mech',... tcurr,... [C(i,1); C(i,2); 0; 0; 0],... options,... param(1:raten)); 231
250 f =... (Y(:,4)*param(7)+ Y(:,5)*param(8))*... param(raten + n + i)... + param(raten + i); fsim = [fsim; f]; end % "PlotDS.m" simulation file function PlotDS(t, fx, fsim, C,titleText) tstart = [1; C(1 : end-1, 3) + 1]; tend = C(:, 3); n = size(c, 1); scrsz = get(0,'screensize'); figure('position',[1 scrsz(4)*0.05 scrsz(3)/2 scrsz(4)*0.85]); for i = 1:n h1 = gca; plot(t(1:992),... hold on end fx(1:992),... 'r.',... t(993:1981),... fx(993:1981),... 'c.',... t(1982:2962),... fx(1982:2962),... 'm.',... t(2963:3929),... fx(2963:3929),... 'y.',... t(3930:4880),... fx(3930:4880),... 'g.') axis([ ]) %lines correlating with time and fluorescence % for each time course for i=1:n h2 = axes('position',get(h1,'position')); plot (t(tstart(i):tend(i)),... fsim(tstart(i):tend(i)),... 'k-','linewidth',2 ) axis([ ]) set(h2,'yaxislocation','right','color','none','xticklabel',[]) set(h2,'xlim',get(h1,'xlim'),'layer','top') end 232
251 % "compare.m" comparing simulated data to experimental data and calculates residuals function [wres] = compare(paropt, t, fx, C, ParLim, weights) optimize = find(parlim(:,1)); if length(optimize) ParLim(optimize, 3) = paropt; end wres = (fx - asimulate(parlim(:,3), t, C)).* weights; % "fit.m" minimizes residuals by finding the optimal set of parameters function [ParLim, residual, resnorm, Jac] = fit(t, fx, C, ParLim) fprintf('optimize\n') optimize = find(parlim(:,1)); weights = 1; if length(optimize) == 0 disp('no parameters to fit! Simulating...') end residual = compare([], t, fx, C, ParLim, 1); resnorm = []; Jac = []; return OPT = optimset('lsqcurvefit'); OPT = optimset(opt,'display','iter'); OPT = optimset(opt, 'TolX', 1e-4); t1 = [0;t(1:end-1)]; weights = t - t1; weights = weights + t1.*(weights <0); weights = weights / mean(weights); fprintf('calling Least Squares NonLinear fit') [x,resnorm,wres,exitflag,output,lamda,jac] =... lsqnonlin('compare',... ParLim(optimize, 3),... ParLim(optimize, 2),... ParLim(optimize, 4),... OPT,... t, fx, C, ParLim, weights); disp(output) ParLim(optimize, 3) = x; residual = wres./weights; [sigma2, stder, Corr] = NLRStat(resnorm, Jac) 233
252 % "NLRStat.m" analyzes the statistics of the nonlinear regression fitting function [sigma2, stder, Corr] = NLRStat(resnorm, Jac) [dpts, fpar] = size(jac); if dpts <= fpar disp('number of data points should be greater than number of fitting parameters.') return end sigma2 = resnorm / (dpts - fpar); VCM = full(inv(jac' * Jac) * sigma2); stder = full(sqrt(diag(vcm))); Corr = full(vcm./(stder*stder')); % "randfit.m" brute force method to locate a global minimum function [best_r, best_p] = randfit(t, fx, C, ParLim, stop) global CTR; CTR=1; if isa(stop, 'double') stop = now + stop/24; elseif isa(stop, 'char') stop = datenum(stop); if stop <=1 stop = floor(start) + stop; end end message=['calculation will stop on',' '...,datestr(stop,8),', ',datestr(stop,1),' after ',... datestr(stop,16)]; disp(message); best_r = Inf; best_p = []; Arch_p = []; Start_p = []; par_num = size(parlim,1); PaRand = ParLim; while now < stop fprintf('optimization %d\n',ctr) CTR=CTR+1; for i = 1:par_num if ParLim(i,1) 234
253 end if ParLim(i,4) == Inf if ParLim(i,2) == -Inf PaRand(i,3) = ParLim(i,3) * randn(1); else PaRand(i,3) = (ParLim(i,3) -... ParLim(i,2))*abs(randn(1)) + ParLim(i,2); end else PaRand(i,3) = ParLim(i,2) +... (ParLim(i,4)-ParLim(i,2))*rand(1); end end end Start_p = [Start_p, [PaRand(:,3)]]; save Start_p.txt Start_p -ascii -tabs [ParEnd, residual, resnorm, Jac] = fit(t, fx, C, PaRand); Arch_p = [Arch_p [resnorm; ParEnd(:,3)]]; save Arch_p.txt Arch_p -ascii -tabs if best_r > resnorm best_r = resnorm best_p = ParEnd end 235
254 Appendix B-2: MATLAB script for optimization of the dissociation kinetics for the TmP4:TNP-ATP complex. The fitting routine for the dissociation data requires the following '.m' files to replace the corresponding files in Appendix B-1. % "notes.m" command file clear diary name format long atime; aflu; aexpdata param = [ *ones(1,1)]' fsim = asimulate(param, t, C); PlotDS(t, fx, fsim, C,'FirstGraph'); floaters = [1*ones(1,1) 0*ones(1,6)]' ULimits = [Inf*ones(1,7)]' ParLim=[floaters zeros(7,1) param ULimits] fprintf('calling Fit\n'); [ParNew,residual,resnorm,Jac]=fit(t,fx,C,ParLim); [best_r, best_p] = randfit(t,fx,c, ParLim, 0.16) PlotDS(t, fx, fx-residual, C, 'Final') 236
255 % "mech.m" file function OUT = mech(t, y, flag, k) EP = y(1); ET = y(2); ES = y(3); E = y(4); S = y(5); % (Formation) - (Decay) EP = ET = ES = E + S OUT = [ k(2)*et - k(1)*ep k(1)*ep + k(4)*es - k(3)*et - k(2)*et k(3)*et - k(4)*es - k(5)*es k(5)*es k(5)*es]; %dep %det %des %de %ds end % "aexpdata.m" C=[1, 999]; % "asimulate.m" file function fsim = asimulate(param, t, C) raten = 5; n = size(c, 1); options = odeset(... 'RelTol', 1e-5,... 'AbsTol', 1e-7,... 'Jacobian', 'off'... ); fsim = [ ]; if length(param) ~= raten + n*2 disp('wrong number of parameters!'); return; end if length(t) ~= C(end,end) disp('wrong number of times'); return; end 237
256 %SIMULATE ALL TRACES tstart = 1; for i = 1:n tcurr = t(tstart:c(i,end)); tstart = C(i,end) + 1; [tcurr, Y] = ode15s(... 'mech',... tcurr,... [C(i,1); 0; 0; 0; 0],... options,... param(1:raten)); f =... (1.3447*Y(:,1) *Y(:,2))*... param(raten + n + i)... + param(raten + i); fsim = [fsim; f]; end % "PlotDS.m" function PlotDS(t, fx, fsim, C,titleText) tstart = [1; C(1 : end-1, 2) + 1]; tend = C(:, 2); n = size(c, 1); scrsz = get(0,'screensize'); figure('position',[1 scrsz(4)*0.05 scrsz(3)/2 scrsz(4)*0.85]); for i = 1:n h1 = gca; plot(t(1:999),... fx(1:999),... 'r.') axis([ ]) hold on end for i=1:n h2 = axes('position',get(h1,'position')); plot (t(tstart(i):tend(i)),... fsim(tstart(i):tend(i)),... 'k-','linewidth',2 ) axis([ ]) set(h2,'yaxislocation','right','color','none','xticklabel',[]) set(h2,'xlim',get(h1,'xlim'),'layer','top') end 238
257 Appendix B-3: MATLAB script for global optimization of the dissociation kinetics for EcP4:TNP-ATP. The fitting routine for the EcP4:TNP-ATP complex dissociation data requires the following '.m' file to replace the corresponding file in Appendix B-2. The major difference is the series of differential equations. I did not detail the changes in the remaining files that stem from this alteration. % "mech.m" file function OUT = mech(t, y, flag, k) EP = y(1); ET = y(2); E = y(3); S = y(4); % (Formation) - (Decay) EP = ET = E + S OUT = [ k(2)*et - k(1)*ep k(1)*ep - k(3)*et - k(2)*et k(3)*et k(3)*et]; %dep %det %de %ds end % "aexpdata.m" C=[0.5, 0.5, 999]; 239
258 Appendix C: Interpreting and Modeling the TNP-ATP Dissociation Reaction. In Chapter 3, I deferred discussion of two details that arose in my analysis of the P4:TNP-ATP dissociation reaction kinetics: (1) the final fluorescence signal at the end of the dissociation reactions was not as low as I expected for complete dissociation (this was evident with EcP4 not with TmP4); and (2) the three-step mechanism used to fit the TmP4 dissociation reaction data was not successful in attempts to fit the EcP4 dissociation reaction. In Figure C-1, I present a simple scenario that might account for these two observations. An underlying assumption in my analysis of TNP-ATP dissociation was that this reaction would proceed using the same basic steps as the association reaction, but in reverse. The basic idea presented in Figure C-1 is that this might not have been strictly correct because the experiment I used to monitor TNP-ATP dissociation might have created an unusual situation in which both TNP-ATP and ATP were simultaneously bound to a single P4 molecule. Consider, first, that TNP-ATP can be viewed as a bidentate ligand with two major contributing sets of binding determinats (one set for TNP and one set for ATP) [43]. This raises the possibility that a single P4 molecule could simultaneously bind both one molecule of TNP-ATP (via contacts with the TNP segment) and one molecule of 'normal' ATP; in Figure C-1, I refer to this as an A E T complex. Of course, the 'regular ATP' in this complex would face stiff competition from the ATP segment of TNP-ATP because the latter would be present at very high effective 240


259 Figure C-1. Model depicting the dissociation of TNP-ATP from CheA when in the presence of excess ATP. TNP-ATP is a bidentate ligand, where the TNP and ATP portions have their own binding sites within the CheA active site and therefore each has their own binding affinity that contributes to the overall binding affinity of TNP-ATP to CheA. This model shows how a dissociation reaction essentially skips over the ES state as the TNP portion remains bound to its binding site while free ATP displaces the tethered ATP from its binding site. 241
return in class, or Rm B
 Last lectures: Genetic Switches and Oscillators PS #2 due today bf before 3PM return in class, or Rm. 68 371B Naturally occurring: lambda lysis-lysogeny decision lactose operon in E. coli Engineered: genetic
56:198:582 Biological Networks Lecture 11
 56:198:582 Biological Networks Lecture 11 Network Motifs in Signal Transduction Networks Signal transduction networks Signal transduction networks are composed of interactions between signaling proteins.
Bacterial Chemotaxis
 Bacterial Chemotaxis Bacteria can be attracted/repelled by chemicals Mechanism? Chemoreceptors in bacteria. attractant Adler, 1969 Science READ! This is sensing, not metabolism Based on genetic approach!!!
Dynamic receptor team formation can explain the high signal transduction gain in E. coli
 Dynamic receptor team formation can explain the high signal transduction gain in E coli Réka Albert, Yu-wen Chiu and Hans G Othmer School of Mathematics, University of Minnesota, Minneapolis, MN 55455
Signal transduction in bacterial chemotaxis
 Signal transduction in bacterial chemotaxis Melinda D. Baker, 1 Peter M. Wolanin, 2 and Jeffry B. Stock 1,2 * Summary Motile bacteria respond to environmental cues to move to more favorable locations.
Bacterial chemotaxis and the question of high gain in signal transduction. Réka Albert Department of Physics
 Bacterial chemotaxis and the question of high gain in signal transduction Réka Albert Department of Physics E. coli lives in the gut and takes up nutrients through its pores E. coli moves by rotating its
Aspartate chemosensory receptor signalling in Campylobacter jejuni. Author. Published. Journal Title DOI. Copyright Statement.
 Aspartate chemosensory receptor signalling in Campylobacter jejuni Author Korolik, Victoria Published 2010 Journal Title Virulence DOI https://doi.org/10.4161/viru.1.5.12735 Copyright Statement The Author(s)
Excitation and Adaptation in Bacteria a Model Signal Transduction System that Controls Taxis and Spatial Pattern Formation
 Int. J. Mol. Sci. 2013, xx, 1-x; doi:10.3390/ OPEN ACCESS International Journal of Molecular Sciences ISSN 1422-0067 www.mdpi.com/journal/ijms Article Excitation and Adaptation in Bacteria a Model Signal
A model of excitation and adaptation in bacterial chemotaxis
 Proc. Natl. Acad. Sci. USA Vol. 94, pp. 7263 7268, July 1997 Biochemistry A model of excitation and adaptation in bacterial chemotaxis PETER A. SPIRO*, JOHN S. PARKINSON, AND HANS G. OTHMER* Departments
Excitation and Adaptation in Bacteria a Model Signal Transduction System that Controls Taxis and Spatial Pattern Formation
 Int. J. Mol. Sci. 2013, 14, 9205-9248; doi:10.3390/ijms14059205 OPEN ACCESS International Journal of Molecular Sciences ISSN 1422-0067 www.mdpi.com/journal/ijms Article Excitation and Adaptation in Bacteria
9/25/2011. Outline. Overview: The Energy of Life. I. Forms of Energy II. Laws of Thermodynamics III. Energy and metabolism IV. ATP V.
 Chapter 8 Introduction to Metabolism Outline I. Forms of Energy II. Laws of Thermodynamics III. Energy and metabolism IV. ATP V. Enzymes Overview: The Energy of Life Figure 8.1 The living cell is a miniature
Regulation and signaling. Overview. Control of gene expression. Cells need to regulate the amounts of different proteins they express, depending on
 Regulation and signaling Overview Cells need to regulate the amounts of different proteins they express, depending on cell development (skin vs liver cell) cell stage environmental conditions (food, temperature,
Two-Component Regulatory System
 Two-Component Regulatory System Two Component Regulatory Systems A two-component regulatory system is a signal transduction system that uses the transfer of phosphoryl groups to control gene transcription
Chemotaxis. Definition : The directed motion of organisms towards or away from chemical attractants or repellents.
 Bacterial Chemotaxis We will discuss the strategies of how bacteria swim towards food: o How do they detect the food source o How do they move at low Reynolds numbers o How do they control this movement
Protein connectivity in chemotaxis receptor complexes. Abstract. Author Summary. Stephan Eismann 1,2, Robert G Endres 2,*,
 Protein connectivity in chemotaxis receptor complexes Stephan Eismann 1,2, Robert G Endres 2,*, 1 Department of Physics and Astronomy, University of Heidelberg, Heidelberg, Germany 2 Department of Life
Transmembrane Domains (TMDs) of ABC transporters
 of ABC transporters") Transmembrane Domains (TMDs) of ABC transporters Most ABC transporters contain heterodimeric TMDs (e.g. HisMQ, MalFG) TMDs show only limited sequence homology (high diversity) High degree of conservation
Transmembrane Domains (TMDs) of ABC transporters Most ABC transporters contain heterodimeric TMDs (e.g. HisMQ, MalFG) TMDs show only limited sequence homology (high diversity) High degree of conservation
The chemotaxis network of E. coli
 The chemotaxis network of E. coli Ned Wingreen Boulder Summer School 2007 Thanks to: Robert Endres, Clint Hansen, Juan Keymer, Yigal Meir, Mica Skoge, and Victor Sourjik Support from HFSP Adaptati Adaptati
Dynamic Receptor Team Formation Can Explain the High Signal Transduction Gain in Escherichia coli
 2650 Biophysical Journal Volume 86 May 2004 2650 2659 Dynamic Receptor Team Formation Can Explain the High Signal Transduction Gain in Escherichia coli Réka Albert, Yu-wen Chiu, and Hans G. Othmer School
Bacterial histidine kinase as signal sensor and transducer
 The International Journal of Biochemistry & Cell Biology xxx (2005) xxx xxx Molecules in focus Bacterial histidine kinase as signal sensor and transducer Ahmad Khorchid, Mitsuhiko Ikura Division of Molecular
Design Principles of a Bacterial Signalling Network
 Design Principles of a Bacterial Signalling Network Why is chemotaxis more complicated than needed? Jens Timmer Freiburg Institute for Advanced Studies Center for Systems Biology Center for Data Analysis
Introduction. Gene expression is the combined process of :
 1 To know and explain: Regulation of Bacterial Gene Expression Constitutive ( house keeping) vs. Controllable genes OPERON structure and its role in gene regulation Regulation of Eukaryotic Gene Expression
Using Evolutionary Approaches To Study Biological Pathways. Pathways Have Evolved
 Pathways Have Evolved Using Evolutionary Approaches To Study Biological Pathways Orkun S. Soyer The Microsoft Research - University of Trento Centre for Computational and Systems Biology Protein-protein
An Introduction to Metabolism
 CAMPBELL BIOLOGY IN FOCUS Urry Cain Wasserman Minorsky Jackson Reece 6 An Introduction to Metabolism Lecture Presentations by Kathleen Fitzpatrick and Nicole Tunbridge Overview: The Energy of Life The
BIOLOGY 10/11/2014. An Introduction to Metabolism. Outline. Overview: The Energy of Life
 8 An Introduction to Metabolism CAMPBELL BIOLOGY TENTH EDITION Reece Urry Cain Wasserman Minorsky Jackson Outline I. Forms of Energy II. Laws of Thermodynamics III. Energy and metabolism IV. ATP V. Enzymes
An Introduction to Metabolism
 Chapter 8 An Introduction to Metabolism PowerPoint Lecture Presentations for Biology Eighth Edition Neil Campbell and Jane Reece Lectures by Chris Romero, updated by Erin Barley with contributions from
Chapter 6- An Introduction to Metabolism*
 Chapter 6- An Introduction to Metabolism* *Lecture notes are to be used as a study guide only and do not represent the comprehensive information you will need to know for the exams. The Energy of Life
An Introduction to Metabolism
 An Introduction to Metabolism I. All of an organism=s chemical reactions taken together is called metabolism. A. Metabolic pathways begin with a specific molecule, which is then altered in a series of
Activation of a receptor. Assembly of the complex
 Activation of a receptor ligand inactive, monomeric active, dimeric When activated by growth factor binding, the growth factor receptor tyrosine kinase phosphorylates the neighboring receptor. Assembly
An Introduction to Metabolism
 Chapter 8 An Introduction to Metabolism Dr. Wendy Sera Houston Community College Biology 1406 Key Concepts in Chapter 8 1. An organism s metabolism transforms matter and energy, subject to the laws of
arxiv:physics/ v2 [physics.bio-ph] 24 Aug 1999
![arxiv:physics/ v2 [physics.bio-ph] 24 Aug 1999](/thumbs/83/88149091.jpg "arxiv:physics/ v2 [physics.bio-ph] 24 Aug 1999") Adaptive Ising Model of Bacterial Chemotactic Receptor Network Yu Shi arxiv:physics/9901053v2 [physics.bio-ph] 24 Aug 1999 Cavendish Laboratory, University of Cambridge, Cambridge CB3 0HE, United Kingdom
Adaptive Ising Model of Bacterial Chemotactic Receptor Network Yu Shi arxiv:physics/9901053v2 [physics.bio-ph] 24 Aug 1999 Cavendish Laboratory, University of Cambridge, Cambridge CB3 0HE, United Kingdom
An Introduction to Metabolism
 Chapter 8 An Introduction to Metabolism PowerPoint Lecture Presentations for Biology Eighth Edition Neil Campbell and Jane Reece Lectures by Chris Romero, updated by Erin Barley with contributions from
BACTERIAL PHYSIOLOGY SMALL GROUP. Monday, August 25, :00pm. Faculty: Adam Driks, Ph.D. Alan Wolfe, Ph.D.
 BACTERIAL PHYSIOLOGY SMALL GROUP Monday, August 25, 2014 1:00pm Faculty: Adam Driks, Ph.D. Alan Wolfe, Ph.D. Learning Goal To understand how bacterial physiology applies to the diagnosis and treatment
56:198:582 Biological Networks Lecture 10
 56:198:582 Biological Networks Lecture 10 Temporal Programs and the Global Structure The single-input module (SIM) network motif The network motifs we have studied so far all had a defined number of nodes.
Lecture 10: Cyclins, cyclin kinases and cell division
 Chem*3560 Lecture 10: Cyclins, cyclin kinases and cell division The eukaryotic cell cycle Actively growing mammalian cells divide roughly every 24 hours, and follow a precise sequence of events know as
An Introduction to Metabolism
 Chapter 8 An Introduction to Metabolism Edited by Shawn Lester PowerPoint Lecture Presentations for Biology Eighth Edition Neil Campbell and Jane Reece Lectures by Chris Romero, updated by Erin Barley
Metabolism and Energy. Mrs. Stahl AP Biology
 Metabolism and Energy Mrs. Stahl AP Biology The Energy of Life The living cell is a miniature chemical factory where thousands of reactions occur The cell extracts energy stored in sugars and other fuels
BIOLOGY. An Introduction to Metabolism CAMPBELL. Reece Urry Cain Wasserman Minorsky Jackson
 CAMPBELL BIOLOGY TENTH EDITION Reece Urry Cain Wasserman Minorsky Jackson 8 An Introduction to Metabolism Lecture Presentation by Nicole Tunbridge and Kathleen Fitzpatrick The Energy of Life The living
Serine-7 but not serine-5 phosphorylation primes RNA polymerase II CTD for P-TEFb recognition
 Supplementary Information to Serine-7 but not serine-5 phosphorylation primes RNA polymerase II CTD for P-TEFb recognition Nadine Czudnochowski 1,2, *, Christian A. Bösken 1, * & Matthias Geyer 1 1 Max-Planck-Institut
An Introduction to Metabolism
 An Introduction to Metabolism Chapter 8 Objectives Distinguish between the following pairs of terms: catabolic and anabolic pathways; kinetic and potential energy; open and closed systems; exergonic and
1.9 Practice Problems
 1.9 Practice Problems 1. Solution: B It s not only chlorophyll a but a combination of pigments. 2. Solution: D See at what wavelength rate of photosynthesis is the highest. 3. Solution: D It s a fact.
4 Examples of enzymes
 Catalysis 1 4 Examples of enzymes Adding water to a substrate: Serine proteases. Carbonic anhydrase. Restrictions Endonuclease. Transfer of a Phosphoryl group from ATP to a nucleotide. Nucleoside monophosphate
Bio Microbiology - Spring 2014 Learning Guide 04.
 Bio 230 - Microbiology - Spring 2014 Learning Guide 04 http://pessimistcomic.blogspot.com/ Cell division is a part of a replication cycle that takes place throughout the life of the bacterium A septum
Systems Biology Across Scales: A Personal View XIV. Intra-cellular systems IV: Signal-transduction and networks. Sitabhra Sinha IMSc Chennai
 Systems Biology Across Scales: A Personal View XIV. Intra-cellular systems IV: Signal-transduction and networks Sitabhra Sinha IMSc Chennai Intra-cellular biochemical networks Metabolic networks Nodes:
Chapter 8 Notes. An Introduction to Metabolism
 Chapter 8 Notes An Introduction to Metabolism Describe how allosteric regulators may inhibit or stimulate the activity of an enzyme. Objectives Distinguish between the following pairs of terms: catabolic
Chapter 6. Ground Rules Of Metabolism
 Chapter 6 Ground Rules Of Metabolism Alcohol Dehydrogenase An enzyme Breaks down ethanol and other toxic alcohols Allows humans to drink Metabolism Is the totality of an organism s chemical reactions Arises
Diversity in Chemotaxis Mechanisms among the Bacteria and Archaea
 MICROBIOLOGY AND MOLECULAR BIOLOGY REVIEWS, June 2004, p. 301 319 Vol. 68, No. 2 1092-2172/04/$08.00 0 DOI: 10.1128/MMBR.68.2.301 319.2004 Copyright 2004, American Society for Microbiology. All Rights
An Introduction to Metabolism
 LECTURE PRESENTATIONS For CAMPBELL BIOLOGY, NINTH EDITION Jane B. Reece, Lisa A. Urry, Michael L. Cain, Steven A. Wasserman, Peter V. Minorsky, Robert B. Jackson Chapter 8 An Introduction to Metabolism
RNA Synthesis and Processing
 RNA Synthesis and Processing Introduction Regulation of gene expression allows cells to adapt to environmental changes and is responsible for the distinct activities of the differentiated cell types that
An Introduction to Metabolism
 CAMPBELL BIOLOGY IN FOCUS URRY CAIN WASSERMAN MINORSKY REECE 6 An Introduction to Metabolism Lecture Presentations by Kathleen Fitzpatrick and Nicole Tunbridge, Simon Fraser University SECOND EDITION The
An Introduction to Metabolism
 LECTURE PRESENTATIONS For CAMPBELL BIOLOGY, NINTH EDITION Jane B. Reece, Lisa A. Urry, Michael L. Cain, Steven A. Wasserman, Peter V. Minorsky, Robert B. Jackson Chapter 8 An Introduction to Metabolism
Signal Transduction Phosphorylation Protein kinases. Misfolding diseases. Protein Engineering Lysozyme variants
 Signal Transduction Phosphorylation Protein kinases Misfolding diseases Protein Engineering Lysozyme variants Cells and Signals Regulation The cell must be able to respond to stimuli Cellular activities
ENZYME KINETICS. Medical Biochemistry, Lecture 24
 ENZYME KINETICS Medical Biochemistry, Lecture 24 Lecture 24, Outline Michaelis-Menten kinetics Interpretations and uses of the Michaelis- Menten equation Enzyme inhibitors: types and kinetics Enzyme Kinetics
Gene regulation I Biochemistry 302. Bob Kelm February 25, 2005
 Gene regulation I Biochemistry 302 Bob Kelm February 25, 2005 Principles of gene regulation (cellular versus molecular level) Extracellular signals Chemical (e.g. hormones, growth factors) Environmental
Initiation of translation in eukaryotic cells:connecting the head and tail
 Initiation of translation in eukaryotic cells:connecting the head and tail GCCRCCAUGG 1: Multiple initiation factors with distinct biochemical roles (linking, tethering, recruiting, and scanning) 2: 5
An Introduction to Metabolism
 CAMPBELL BIOLOGY IN FOCUS URRY CAIN WASSERMAN MINORSKY REECE 6 An Introduction to Metabolism Lecture Presentations by Kathleen Fitzpatrick and Nicole Tunbridge, Simon Fraser University SECOND EDITION The
Chapter 8: An Introduction to Metabolism. 1. Energy & Chemical Reactions 2. ATP 3. Enzymes & Metabolic Pathways
 Chapter 8: An Introduction to Metabolism 1. Energy & Chemical Reactions 2. ATP 3. Enzymes & Metabolic Pathways 1. Energy & Chemical Reactions 2 Basic Forms of Energy Kinetic Energy (KE) energy in motion
C a h p a t p e t r e r 6 E z n y z m y e m s
 Chapter 6 Enzymes 4. Examples of enzymatic reactions acid-base catalysis: give and take protons covalent catalysis: a transient covalent bond is formed between the enzyme and the substrate metal ion catalysis:
General Biology. The Energy of Life The living cell is a miniature factory where thousands of reactions occur; it converts energy in many ways
 Course No: BNG2003 Credits: 3.00 General Biology 5. An Introduction into Cell Metabolism The Energy of Life The living cell is a miniature factory where thousands of reactions occur; it converts energy
Gene Control Mechanisms at Transcription and Translation Levels
 Gene Control Mechanisms at Transcription and Translation Levels Dr. M. Vijayalakshmi School of Chemical and Biotechnology SASTRA University Joint Initiative of IITs and IISc Funded by MHRD Page 1 of 9
From molecules to behavior: E. coli s memory, computation and chemotaxis
 From molecules to behavior: E. coli s memory, computation and chemotaxis Yuhai Tu Physical Sciences & Computational Biology Center IBM T. J. Watson Research Center Acknowledgements: IBM Research Bernardo
7.2 Bacterial chemotaxis, or how bacteria think
 Chapter 7: Robustness in bacterial chemotaxis 30/4/18-TB 7.1 Introduction We saw how bifunctional proteins can make the input-output relation of a signaling circuit precise despite variation in protein
Selective allosteric coupling in core chemotaxis signaling complexes
 Selective allosteric coupling in core chemotaxis signaling complexes Mingshan Li ( 李明山 ) and Gerald L. Hazelbauer 1 Department of Biochemistry, University of Missouri Columbia, Columbia, MO 65211 Edited
Advanced Higher Biology. Unit 1- Cells and Proteins 2c) Membrane Proteins
 Membrane Proteins") Advanced Higher Biology Unit 1- Cells and Proteins 2c) Membrane Proteins Membrane Structure Phospholipid bilayer Transmembrane protein Integral protein Movement of Molecules Across Membranes Phospholipid
Advanced Higher Biology Unit 1- Cells and Proteins 2c) Membrane Proteins Membrane Structure Phospholipid bilayer Transmembrane protein Integral protein Movement of Molecules Across Membranes Phospholipid
An Introduction to Metabolism
 Chapter 8 An Introduction to Metabolism oweroint Lectures for Biology, Seventh Edition Neil Campbell and Jane Reece Concept 8.1: An organism s metabolism transforms matter and energy, subject to the laws
Two-Component Signal Transduction Systems
 Stimulus-Response coupling by Two-component Regulator systems TR act as a stimulus-response system. detection of environmental signal transduce signal to effector protein initiate response Most transcriptional
CHEMISTRY (CHE) CHE 104 General Descriptive Chemistry II 3
 CHE 104 General Descriptive Chemistry II 3") Chemistry (CHE) 1 CHEMISTRY (CHE) CHE 101 Introductory Chemistry 3 Survey of fundamentals of measurement, molecular structure, reactivity, and organic chemistry; applications to textiles, environmental,
Chemistry (CHE) 1 CHEMISTRY (CHE) CHE 101 Introductory Chemistry 3 Survey of fundamentals of measurement, molecular structure, reactivity, and organic chemistry; applications to textiles, environmental,
BIOREPS Problem Set #4 Adaptation and cooperation
 BIOREPS Problem Set #4 Adaptation and cooperation 1 Background Adaptation is one of the most distinctive features of our physical senses. The thermoreceptors in our skin react sharply to the change in
Reading for today: Chapter 16 (selections from Sections A, B and C) Friday and Monday: Chapter 17 (Diffusion)
 Friday and Monday: Chapter 17 (Diffusion)") Lecture 29 Enzymes Reading for today: Chapter 6 (selections from Sections, B and C) Friday and Monday: Chapter 7 (Diffusion) 4/3/6 Today s Goals Michaelis-Menten mechanism for simple enzyme reactions:
Lecture 29 Enzymes Reading for today: Chapter 6 (selections from Sections, B and C) Friday and Monday: Chapter 7 (Diffusion) 4/3/6 Today s Goals Michaelis-Menten mechanism for simple enzyme reactions:
Chapter 16 Lecture. Concepts Of Genetics. Tenth Edition. Regulation of Gene Expression in Prokaryotes
 Chapter 16 Lecture Concepts Of Genetics Tenth Edition Regulation of Gene Expression in Prokaryotes Chapter Contents 16.1 Prokaryotes Regulate Gene Expression in Response to Environmental Conditions 16.2
f) Adding an enzyme does not change the Gibbs free energy. It only increases the rate of the reaction by lowering the activation energy.
 Adding an enzyme does not change the Gibbs free energy. It only increases the rate of the reaction by lowering the activation energy.") Problem Set 2-Answer Key BILD1 SP16 1) How does an enzyme catalyze a chemical reaction? Define the terms and substrate and active site. An enzyme lowers the energy of activation so the reaction proceeds
Problem Set 2-Answer Key BILD1 SP16 1) How does an enzyme catalyze a chemical reaction? Define the terms and substrate and active site. An enzyme lowers the energy of activation so the reaction proceeds
CHAPTER 8. An Introduction to Metabolism
 CHAPTER 8 An Introduction to Metabolism WHAT YOU NEED TO KNOW: Examples of endergonic and exergonic reactions. The key role of ATP in energy coupling. That enzymes work by lowering the energy of activation.
BA, BSc, and MSc Degree Examinations
 Examination Candidate Number: Desk Number: BA, BSc, and MSc Degree Examinations 2017-8 Department : BIOLOGY Title of Exam: Molecular Biology and Biochemistry Part I Time Allowed: 1 hour and 30 minutes
BSc and MSc Degree Examinations
 Examination Candidate Number: Desk Number: BSc and MSc Degree Examinations 2018-9 Department : BIOLOGY Title of Exam: Molecular Biology and Biochemistry Part I Time Allowed: 1 hour and 30 minutes Marking
Mutational Analysis of the Connector Segment in the HAMP Domain of Tsr, the Escherichia coli Serine Chemoreceptor
 JOURNAL OF BACTERIOLOGY, Oct. 2008, p. 6676 6685 Vol. 190, No. 20 0021-9193/08/$08.00 0 doi:10.1128/jb.00750-08 Copyright 2008, American Society for Microbiology. All Rights Reserved. Mutational Analysis
An Introduction to Metabolism
 Chapter 8 1 An Introduction to Metabolism PowerPoint Lecture Presentations for Biology Eighth Edition Neil Campbell and Jane Reece Lectures by Chris Romero, updated by Erin Barley with contributions from
Host-Pathogen Interaction. PN Sharma Department of Plant Pathology CSK HPKV, Palampur
 Host-Pathogen Interaction PN Sharma Department of Plant Pathology CSK HPKV, Palampur-176062 PATHOGEN DEFENCE IN PLANTS A BIOLOGICAL AND MOLECULAR VIEW Two types of plant resistance response to potential
Enzyme Enzymes are proteins that act as biological catalysts. Enzymes accelerate, or catalyze, chemical reactions. The molecules at the beginning of
 Enzyme Enzyme Enzymes are proteins that act as biological catalysts. Enzymes accelerate, or catalyze, chemical reactions. The molecules at the beginning of the process are called substrates and the enzyme
Richik N. Ghosh, Linnette Grove, and Oleg Lapets ASSAY and Drug Development Technologies 2004, 2:
 1 3/1/2005 A Quantitative Cell-Based High-Content Screening Assay for the Epidermal Growth Factor Receptor-Specific Activation of Mitogen-Activated Protein Kinase Richik N. Ghosh, Linnette Grove, and Oleg
Signal Transduction. Dr. Chaidir, Apt
 Signal Transduction Dr. Chaidir, Apt Background Complex unicellular organisms existed on Earth for approximately 2.5 billion years before the first multicellular organisms appeared.this long period for
Supplementary Information
 Supplementary Information Contents 1. Main Findings of this Work 2 2. Description of the Mathematical Modelling 2 2.1. Brief Introduction to Bacterial Chemotaxis 2 2.2. Two-State Model of Bacterial Chemotaxis
Hybrid Quorum sensing in Vibrio harveyi- two component signalling
 Hybrid Quorum sensing in Vibrio harveyi- two component signalling Dr. M. Vijayalakshmi School of Chemical and Biotechnology SASTRA University Joint Initiative of IITs and IISc Funded by MHRD Page 1 of
BMB Lecture 7. Allostery and Cooperativity
 BMB 178 2017 Lecture 7 October 18, 2017 Allostery and Cooperativity A means for exquisite control Allostery: the basis of enzymatic control From the Greek: allos = other stereos = solid or space Action
Rex-Family Repressor/NADH Complex
 Kasey Royer Michelle Lukosi Rex-Family Repressor/NADH Complex Part A The biological sensing protein that we selected is the Rex-family repressor/nadh complex. We chose this sensor because it is a calcium
Energy Transformation, Cellular Energy & Enzymes (Outline)
") Energy Transformation, Cellular Energy & Enzymes (Outline) Energy conversions and recycling of matter in the ecosystem. Forms of energy: potential and kinetic energy The two laws of thermodynamic and definitions
Energy Transformation, Cellular Energy & Enzymes (Outline) Energy conversions and recycling of matter in the ecosystem. Forms of energy: potential and kinetic energy The two laws of thermodynamic and definitions
ATP ATP. The energy needs of life. Living economy. Where do we get the energy from? 9/11/2015. Making energy! Organisms are endergonic systems
 Making energy! ATP The energy needs of life rganisms are endergonic systems What do we need energy for? synthesis building biomolecules reproduction movement active transport temperature regulation 2007-2008
COMPUTER SIMULATION OF DIFFERENTIAL KINETICS OF MAPK ACTIVATION UPON EGF RECEPTOR OVEREXPRESSION
 COMPUTER SIMULATION OF DIFFERENTIAL KINETICS OF MAPK ACTIVATION UPON EGF RECEPTOR OVEREXPRESSION I. Aksan 1, M. Sen 2, M. K. Araz 3, and M. L. Kurnaz 3 1 School of Biological Sciences, University of Manchester,
Problem Set 5 Question 1
 2.32 Problem Set 5 Question As discussed in class, drug discovery often involves screening large libraries of small molecules to identify those that have favorable interactions with a certain druggable
Computational Biology 1
 Computational Biology 1 Protein Function & nzyme inetics Guna Rajagopal, Bioinformatics Institute, guna@bii.a-star.edu.sg References : Molecular Biology of the Cell, 4 th d. Alberts et. al. Pg. 129 190
Chapter 16. Cellular Movement: Motility and Contractility. Lectures by Kathleen Fitzpatrick Simon Fraser University Pearson Education, Inc.
 Chapter 16 Cellular Movement: Motility and Contractility Lectures by Kathleen Fitzpatrick Simon Fraser University Two eukaryotic motility systems 1. Interactions between motor proteins and microtubules
Chapter 6. The interaction of Src SH2 with the focal adhesion kinase catalytic domain studied by NMR
 The interaction of Src SH2 with the focal adhesion kinase catalytic domain studied by NMR 103 Abstract The interaction of the Src SH2 domain with the catalytic domain of FAK, including the Y397 SH2 domain
3.B.1 Gene Regulation. Gene regulation results in differential gene expression, leading to cell specialization.
 3.B.1 Gene Regulation Gene regulation results in differential gene expression, leading to cell specialization. We will focus on gene regulation in prokaryotes first. Gene regulation accounts for some of
Chem Lecture 10 Signal Transduction
 Chem 452 - Lecture 10 Signal Transduction 111202 Here we look at the movement of a signal from the outside of a cell to its inside, where it elicits changes within the cell. These changes are usually mediated
An Introduction to Metabolism. Chapter 8
 An Introduction to Metabolism Chapter 8 METABOLISM I. Introduction All of an organism s chemical reactions Thousands of reactions in a cell Example: digest starch use sugar for energy and to build new
Bio Microbiology - Spring 2012 Learning Guide 04.
 Bio 230 - Microbiology - Spring 2012 Learning Guide 04 http://pessimistcomic.blogspot.com/ A septum assembles at the center of the cell. This molecular "purse string" is linked to the inner surface of
An Introduction to Metabolism
 An Introduction to Metabolism The living cell is a microscopic factory where life s giant processes can be performed: -sugars to amino acids to proteins and vise versa -reactions to dismantle polymers
Marvels of Bacterial Behavior
 Marvels of Bacterial Behavior The Harvard community has made this article openly available. Please share how this access benefits you. Your story matters. Citation Published Version Accessed Citable Link
Energy, Enzymes, and Metabolism. Energy, Enzymes, and Metabolism. A. Energy and Energy Conversions. A. Energy and Energy Conversions
 Energy, Enzymes, and Metabolism Lecture Series 6 Energy, Enzymes, and Metabolism B. ATP: Transferring Energy in Cells D. Molecular Structure Determines Enzyme Fxn Energy is the capacity to do work (cause
Chapter 6: Energy and Metabolism
 Chapter 6: Energy and Metabolism Student: 1. Oxidation and reduction reactions are chemical processes that result in a gain or loss in A) atoms. B) neutrons. C) electrons. D) molecules. E) protons. 2.
Honors Biology Reading Guide Chapter 11
 Honors Biology Reading Guide Chapter 11 v Promoter a specific nucleotide sequence in DNA located near the start of a gene that is the binding site for RNA polymerase and the place where transcription begins
BMB Lecture 7. Allostery and Cooperativity. A means for exquisite control
 BMB 178 2018 Lecture 7 Allostery and Cooperativity A means for exquisite control Allostery: the basis of enzymatic control From the Greek: allos = other stereos = solid or space Action at a distance Examples