IS KIN RECOGNITION IN CAKILE EDENTULA AFFECTED BY NUTRIENT AVAILABILITY?
|
|
|
- Ophelia Taylor
- 6 years ago
- Views:
Transcription
1 IS KIN RECOGNITION IN CAKILE EDENTULA AFFECTED BY NUTRIENT AVAILABILITY?
2 IS KIN RECOGNITION IN CAKILE EDENTULA AFFECTED BY NUTRIENT AVAILABILITY? BY MUDRA V. BHATT, B.Sc. A Thesis Submitted to the School of Graduate Studies in Partial Fulfilment of the Requirements for the Degree Master of Science McMaster University Copyright by Mudra Bhatt, April 2013
3 MASTER OF SCIENCE (2013) McMaster University (Biology) Hamilton, Ontario TITLE: Is kin recognition in cakile edentula affected by nutrient availability? AUTHOR: Mudra V. Bhatt SUPERVISOR: Dr. Susan A. Dudley NUMBER OF PAGES: xiv, 92 ii
4 ABSTRACT As plants are sessile organisms, detecting the presence of neighboring plants and exhibiting competitive behavior to acquire limiting resources is crucial. One of the ways plants respond to belowground competition is by allocation to fine roots in order to acquire the limited resources. However, this phenotypic plasticity can be costly as it assigns resources away from reproduction. Being able to recognize the relatedness of one s neighbours and preferentially compete with strangers is a beneficial trait that can minimize the costs of competition with relatives and increases inclusive fitness. Many studies have looked at the association between resource availability and competition in plants while others have observed kin recognition in several plants species. However, no one has yet studied the effect of resource availability on kin recognition in plants. Here, I looked at root architecture to test if there is an association between kin recognition and nutrient availability in Cakile edentula. I found that the root system architecture is highly plastic and complex, showing variable responses to neighbour identity signals and resource availability. The results from the four experiments demonstrate that the responses of C. edentula to neighbour relatedness are dependent on nutrient availability. Additionally, this study also indicates that kin recognition in C. edentula does not require root contact; instead it occurs through a signal found in soluble compounds excreted from plants, possibly root exudates, as observed in Arabidopsis thaliana (Biedrzycki et al. 2010). iii
5 In conclusion, this study provides novel findings regarding the dynamics of root behavior in response to nutrient availability and the relatedness of neighbours. iv
6 ACKNOWLEDGEMENTS I would foremost like to thank my supervisor, Dr. Susan A. Dudley, for her continuous patience, guidance and support. Next, I would like to thank my committee members, Dr. Robin Cameron and Dr. Harsh Bais, for their helpful advices. I wish to thank Amanda File and Guillermo Murphy for being my academic siblings and creating a great work environment; Patrick Langille and Alexandra Jennings for their assistance in harvesting. Finally, I would like to thank my parents and Vrushank Lakhia for all the support and encouragement. v
7 TABLE OF CONTENTS Abstract...iii Acknowledgements.....v Table of Contents....vi List of Figures...viii List of Tables...xi Chapter 1: Introduction Aboveground and belowground competition through phenotypic plasticity Kin recognition in plants Root exudates as the basis for kin recognition in plants Effect of Resource Limitation on Kin Recognition Root architecture Outline of this study Chapter 2: Methods Study species Experimental design Data collection Data analysis...17 Chapter 3: Results No- nutrient experiment Nutrient-rich experiment vi
8 3.3 Nutrient / no-nutrient combined experiment with four families Nutrient / no-nutrient combined experiment with two families Chapter 4: Discussion References vii
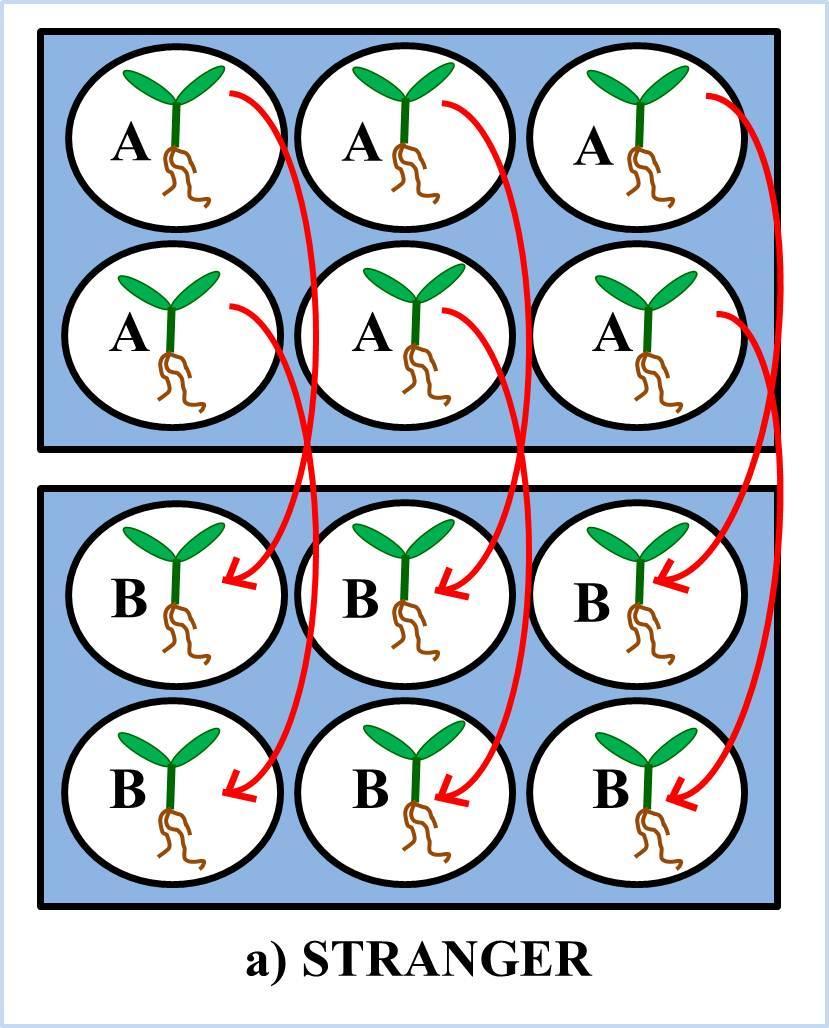
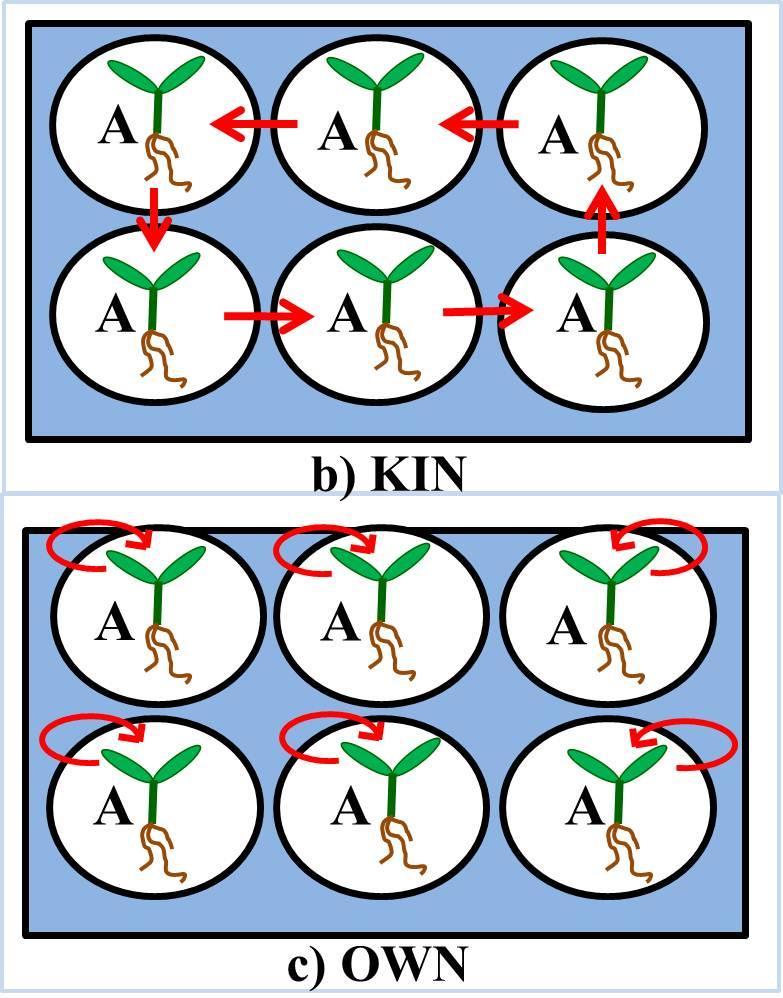
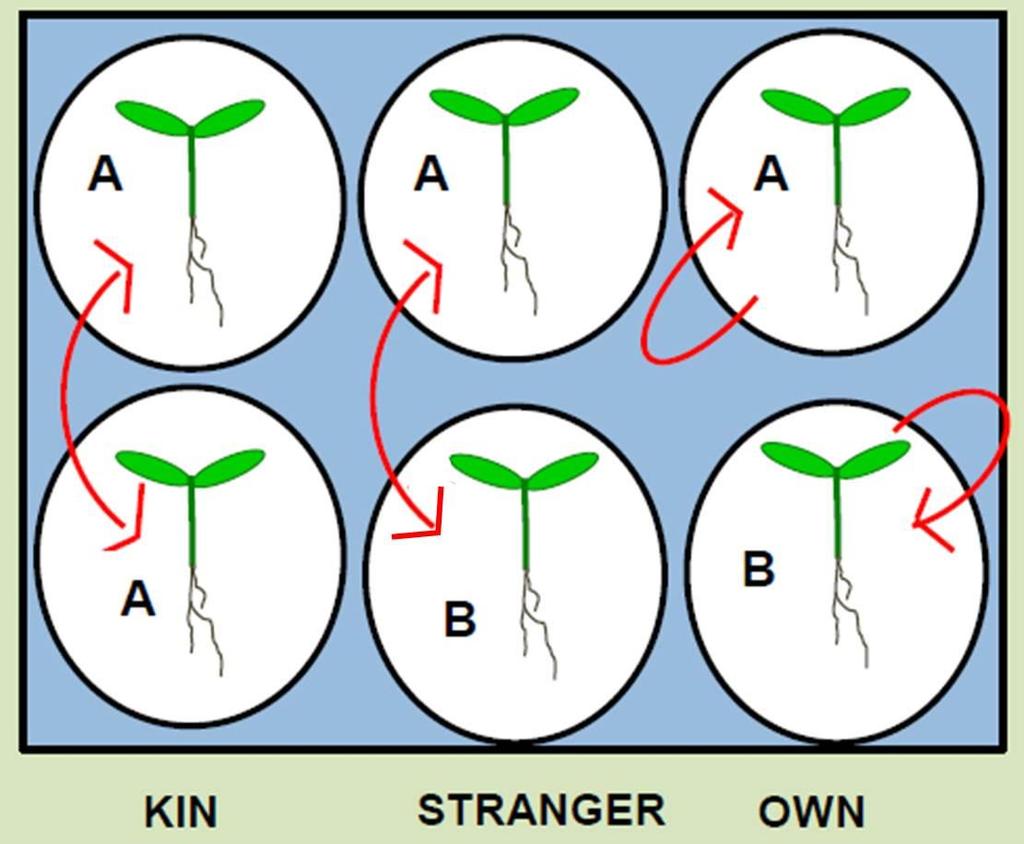
9 List of Figures Figure 2.1: A, B and C represent the experimental setup for experiment 1. The arrows show the transfer of seedlings, each day for 14 days, for Stranger, Kin and Own social environment treatment grown in sterile water. The seedlings were not randomized within the well-plates - 18 Figure 2.2: A, B and C represent the experimental setup for experiment 2, 3 and 4. The arrows show the transfer of seedlings, each day for 14 days for experiment 2 and 3 and 7 days for experiment 4, for Stranger, Kin and Own social environment treatment grown in sterile water or liquid MS media. The social environment was randomized within the nutrient or no-nutrient well-plates Figure 2.3: Summary of variables used in data collection and data analysis for all experiments. During the harvest, length of the tap root, number of lateral roots, length of each lateral root, the hypocotyl length, and number of leaves were measured for each seedling. Once the plants were oven dried for 24 hours, total root mass, hypocotyl mass, cotyledon mass, and leaf mass was measured. Aboveground mass comprises of hypocotyl mass, cotyledon mass, and leaf mass. Total lateral length was calculated, as the sum of lateral lengths Figure 3.1a: Effect of social environment and family on number of laterals for Cakile edentula seedlings grown in sterile water in well-plates switched with either kin or stranger seedling for 14 days. The letters indicate statistically significant differences between the social environment treatments at the 0.05 level. The bars indicate ±1 standard error Figure 3.1b: Bar graph of root allocation ( least square means of root biomass with aboveground biomass as the covariate) for Cakile edentula seedlings, grown in sterile water in well-plates switched with either kin or stranger seedling for 14 days, in response to social environment. The letters indicate statistically significant differences between the social environment treatments at the 0.05 level. The bars indicate ±1 standard error Figure 3.2a: Bar graph of root elongation ( least square means of tap-root length with root biomass as the covariate) for Cakile edentula seedlings, grown in liquid MS media in well-plates, switched with either kin or stranger seedling for 14 days, in response to social environment. The letters indicate statistically significant differences between the social environment treatments at the 0.05 level. The bars indicate ±1 standard error viii
10 Figure 3.2b: Bar graph of root allocation ( least square means of root mass with aboveground biomass as the covariate) for Cakile edentula seedlings, grown in liquid MS media in well-plates switched with either kin or stranger seedling for 14 days, in response to social environment. The letters indicate statistically significant differences between the social environment treatments at the 0.05 level. The bars indicate ±1 standard error Figure 3.2c: Bar graph of specific root length (least square means of total root length with root biomass as the covariate) for Cakile edentula seedlings, grown in liquid MS media in well-plates switched with either kin or stranger seedling for 14 days, in response to social environment. The letters indicate statistically significant differences between the social environment treatments at the 0.05 level. The bars indicate ±1 standard error Figure 3.3a: Effect of social environment and nutrient environment on tap-root length for Cakile edentula seedlings grown either sterile water or liquid MS media in well-plates and switched with either kin or stranger seedling for 14 days. The bars indicate ±1 standard error Figure 3.3b: Effect of social environment and nutrient environment on root elongation (least square means of tap-root length with root biomass as the covariate) for Cakile edentula seedlings grown in either sterile water or liquid MS media in well-plates and switched with either kin or stranger seedling for 14 days. The bars indicate ±1 standard error Figure 3.3c: Effect of social environment and nutrient environment on specific root length (least square means of total root length with root biomass as the covariate) for Cakile edentula seedlings grown in either sterile water or liquid MS media in well-plates and switched with either kin or stranger seedling for 14 days. The bars indicate ±1 standard error Figure 3.3d: Bar graph showing the effect of social environment on root allocation (least square means of root mass with aboveground biomass as the covariate) for Cakile edentula seedlings, grown in either sterile water or liquid MS media in well-plates switched with either kin or stranger seedling for 14 days, in response to social environment. The letters indicate statistically significant differences between the social environment treatments at the 0.05 level. The bars indicate ±1 standard error Figure 3.3e: Bar graph showing the effect of nutrient environment on root allocation (least square means of root mass with aboveground biomass as the covariate) for Cakile ix
11 edentula seedlings, grown in either sterile water or liquid MS media in well-plates switched with either kin or stranger seedling for 14 days, in response to social environment. The letters indicate statistically significant differences between the social environment treatments at the 0.05 level. The bars indicate ±1 standard error Figure 3.4a: Effect of social environment and nutrient environment on root elongation (least square means of tap-root length with root biomass as the covariate) for Cakile edentula seedlings grown in either sterile water or liquid MS media in well-plates and switched with either kin or stranger seedling for 7 days. The bars indicate ±1 standard error Figure 3.4b: Effect of social environment and nutrient environment on specific root length (least square means of total root length with root biomass as the covariate) for Cakile edentula seedlings grown in either sterile water or liquid MS media in well-plates and switched with either kin or stranger seedling for 7 days. The bars indicate ±1 standard error Figure 3.4c: Effect of social environment and nutrient environment on root allocation (least square means of total root mass with aboveground biomass as the covariate) for Cakile edentula seedlings grown in either sterile water or liquid MS media in well-plates and switched with either kin or stranger seedling for 7 days. The bars indicate ±1 standard error Figure 4.1: Summary of the hypothesized complex decisions required in producing and recognizing identity signals. The lack of kin recognition response in root allocation in seedlings grown in the nutrient-deprived environment could be a result of an error in any of these three steps x
12 List of Tables: Table 2.1: Summary of the ingredients present in Murashige and Skoog Basal Medium with vitamins that was used as the nutrient solution in all four experiments Table 3.1a: Analysis of variance for root architecture of Cakile edentula seedlings grown in sterile water in well-plates switched with either kin or stranger seedling for 14 days. Error d.f. is 87. N = 95. Family is A, B, or C; Social environment is kin, stranger or own exudates Table 3.1b: Analysis of variance for aboveground trait of Cakile edentula seedlings grown in sterile water in well-plates switched with either kin or stranger seedling for 14 days. Error d.f. is 87. N = 95. Family is A, B, or C; Social environment is kin, stranger or own exudates. Overall model significance is P< Table 3.1c: Analysis of variance for dry biomass of Cakile edentula seedlings grown in sterile water in well-plates switched with either kin or stranger seedling for 14 days. Error d.f. is 87. N= 95. Family is A, B, or C; Social environment is kin, stranger or own exudates Table 3.1d: Root elongation analysis from analysis of covariance of tap-root length as the dependent variable and root mass as the covariate for Cakile edentula seedlings grown in sterile water in well-plates switched with either kin or stranger seedling for 14 days. Error d.f. is 86. N=95. Overall model significance is P < Table 3.1e: Root allocation analysis from analysis of covariance of root mass as the dependent variable and aboveground mass as the covariate for Cakile edentula seedlings grown in sterile water in well-plates switched with either kin or stranger seedling for 14 days. Error d.f. is 86. N=95. Overall model significance is P < Table 3.1f: Specific root length from analysis of covariance of total root length as the dependent variable and root mass as the covariate for Cakile edentula seedlings grown in sterile water in well-plates switched with either kin or stranger seedling for 14 days. Error d.f. is 86. N=95. Overall model significance is P < Table 3.2a: Analysis of variance for root architecture traits of Cakile edentula seedlings grown in liquid MS media in well-plates switched with either kin or stranger seedling for 14 days. Error d.f. is 94. N = 105. Family is C, F, G or H; Social environment is kin, stranger or own exudates Table 3.2b: Analysis of variance for aboveground trait of Cakile edentula seedlings grown in sterile liquid MS media in well-plates switched with either kin or stranger xi
13 seedling for 14 days. Error d.f. is 87. N = 95. Family is C, F, G or H; Social environment is kin, stranger or own exudates. Overall model significance is P< Table 3.2c: Analysis of variance for dry biomass of Cakile edentula seedlings grown in liquid MS media in well-plates switched with either kin or stranger seedling for 14 days. Error d.f. is 94. N =105. Family is C, F, G or H; Social environment is kin, stranger or own exudates Table 3.2d: Root elongation analysis from analysis of covariance of tap-root length as the dependent variable and root mass as the covariate for Cakile edentula seedlings grown in liquid MS media in well-plates switched with either kin or stranger seedling for 14 days. Error d.f. is 92. N=104. Overall model significance is P < Table 3.2e: Root allocation analysis from analysis of covariance of root mass as the dependent variable and aboveground mass as the covariate for Cakile edentula seedlings grown in liquid MS media in well-plates switched with either kin or stranger seedling for 14 days. Error d.f. is 92. N=104. Overall model significance is P < Table 3.2f: Specific root length from analysis of covariance of total root length as the dependent variable and root mass as the covariate for Cakile edentula seedlings grown in liquid MS media in well-plates switched with either kin or stranger seedling for 14 days. Error d.f. is 92. N=104. Overall model significance is P < Table 3.3a: Analysis of variance for root architecture traits of Cakile edentula seedlings grown in liquid MS media or sterile water in well-plates switched with either kin or stranger seedling for 14 days. Error d.f. is 228. N = 251. Family is C, D, B, E; Social environment is kin, stranger or own exudates; nutrient environment is nutrient and no nutrient Table 3.3b: Analysis of variance for hypocotyl length of Cakile edentula seedlings grown in sterile liquid MS media or sterile water in well-plates switched with either kin or stranger seedling for 14 days. Error d.f. is 228. N = 251. Family is C, D, B, E; Social environment is kin, stranger or own exudates; Nutrient environment is nutrient and no nutrient. -52 Table 3.3c: Analysis of variance for dry biomass of Cakile edentula seedlings grown in liquid MS media or sterile water in well-plates switched with either kin or stranger seedling for 14 days. Error d.f. is 228. N = 251. Family is C, D, B, E; Social environment is kin, stranger or own exudates; Nutrient environment is nutrient and no nutrient xii
14 Table 3.3d: Root elongation analysis from analysis of covariance of tap-root length as the dependent variable and root mass as the covariate for Cakile edentula seedlings grown in liquid MS media or sterile water in well-plates switched with either kin or stranger seedling for 14 days. Family is C, D, B, E; Social environment is kin, stranger or own exudates; Nutrient environment is nutrient and no nutrient. Error d.f. is 226. N=250. Overall model significance is P < Table 3.3e: Root allocation analysis from analysis of covariance of root mass as the dependent variable and aboveground mass as the covariate for Cakile edentula seedlings grown in liquid MS media or sterile water in well-plates switched with either kin or stranger seedling for 14 days. Family is C, D, B, E; Social environment is kin, stranger or own exudates; Nutrient environment is nutrient and no nutrient. Error d.f. is 226. N=250. Overall model significance is P < Table 3.3f: Specific root length from analysis of covariance of total root length as the dependent variable and root mass as the covariate for Cakile edentula seedlings grown in liquid MS media in well-plates switched with either kin or stranger seedling for 14 days. Family is C, D, B, E; Social environment is kin, stranger or own exudates; Nutrient environment is nutrient and no nutrient. Error d.f. is 226. N=250. Overall model significance is P < Table 3.4a: Analysis of variance for root architecture traits of Cakile edentula seedlings grown in liquid MS media or sterile water in well-plates switched with either kin or stranger seedling for 7 days. Error d.f. is 166. N = 177. Family is C or E; Social environment is kin, stranger or own exudates; nutrient environment is nutrient and no nutrient Table 3.4b: Analysis of variance for aboveground trait of Cakile edentula seedlings grown in sterile liquid MS media or sterile water in well-plates switched with either kin or stranger seedling for 7 days. Error d.f. is 166. N = 177. Family is C or E; Social environment is kin, stranger or own exudates; nutrient environment is nutrient and no nutrient. -70 Table 3.4c: Analysis of variance for dry biomass of Cakile edentula seedlings grown in liquid MS media or sterile water in well-plates switched with either kin or stranger seedling for 7 days. Error d.f. is 166. N = 177. Family is C or E; Social environment is kin, stranger or own exudates; nutrient environment is nutrient and no nutrient Table 3.4d: Root elongation analysis from analysis of covariance of tap-root length as the dependent variable and root mass as the covariate for Cakile edentula seedlings grown in xiii
15 liquid MS media or sterile water in well-plates switched with either kin or stranger seedling for 7 days. Error d.f. is 165. N = 177; Family is C or E; Social environment is kin, stranger or own exudates; Nutrient environment is nutrient and no nutrient. Overall model significance is P< Table 3.4e: Root allocation analysis from analysis of covariance of root mass as the dependent variable and aboveground mass as the covariate for Cakile edentula seedlings grown in liquid MS media or sterile water in well-plates switched with either kin or stranger seedling for 7 days. Error d.f. is 166. N=177; Family is C or E; Social environment is kin, stranger or own exudates; Nutrient environment is nutrient and no nutrient. Overall model significance is P< Table 3.4f: Specific root length from analysis of covariance of total root length as the dependent variable and root mass as the covariate for Cakile edentula seedlings grown in liquid MS media in well-plates switched with either kin or stranger seedling for 7 days. Error d.f. is 165. N=177. Family is C or E; Social environment is kin, stranger or own exudates; nutrient environment is nutrient and no nutrient. Overall model significance is P < xiv
16 CHAPTER 1: INTRODUCTION 1.1 Aboveground and belowground competition through phenotypic plasticity Competition is one of the most important social interactions for plants. Plants can detect the presence of neighbouring plants (Novoplansky 2009) using both above- and below-ground cues and respond by exhibiting competitive behavior (Callaway 2002) to acquire scarce resources such as light, water and nutrients. As sessile organisms, plants utilize phenotypic plasticity, the ability to change phenotype in response to an environmental cue, to become better competitors (Trewavas 2009) and to better acquire limiting resources. Light is a key and, in many cases, a limiting energy resource for plants. As sessile photoautotrophs, plants actively adjust their growth and positioning of leaves to acquire optimal light energy for photosynthesis. In addition to providing energy for photosynthesis, light signals also provide plants with important spatial and temporal information about their surrounding environment. Light signals are perceived by photoreceptors that contain pigments specialized in absorbing light from specific parts of the light spectrum. These specialized information-transducing photoreceptors include red (R) and far-red (FR) light- absorbing phytochromes and blue (UV-A) light- absorbing receptors ( Smith 1982). When daylight passes through vegetation, chlorophyll and carotenoid pigments within the leaves preferentially absorb red (R) and blue (B) wavelengths and reflect back far-red (FR) wavelengths. A high density vegetation results in light that is rich in far-red (FR) and poor in red (R) and blue (B) wavelengths (Franklin and Whitelam 2005). Hence, a decreased red:far red light ratio (R:FR) acts as an 1
17 aboveground cue that tells the plant that it is being shaded or has aboveground neighbours present (Smith 1982). The phytochromes sense this change in light and can respond to this by allocating more biomass to the aboveground organs (Whitelam and Smith 1991) or elongating aboveground organs, including hypocotyl and petiole elongation, and upward positioning of leaves (hyponasty) (Ballare, Scopel et al. 1990). When light is the limiting resource, this type of phenotypic plasticity in the presence of neighbours allows the individual to become taller than its neighbours and capture more light. However, much of the competition in plants takes place underground. There are multiple resources found in soil, in contrast to a single key resource found aboveground (Casper and Jackson 1997). Plants actively compete with other neighbouring plants for belowground resources, which include water and around 20 essential mineral nutrients that differ in molecular size, oxidation state, and mobility within the soil (Casper and Jackson 1997). Plants can increase root proliferation in regions with high nutrient concentrations as a mechanism to exploit resource patches when under competitive situations (Hodge 2009); (de Kroon and Mommer 2006). An individual s competitive ability is greatly dependent on root density, surface area and the plasticity in root growth (Casper and Jackson 1997). Several studies have shown that, in the presence of belowground neighbours, plants increase root proliferation even before nutrients are diminished, suggesting that plants can show plasticity to roots of neighbours and not just to resource depletion (Gersani, Brown et al. 2001, Maina, Brown et al. 2002, O'Brien, Gersani et al. 2005). In these cases, plants can predict the impending root competition and respond by 2
18 increasing biomass allocation to the fine roots to increase their competitive ability (Gersani, Abramsky et al. 1998, Maina, Brown et al. 2002, Falik, Reides et al. 2003, Murphy and Dudley 2007). However, this type of phenotypic plasticity is costly as it assigns resources away from reproduction ( DeWitt, 1998). Mahal and Callaway (1991) were the first to provide the initial evidence for self /non-self recognition by roots in the desert shrub Ambrosia dumosa. Individuals from this species continue normal root growth when they encounter their own roots but stop root growth when they encounter roots from another A. dumosa plant. Thereafter, studies with soybean (Gersani, Brown et al. 2001), strawberry (Holzapfel and Alpert 2003), peas (Falik, Reides et al. 2003), buffalo grass (Gruntman and Novoplansky 2004), and Kenya bean (Maina, Brown et al. 2002) also provided evidence for self / non-self recognition at the root level. However, these studies showed that plants allocate more biomass to roots when they encounter a non-self neighbour compared to when they are grown alone. Subsequent root identity recognition studies have shown that plants can also distinguish and respond to species (Huber-Sannwald, Pyke et al. 1996), and most interestingly, relatedness (Dudley (Dudley and File 2007, Murphy and Dudley 2009, Bhatt, Khandelwal et al. 2010, Biedrzycki, Jilany et al. 2010) of the neighboring roots. 1.2 Kin recognition in plants Kin recognition, an ability to distinguish between relatives and non-relatives, is a beneficial social trait when living in dense related groups, allowing individuals to direct altruistic behaviours towards individuals with shared alleles, thus increasing the indirect fitness of the focal individual (Waldman 1988). Plant life histories often result in mono- 3
19 specific stands of closely related individuals, creating conditions ideal for kin selection (Hamilton 1964, Waldman 1988, Kelly 1996). Donohue (2003) showed that individuals of Cakile edentula had higher fitness when growing in groups of siblings compared to groups of strangers. Therefore, like animals, it would be beneficial for plants to have the ability to discriminate between relatives and non-relatives and only compete with nonrelated (stranger) neighbours. This would reduce the cost of competition and increase indirect fitness. So far plant kin recognition has been observed in Cakile edentula (Dudley and File 2007, Murphy and Dudley 2009, Bhatt, Khandelwal et al. 2010), Impatiens pallida (Murphy and Dudley 2009), Chenopodium album (Dudley et al. unpublished data), and Arabidopsis thaliana (Biedrzycki, Jilany et al. 2010). All four studies observed differential competitive behaviour to siblings compared to strangers, which is consistent with kin selection. I. pallida and C. album show increased competitive response, in aboveground traits, towards non-related conspecific individuals. I. pallida, a species that is found in woody areas where light is a limiting resource, allocated more resources to leaves, in relation to roots, when grown with non-related plants and changed their aboveground morphology in presence of siblings to reduce competition (Murphy and Dudley 2009). Similarly, C. album, a weedy annual plant usually found in crop fields, also allocated more resources to aboveground traits, in relation to roots, when grown with non-related plants (Dudley, Lee et al. unpublished data). Conversely, C. edentula and A. thaliana, usually found in areas with limiting belowground resources, showed an increased competitive response, in belowground traits, towards non-related conspecific individuals than related individuals. C. edentula plants showed increased root allocation 4
20 in relation to aboveground traits and A. thaliana showed increased number of lateral roots when interacting with non-related individuals (Dudley and File 2007, Bhatt, Khandelwal et al. 2010, Biedrzycki, Jilany et al. 2010). The competitive responses of each species, in the presence of a non-relative, are consistent with their native ecology. However, they all require belowground cues (i.e. root interaction) for this kin recognition to occur (Karban, 2010). 1.3 Root exudates as the basis for kin recognition in plants There is evidence that root exudates are the basis for the kin recognition response in plants (Bais, Park et al. 2004). Plants lose as much as 5-21% of their carbon into soil in a form of root exudates (Badri, Weir et al. 2009). Root exudates consist of soluble molecules consisting of ions, free oxygen, water, enzymes, mucilage, primary and secondary metabolites, exuded by the plant roots (Bais, Weir et al. 2006). Root exudates have various ecological and biochemical functions and influence plant-microbial and plant-plant interactions, nutrient and water uptake, and detoxification of toxins (Bais, Weir et al. 2006). Research has shown that roots exude an array of compounds in response to stress and the exudate profile may vary depending on the biological or chemical elicitors (Walker, Bais et al. 2003). It has been hypothesized that plants can use root exudates as a source of information about neighbouring plants as the combination of secondary metabolites secreted by the roots are species specific (Flores, Vivanco et al. 1999, Bais, Loyola-Vargas et al. 2001). Biedrycki et al. (2010) tested whether root exudates were a source of information about relatedness by growing A. thaliana seedlings in well-plates and exposing them to liquid media in which either a kin, stranger, or itself 5
21 was growing, without any root contact. The study looked at the response of seedlings grown with sodium orthovanadate, a secretion transport inhibitor, exposed to liquid media in which either a kin, stranger, itself was growing. Their results showed that the kin recognition response disappeared when the roots were treated with sodium orthovanadate. This provided evidence for root exudates as the basis of kin recognition in A. thaliana (Biedrzycki, Jilany et al. 2010). 1.4 Effect of Resource Limitation on Kin Recognition Competition among animals for limited resources plays an important role in shaping life-history strategies and evolution of behaviour (Lomnicki 1988).There are two main behavioural strategies observed in animal behaviour studies. The first strategy follows the kin selection theory of altruism, which states that individuals will direct competition away from relatives, even at a cost to themselves to increase their indirect fitness (Hamilton 1964). According to Hamilton s rule, altruistic behavior among animals will prevail only if the indirect fitness benefit (i.e. helping relatives) to the donor is greater than the cost of performing an altruistic act. Hamilton s rule can be simply explained by r*b > C, where r is the genetic relatedness between the donor and the recipient, B is the fitness benefit to recipient and C is the cost to the donor (Hamilton 1964). As resources become limiting, an individual may be more inclined to accept the cost of direct fitness to favour the reproductive success of their relatives, in order to increase its inclusive fitness (Hamilton 1964). There are a lot of animal behaviour examples that support this theory. One good example to support this theory comes from observing the den sharing behaviour of Australian mountain brushtail 6
22 possums (Banks, Lindenmayer et al. 2011). Banks et al. (2011) looked at the effect of resource limitation on kin selection in Australian brushtail possums, whose key resource is hollow trees for dens. Changes in den sharing patterns indicate of a decline in the key resource. Banks (2011) observed that hollow-dependent Australian mountain brushtail possums switch den-sharing preference from kin avoidance to kin preference with decreasing tree hollow availability. This suggests that with limiting resources, Australian brushtail possums are more inclined to accept the cost of inbreeding, in order to increase survival chances of a relative. The second strategy is usually observed in animals if the competition is occurring in a closed system, where the competitors (related and non-related conspecifics) cannot leave an area and are competing for the same resources. In this case, the cost of altruistic behaviour increases as the occurrence of competition with kin members increase (West and Gardner 2010). Hence, in this scenario, animals are more likely to act selfishly by not discriminating between kin and stranger and competing equally with both conspecifics, as the key resource decreases. One good example of this theory comes from observing the tadpoles of Spadefoot toads, Scaphiopus bombifrons. Spadefoot toads are native to North America and live in dry, desert areas. These small toads breed once a year in small temporary ponds formed by the rain (Pfennig, Reeve et al. 1993), and the tadpoles spend their early life in the small pond making this a closed system. Pfennig et al. (1993) examined the carnivore morph of Spadefoot toads to determine if it differentiates between kin and non-kin and if this behaviour is context- dependent. The study showed that, in normal circumstances, Spadefoot toads use chemical cues to discriminate kin and avoid 7
23 eating siblings to increase their inclusive fitness. However, when hungry, tadpoles of Spadefoot toads become less selective in their prey choice and preyed on kin just as much as non-kin (Pfennig, Reeve et al. 1993). This provides evidence for the hypothesis that the altruistic behaviour will become less prevalent as resource availability decreases. As plants are sessile organisms, they cannot move from an area to area looking for high resource patches. Thus, exploiting limiting resource patches under competitive situations becomes vital for survival. Plants may be growing in groups of kin or strangers depending on the ecology and the dispersal patterns of the species and can employ phenotypic plasticity in root proliferations to forage and compete for patchy nutrient reservoirs in its surrounding area. Cakile edentula increased competitive response when grown with strangers. However, no one has looked at the significance of resource availability on the responses to the relatedness of neighbours. 1.5 Root architecture Within a species, root system morphology can vary greatly as a consequence of the interactions between developmental processes and environmental conditions such as soil strength, nutrient, water, and oxygen availability (Lynch 1995). As a whole, the spatial configuration of the root system shows the ability of a plant to proliferate their roots to explore and exploit below-ground resources and provide structural support. Root proliferation is a product that requires a range of morphological changes. These changes include elongation of individual roots (Jackson and Caldwell 1989), an increase in total root length (Hodge, Stewart et al. 2000), root production (Hodge, Stewart et al. 2000) and 8
24 initiation of new laterals (Farley and Fitter 1999). The direction and the extent of root system is highly influenced by environmental cues as the roots are solely responsible for the acquisition of all belowground resources (water and nutrients) (Grime, Crick et al. 1986). This spatial configuration (shape and structure) of the root system is termed root architecture. Having the correct root architecture is crucial to compete efficiently for resources in a nutrient deficient environment. Root biomass is a commonly used measurement to study the foraging ability of plants. However, Hodge (2004) states that root biomass may not be the best measurement as changes in root system architecture can occur without a change in root biomass. Hence, studying root architecture is critical to fully understand plant root behaviour. Plants can optimize their root architecture by influencing the growth of primary and lateral roots (Malamy 2005). Root architecture can be quantified by measuring variables such as lateral root lengths, root depth, specific root length and root length density(hodge 2009). Root length acts as a measure of root surface area and has shown to be a good predictor of nutrient capture (Hodge 2009). Root depth is a measure of how the root biomass is allocated vertically through soil and provides information about where each individual plant root will obtain water and nutrient resources, including the probability of belowground competition between neighbouring individuals (Cornelissen, Lavorel et al. 2003). Specific root length (SRL) is the ratio of root length to mass and it is a good measure of the amount of absorptive tissue per unit mass and acts as an indicator of water and nutrient acquisition (Barber and Silberbush 1984, Fitter 1985). Plants with higher 9
25 SRL form longer roots for a given dry mass investment by making root of thinner diameter (low tissue density) (Eissenstat 1991). Many studies have used plant root architecture as a tool to study the root response to root neighbours, specific nutrients and nutrient patches (Hodge 2004). Hence, I wish to use root architecture as a tool to understand the effect of resource availability on kin recognition response in plants. 1.6 Outline of this study Cakile edentula (Bigelow) Hook. ssp. edentula var. lacustris (Fernald)(Great Lakes sea rocket) is a highly selfing annual beach plant found in high-light and low-water and - nutrient environments around great lakes. C. edentula produces dimorphic seeds (distal and proximal), which have different dispersal patterns (Rodman 1974). The proximal seeds are usually buried with the mother plant and emerge in high-density sibling groups (Rodman 1974, Keddy 1982) and the distal seeds are usually dispersed away from the mother plant by wind or water creating high-density stranger groups (Payne and Maun 1981, Donohue 1998). C. edentula allocates less biomass to roots when grown with siblings (Dudley and File 2007, Bhatt, Khandelwal et al. 2010) suggesting kin recognition response. Additionally, studies have shown that kin groups have higher fitness compared to stranger groups (Donohue 2003) providing opportunities for kin selection. Hence, C. edentula is ideal for this study. Previous studies observing kin recognition through root allocation suggest that the mechanism of kin discrimination involved root interactions (Dudley and File 2007, Murphy and Dudley 2009) with root exudates being the basis for this root communication 10
26 in A. thaliana (Biedrzycki, Jilany et al. 2010). Seedlings are an ideal life stage to study responses to kin and stranger interactions in C. edentula as individuals in the seedling stage experience the largest number of physiological and environmental constraints and exhibit increased phenotypic plasticity towards environmental cues (Weinig and Delph 2001). So far, we have observed kin recognition response in C. edentula through root allocation in juvenile plants (8 weeks old) (Dudley and File 2007) and young seedlings (6 and 3 weeks old) (Bhatt, Khandelwal et al. 2010) that had root contact. However, the kin recognition response has not yet been observed in 1 and 2 week old seedlings and the role of root exudates has yet to be determined. Furthermore, the effect of nutrient availability on the kin recognition response is not yet understood. Hence, we grew C. edentula seedlings in either no nutrient or high nutrient condition to test whether kin recognition observed in C. edentula is affected by nutrient availability. For these experiments, we used the well-plate technique developed by Biedrzycki et al (2010), which exposed the seedling to exudates of another seedling without any root contact, to test if root contact is necessary for the kin recognition response. We ask if competition with kin or stranger neighbours is affected by nutrient availability? I hypothesize that the C. edentula seedlings will act selfishly and compete equally with kin and stranger individuals when grown in the no nutrients environment. However, when they are grown in a nutrient rich environment, C. edentula seedlings will show a neighbour identity recognition response by increasing competitive behaviour when exposed to stranger exudates. 11
27 CHAPTER 2: METHODS AND MATERIALS 2.1 Study species Cakile edentula (Bigelow) Hook. ssp. edentula var. lacustris (Fernald)(Great Lakes sea rocket) seeds used in all three experiments were from fourth generation single-seed descent lines grown in the McMaster University greenhouse and allowed to self. The original founders were collected from a population at Confederation Park, Hamilton in Because this species is highly autogamous, all seeds likely result from selfing, though some insects are present in the greenhouse. 2.2 Experimental design: Experiment 1: No nutrients This experiment was conducted in order to look at the effects of social environment on C. edentula seedlings grown without nutrients. The seedlings were either exposed to their own exudates or exudates of either a sibling seedling or a stranger seedling in well-plates. For this experiment, 3 genotypes (3 Families: ON2-5C-1 = A ; ON2-7B-1 = B, ON2-17C-1= C ) and 8 replicates of each genotype combinations for stranger and own and 4 replicates of each kin pairs were used for social environment treatment. On Nov 9, 2011, seeds were surface sterilized in family groups with a 70% ethanol solution for 1 minute, then rinsed with sterile water. The seed coat of each seed was nicked with a razorblade, to increase the chances of germination, and soaked overnight in well-plates containing sterile water. Once the seeds were imbibed for a 12
28 period of 24 hours, they had germinated. One seedling per well was placed in 6 well wellplates containing 4 ml of sterile water. On day 2, filter paper (Whatman international Ltd, Maidstone, England) was placed in each well on top of the roots to hold the seedling in place. Every day for 14 days, the seedlings were lifted out of their wells using forceps and put back in their own well (OWN treatment) or exchanged positions with the seedling in the adjacent well (KIN or STRANGER treatment). For this experiment, seedlings in the Kin treatment were not paired with another seedling so each seedling was exposed to exudates of a different kin seedling each day (Figure 1b). In contrast, seedlings in the Stranger treatment were paired so that each seedling was only exposed to exudates from one other seedling (Figure 2.1). Each well-plate contained only one social environment treatment. (Figure 1) On Nov 23, 2011, the seedlings were harvested. Experiment 2: Nutrients This experiment was conducted in order to observe the effects of social environment on C. edentula seedlings grown in a nutrient-rich environment. For this experiment, 4 genotypes (4 Families: ON2-7B-31 = B ; ON2-17C-4 = C ; ON2-18C-6 = G ; ON2-20A-41 = H ) and 8 replicates of each genotype combinations for stranger and own and 4 replicates of each kin pairs were used for social environment treatment. On Feb 2, 2012, seeds were surface sterilized in family groups with 70% ethanol solution for 2 minutes, then sterilized with the seed sterilizing solution (30% bleach solution + 10ul polysorbate surfactant (Tween 20, Fisher BioReagents) for 5 minutes. The seeds were then rinsed 5 times with sterile water. The seed coat of each seed was nicked with a sterile razorblade and soaked overnight in well-plates containing sterile water to increase the chances of 13
29 germination. Once the seeds were imbibed for 24 hours, they were placed in 6 well wellplates containing 3 ml of MS media (H2O + Murashige and Skoog with vitamins media powder (Caisson Laboratories INC, USA) and NO sucrose), with one seedling per well. Table 2.1 shows the chemical composition of the MS media used to make the nutrient solution. Each well-plate was sealed with micropore tape to allow oxygen diffusion while keeping the inside of well-plates sterile. On day 2, filter paper (Whatman international Ltd, Maidstone, England) was placed in each well on top of the roots to hold the seedling in place. Every day for 14 days, the seedlings were lifted out of their wells using forceps and put back in their own well (OWN treatment) or exchanged positions with the seedling in the adjacent well (KIN or STRANGER treatment)(figure 2.2). 1 ml of New MS media was added to each well every 4 days (Day 5, Day 9, Day 13). The social environment treatment was randomized within all well-plates. The young seedlings were harvested on Feb 14, Experiment 3: No nutrients/ nutrients This was a factorial experiment designed to test whether nutrients affect the response to the social environment. The seedlings were exposed to either their own exudates or exudates of either a sibling seedling or a stranger seedling in nutrient- rich environment or nutrient deprived environment. To carry out the experiment, 4 genotypes and 4 replicates of each genotype combinations for nutrient deprived treatment and same 4 genotypes with 6 replicated of each genotype combination for the nutrient-rich treatment were used (4 Families: ON2-7B-2 = C ; ON2-9B-1 = D ; ON2-6C-3 = B ; ON2-11C-1= E ). On May 22, 2012, seeds were sterilized and prepared as per the 14
30 methods in Experiment 2. Once the seeds were imbibed for 24 hours, they were placed in 6 well well-plates containing either 3 ml of MS media (H2O + Murashige and Skoog with vitamins media powder and NO sucrose) or 3 ml of sterile water, with one seedling per well. Each well-plate was sealed with micropore tape to allow oxygen diffusion while keeping the inside of well-plates sterile. On day 2, filter paper (Whatman international Ltd, Maidstone, England) was placed in each well on top of the roots to hold the seedling in place. Every day for 14 days, the seedlings were lifted out of their wells using forceps and put back in their own well (OWN treatment) or exchanged positions with the seedling in the adjacent well (KIN or STRANGER treatment) (Figure 2.2). 1 ml of New MS media or 1 ml of sterile water was added to each well every 4 days (Day 5, Day 9, Day 13). The social environment treatment was randomized within nutrient and no-nutrient treatment well-plates. The seedlings were harvested on June 5, 2012 Experiment 4: No nutrients/ nutrients for 2 families This, similarly to experiment 3, was a factorial experiment to test for an interaction between the social environment and nutrients, but here using only 2 families. The seedlings were exposed to either their own exudates or exudates of either a sibling seedling or a stranger seedling in nutrient- rich environment or nutrient deprived environment. For this experiment, 2 genotypes and 16 replicates of each genotype combinations for stranger and own and 8 replicates of each kin pairs were used for social environment treatment for each nutrient environment treatment (2 Families: ON2-7B-4= C ; ON2-11C-1= E ). On October , seeds were sterilized and prepared as per the methods in Experiment 2. Once the seeds were imbibed for 24 hours, they were 15
31 placed in 6 well well-plates containing either 3 ml of MS media (H2O + Murashige and Skoog with vitamins media powder and NO sucrose) or 3 ml of sterile water, with one seedling per well. On day 2, filter paper (Whatman international Ltd, Maidstone, England) was placed in each well on top of the roots to hold the seedling in place. Every day for 7 days, the seedlings were lifted out of their wells using forceps and put back in their own well (OWN treatment) or exchanged positions with the seedling in the adjacent well (KIN or STRANGER treatment) (Figure 2.2). 1 ml of New MS media or 1 ml of sterile water was added to each well every 2 days (Day 3, Day 5). The social environment treatment was randomized within nutrient and no-nutrient treatment well-plates. The seedlings were harvested on October 25, Data collection During the harvest, to quantify the root architecture, tap root length, number of laterals, and length of each lateral was measured (Figure 2.3). I also measured the hypocotyl length, and the number of. Each seedling was then separated and put into 2 separate envelopes (Staples #1 coin envelopes): 1) Aboveground biomass (hypocotyl, cotyledons, and leaves); 2) Belowground biomass (main tap root and lateral roots). All the coin envelopes with the plant parts were dried in an oven at 50 degrees Celsius for 24 hours and the dry weight of total root, hypocotyl, cotyledon, and leaves was then recorded. Each experiment was harvested on a single day. Tap root length and length of each lateral was measured with a ruler to closest 0.1mm. The number of lateral for each seedling was counted as any branch with a length of 0.1mm or longer. The dry mass of each plant part was weighed to 4 decimal places. 16
32 2.4 Data analysis Statistical analysis of all collected data was done using SAS statistical software (version 9.2 for Windows (English); SAS Institute, Cary, NC, USA). The total lateral length is the sum of all lateral lengths and the total root length is the sum of the taproot length and total lateral length (FIGURE 3). Analyses of variance (ANOVA) and covariance (ANCOVA) were carried out with PROC GLM. ANOVA was carried out to compare means of independent groups within each dependent variable, where independent variables were family, social environment ( Kin, Stranger, and Own) and nutrient environment (Nutrient and No- nutrient). Residual analysis was performed to check whether the residuals met the assumptions of the ANOVA, and, if necessary, natural logarithms (log e ) were taken of raw data so that residuals were homoscedastic and normally distributed. Root allocation was calculated from an ANCOVA analysis using root mass as the dependant variable and aboveground mass as the covariant variable for social (kin/own/stranger) and nutrient (nutrient-rich/no-nutrient) environment treatments. Specific root length (SRL, mg -1 ) was calculated from an ANCOVA analysis using total root length as the dependant variable and total root mass as the covariant variable for social (kin/own/stranger) and nutrient (nutrient-rich/no-nutrient) environment treatments. Root elongation was calculated from an ANCOVA analysis using taproot length as the dependant variable and total root mass as the covariant variable for social (kin/own/stranger) and nutrient (nutrient-rich/nonutrient) environment treatments. 17
33 Figure 2.1: A, B and C represent the experimental setup for experiment 1. The arrows show the transfer of seedlings, each day for 14 days, for Stranger, Kin and Own social environment treatment grown in sterile water. The seedlings were not randomized within the well-plates. 18
34 19
35 Figure 2.2: A, B and C represent the experimental setup for experiment 2, 3 and 4. The arrows show the transfer of seedlings, each day for 14 days for experiment 2 and 3 and 7 days for experiment 4, for Stranger, Kin and Own social environment treatment grown in sterile water or liquid MS media. The social environment was randomized within the nutrient or no-nutrient well-plates. 20
36 21
37 Figure 2.3: Summary of variables used in data collection and data analysis for all experiments. During the harvest, length of the tap root, number of lateral roots, length of each lateral root, the hypocotyl length, and number of leaves were measured for each seedling. Once the plants were oven dried for 24 hours, total root mass, hypocotyl mass, cotyledon mass, and leaf mass was measured. Aboveground mass comprises of hypocotyl mass, cotyledon mass, and leaf mass. Total lateral length was calculated, as the sum of lateral lengths. 22
38 23
39 Table 2.1: Summary of the ingredients present in Murashige and Skoog Basal Medium with vitamins (Sigma-Aldrich Co. LLC.)that was used as the nutrient solution in all four experiments. Ingredient Percent Ammonium Nitrate 38.19% Boric Acid 0.14 % Calcium Chloride anhydrous 7.69% Cobalt Chloride 6H 2 O % Cupric Sulfate 5H 2 O % EDTA, Na % Ferrous sulfate 7H 2 O 0.64 % Magnesium Sulfate 4.17 % Manganese sulfate H 2 O 0.39 % Molybdic acid (sodium salt) 2H 2 O 0.006% Potassium Iodide 0.019% Potassium Nitrate 43.96% Potassium phosphate monobasic 3.92% 24
40 CHAPTER 3: RESULTS 3.1 No- nutrient experiment For this experiment, seedlings from three families were grown in sterile water for 14 days. There was no significant main effect of social environment and family on taproot length (p<0.1648), log e total lateral length (p<0.0749), hypocotyl length (p<0.1273), total mass (p<0.0208), or total root length (p<0.3094). There were significant social environment family interactions for total mass (p<0.0118), and aboveground mass (p<0.0114). Family A and C seedlings had higher total and aboveground mass when exposed to own exudates than kin or stranger exudates. Family B seedlings had lower total and aboveground mass when exposed to own exudates than kin or stranger exudates (Table 3.1a, 3,1b, and 3.1c). There were significant main effects of social environment and family on number of laterals (Table 3.1a). Number of laterals increased in the presence of kin and stranger exudates but not in presence of own exudates. Additionally, family C produced more laterals compared to family A and B (Figure 3.1a). The root allocation patterns found in this experiment were not consistent with the kin recognition patterns previously observed in Cakile edentula (File 2007, Bhatt 2011). Tap- root length relative to total root mass (root elongation), allocation to roots relative to aboveground mass (root allocation), and total root length relative total root mass (specific root length) did not differ between seedlings exposed to kin or stranger exudates (Table 3.1d, 3.1e, 3.1f; Figure 3.1b). 25
41 Table 3.1a: Analysis of variance for root architecture of Cakile edentula seedlings grown in sterile water in well-plates switched with either kin or stranger seedling for 14 days. Error d.f. is 87. N = 95. Family is A, B, or C; Social environment is kin, stranger or own exudates. Source d.f. Tap-root length ln (Total lateral length) Number of lateral Total root length F-ratio P-value F-ratio P-value F-ratio P-value F-ratio P-value Family (F) Social Environment (S) F S
42 Table 3.1b: Analysis of variance for aboveground trait of Cakile edentula seedlings grown in sterile water in well-plates switched with either kin or stranger seedling for 14 days. Error d.f. is 87. N = 95. Family is A, B, or C; Social environment is kin, stranger or own exudates. Overall model significance is P< Source d.f. Hypocotyl length F-ratio P-value Family (F) Social Environment (S) F S
43 Table 3.1c: Analysis of variance for dry biomass of Cakile edentula seedlings grown in sterile water in well-plates switched with either kin or stranger seedling for 14 days. Error d.f. is 87. N= 95. Family is A, B, or C; Social environment is kin, stranger or own exudates. d.f. Total mass Root mass Aboveground mass Source F-ratio P-value F-ratio P-value F-ratio P-value Family (F) Social Environment (S) F S
44 Table 3.1d: Root elongation analysis from analysis of covariance of tap-root length as the dependent variable and root mass as the covariate for Cakile edentula seedlings grown in sterile water in well-plates switched with either kin or stranger seedling for 14 days. Error d.f. is 86. N=95. Overall model significance is P < Source d.f. Root elongation F-ratio P-value Root mass < Family (F) Social Environment (S) F S
45 Table 3.1e: Root allocation analysis from analysis of covariance of root mass as the dependent variable and aboveground mass as the covariate for Cakile edentula seedlings grown in sterile water in well-plates switched with either kin or stranger seedling for 14 days. Error d.f. is 86. N=95. Overall model significance is P < Source d.f. Root allocation F-ratio P-value Aboveground mass Family (F) Social Environment (S) F S
46 Table 3.1f: Specific root length from analysis of covariance of total root length as the dependent variable and root mass as the covariate for Cakile edentula seedlings grown in sterile water in well-plates switched with either kin or stranger seedling for 14 days. Error d.f. is 86. N=95. Overall model significance is P < Source d.f. Specific root length F-ratio P-value Root mass < Family (F) Social Environment (S) F S
47 Figure 3.1a: Effect of social environment and family on number of laterals for Cakile edentula seedlings grown in sterile water in well-plates switched with either kin or stranger seedling for 14 days. The bars indicate ±1 standard error. 32
48 33
49 Figure 3.1b: Bar graph of root allocation ( least square means of root biomass with aboveground biomass as the covariate) for Cakile edentula seedlings, grown in sterile water in well-plates switched with either kin or stranger seedling for 14 days, in response to social environment. The letters indicate statistically significant differences between the social environment treatments at the 0.05 level. The bars indicate ±1 standard error.. 34
50 35
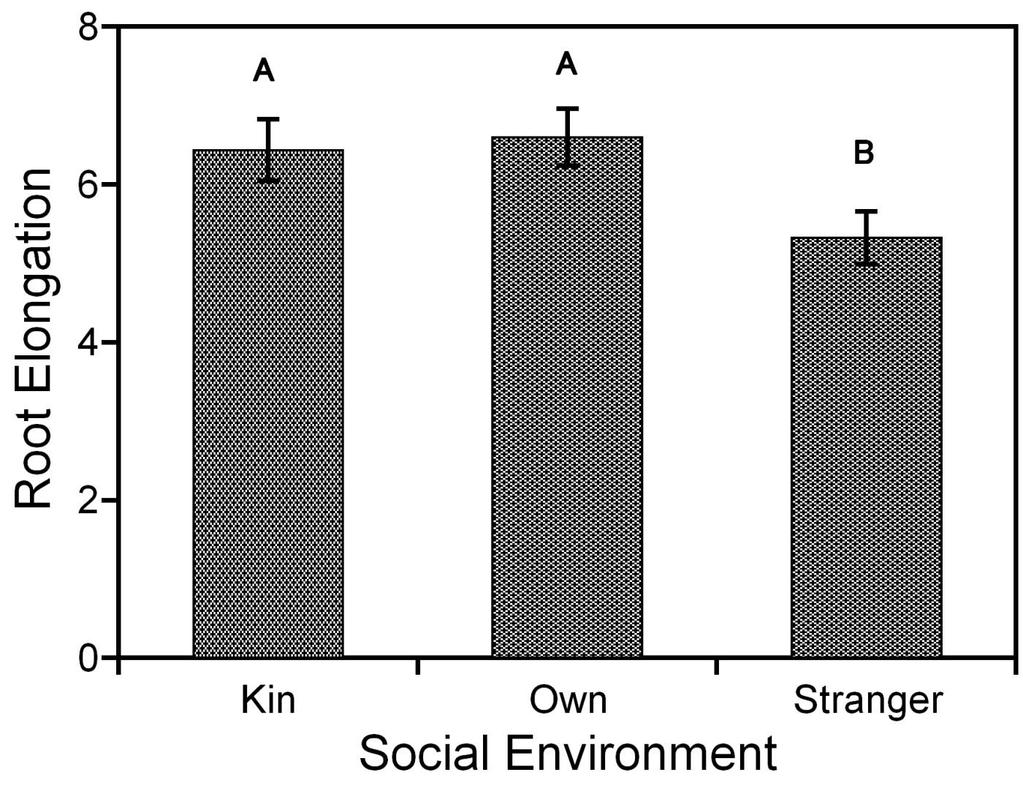
51 3.2 Nutrient-Rich experiment For this experiment, seedlings from four families were grown in liquid MS media (a nutrient-rich environment) for 14 days. There were no significant main effects of social environment and family on tap-root length (p<0.2410), total lateral length (p<0.7115), number of laterals (p<0.4005), total root length (p<0.5773), hypocotyl length (p<0.0927), total mass (p<0.9891), or aboveground mass (p<0.9834) (Table 3.2a, 3.2b and 3.2c). The root mass (p<0.0042) was affected by social environment but did not differ among families, with seedlings in stranger social environment having greater root mass than seedlings in kin or own social environment (Table 3.2c). Significant effects of social environment were observed for morphological and allocation traits (Table 3.2d, 3.2e, 3.2 f). Seedlings exposed to stranger exudates had decreased root elongation and increased root allocation compared to seedlings exposed to kin or own exudates (Figure 3.2a, 3.2b). Seedlings exposed to stranger exudates had significantly decreased specific root length compared to seedlings exposed to own exudates. Seedlings exposed to kin exudates did not differ in specific root length from seedlings exposed to stranger or own exudates (Figure 3.2c). 36
52 Table 3.2a: Analysis of variance for root architecture traits of Cakile edentula seedlings grown in liquid MS media in well-plates switched with either kin or stranger seedling for 14 days. Error d.f. is 94. N = 105. Family is C, F, G or H; Social environment is kin, stranger or own exudates. Source d.f. Tap-root length Number of laterals Total lateral length Total root length F- ratio P-value F- ratio P-value F- ratio P-value F- ratio P-value Family (F) Social Environment (S) F S
53 Table 3.2b: Analysis of variance for aboveground trait of Cakile edentula seedlings grown in sterile liquid MS media in well-plates switched with either kin or stranger seedling for 14 days. Error d.f. is 87. N = 95. Family is C, F, G or H; Social environment is kin, stranger or own exudates. Overall model significance is P< Source d.f. Hypocotyl length F-ratio P-value Family (F) Social Environment (S) F S
54 Table 3.2c: Analysis of variance for dry biomass of Cakile edentula seedlings grown in liquid MS media in well-plates switched with either kin or stranger seedling for 14 days. Error d.f. is 94. N =105. Family is C, F, G or H; Social environment is kin, stranger or own exudates. d.f. Total mass Root mass Aboveground Source mass F-ratio P-value F-ratio P-value F-ratio P-value Family (F) Social Environment (S) < F S
55 Table 3.2d: Root elongation analysis from analysis of covariance of tap-root length as the dependent variable and root mass as the covariate for Cakile edentula seedlings grown in liquid MS media in well-plates switched with either kin or stranger seedling for 14 days. Error d.f. is 92. N=104. Overall model significance is P < Source d.f. Root elongation F-ratio P-value Root mass Family (F) Social Environment (S) F S
56 Table 3.2e: Root allocation analysis from analysis of covariance of root mass as the dependent variable and aboveground mass as the covariate for Cakile edentula seedlings grown in liquid MS media in well-plates switched with either kin or stranger seedling for 14 days. Error d.f. is 92. N=104. Overall model significance is P < Source d.f. Root allocation F-ratio P-value Aboveground mass < Family (F) Social Environment (S) < F S
57 Table 3.2f: Specific root length from analysis of covariance of total root length as the dependent variable and root mass as the covariate for Cakile edentula seedlings grown in liquid MS media in well-plates switched with either kin or stranger seedling for 14 days. Error d.f. is 92. N=104. Overall model significance is P < Source d.f. Specific root length F-ratio P-value Root mass < Family (F) Social Environment (S) F S
58 Figure 3.2a: Bar graph of root elongation ( least square means of tap-root length with root biomass as the covariate) for Cakile edentula seedlings, grown in liquid MS media in well-plates, switched with either kin or stranger seedling for 14 days, in response to social environment. The letters indicate statistically significant differences between the social environment treatments at the 0.05 level. The bars indicate ±1 standard error. 43
59 44
60 Figure 3.2b: Bar graph of root allocation ( least square means of root mass with aboveground biomass as the covariate) for Cakile edentula seedlings, grown in liquid MS media in well-plates switched with either kin or stranger seedling for 14 days, in response to social environment. The letters indicate statistically significant differences between the social environment treatments at the 0.05 level. The bars indicate ±1 standard error. 45
61 46
62 Figure 3.2c: Bar graph of specific root length (least square means of total root length with root biomass as the covariate) for Cakile edentula seedlings, grown in liquid MS media in well-plates switched with either kin or stranger seedling for 14 days, in response to social environment. The letters indicate statistically significant differences between the social environment treatments at the 0.05 level. The bars indicate ±1 standard error. 47
63 48
64 3.3 Nutrient / no-nutrient combined experiment with four families For this experiment, seedlings from four families were grown in either liquid MS media (nutrient rich environment) or sterile water (no- nutrient environment) and exposed to their own exudates or exudates from kin or stranger seedlings for 14 days. The nutrient environment had a significant effect on several aboveground and below ground traits. Tap-root (p<0.0034), total biomass (p<0.0001), hypocotyl length (p<0.0057) and aboveground mass (p<0.0114) were significantly lower and the number of laterals (p<0.0001) were significantly greater for seedlings grown in no-nutrient environment than seedlings grown in nutrient-rich environment. The social environment had no effect on total lateral length, total root length, number of laterals, total biomass, tap root length, and aboveground mass traits. However, there were significant social environment nutrient environment interactions for tap-root length and hypocotyl length (Table 3.3a, 3.3b, 3.3c). When nutrients were available, seedlings exposed to their own exudates had longer tap root lengths than seedlings exposed to kin or stranger exudates. However, when no nutrients were available, there was no significant difference in tap root length between seedlings exposed to kin, stranger and own exudates (Figure 3.3a). Similarly, when nutrients were available, seedlings exposed to their own exudates had longer hypocotyl length than seedlings exposed to kin or stranger exudates. Seedlings grown in the nonutrient environment did not display a significant difference in hypocotyl length when exposed to kin, stranger and own (p<0.0057). The root biomass was affected by the social environment but not by nutrient environment, with lower root biomass in seedlings exposed to kin and own exudates than stranger exudates (Table 3.3a). 49
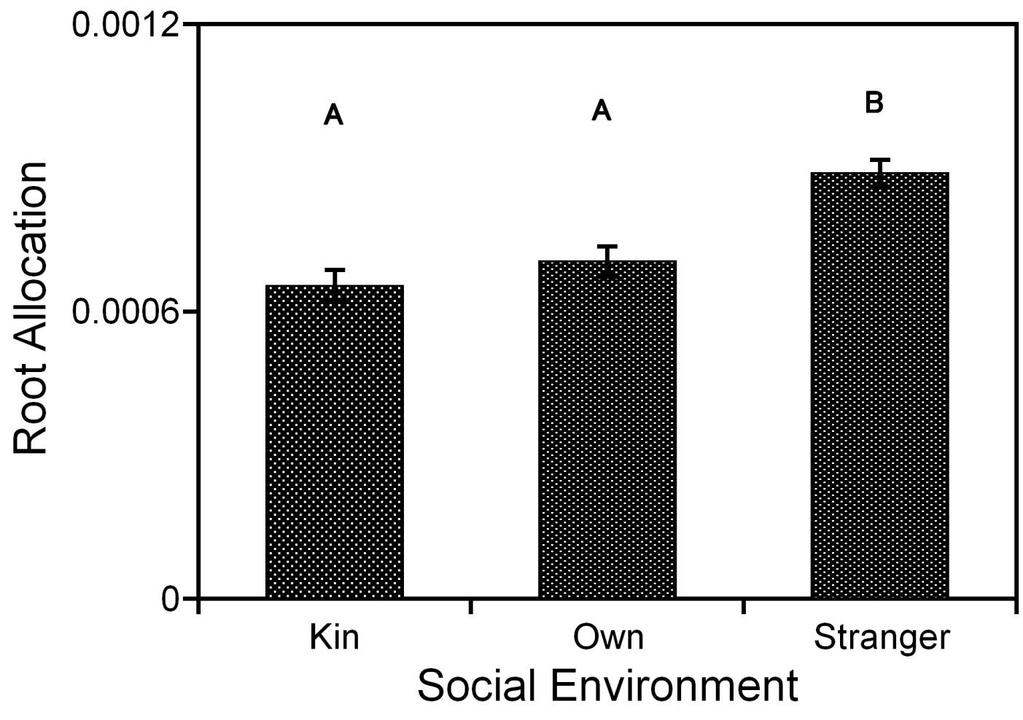
65 Root elongation and specific root length demonstrated significant environment nutrient environment interactions. When there were nutrients available, seedlings exposed to own exudates had more root elongation and specific root length than seedlings exposed to kin or stranger exudates. However, when nutrients were absent, there was no difference in root elongation and specific root length for seedlings exposed to kin, own or stranger exudates (Table 3.3d, 3.3f, Figure 3.3b, 3.3c). There were significant main effects of social environment and nutrient environment on root allocation traits. Seedlings grown in nutrients allocated less to roots than seedlings grown in no nutrient environment (Figure 3.3e). There was significantly greater root allocation in seedlings exposed to stranger exudates than to kin or own exudates (Figure 3.3d). However, this effect of social environment did not change with nutrient availability, as indicated by a non-significant social environment nutrient environment interaction (Table 3.3e). 50
66 Table 3.3a: Analysis of variance for root architecture traits of Cakile edentula seedlings grown in liquid MS media or sterile water in well-plates switched with either kin or stranger seedling for 14 days. Error d.f. is 228. N = 251. Family is C, D, B, E; Social environment is kin, stranger or own exudates; nutrient environment is nutrient and no nutrient. Source d.f. Tap-root length ln(total lateral length) Number of lateral Total root length F-ratio P-value F-ratio P-value F-ratio P-value F-ratio P-value Family (F) Social Environment (S) S F Nutrients (N) < F N S N S F N
67 Table 3.3b: Analysis of variance for Hypocotyl length of Cakile edentula seedlings grown in sterile liquid MS media or sterile water in well-plates switched with either kin or stranger seedling for 14 days. Error d.f. is 228. N = 251. Family is C, D, B, E; Social environment is kin, stranger or own exudates; Nutrient environment is nutrient and no nutrient. Source d.f. Hypocotyl length F-ratio P-value Family (F) Social Environment (S) S F Nutrients (N) F N S N S F N
68 Table 3.3c: Analysis of variance for dry biomass of Cakile edentula seedlings grown in liquid MS media or sterile water in well-plates switched with either kin or stranger seedling for 14 days. Error d.f. is 228. N = 251. Family is C, D, B, E; Social environment is kin, stranger or own exudates; Nutrient environment is nutrient and no nutrient. Source d.f. Total mass Root mass Aboveground mass F-ratio P-value F-ratio P-value F-ratio P-value Family (F) Social Environment (S) S F Nutrients (N) < < F N S N S F N
69 Table 3.3d: Root elongation analysis from analysis of covariance of tap-root length as the dependent variable and root mass as the covariate for Cakile edentula seedlings grown in liquid MS media or sterile water in well-plates switched with either kin or stranger seedling for 14 days. Family is C, D, B, E; Social environment is kin, stranger or own exudates; Nutrient environment is nutrient and no nutrient. Error d.f. is 226. N=250. Overall model significance is P < Source d.f. Root elongation F-ratio P-value Root mass < Family (F) Social Environment (S) S F Nutrients Environment (N) F N S N S F N
70 Table 3.3e: Root allocation analysis from analysis of covariance of root mass as the dependent variable and aboveground mass as the covariate for Cakile edentula seedlings grown in liquid MS media or sterile water in well-plates switched with either kin or stranger seedling for 14 days. Family is C, D, B, E; Social environment is kin, stranger or own exudates; Nutrient environment is nutrient and no nutrient. Error d.f. is 226. N=250. Overall model significance is P < Source d.f. Root allocation F-ratio P-value Aboveground mass < Family (F) Social Environment (S) S F Nutrients Environment (N) < F N S N S F N
71 Table 3.3f: Specific root length from analysis of covariance of total root length as the dependent variable and root mass as the covariate for Cakile edentula seedlings grown in liquid MS media in well-plates switched with either kin or stranger seedling for 14 days. Family is C, D, B, E; Social environment is kin, stranger or own exudates; Nutrient environment is nutrient and no nutrient. Error d.f. is 226. N=250. Overall model significance is P < Source d.f. Specific root length F-ratio P-value Root mass < Family (F) Social Environment (S) S F Nutrients (N) F N S N S F N
72 Figure 3.3a: Effect of social environment and nutrient environment on tap-root length for Cakile edentula seedlings grown either sterile water or liquid MS media in well-plates and switched with either kin or stranger seedling for 14 days. The bars indicate ±1 standard error. 57
73 58
74 Figure 3.3b: Effect of social environment and nutrient environment on root elongation (least square means of tap-root length with root biomass as the covariate) for Cakile edentula seedlings grown in either sterile water or liquid MS media in well-plates and switched with either kin or stranger seedling for 14 days. The bars indicate ±1 standard error. 59
75 60
76 Figure 3.3c: Effect of social environment and nutrient environment on specific root length (least square means of total root length with root biomass as the covariate) for Cakile edentula seedlings grown in either sterile water or liquid MS media in well-plates and switched with either kin or stranger seedling for 14 days. The bars indicate ±1 standard error. 61
77 62
78 Figure 3.3d: Bar graph showing the effect of social environment on root allocation (least square means of root mass with aboveground biomass as the covariate) for Cakile edentula seedlings, grown in either sterile water or liquid MS media in well-plates switched with either kin or stranger seedling for 14 days, in response to social environment. The letters indicate statistically significant differences between the social environment treatments at the 0.05 level. The bars indicate ±1 standard error. 63
79 64
80 Figure 3.3e: Bar graph showing the effect of nutrient environment on root allocation (least square means of root mass with aboveground biomass as the covariate) for Cakile edentula seedlings, grown in either sterile water or liquid MS media in well-plates switched with either kin or stranger seedling for 14 days, in response to social environment. The letters indicate statistically significant differences between the social environment treatments at the 0.05 level. The bars indicate ±1 standard error. 65
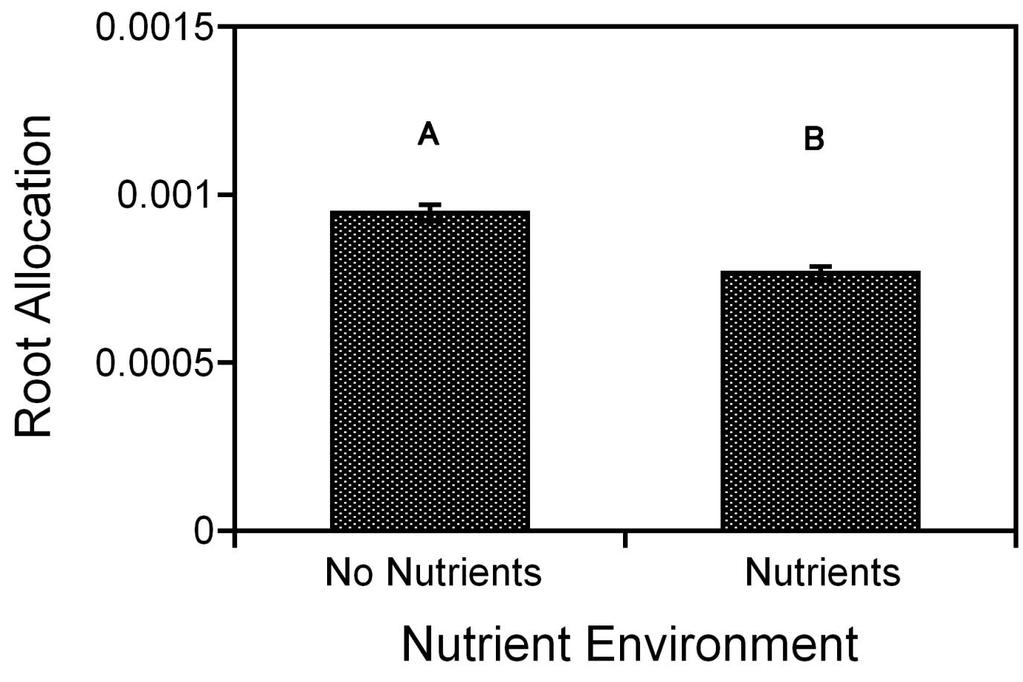
81 66
Kin recognition, not competitive interactions, predicts root allocation in young Cakile edentula seedling pairs
 Research Kin recognition, not competitive interactions, predicts root allocation in young Cakile edentula seedling pairs Mudra V. Bhatt, Aditi Khandelwal and Susan A. Dudley McMaster University, LS-225,
TREES. Functions, structure, physiology
 TREES Functions, structure, physiology Trees in Agroecosystems - 1 Microclimate effects lower soil temperature alter soil moisture reduce temperature fluctuations Maintain or increase soil fertility biological
Growth and development of Arabidopsis thaliana under single-wavelength red
 1 Supplementary Information 2 3 4 Growth and development of Arabidopsis thaliana under single-wavelength red and blue laser light 5 6 7 8 Authors Amanda Ooi 1 *, Aloysius Wong 1 *, Tien Khee Ng 2, Claudius
Kin recognition, multilevel selection and altruism in crop sustainability
 Journal of Ecology 2017, 105, 930 934 doi: 10.1111/1365-2745.12787 MINI-REVIEW: ECOLOGICAL SOLUTIONS TO GLOBAL FOOD SECURITY Kin recognition, multilevel selection and altruism in crop sustainability Guillermo
Name Date Block. Plant Structures
 Name Date Block What are the Functions of Roots, Stems, and Leaves? Plant Structures Each part of a plant plays an important role in its structure and function. Roots, stems, and leaves are just three
The response of native Australian seedlings to heat and water stress. Mallory T. R. Owen
 The response of native Australian seedlings to heat and water stress Mallory T. R. Owen Bachelor of Environmental Science Institute of Applied Ecology University of Canberra, ACT 2601, Australia A thesis
DENSITY-DEPENDENT MULTILEVEL SELECTION IN THE GREAT LAKES SEA ROCKET
 Ecology, 85(1), 2004, pp. 180 191 2004 by the Ecological Society of America DENSITY-DEPENDENT MULTILEVEL SELECTION IN THE GREAT LAKES SEA ROCKET KATHLEEN DONOHUE 1 Department of Organismic and Evolutionary
What is competition? Competition among individuals. Competition: Neutral Theory vs. the Niche
 Competition: Neutral Theory vs. the Niche Reading assignment: Ch. 10, GSF (especially p. 237-249) Optional: Clark 2009 9/21/09 1 What is competition? A reduction in fitness due to shared use of a limited
Newey, Philip Simon (2009) Colony mate recognition in the weaver ant Oecophylla smaragdina. PhD thesis, James Cook University.
 Colony mate recognition in the weaver ant Oecophylla smaragdina. PhD thesis, James Cook University.") This file is part of the following reference: Newey, Philip Simon (2009) Colony mate recognition in the weaver ant Oecophylla smaragdina. PhD thesis, James Cook University. Access to this file is available
This file is part of the following reference: Newey, Philip Simon (2009) Colony mate recognition in the weaver ant Oecophylla smaragdina. PhD thesis, James Cook University. Access to this file is available
Assessment Schedule 2013 Biology: Demonstrate understanding of the responses of plants and animals to their external environment (91603)
") NCEA Level 3 Biology (91603) 2013 page 1 of 6 Assessment Schedule 2013 Biology: Demonstrate understanding of the responses of plants and animals to their external environment (91603) Assessment Criteria
NCEA Level 3 Biology (91603) 2013 page 1 of 6 Assessment Schedule 2013 Biology: Demonstrate understanding of the responses of plants and animals to their external environment (91603) Assessment Criteria
Useful Propagation Terms. Propagation The application of specific biological principles and concepts in the multiplication of plants.
 Useful Propagation Terms Propagation The application of specific biological principles and concepts in the multiplication of plants. Adventitious Typically describes new organs such as roots that develop
The Influence of Neighbor Relatedness on Multilevel Selection in the Great Lakes Sea Rocket
 vol. 162, no. 1 the american naturalist july 2003 The Influence of Neighbor Relatedness on Multilevel Selection in the Great Lakes Sea Rocket Kathleen Donohue * Department of Organismic and Evolutionary
Plant Structure and Organization - 1
 Plant Structure and Organization - 1 In our first unit of Biology 203 we will focus on the structure and function of the higher plants, in particular the angiosperms, or flowering plants. We will look
Figure 1. Identification of UGT74E2 as an IBA glycosyltransferase. (A) Relative conversion rates of different plant hormones to their glucosylated
 Relative conversion rates of different plant hormones to their glucosylated") Figure 1. Identification of UGT74E2 as an IBA glycosyltransferase. (A) Relative conversion rates of different plant hormones to their glucosylated form by recombinant UGT74E2. The naturally occurring auxin
Figure 1. Identification of UGT74E2 as an IBA glycosyltransferase. (A) Relative conversion rates of different plant hormones to their glucosylated form by recombinant UGT74E2. The naturally occurring auxin
A Level. A Level Biology. AQA, OCR, Edexcel. Photosynthesis, Respiration Succession and Nutrient Cycle Questions. Name: Total Marks: Page 1
 AQA, OCR, Edexcel A Level A Level Biology Photosynthesis, Respiration Succession and Nutrient Cycle Questions Name: Total Marks: Page 1 Q1. The diagram shows the energy flow through a freshwater ecosystem.
Figure 2 If birds eat insects that feed on corn, which pyramid level in the diagram would birds occupy? 1. A 3. C 2. B 4. D
 Ecology Week 1 Assignment. This week's assignment will count as a quiz grade. Please speak to Mr. Roes about any questions that you would like help on! 1. The fact that no organism exists as an entity
Plants are sessile. 10d-17/giraffe-grazing.jpg
 Plants are sessile www.mccullagh.org/db9/ 10d-17/giraffe-grazing.jpg Plants have distinct requirements because of their sessile nature Organism-level requirements Must adjust to environment at given location
1 Soil Factors Affecting Nutrient Bioavailability... 1 N.B. Comerford
 Contents 1 Soil Factors Affecting Nutrient Bioavailability........ 1 N.B. Comerford 1.1 Introduction........................... 1 1.2 Release of Nutrients from the Soil Solid Phase........ 2 1.3 Nutrient
Name: B5 PLANT HORMONES. Class: Practice questions. Date: 53 minutes. Time: 53 marks. Marks: Biology Only. Comments: Page 1 of 25
 B5 PLANT HORMONES Practice questions Name: Class: Date: Time: 53 minutes Marks: 53 marks Comments: Biology Only Page of 25 Hormones called auxins control plant growth. A student investigated plant growth
UNIT A: Basic Principles of Plant Science with a focus on Field Crops. Lesson 1: Examining Plant Structures and Functions
 UNIT A: Basic Principles of Plant Science with a focus on Field Crops Lesson 1: Examining Plant Structures and Functions 1 Terms Alternate leaf arrangement Bulb Cell Cell specialization Cladophyll Compound
Earth Has a Rich Diversity of Plants. Plant Structure, Nutrition, and Transport. Angiosperms: Monocots and Dicots. Angiosperms: Dicots
 Plant Structure, Nutrition, and Transport Earth Has a Rich Diversity of Plants There are over 280,000 different plant species organized into four major groups: bryophytes (mosses), seedless vascular plants,
BIOL4. (JAN13BIOL401) WMP/Jan13/BIOL4. General Certificate of Education Advanced Level Examination January Unit 4 Populations and environment
 WMP/Jan13/BIOL4. General Certificate of Education Advanced Level Examination January Unit 4 Populations and environment") Centre Number Surname Candidate Number For Examiner s Use Other Names Candidate Signature Examiner s Initials General Certificate of Education Advanced Level Examination January 2013 Question 1 2 Mark
Centre Number Surname Candidate Number For Examiner s Use Other Names Candidate Signature Examiner s Initials General Certificate of Education Advanced Level Examination January 2013 Question 1 2 Mark
EFFECTS OF PLANT SOCIAL ENVIRONMENT ON MYCORRHIZAE
 EFFECTS OF PLANT SOCIAL ENVIRONMENT ON MYCORRHIZAE EFFECTS OF PLANT SOCIAL ENVIRONMENT ON THE MUTUALISTIC INTERACTIONS BETWEEN PLANTS AND MYCORRHIZAL FUNGI By AMANDA LOUISE FILE, B.Sc A Thesis Submitted
Root competition influences pollen competitive ability in. Viola tricolor: effects of presence of a competitor beyond resource availability?
 Journal of Ecology 2008, 96, 756 765 doi: 10.1111/j.1365-2745.2008.01387.x Root competition influences pollen competitive ability in Blackwell Publishing Ltd Viola tricolor: effects of presence of a competitor
Biomes Section 2. Chapter 6: Biomes Section 2: Forest Biomes DAY ONE
 Chapter 6: Biomes Section 2: Forest Biomes DAY ONE Of all the biomes in the world, forest biomes are the most widespread and the most diverse. The large trees of forests need a lot of water, so forests
25-3 Plant Adaptations Slide 2 of 29
 2 of 29 Aquatic Plants How are plants adapted to different environments? 3 of 29 Aquatic Plants Aquatic Plants To take in sufficient oxygen, many aquatic plants have tissues with large air-filled spaces
STAAR REVIEW 2015 BIOLOGICAL PROCESSES AND SYSTEMS:
 Name: STAAR REVIEW 2015 BIOLOGICAL PROCESSES AND SYSTEMS: Which body system(s) would be used for running? EX: Food is chewed, swallowed, and passed into the stomach where it is broken down into nutrients.
Question: All large trees start as little seeds. What provided most of the mass that allow trees to grow so large?
 Question: All large trees start as little seeds. What provided most of the mass that allow trees to grow so large? I think most it came from the nutrients in the soil that are taken up by the roots. I
SEED DORMANCY. Seed dormancy definitions. Seed dormancy. Seed dormancy 10/14/2013
 Seed dormancy definitions SEED DORMANCY Seed dormancy is a survival mechanism by which seeds can delay germination until the right environmental conditions for seedling growth and development. Seed dormancy
Ecosystems. 1. Population Interactions 2. Energy Flow 3. Material Cycle
 Ecosystems 1. Population Interactions 2. Energy Flow 3. Material Cycle The deep sea was once thought to have few forms of life because of the darkness (no photosynthesis) and tremendous pressures. But
Partnerships Implementing Engineering Education Worcester Polytechnic Institute Worcester Public Schools
 Life Sciences: 4.E.6 Seeds Part 3 of 3 Grade Level 4 Sessions Seasonality Instructional Mode(s) Team Size WPS Benchmarks MA Frameworks Key Words 45-60 min. N/A Whole class N/A 04.SC.LS.06 04.SC.LS.07 04.SC.LS.08
Cooperation. Main points for today. How can altruism evolve? Group living vs. cooperation. Sociality-nocooperation. and cooperationno-sociality
 Cooperation Why is it surprising and how does it evolve Cooperation Main points for today Sociality, cooperation, mutualism, altruism - definitions Kin selection Hamilton s rule, how to calculate r Group
Australian tropical savanna Information sheet
 Australian tropical savanna Information sheet This is an example of an Australian savanna landscape with small trees and the ground covered in grasses. Where Australia s tropical savanna is spread over
2018 Version. Photosynthesis Junior Science
 2018 Version Photosynthesis Junior Science 1 Plants fill the role of Producers in a community Plants are special because they have leaves and are able to produce their own food by the process of photosynthesis
Botany: Plant Dissection Student Advanced Version
 Botany: Plant Dissection Student Advanced Version In this lab, we will learn about the structure and function of plants, and how plants are useful in our everyday lives. Key Concepts: Plants have been
Chapter 6 Lecture. Life History Strategies. Spring 2013
 Chapter 6 Lecture Life History Strategies Spring 2013 6.1 Introduction: Diversity of Life History Strategies Variation in breeding strategies, fecundity, and probability of survival at different stages
10/6/ th Grade Ecology and the Environment. Chapter 2: Ecosystems and Biomes
 7 th Grade Ecology and the Environment Chapter 2: Ecosystems and Biomes Lesson 1 (Energy Flow in Ecosystems) Each organism in an ecosystem fills an energy role. Producer an organism that can make its own
1. The graph below represents a change in event A that leads to changes in events B and C.
 1. The graph below represents a change in event A that leads to changes in events B and C. Which row in the chart best identifies each event in the graph? A) 1 B) 2 C) 3 D) 4 2. A stable ecosystem is characterized
What were some challenges that plants had to overcome as they moved to land? Drying out in the sun Conserving water Reproduction without water
 Classification of Plants (Ch. 22) The 3 major characteristics that make an organism a plant are: Multicellular eukaryote Cell walls with cellulose Carry out photosynthesis Plants most likely evolved from:
FINAL VERSION_ Secondary Preservice Teacher Standards -- Life Science AFK12SE/NGSS Strand Disciplinary Core Idea
 Secondary Preservice Teacher Standards -- Life Science AFK12SE/NGSS Strand Disciplinary Core Idea LS1: From Molecules to Organisms: Structures and Processes LS1.A: Structure and Function How do the structures
LECTURE 03: PLANT GROWTH PARAMETERS
 http://smtom.lecture.ub.ac.id/ Password: https://syukur16tom.wordpress.com/ Password: LECTURE 03: PLANT GROWTH PARAMETERS The most elementary processes of growth is cell growth and division that bring
Structures and Functions of Living Organisms
 Structures and Functions of Living Organisms 6.L.1 Understand the structures, processes and behaviors of plants that enable them to survive and reproduce. 6.L.1.1 Summarize the basic structures and functions
Level 1 Biology, 2011
 90928 909280 1SUPERVISOR S Level 1 Biology, 2011 90928 Demonstrate understanding of biological ideas relating to the life cycle of flowering plants 9.30 am riday Friday 1 November 2011 Credits: Four Achievement
The University of Chicago
 The University of Chicago Testing the Adaptive Plasticity Hypothesis: Density-Dependent Selection on Manipulated Stem Length in Impatiens capensis Author(s): Susan A. Dudley and Johanna Schmitt Source:
Partnerships Implementing Engineering Education Worcester Polytechnic Institute Worcester Public Schools
 Partnerships Implementing Engineering Education Worcester Polytechnic Institute Worcester Public Schools Supported by: National Science Foundation Life Sciences: 4.E.4 Seeds Part 1 of 3 Grade Level 4 Sessions
2013 Assessment Report. Biology Level 1
 National Certificate of Educational Achievement 2013 Assessment Report Biology Level 1 90927 Demonstrate understanding of biological ideas relating to micro-organisms 90928 Demonstrate understanding of
Eichhornia crassipes (water hyacinth) Tristylous, clonal
 Tristylous, clonal") Plant of the Day Eichhornia crassipes (water hyacinth) Native to South America Tristylous, clonal Invasive in Asia, Africa, North America, Australia Clogs waterways, blocks sunlight and reduces oxygen
Plant of the Day Eichhornia crassipes (water hyacinth) Native to South America Tristylous, clonal Invasive in Asia, Africa, North America, Australia Clogs waterways, blocks sunlight and reduces oxygen
1. The drawings below show three healthy young plants. A B C. The drawings below show the three plants after two weeks.
 1. The drawings below show three healthy young plants. A B C The drawings below show the three plants after two weeks. A C B (a) (i) Plant B did not have enough light. How can you tell this from the drawing?....
Virtually all multicellular organisms possess recognition systems
 Physiologically mediated self non-self discrimination in roots Michal Gruntman and Ariel Novoplansky* Mitrani Department of Desert Ecology, Blaustein Institute for Desert Research, Ben-Gurion University
Mrs. Fanek Ecology Date
 Name Period Mrs. Fanek Ecology Date 1. The graph below represents a change in event A that leads to changes in events B and C. Which row in the chart best identifies each event in the graph? A) 1 B) 2
Desert Patterns. Plants Growth and reproduction Water loss prevention Defenses. Animals Growth and reproduction Water loss prevention Defenses
 Desert Patterns Plants Growth and reproduction Water loss prevention Defenses Animals Growth and reproduction Water loss prevention Defenses Abiotic Features Introduction A major emphasis in ecology is
Plant Growth and Development
 Plant Growth and Development Concept 26.1 Plants Develop in Response to the Environment Factors involved in regulating plant growth and development: 1. Environmental cues (e.g., day length) 2. Receptors
Physiological Ecology, Bio 31 Final Exam, 1 June 2013
 Physiological Ecology, Bio 31 Final Exam, 1 June 2013 Name: 9 pts 1. Briefly define or identify each of the following terms. epistasis - Jensen s Inequality - science - 8 pts 2. Distinguish between the
Material cycles and energy: photosynthesis
 7 Material cycles and energy: photosynthesis Remember: Plants are living organisms and can carry out all the life processes. Plants must be able to make foods. The foods provide raw materials for growth
Downloaded from
 Nutrition in Plants 1.If the pitcher plant is green and carries out photosynthesis then why does it feed on insects? 2.Which of the following part/s of a desert plant perform the function of photosynthesis?
ENVE203 Environmental Engineering Ecology (Nov 19, 2012)
") ENVE203 Environmental Engineering Ecology (Nov 19, 2012) Elif Soyer Biological Communities COMPETITION Occurs when 2 or more individuals attempt to use an essential common resource such as food, water,
ENVE203 Environmental Engineering Ecology (Nov 19, 2012) Elif Soyer Biological Communities COMPETITION Occurs when 2 or more individuals attempt to use an essential common resource such as food, water,
Botany: The Plant Dissection Lab
 Botany: The Plant Dissection Lab Basic Version In this lab, we will learn about the structure and function of plants, and how plants are useful in our everyday lives. Key Concepts: Plants have been on
Why do invasive species do so well?
 Why do invasive species do so well? Authors: Jennifer Bowen, Patrick Kearns, Jarrett Byrnes, Sara Wigginton, Warwick Allen, Michael Greenwood, Khang Tran, Jennifer Yu, James Cronin and Laura Meyerson Associate
5. Which graph represents a population that grew and is maintained at the carrying capacity of its ecosystem?
 Date: Pd. Regents Review Assignment #5 Living Environment 2 Part A Questions 1. Which structures carry out life functions within cells? (1) tissues (3) organelles (2) organ systems (4) organs 2. The sorting
GRADE 7: Life science 4. UNIT 7L.4 7 hours. Growing plants. Resources. About this unit. Previous learning. Expectations
 GRADE 7: Life science 4 Growing plants UNIT 7L.4 7 hours About this unit This unit is the fourth of six units on life science for Grade 7. This unit is designed to guide your planning and teaching of lessons
Carbon Input to Ecosystems
 Objectives Carbon Input Leaves Photosynthetic pathways Canopies (i.e., ecosystems) Controls over carbon input Leaves Canopies (i.e., ecosystems) Terminology Photosynthesis vs. net photosynthesis vs. gross
(a) The area of forest lost each year in Madagascar increased between 2009 and 2012.
 The area of forest lost each year in Madagascar increased between 2009 and 2012.") Q1.The graph below shows the area of forest lost in Madagascar from 2009 to 2012. (a) The area of forest lost each year in Madagascar increased between 2009 and 2012. Determine the total area of forest
Q1.The graph below shows the area of forest lost in Madagascar from 2009 to 2012. (a) The area of forest lost each year in Madagascar increased between 2009 and 2012. Determine the total area of forest
Which row in the chart below identifies the lettered substances in this process?
 1. A biological process that occurs in both plants and animals is shown below. Which row in the chart below identifies the lettered substances in this process? A) 1 B) 2 C) 3 D) 4 2. All life depends on
Abiotic Stress in Crop Plants
 1 Abiotic Stress in Crop Plants Mirza Hasanuzzaman, PhD Professor Department of Agronomy Sher-e-Bangla Agricultural University E-mail: mhzsauag@yahoo.com Stress Stress is usually defined as an external
1. The basic structural and physiological unit of all living organisms is the A) aggregate. B) organelle. C) organism. D) membrane. E) cell.
 aggregate. B) organelle. C) organism. D) membrane. E) cell.") Name: Date: Test File Questions 1. The basic structural and physiological unit of all living organisms is the A) aggregate. B) organelle. C) organism. D) membrane. E) cell. 2. A cell A) can be composed
Name: Date: Test File Questions 1. The basic structural and physiological unit of all living organisms is the A) aggregate. B) organelle. C) organism. D) membrane. E) cell. 2. A cell A) can be composed
TOPIC 9.4 REPRODUCTION OF PLANTS
 TOPIC 9.4 REPRODUCTION OF PLANTS INTRO https://media1.britannica.com/eb-media/41/62941-004-e3f5377b.jpg IB BIO 9.4 2 Flowers are reproductive structures found in flowering plants. Their function is to
Plant responses to climate change in the Negev
 Ben-Gurion University of the Negev Plant responses to climate change in the Negev 300 200 150? Dr. Bertrand Boeken Dry Rangeland Ecology and Management Lab The Wyler Dept. of Dryland Agriculture Jacob
Do seeds metabolize? Measuring carbon dioxide production in seeds, before and during germination.
 and during germination. and during germination Objective The objective of the study is for students to compare the amount of carbon dioxide generated before and during seed germination, through the formulation
Name: Class: Date: Ecosystem Interactions. Multiple Choice Identify the choice that best completes the statement or answers the question.
 Name: Class: _ Date: Ecosystem Interactions Multiple Choice Identify the choice that best completes the statement or answers the question. 1. In an ecosystem, organism interact with living and non-living
HALF YEARLY EXAMINATIONS
 Secondary School HALF YEARLY EXAMINATIONS 2016-2017 FORM: 3 Biology Time: 2 hours Name: Class: Section A: Answer ALL questions in the space provided. This section carries a total of 55 marks. 1. The frog
Plants allocate carbon to enhance performance and to increase plant fitness
 CO2 Plants allocate carbon to enhance performance and to increase plant fitness Plant Ecology in a Changing World Jim Ehleringer, University of Utah http://plantecology.net Plants allocate resources to
Electromagenetic spectrum
 Light Controls of Plant Development 1 Electromagenetic spectrum 2 Light It is vital for photosynthesis and is also necessary to direct plant growth and development. It acts as a signal to initiate and
Generation Date: 12/07/2015 Generated By: Tristan Wiley Title: Bio I Winter Packet
 Generation Date: 12/07/2015 Generated By: Tristan Wiley Title: Bio I Winter Packet 1. Many natural ecosystems have been destroyed by human activity. To better manage our remaining natural ecosystems, we
Assessment Schedule 2017 Biology: Demonstrate understanding of biological ideas relating to the life cycle of flowering plants (90928)
") NCEA Level 1 Biology (90928) 2017 page 1 of 5 Assessment Schedule 2017 Biology: Demonstrate understanding of biological ideas relating to the life cycle of flowering plants (90928) Evidence Statement QUESTION
NCEA Level 1 Biology (90928) 2017 page 1 of 5 Assessment Schedule 2017 Biology: Demonstrate understanding of biological ideas relating to the life cycle of flowering plants (90928) Evidence Statement QUESTION
biotic factors camouflage carnivore chloroplast
 non-living parts of an organism's environment Eg air currents, temperature, moisture, light, and soil type special features about an organism that help it survive and reproduce living things that is different
For Examiner s Use Total EMPA mark Surname. Candidate. Number. Other Names
 Centre Number Candidate Number For Examiner s Use Total EMPA mark Surname Other Names Notice to Candidate. The work you submit for assessment must be your own. If you copy from someone else or allow another
Local resource competition. Sex allocation Is the differential allocation of investment in sons vs. daughters to increase RS. Local mate competition
 Sex allocation Is the differential allocation of investment in sons vs. daughters to increase RS Local resource competition Biased against the competing sex Fisher: Genetic model predicts 1:1 sex ratio
Assessment Schedule 2016 Biology: Demonstrate understanding of the responses of plants and animals to their external environment (91603)
") NCEA Level 3 Biology (91603) 2016 page 1 of 6 Assessment Schedule 2016 Biology: Demonstrate understanding of the responses of plants and animals to their external environment (91603) Evidence Statement
NCEA Level 3 Biology (91603) 2016 page 1 of 6 Assessment Schedule 2016 Biology: Demonstrate understanding of the responses of plants and animals to their external environment (91603) Evidence Statement
WATER REQUIREMENTS: Teacher Demonstration
 WATER REQUIREMENTS: Teacher Demonstration Objective Students will be able to describe the role of water in seed germination. : two cups of lima beans milk carton (one pint) water. Questions for the Students
Reduction of Exudates (Browning) in Sugarcane Micro Propagation
 in Sugarcane Micro Propagation") Nig J. Biotech. Vol. 23 (2011) 40-44 ISSN: 0189 17131 Available online at www.biotechsocietynigeria.org. Reduction of Exudates (Browning) in Sugarcane Micro Propagation Ishaq M.N. and Ehirim Bernard O.
Nig J. Biotech. Vol. 23 (2011) 40-44 ISSN: 0189 17131 Available online at www.biotechsocietynigeria.org. Reduction of Exudates (Browning) in Sugarcane Micro Propagation Ishaq M.N. and Ehirim Bernard O.
PSSA Science Review. Organisms and the Environment. Organisms and the Environment
 PSSA Science Review Organisms and the Environment Organisms and the Environment 1. Natural Selection 2. Heredity 3. Ecological Relationships and Systems 4. Change and the Environment 5. Humans and the
Botany: The Plant Dissection Lab
 Botany: The Plant Dissection Lab Advanced Version In this lab, we will learn about the structure and function of plants, and how plants are useful in our everyday lives. Key Concepts: Plants have been
Materials Per Class Per Bench. 50 ml beakers 6 1. Hole punch 6 1. Forceps 6 1. Timers or a clock with second hand 6 1
 Photosynthesis Materials Per Class Per Bench 1% solution of sodium bicarbonate (NaHCO 3 ) (by adding approximately 1g sodium bicarbonate to 100 ml DI water). Light sources, 60 watt bulb or higher 3 or
UNIVERSITY OF YORK BIOLOGY. Animal and Plant Biology Part II
 Examination Candidate Number: Desk Number: UNIVERSITY OF YORK BSc Stage 1 Degree Examinations 2017-18 Department: BIOLOGY Title of Exam: Animal and Plant Biology Part II Time allowed: 2 hours Total marks
Structures and Functions of Living Organisms
 Structures and Functions of Living Organisms Date: 6.L.1 Understand the structures, processes and behaviors of plants that enable them to survive and reproduce. 6.L.1.1 Summarize the basic structures and
Validation of a leaf reflectance and transmittance model for three agricultural crop species
 Validation of a leaf reflectance and transmittance model for three agricultural crop species Application Note Author G. J. Newnham* and T. Burt** *Remote Sensing and Satellite Research Group, Curtin University
UNIVERSITY OF CAMBRIDGE INTERNATIONAL EXAMINATIONS International General Certificate of Secondary Education
 UNIVERSITY OF CAMBRIDGE INTERNATIONAL EXAMINATIONS International General Certificate of Secondary Education *7021514936* BIOLOGY 0610/02 Paper 2 Core May/June 2007 1 hour 15 minutes Candidates answer on
Division Ave. High School AP Biology
 Monocots & dicots Angiosperm are divide into 2 classes dicots (eudicot) 2 cotyledons (seed leaves) leaves with network of veins woody plants, trees, shrubs, beans monocots 1 cotyledon leaves with parallel
Flowers Seeds Pollination Germination
 * Flowers Seeds Pollination Germination *In order for plants to be successful in many different environments they must be able to reproduce themselves. *The reproductive patterns of plants reflect the
The effect of temperature on the germination of Arabidopsis thaliana seeds
 The effect of temperature on the germination of Arabidopsis thaliana seeds Tina Afshar, Nikeisha Dass, Caron Lau, Alana Lee Abstract Arabidopsis thaliana is a model organism widely used by researchers
By the end of this lesson, you should be able to
 Allelopathy 1 Allelopathy By the end of this lesson, you should be able to define allelopathy explain the difference between allelopathy and competition identify the key interactions in allelopathy provide
Plant Growth as a Function of LED Lights
 Plant Growth as a Function of LED Lights Authors' Names Redacted Abstract: In most lab settings the Brassica Rapa plant can be efficiently grown under a 32-watt fluorescent light bulb. In this experiment
1 29 g, 18% Potato chips 32 g, 23% 2 30 g, 18% Sugar cookies 35 g, 30% 3 28 g, 19% Mouse food 27 g, 18%
 1. When testing the benefits of a new fertilizer on the growth of tomato plants, the control group should include which of the following? A Tomato plants grown in soil with no fertilizer B Tomato plants
INTRODUCTION bioactive compounds Pigmentation chromobacteria water soluble water insoluble
 INTRODUCTION So far we have witnessed several useful applications of microbes including applications in food and the bioremediation of the environment. Besides consuming the desired substrate (oil) and
Key Plant Unit Test Multiple Choice
 Plant Unit Test Multiple Choice For questions 1 25, circle the letter of the best answer from the choices provided. (2 pts each) For questions 1 3, refer to the diagram of the plant cell below: A B C D
Resource acquisition and transport in vascular plants
 Resource acquisition and transport in vascular plants Overview of what a plant does Chapter 36 CO 2 O 2 O 2 and and CO 2 CO 2 O 2 Sugar Light Shoots are optimized to capture light and reduce water loss
Roots, Shoots & Leaves
 Name Test Date Hour Plant Structure & Function #2 - Notebook Roots, Shoots & Leaves LEARNING TARGETS I can describe the functions of roots I can explain the nitrogen fixing process and why it is needed.
Introduction. Ecology is the scientific study of the interactions between organisms and their environment.
 Introduction Ecology is the scientific study of the interactions between organisms and their environment. 1. The interactions between organisms and their environments determine the distribution and abundance
Grade 4 Structures of Life Unit Template
 Delaware Science Coalition Grade 4 Structures of Life Unit Template Copyright 2008 Delaware Department of Education Copyright 2008 Delaware Department of Education Page 1 of 13 Preface: This unit has been
TUNDRA. Column 1 biome name Column 2 biome description Column 3 examples of plant adaptations
 Biome Cards (pp. 1 of 7) Cut out each biome card and divide each card into three sections. Place all sections in a plastic storage bag. Have one bag for every two students. Column 1 biome name Column 2