Demand Forecasting Reporting Period: 4 th Dec th Mar 2018
|
|
|
- Anissa Chase
- 6 years ago
- Views:
Transcription
1 N A T I O N A L G R I D P A G E 1 O F 25 C O M M E R C I A L, E L E C T R I C I T Y C O M M E R C I A L O P E R A T I O N S Demand Forecasting Reporting Period: 4 th Dec th Mar 2018 EXECUTIVE SUMMARY This report provides an overview of National Grid s national demand, solar and wind forecasting performance for the reporting period 4 th of December 2017 to the 11 th of March 2018, and the work currently underway to reduce these errors. The magnitude of forecasting errors is discussed at the different lead times of within-day, day ahead, 2-14days ahead and 2-52 weeks ahead. Demand forecast s late evening and overnight cardinal point forecast errors were generally comparable to or reduced compared to the previous period. This was in spite of more volatile and difficult to forecast weather. However, the errors for the remainder of our cardinal point forecasts increased, including that of the early evening DP cardinal point due to Triad Avoidance. On the 1 st of March, we experienced the peak national demand of 49.8GW for the whole reporting year (1 st April th March 2018), which for the first time occurred outside of the Triad Period. This happened due to unseasonal, extreme cold and windy weather, which also brought snow to the majority of the country. This contrasted with an overnight minimum of 18.3GW on Christmas Day. Wind generation forecasting improved compared to the previous Quarter, albeit still reporting errors generally above the target threshold of 4.75%. We attribute the improvement to a significant campaign of wind power forecasting model upgrades undertaken in late November, which helped to underpin our performance through to March. Our wind forecasts were also generally unbiased during this period. Both our wind generation and demand forecasting model suites will continue to attract focussed updates and improvements to underpin our forecasting performance. In spite of a backdrop of changing system conditions we have continued to provide high quality demand and wind generation forecasts. With system changes such as increasing distributionconnected generation and new technologies such as batteries and smart meters, maintaining transmission-system demand forecast accuracies will become increasingly challenging. To meet these new challenges we plan to build actively upon our existing work and projects with the final objective to deliver real value to market participants and final consumers. 1
2 INTRODUCTION Under section 4H of the Transmission Licence, National Grid is obliged to publish a quarterly report describing our demand, wind and solar generation forecasts from within-day to 52 weeks ahead. We are also required to describe the actions that we have taken that have affected forecast errors and an analysis of the causes and future actions to reduce these errors. This report contains an overview of the differences between national demand, wind and solar forecasts and their outturns with different lead-in times during the Qtr. 4 reporting period 4 th of December 2017 to 11 th of March Some key demand outturns of the Qtr.4 reporting period are given below. Key Numbers Date Half hour Power (GW) Peak Demand 1 st Mar Overnight minimum 25 th Dec Daytime minimum 24 th Feb Maximum PV output 25 th Feb For the first time, we saw the peak demand for the year occurring outside the Triad period - specifically on the 1 st of March More information is found on this within the Case Study later in this report. At the end of the reporting period installed capacities for wind and solar reached 31.8GW. This is 1.3GW higher than reported at the end of the previous Quarter. The greatest increase was reported for metered wind capacity at 1GW. Embedded wind and solar capacities, which directly affect our demand forecasts, continue to increase, as forecast for the foreseeable future. Generation Type Capacity (GW) Metered Wind 12.8 Embedded Wind 5.9 Embedded Solar 13.1 Total Wind & Solar 31.8 This report describes in detail the national electricity demand (national demand/indo equivalent) forecasts and its major components: Embedded PV generation Embedded wind generation Weather forecast input data We also report on the metered wind generation forecasting performance, as well as report on the work we have undertaken to improve both demand and wind generation forecasts. Special attention is paid to the incentivised forecasts, made one, two and seven days ahead. 2

3 DEMAND FORECAST ERRORS We produce forecasts at multiple time horizons, from within-day up to five years ahead. Overall we typically produce over 100 forecasts for the peak demand for a particular day over the preceding five years. Forecasts at or greater than 14 days ahead are based on seasonal average weather, whilst those from within day to 13 days ahead use the latest available weather forecasts. It should be noted that most weather forecast models run from 0 to 6 days ahead, and that the accuracy of weather forecasts decreases significantly from the 7 th to the 13 th day ahead. The table below shows the mean absolute error for all cardinal points, and for all lead times up to 13 days into the future. This table encompasses more than just our incentivised forecasts, which are restricted to one, two and seven days ahead. With forecast lead-time increasing (i.e. a forecast projecting further into the future), the errors grow, as can be expected. In comparison with Qtr. 3, and consistent with the time of year, the mean absolute errors for most cardinal points and lead-times have increased. Some exceptions include the overnight cardinal points for (in particular 1F, 1A and 03) from within-day to around 2days ahead. errors < errors< errors< errors 1000 errors > 1000 The major components of the demand forecast errors are explained in detail in Appendix 1. During this Quarter, 13DA forecasts for 1F, 1A and 4C were not produced, hence are omitted from the table and the figures below. The graphs below show how the mean absolute error for each cardinal point forecast changed with forecast horizon, from 0 to 13 days ahead. The data is broken into forecasts for the overnight, daytime and evening cardinal points. 3
4 4
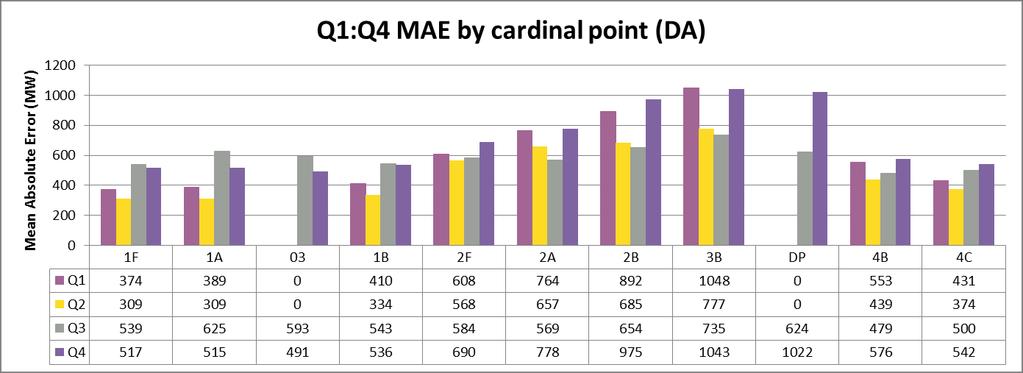
5 I N C EN T I VI SED D EM AN D F O R EC AST S This section of the report shows a comparison between the previous quarters (Qtr.1, Qtr.2 & Qtr.3) and the current quarter (Qtr.4) for the incentivised demand forecasts - day ahead (DA), 2 days ahead (2DA) and 7 days ahead (7DA). We continually try to improve the performance of our forecasting models against a background of increasing uncertainty. Challenges include the further growth of both weather dependent and independent embedded generation, as well as new technologies such as smart meters and energy storage. The first set of 3 graphs below shows the quarterly MAE for each of the incentivised timescales. The DP cardinal point errors for most months in Qtr. 4 increased due to the effect of Triad avoidance actions (Triad period November February inclusive), as the forecasts are required to be made without taking these actions into account whilst the out turn does take these actions to account. 5
6 6

7 The following 3 graphs present the performance of the forecasts relative to the forecasting incentive targets for each timescale. A negative value indicates that the average forecast error for that cardinal point exceeded the incentive target error. 7

8 The fact that the majority of the performance measures are negative shows that the targets continued to be very difficult to meet. The graph also shows that the incentive targets for this Quarter were generally more challenging compared to previous Quarter s targets. The above 3 graphs also highlight that it was particularly challenging to meet the required targets for DP due to Triad avoidance behaviour mentioned before. 8
9 M O N T H L Y C O U N T O F L AR G E ER R O R S ( G R EAT ER T H AN M W ) The graph below depicts the count of errors above 1000 MW since 1 st April It looks at the incentivised forecast horizons only, i.e. day ahead, 2 days ahead and 7 days ahead Monthly errors >1 GW per forecasting horizon 0 Apr-17 May-17 Jun-17 Jul-17 Aug-17 Sep-17 Oct-17 Nov-17 Dec-17 Jan-18 Feb-18 Mar-18 DayAhead 2DayAhead 7DayAhead The graph illustrates that the number of large errors (greater than 1000 MW) increases as lead time increases The total number of large demand forecast errors, greater than 1GW, increased slightly compared to the previous Quarter; consistent with expectations for this time of year. Note that the number of errors in March is low due to the fact that the date period of this report covers only until 11 th March. CASE STUDY WINTER PEAK DEMAND 1 st MARCH 2018 The peak national demand during this Quarter was 49.8 GW, which occurred on Thursday the 1 st of March at half-hour ending 18:30. This also corresponded to the peak demand for the winter and the whole of the incentives reporting period from 1 st April th March 18. Whilst historic winter peaks have been higher, this was the first time in our records that the peak national demand occurred outside of the Triad Avoidance period, i.e. from November to February. This peak value of national demand occurred during a week of severe cold weather, caused by easterly winds bringing a cold front from Russia into Europe. The observed temperature at the time of the winter peak (-1.6 C at 18:00) was almost 10 C lower than the normal temperature for this time of day and year. The day also saw snow affecting a large part of the country as well as high winds. 9
10 Due to these extreme weather conditions, and the observed and expected system and market stress, additional effort and time was invested into producing our forecasts during this challenging period. As the peak occurred towards the back end of the cold weather week, this did allow for some learning of how behaviour had adjusted to the extreme conditions. Our final day-ahead forecast was 817MW under-forecast, which whilst somewhat outside of the incentive target error range, was within range given the difficult conditions. Peak time forecasts of all our forecast lead times were generally under-forecast and did not converge significantly. Part of the reason can be attributed to the uniqueness of the event and the unpredictable behaviour observed, whilst the difficulties of forecasting the underlying weather sufficiently accurately was also a driver WEEKS AHEAD PEAK DEMAND FORECASTS The graph below shows our 2-52 weeks ahead peak national demand forecast, as published in January 2017 on the BMRS website for the reporting period 4 th December th March 18. This forecast is based on seasonal average weather. The graph also compares our forecast with both actual demand and weather corrected actual demands. For the reporting period, the mean absolute error between the 2-52week peak national demand forecast and actual demand was 1.8GW - the same value as during the previous Quarter. The maximum error was between the forecast and actual demand was 6.1GW on the 23 rd January 2017, compared to 6.2GW during the previous quarter. Errors during this period are affected by the fact that long term forecasts do not take into account only real weather forecasts, but also triad avoidance actions, which normally occur during the November to February window. Forecasts are required to be made without taking these actions into account, whilst the outturn does of course reflect such actions if they occur. 10
11 Mar-12 Jun-12 Sep-12 Dec-12 Mar-13 Jun-13 Sep-13 Dec-13 Mar-14 Jun-14 Sep-14 Dec-14 Mar-15 Jun-15 Sep-15 Dec-15 Mar-16 Jun-16 Sep-16 Dec-16 Mar-17 Jun-17 Sep-17 Nov-17 Solar capacity/output (MW) EMBEDDED PV During the previous Quarter, solar generation capacity increased from 12.9GW in Dec 17 to just over 13GW in March 18. The graph below depicts the daily maximum national solar generation output (based on the Sheffield Solar PV live data) and the installed solar generation capacity up until mid-february Smoothed Solar Capacity Daily Max Solar Output D ESC R IPT IO N O F SO L AR G ENER AT IO N AND F O R EC AST ER R O R S Our solar generation forecasts, as published on BMRS and the Data Explorer section of the National Grid website, arise from an internal PV generation forecasting model, based on a number of parameters:- Estimated capacities, Weather forecasts from our weather provider and Empirically derived models connecting radiation and national generation, using data from our NIA collaboration with Sheffield Solar. Our weather forecasts extend from the current day out to 13 days ahead, and so our solar generation forecasts have the same time horizon. Beyond this, we use seasonal normal weather. The figure below gives an illustration of our mean absolute solar generation forecast error for daylight hours, against lead time of the forecast in days ahead (DA). The error is measured against the national generation as estimated from our Sheffield Solar NIA project. Some further details on the trends are given in the analysis section. 11

12 It can be observed that our mean absolute PV error increased slightly over almost all forecast time horizons from Q3 to Q4 (with an average of 679MW in Q4 compared to 623MW in Q3), although the values are not atypical for the year as a whole. AC T IO NS AF F EC T ING SO L AR G ENER AT IO N F O R EC AST S AND ER R O R S During the period 4 th Dec 11 rd March, a number of actions were taken to optimise the solar generation forecast. As part of our regular PV model reviews, we refreshed the PV generation models twice leading to improvements in the mean absolute error. These improvements generally reduce with time until the next refresh. ANAL YSIS O F T HE C AUS ES O F SO L AR G ENER AT IO N F O R EC AST ER R O R S & F UT UR E AC T IO NS As a number of parameters feed into the forecast of solar generation, errors in each of these contribute to the discrepancy with the actual real generation. However, as error in capacity or outturn can only be estimated theoretically (as there are no standard benchmarks nor solar metering available to National Grid), we take the estimates of capacity and outturn as exact, and break our forecast error down into just two components Model Error and Weather Error:- Error = P (weather forecast) Observed Outturn = (P (weather actual) Observation) + (P (weather forecast) P (weather actual)) = Model Error + Weather Error where P is the function being used to convert weather data into solar generation data. 12

13 The radiation forecast is the main weather variable used from our weather forecasts. The figure below illustrates the values of mean absolute radiation forecast error seen during this Quarter. The figure is plotted for daylight hours only It can be seen that solar radiation forecast errors remained low in Qtr. 4, and comparable to those in Qtr. 3, which is also consistent with being at the start and end of winter. This is also discussed further in the Weather Analysis section. We know from sensitivity analysis of our internal models, that an error of 50kJ/m2 in solar radiation is equivalent to around a115mw error in our national PV forecast. Using this scaling to compare the values of solar radiation error to those of PV power error, we can see that the weather forecast error again drives a significant portion of our overall solar power forecast error. In this Quarter however, the solar power forecasting model error was at least as significant. This seems to have arisen from a long period until the first model refresh, and a shorter impact than previously experienced. We have made reviews of the newly proposed NIA solar power models and anticipate implementing these in the very near future. 13
14 WIND FORECASTS The key input to our forecasts is the wind speed forecast. The graph below shows the mean absolute error in wind speed forecast in m/s at different time horizons. As an indication of the impact of the errors, in the mid part of a wind power curve, between around 5 and 15 m/s, a 1 m/s error in wind speed forecast equates to around a 10% error in wind power forecast for the generator. Mean abs wind speed error (m/s) 13DA m/s 12DA m/s 11DA m/s 10DA m/s 9DA m/s 8DA m/s 7DA m/s 6DA m/s 5DA m/s 4DA m/s 3DA m/s 2DA m/s DA m/s In Day m/s The wind incentive measures our performance in forecasting the wind power that is available, and does not require us to forecast the actual wind output after the control room have taken bid -offeracceptances (BOAs) on wind farms to manage constraints or other system issues in real time. In order to report this, the forecasts for each individual wind farm for each half hour are recorded. For the half hour where a BOA is taken on that farm, the unit is discounted for the calculation of corrected forecast, corrected outturn and corrected installed capacity. The percentage error for the forecast for that half hour is then calculated from the corrected values, and a daily average is calculated which is used in the incentive formula to calculate the outcome for that day. In terms of performance for Qtr.4, the graphs below show the comparison of corrected forecast and actual wind generation for the period 4 th of December 2017 until 11 rd of March 2018, as well as the target daily average percentage error of 4.75% used to calculate the outcome of the incentive. 14
15 01-Feb Feb Feb Feb Feb Feb Feb Feb Feb Feb Feb Feb Feb Feb Feb Feb Feb Feb Feb Feb Feb Feb Feb Feb Feb Feb Feb Feb Feb Feb Feb Feb Mar Mar Mar Mar Mar Mar Mar Mar Mar Mar Mar Mar Dec Dec Dec Dec Dec Dec Dec Dec Dec Dec Dec Dec Dec Dec Jan Jan Jan Jan Jan Jan Jan Jan Jan Jan Jan Jan Jan Jan Jan Jan Dec Dec Dec Dec Dec Dec Dec Dec Dec Dec Dec Dec Dec Dec Dec Dec Dec Dec Dec Dec Dec Jan Jan Jan Jan Jan Jan Jan Jan Jan Jan Jan Jan Jan Jan Jan Jan Jan Jan Jan Jan Jan Jan Jan Forecast and Actual Wind Generation (BOA Corrected) 04 Dec Jan Forecast Actual 14 Daily Percentage Forecast Accuracy Compared with Target 04 Dec Jan Daily APE Target Forecast and Actual Wind Generation (BOA Corrected) 1 Feb- 11 March Forecast Actual 15
16 01-Feb Feb Feb Feb Feb Feb Feb Feb Feb Feb Feb Feb Feb Feb Mar Mar Mar Mar Mar Mar Daily Percentage Forecast Accuracy Compared with Target 1 Feb - 11 March 18 Daily APE Target Just prior to the existing Quarter, we embarked on a significant update to our wind power forecasting models, the effect of which was sustained through until March. During the current Quarter, our average forecasting errors after BOA s were 4.84%, 5.22%, 5.3%, and 4.52% for December, January, February, and March (up to 11 March 2018). Whilst for the most part still above the target of 4.75%, the accuracies were a significant improvement on Quarter 3. The second component of the wind incentive scheme is the bias incentive. In this component, the objective is to have as many over-forecasts as under-forecasts, with a target of 50:50, a breakeven of 60:40 and a maximum penalty of 70:30. There is also a separate term in the bias incentive that states that if any two individual forecast half-hours are 70% biased or greater, the maximum penalty is incurred. For the wind incentive, this means that if any two out of 48 half hourly forecasts are 70% biased or greater than the maximum penalty is incurred. This equates to 9 out of 31 forecasts in a month being one side of zero and 22 being the other side. In December we experienced no biased half-hours, whilst in January, and February we experienced just one biased half-hour each month outside of the 30:70 range. W IND G ENER AT IO N MO D E L L ING On the 28 th of November we completed a significant update of our wind power models for the transmission connected wind farms. The updated power models were used for the whole of this Quarter and this led to significantly lower wind power forecast errors than we otherwise would have experienced. In order to sustain the improvements, revisiting of the models will continue as before and we plan to explore new potential technologies over the coming months from our NIA projects. 16
17 ( C) WEATHER ANALYSIS The demand forecast models use a number of inputs. One of the major inputs is the weather forecasts for selected locations around the country. These come with their own set of errors. Depending on the situation, weather forecast errors can occasionally be compensated for manually provided there is any certainty on the expected error. The graphs below show the mean absolute errors in the forecasts that we receive for our key weather parameters over the 0 to 13 day- ahead forecast horizons. Temperature is measured in C, with an error of 1 C approximating to a demand forecast error of ~500 MW. Solar radiation is measured in kj/m 2, with an error of 50 kj/m 2 approximating to an error of around 115 MW in our PV forecasts. Note that the graph below shows the MAE calculated across all hours of the day (in contrast to the data in the PV section where only daylight hours MAE is shown) Wind speed is measured in m/s. A forecast error of 1 m/s within the range of 5 15 m/s approximates to an error of 10% of capacity. Each graph shows the mean absolute weather forecast error at different lead times, as well as a comparison to the same error for the previous Quarters In Day Q1:Q4 MAE of Forecasted Temperature from in-day to D13 D1 D2 D3 D4 D5 D6 D7 D8 D9 D10 D11 D12 D13 Forecasting horizon (days ahead) Q4 Q3 Q2 Q1 The quality of the temperature forecast is very similar to other Quarters up to a week ahead. From D+7 onwards a striking change in forecast quality can be seen. 17
18 (m/s) During this Quarter we experienced both larger and more frequent deviations from seasonal normal temperatures, whereas by their nature, the D+7 forecasts tend towards seasonal averages. A particularly strong example of extreme cold weather occurred from late February, when cold weather settled over the UK, brought by easterly winds from Russia. The comparison to seasonal normal/climatic weather will be presented and discussed more at the end of this section. (kj/m 2) In Day Q1:Q4 MAE of Forecasted Radiation (all hours) from in-day to D13 D1 D2 D3 D4 D5 D6 D7 D8 D9 D10 D11 D12 D13 Forecasting horizon (days ahead) Q4 Q3 Q2 Q1 The accuracy of the solar radiation forecast during Quarter4 was the best over all the quarters. For solar radiation, the insolation envelope is much smaller during the winter season. This leads to a smaller range of possible outcomes. On average this leads to a smaller mean absolute error. Q1:Q4 MAE of Forecasted wind speed from in-day to D In Day D1 D2 D3 D4 D5 D6 D7 D8 D9 D10 D11 D12 D13 Forecasting horizon (days ahead) Q4 Q3 Q2 Q1 18
19 04/12/ /12/ /12/ /12/ /01/ /01/ /01/ /01/ /01/ /02/ /02/ /02/ /02/ /03/ /03/2018 The error in the wind speed is fairly comparable to the third Quarter, up to a week ahead, being as they are both within the winter periods. The winter months tend to be among the windiest and most volatile months of the year, leading to higher mean absolute errors. As per temperature forecasts, from D+7 onwards, the error increased more than during the previous Quarter. Similar to forecasts of temperature, extreme conditions are harder to forecast (for example storm Emma which occurred in late February). COMPARISON TO SEASONAL NORMAL WEATHER In the graphs below, we take a closer look at how the midday temperature and wind speed outturns compared to the seasonal normal values Observed National Average Temperature against 30-year average at noon Observations Climate 19
20 04/12/ /12/ /12/ /12/ /01/ /01/ /01/ /01/ /01/ /02/ /02/ /02/ /02/ /03/ /03/ Observed National Average wind speed against 30-year average at noon Observations Climate During this recent Quarter, both of the above parameters show significant variation compared to the seasonal normal values. The wind speeds show greater variability than temperatures, although the average wind speed was balanced around the seasonal average. Temperatures showed a number of very extreme cold conditions for the time of year. The two extreme cold events at the beginning and end of the Quarter also caused the Quarter to be colder on average than the seasonal norm. The cold spell at the end of February/beginning of March was particularly extreme. The 1 st of March saw the lowest noon temperature observed. This day was also affected by snow and features in the top 5 highest errors for the two day ahead and seven day ahead forecasts (see Appendix 2). Extreme and unusual weather conditions can lead to significantly different demand and wind outturns compared to forecast, which can markedly affect performance figures over short to medium length periods of time. 20
21 WORK TO IMPROVE FORECASTS Some of our work to improve our forecasting accuracy has been mentioned in earlier sections, but for completion we highlight and collate these activities again here. The internal PV generation forecast model has been updated twice, once in February and again more recently in March, both of which led to immediate accuracy improvements. We made fuller reviews of the two solar power models from our recent NIA projects, and anticipate updating our solar power models shortly. We continue to update our demand models each season as well as review our wind power forecasting models. Work is continuing to build upon the work completed with our external partners and NIA projects, as well as our strategic review of the Energy Forecasting system. 21
22 CONCLUSION A detailed analysis was presented describing the errors and sources of errors in National Grid s demand, solar and wind generation forecasts for the period 4 th December 2017 to 11 th March In addition, the work that has been done to improve these forecasts was described. Our late evening and overnight cardinal point demand forecast errors were generally comparable to or reduced compared to the previous Quarter. This was in spite of more volatile and difficult to forecast weather. The errors for the remainder of our cardinal point forecasts increased however, including in particular for the evening DP cardinal point, due to Triad Avoidance. For this Quarter there was a slight widening of the gap between our incentivised targets and our forecast errors. The total number of large demand forecast errors, greater than 1GW, increased slightly compared to the previous Quarter; consistent with expectations for this time of year. During this period we observed a peak national demand of 49.8GW on the 1 st of March 2018, and an overnight minimum of 18.3GW on Christmas Day. The peak national demand of 49.8GW was also the peak for the whole reporting period (1 st April th March 2018), and was particularly notable for occurring for the first time outside of the Triad Period (November to February). The above event occurred during a week of extremely cold weather, which provided a unique set of challenges. As the peak occurred towards the end of the week, we were able to apply learning from earlier days to optimise our performance, with the final error coming in at 817MW underforecast. This period illustrated well the challenges involved in forecasting during unusual sets of conditions, and the effect that short period events can have on overall performance. Our embedded PV generation forecast errors were slightly elevated, but not atypical for the year as a whole. We anticipate making a significant update to our solar power forecasting models during the first quarter of financial year 2018/19. Wind generation forecasting improved compared to the previous Quarter, whilst still reporting errors generally above the target threshold of 4.75%. We attribute this improvement to the campaign of wind power forecasting model upgrades undertaken in late November, which helpe d to underpin our performance through to March. Our wind forecasts were also generally unbiased during this period. Both our wind generation and demand forecasting model suites will continue to attract focussed updates and improvements to underpin our forecasting performance. In spite of a backdrop of changing system conditions we have continued to provide high quality demand and wind generation forecasts. With system changes such as increasing distribution-connected generation and new technologies, maintaining transmission-system demand forecast accuracies will be increasingly challenging. To meet these new challenges we plan to build actively upon our existing work and projects with the final objective to deliver real value to market participants and final consumers. 22
23 APPENDIX 1 SOURCES OF DEMAND FORECAST ERROR Forecast error is made up of many independent, but interacting components. On some days small errors due to several different components can result in a large overall error, while on other days two very large errors can cancel out leaving a net very accurate forecast. The components of error are: Model error - errors in demand model coefficients. Coefficients are estimated from data.. Residual in demand forecast models, which represents the variation in underlying demand unexplained by model. Short term demand fluctuations (1 day to 1 week) unexplained by the model. Estimated by the forecasters choice of basic demand. Error in outturn demand demand data received by NG differs from real outturn demand because of metering errors, data transfers errors. In addition outturn demand is calculated on an assumption that the frequency is a constant 50 Hz. As frequency deviates from this figure the actual demand differs from the calculated demand. We can estimate that this introduces an error of up to ± 100 MW in the outturn demand. Error in weather forecast data difference between forecast and actual observed weather at weather stations can be measured, and our models can be used to retrospectively estimate the impact of these errors on our demand forecasts Error in wind and PV capacity our embedded wind and solar models assume a certain capacity, and its geographical location. National Grid has limited data on such installations, and data has to be gathered from publically available data sources. This data is neither exhaustive nor up to date. Error in solar radiation weather forecasts the solar radiation forecasts are a key input to our forecasts for PV generation, and can be a significant source of errors. Error in PV models we use models to convert forecast solar radiation into forecast PV load factors. The models use radiation forecast at a single point to represent solar radiation incident on a very large area on which PV installations are installed. We currently use 53 solar radiation measuring stations across GB, so on average each measuring point represents an area of 8840 km 2. The error can be estimated by comparing model output with model estimates of outturn PV generation, as discussed next. Error in outturn PV NG in collaboration with the Sheffield Solar team of Sheffield University produces an estimate of outturn PV generation. It is based on a limited sampling from a number of installations combined with complex algorithms. There is an approximately 10% error in this estimate of PV generation. Error in wind speed weather forecasts we currently receive wind speed forecasts for around 100 locations in the country. Some of these are weather station locations where observations are available, allowing us to quantify the error at these locations, but other forecasts are for sites near large wind farms where outturn data may not be available. We can however estimate the error from the points that we can measure. Error in embedded wind generation models we use models to convert the nearest available wind speed forecast into a generation forecast for embedded wind farms. As per embedded PV, there is no available output data available to National Grid. Error cannot be quantified. We assume these errors are broadly comparable to the errors in metered wind farm forecast. 23
24 APPENDIX 2 BREAKDOWN OF LARGE INDIVIDUAL ERRORS DAY AHEAD FORECASTING ERRORS Date CP Forecast Actual Error Forecaster Note This turned out to be a very sunny day B Radiation was under-forecast by 485 kj m DP B DP B DAY AHEAD FORECASTING ERRORS This day had an estimated 1800MW demand reduction for TRIAD avoidance This was during the lead-up to the cold spell that affected all of Great-Britain. On this day, there were certain area s affected by snow, but not the entire country. The behavioural response was smaller than anticipated. This day had an estimated 2000MW demand reduction for TRIAD avoidance This day had a high degree of uncertainty associated with an inactive frontal system that was moving west-east over the country. This lead to some drizzle, but generally bright conditions. Radiation was underforecast by 202 kj m -2 Date CP Forecast Actual Error Forecaster Note This was a very dull day. Radiation was over-forecast by 194 kj m -2. Temperature B was under-forecast by 1.9 C. A rain front slowly moved west-east over the country, lingering in the east in the afternoon DP This was an unseasonably warm evening, with observed temperatures at 17:00 approximately 6 C higher than the seasonal average. Wind speeds were under-forecast by 4 m s DP B DP On this day there was an estimated 1800 MW demand reduction for TRIAD avoidance. Temperatures were underforecast by 0.8 C This was a very cold day with observed temperatures at 12:00 approximately 9 C below seasonal average. Radiation was over-forecast by 247 kj m -2. There was snow on the ground and on the solar panels. A high demand day. This day had an estimated 1600MW demand reduction for TRIAD avoidance. 24
25 7 DAY AHEAD FORECASTING ERRORS Date CP Forecast Actual Error Forecaster Note This was a very cold day with observed temperatures at 12:00 approximately 9 C below seasonal average. Temperatures B were over-forecast by 2.9 C. Radiation was over-forecast by 602 kj m -2. Wind speeds were over-forecast by 5 m s -1 There was snow on the ground and on the solar panels DP The temperature was 2.5 C warmer than it was forecasted. Wind was under-forecast by 8 m/s. It was also duller during the day compared to the forecasted brightness (some of the load that on a brighter day would come on around DP was already on) B This day was a very sunnier day and sunnier than forecast. Radiation was under-forecast by 906 kj m -2 and temperatures were 0.6 C higher than forecast B It was sunnier, warmer and significantly windier than forecast. Radiation was underforecast by 168 kj m -2, temperatures were under-forecast by 1.5 C. Wind was underforecast by 8 m/s B This day was much sunnier and warmer than forecast. Radiation was underforecast by 463 kj m -2, temperature were under-forecast by 2.3 C, wind was underforecast by 5 m s -1 25
Demand Forecasting Reporting Period: 19 st Jun th Sep 2017
 N A T I O N A L G R I D P A G E 1 O F 21 C O M M E R C I A L, E L E C T R I C I T Y C O M M E R C I A L O P E R A T I O N S Demand Forecasting Reporting Period: 19 st Jun 2017 10 th Sep 2017 EXECUTIVE
Demand Forecasting Reporting Period: 1 st Apr th Jun 17
 N A T I O N A L G R I D P A G E 1 O F 3 C O M M E R C I A L, E L E C T R I C I T Y C O M M E R C I A L O P E R A T I O N S Demand Forecasting Reporting Period: 1 st Apr 17 18 th Jun 17 EXECUTIVE SUMMARY
EVALUATION OF ALGORITHM PERFORMANCE 2012/13 GAS YEAR SCALING FACTOR AND WEATHER CORRECTION FACTOR
 EVALUATION OF ALGORITHM PERFORMANCE /3 GAS YEAR SCALING FACTOR AND WEATHER CORRECTION FACTOR. Background The annual gas year algorithm performance evaluation normally considers three sources of information
Time Series Analysis
 Time Series Analysis A time series is a sequence of observations made: 1) over a continuous time interval, 2) of successive measurements across that interval, 3) using equal spacing between consecutive
NatGasWeather.com Daily Report
 NatGasWeather.com Daily Report Issue Time: 5:15 pm EST Sunday, February 28 th, 2016 for Monday, Feb 29 th 7-Day Weather Summary (February 28 th March 5 th ): High pressure will dominate much of the US
peak half-hourly New South Wales
 Forecasting long-term peak half-hourly electricity demand for New South Wales Dr Shu Fan B.S., M.S., Ph.D. Professor Rob J Hyndman B.Sc. (Hons), Ph.D., A.Stat. Business & Economic Forecasting Unit Report
peak half-hourly Tasmania
 Forecasting long-term peak half-hourly electricity demand for Tasmania Dr Shu Fan B.S., M.S., Ph.D. Professor Rob J Hyndman B.Sc. (Hons), Ph.D., A.Stat. Business & Economic Forecasting Unit Report for
Agricultural Science Climatology Semester 2, Anne Green / Richard Thompson
 Agricultural Science Climatology Semester 2, 2006 Anne Green / Richard Thompson http://www.physics.usyd.edu.au/ag/agschome.htm Course Coordinator: Mike Wheatland Course Goals Evaluate & interpret information,
2018 Annual Review of Availability Assessment Hours
 2018 Annual Review of Availability Assessment Hours Amber Motley Manager, Short Term Forecasting Clyde Loutan Principal, Renewable Energy Integration Karl Meeusen Senior Advisor, Infrastructure & Regulatory
Average Cold Spell Methodology
 Average Cold Spell Methodology Introduction This document is being written under Special Condition 4L.12 (Financial incentives on EMR) of National Grid Electricity Transmission plc s Electricity Transmission
Demand Estimation Sub-Committee. Seasonal Normal Review - Updated. 17 th December 2014
 Demand Estimation Sub-Committee Seasonal Normal Review - Updated 17 th December 2014 1 2 Introduction Seasonal Normal is the gas industry benchmark of what constitutes "typical" weather conditions, and
Champaign-Urbana 2001 Annual Weather Summary
 Champaign-Urbana 2001 Annual Weather Summary ILLINOIS STATE WATER SURVEY 2204 Griffith Dr. Champaign, IL 61820 wxobsrvr@sws.uiuc.edu Maria Peters, Weather Observer January: After a cold and snowy December,
The Climate of Payne County
 The Climate of Payne County Payne County is part of the Central Great Plains in the west, encompassing some of the best agricultural land in Oklahoma. Payne County is also part of the Crosstimbers in the
SOLAR POWER FORECASTING BASED ON NUMERICAL WEATHER PREDICTION, SATELLITE DATA, AND POWER MEASUREMENTS
 BASED ON NUMERICAL WEATHER PREDICTION, SATELLITE DATA, AND POWER MEASUREMENTS Detlev Heinemann, Elke Lorenz Energy Meteorology Group, Institute of Physics, Oldenburg University Workshop on Forecasting,
Drought in Southeast Colorado
 Drought in Southeast Colorado Nolan Doesken and Roger Pielke, Sr. Colorado Climate Center Prepared by Tara Green and Odie Bliss http://climate.atmos.colostate.edu 1 Historical Perspective on Drought Tourism
The Climate of Haskell County
 The Climate of Haskell County Haskell County is part of the Hardwood Forest. The Hardwood Forest is characterized by its irregular landscape and the largest lake in Oklahoma, Lake Eufaula. Average annual
Multivariate Regression Model Results
 Updated: August, 0 Page of Multivariate Regression Model Results 4 5 6 7 8 This exhibit provides the results of the load model forecast discussed in Schedule. Included is the forecast of short term system
Determine the trend for time series data
 Extra Online Questions Determine the trend for time series data Covers AS 90641 (Statistics and Modelling 3.1) Scholarship Statistics and Modelling Chapter 1 Essent ial exam notes Time series 1. The value
The Climate of Marshall County
 The Climate of Marshall County Marshall County is part of the Crosstimbers. This region is a transition region from the Central Great Plains to the more irregular terrain of southeastern Oklahoma. Average
The Climate of Bryan County
 The Climate of Bryan County Bryan County is part of the Crosstimbers throughout most of the county. The extreme eastern portions of Bryan County are part of the Cypress Swamp and Forest. Average annual
CAISO Participating Intermittent Resource Program for Wind Generation
 CAISO Participating Intermittent Resource Program for Wind Generation Jim Blatchford CAISO Account Manager Agenda CAISO Market Concepts Wind Availability in California How State Supports Intermittent Resources
The Climate of Murray County
 The Climate of Murray County Murray County is part of the Crosstimbers. This region is a transition between prairies and the mountains of southeastern Oklahoma. Average annual precipitation ranges from
Monthly Long Range Weather Commentary Issued: APRIL 1, 2015 Steven A. Root, CCM, President/CEO
 Monthly Long Range Weather Commentary Issued: APRIL 1, 2015 Steven A. Root, CCM, President/CEO sroot@weatherbank.com FEBRUARY 2015 Climate Highlights The Month in Review The February contiguous U.S. temperature
Monthly Long Range Weather Commentary Issued: February 15, 2015 Steven A. Root, CCM, President/CEO
 Monthly Long Range Weather Commentary Issued: February 15, 2015 Steven A. Root, CCM, President/CEO sroot@weatherbank.com JANUARY 2015 Climate Highlights The Month in Review During January, the average
TILT, DAYLIGHT AND SEASONS WORKSHEET
 TILT, DAYLIGHT AND SEASONS WORKSHEET Activity Description: Students will use a data table to make a graph for the length of day and average high temperature in Utah. They will then answer questions based
Champaign-Urbana 1999 Annual Weather Summary
 Champaign-Urbana 1999 Annual Weather Summary ILLINOIS STATE WATER SURVEY 2204 Griffith Dr. Champaign, IL 61820 wxobsrvr@sws.uiuc.edu Maria Peters, Weather Observer A major snowstorm kicked off the new
Champaign-Urbana 2000 Annual Weather Summary
 Champaign-Urbana 2000 Annual Weather Summary ILLINOIS STATE WATER SURVEY 2204 Griffith Dr. Champaign, IL 61820 wxobsrvr@sws.uiuc.edu Maria Peters, Weather Observer January: January started on a mild note,
DESC Technical Workgroup. CWV Optimisation Production Phase Results. 17 th November 2014
 DESC Technical Workgroup CWV Optimisation Production Phase Results 17 th November 2014 1 2 Contents CWV Optimisation Background Trial Phase Production Phase Explanation of Results Production Phase Results
Chiang Rai Province CC Threat overview AAS1109 Mekong ARCC
 Chiang Rai Province CC Threat overview AAS1109 Mekong ARCC This threat overview relies on projections of future climate change in the Mekong Basin for the period 2045-2069 compared to a baseline of 1980-2005.
Monthly Long Range Weather Commentary Issued: APRIL 18, 2017 Steven A. Root, CCM, Chief Analytics Officer, Sr. VP,
 Monthly Long Range Weather Commentary Issued: APRIL 18, 2017 Steven A. Root, CCM, Chief Analytics Officer, Sr. VP, sroot@weatherbank.com MARCH 2017 Climate Highlights The Month in Review The average contiguous
Operations Report. Tag B. Short, Director South Region Operations. Entergy Regional State Committee (ERSC) February 14, 2018
 February 14, 2018") Operations Report Tag B. Short, Director South Region Operations Entergy Regional State Committee (ERSC) February 14, 2018 1 Winter Operations Highlights South Region Max Gen Event Regional Dispatch Transfer
Operations Report Tag B. Short, Director South Region Operations Entergy Regional State Committee (ERSC) February 14, 2018 1 Winter Operations Highlights South Region Max Gen Event Regional Dispatch Transfer
The Climate of Kiowa County
 The Climate of Kiowa County Kiowa County is part of the Central Great Plains, encompassing some of the best agricultural land in Oklahoma. Average annual precipitation ranges from about 24 inches in northwestern
Summary of Seasonal Normal Review Investigations CWV Review
 Summary of Seasonal Normal Review Investigations CWV Review DESC 31 st March 2009 1 Contents Stage 1: The Composite Weather Variable (CWV) An Introduction / background Understanding of calculation Stage
The Climate of Texas County
 The Climate of Texas County Texas County is part of the Western High Plains in the north and west and the Southwestern Tablelands in the east. The Western High Plains are characterized by abundant cropland
Skilful seasonal predictions for the European Energy Industry
 Skilful seasonal predictions for the European Energy Industry Hazel Thornton, Philip Bett, Robin Clark, Adam Scaife, Brian Hoskins, David Brayshaw WGSIP, 10/10/2017 Outline Energy industry and climate
CIMA Professional 2018
 CIMA Professional 2018 Interactive Timetable Version 16.25 Information last updated 06/08/18 Please note: Information and dates in this timetable are subject to change. A better way of learning that s
Changing Hydrology under a Changing Climate for a Coastal Plain Watershed
 Changing Hydrology under a Changing Climate for a Coastal Plain Watershed David Bosch USDA-ARS, Tifton, GA Jeff Arnold ARS Temple, TX and Peter Allen Baylor University, TX SEWRU Objectives 1. Project changes
particular regional weather extremes
 SUPPLEMENTARY INFORMATION DOI: 1.138/NCLIMATE2271 Amplified mid-latitude planetary waves favour particular regional weather extremes particular regional weather extremes James A Screen and Ian Simmonds
The Climate of Seminole County
 The Climate of Seminole County Seminole County is part of the Crosstimbers. This region is a transition region from the Central Great Plains to the more irregular terrain of southeastern Oklahoma. Average
CIMA Professional
 CIMA Professional 201819 Birmingham Interactive Timetable Version 3.1 Information last updated 12/10/18 Please note: Information and dates in this timetable are subject to change. A better way of learning
CIMA Professional
 CIMA Professional 201819 Manchester Interactive Timetable Version 3.1 Information last updated 12/10/18 Please note: Information and dates in this timetable are subject to change. A better way of learning
CIMA Professional 2018
 CIMA Professional 2018 Newcastle Interactive Timetable Version 10.20 Information last updated 12/06/18 Please note: Information and dates in this timetable are subject to change. A better way of learning
Exercise 6. Solar Panel Orientation EXERCISE OBJECTIVE DISCUSSION OUTLINE. Introduction to the importance of solar panel orientation DISCUSSION
 Exercise 6 Solar Panel Orientation EXERCISE OBJECTIVE When you have completed this exercise, you will understand how the solar illumination at any location on Earth varies over the course of a year. You
The Climate of Pontotoc County
 The Climate of Pontotoc County Pontotoc County is part of the Crosstimbers. This region is a transition region from the Central Great Plains to the more irregular terrain of southeast Oklahoma. Average
Laboratory Exercise #7 - Introduction to Atmospheric Science: The Seasons and Daily Weather
 Laboratory Exercise #7 - Introduction to Atmospheric Science: The Seasons and Daily Weather page - Section A - Introduction: This lab consists of questions dealing with atmospheric science. We beginning
A summary of the weather year based on data from the Zumwalt weather station
 ZUMWALT PRAIRIE WEATHER 2016 A summary of the weather year based on data from the Zumwalt weather station Figure 1. An unusual summer storm on July 10, 2016 brought the second-largest precipitation day
NASA Products to Enhance Energy Utility Load Forecasting
 NASA Products to Enhance Energy Utility Load Forecasting Erica Zell, Battelle zelle@battelle.org, Arlington, VA ESIP 2010 Summer Meeting, Knoxville, TN, July 20-23 Project Overview Funded by the NASA Applied
National Wildland Significant Fire Potential Outlook
 National Wildland Significant Fire Potential Outlook National Interagency Fire Center Predictive Services Issued: September, 2007 Wildland Fire Outlook September through December 2007 Significant fire
The Climate of Grady County
 The Climate of Grady County Grady County is part of the Central Great Plains, encompassing some of the best agricultural land in Oklahoma. Average annual precipitation ranges from about 33 inches in northern
Long Term Renewables Forecast Hauser Plads 10, 4 DK-1127 Copenhagen K Denmark
 Area: Germany Client: xxx Issued: 08:00 UTC 26.08.2016 Next update: 02.09.2016 Overview During 27-29 Aug a low pressure is passing south of UK towards southern Scandinavia and the connected fronts are
PRELIMINARY DRAFT FOR DISCUSSION PURPOSES
 Memorandum To: David Thompson From: John Haapala CC: Dan McDonald Bob Montgomery Date: February 24, 2003 File #: 1003551 Re: Lake Wenatchee Historic Water Levels, Operation Model, and Flood Operation This
WHEN IS IT EVER GOING TO RAIN? Table of Average Annual Rainfall and Rainfall For Selected Arizona Cities
 WHEN IS IT EVER GOING TO RAIN? Table of Average Annual Rainfall and 2001-2002 Rainfall For Selected Arizona Cities Phoenix Tucson Flagstaff Avg. 2001-2002 Avg. 2001-2002 Avg. 2001-2002 October 0.7 0.0
A Report on a Statistical Model to Forecast Seasonal Inflows to Cowichan Lake
 A Report on a Statistical Model to Forecast Seasonal Inflows to Cowichan Lake Prepared by: Allan Chapman, MSc, PGeo Hydrologist, Chapman Geoscience Ltd., and Former Head, BC River Forecast Centre Victoria
Calculations Equation of Time. EQUATION OF TIME = apparent solar time - mean solar time
 Calculations Equation of Time APPARENT SOLAR TIME is the time that is shown on sundials. A MEAN SOLAR DAY is a constant 24 hours every day of the year. Apparent solar days are measured from noon one day
Variability of Reference Evapotranspiration Across Nebraska
 Know how. Know now. EC733 Variability of Reference Evapotranspiration Across Nebraska Suat Irmak, Extension Soil and Water Resources and Irrigation Specialist Kari E. Skaggs, Research Associate, Biological
JRC MARS Bulletin Crop monitoring in Europe January 2016 Weakly hardened winter cereals
 Online version Issued: 25January 2016 r JRC MARS Bulletin Vol. 24 No 1 JRC MARS Bulletin Crop monitoring in Europe January 2016 Weakly hardened winter cereals A first cold spell is likely to have caused
Chapter 3. Regression-Based Models for Developing Commercial Demand Characteristics Investigation
 Chapter Regression-Based Models for Developing Commercial Demand Characteristics Investigation. Introduction Commercial area is another important area in terms of consume high electric energy in Japan.
Forecasting the "Beast from the East" and Storm Emma
 Forecasting the "Beast from the East" and Storm Emma Ken Mylne and Rob Neal with contributions from several scientists across the Met Office ECMWF UEF Meeting, 5-8 June 2018 Beast started 24 Feb Emma reached
Local Ctimatotogical Data Summary White Hall, Illinois
 SWS Miscellaneous Publication 98-5 STATE OF ILLINOIS DEPARTMENT OF ENERGY AND NATURAL RESOURCES Local Ctimatotogical Data Summary White Hall, Illinois 1901-1990 by Audrey A. Bryan and Wayne Armstrong Illinois
BESPOKEWeather Services Monday Afternoon Update: SLIGHTLY BULLISH
 Monday Afternoon Update: SLIGHTLY BULLISH Report Summary: The September natural gas contract declined a bit less than a percent today, recovering through the afternoon after heavy selling this morning.
CWV Review London Weather Station Move
 CWV Review London Weather Station Move 6th November 26 Demand Estimation Sub-Committee Background The current composite weather variables (CWVs) for North Thames (NT), Eastern (EA) and South Eastern (SE)
SYSTEM BRIEF DAILY SUMMARY
 SYSTEM BRIEF DAILY SUMMARY * ANNUAL MaxTemp NEL (MWH) Hr Ending Hr Ending LOAD (PEAK HOURS 7:00 AM TO 10:00 PM MON-SAT) ENERGY (MWH) INCREMENTAL COST DAY DATE Civic TOTAL MAXIMUM @Max MINIMUM @Min FACTOR
Champaign-Urbana 1998 Annual Weather Summary
 Champaign-Urbana 1998 Annual Weather Summary ILLINOIS STATE WATER SURVEY Audrey Bryan, Weather Observer 2204 Griffith Dr. Champaign, IL 61820 wxobsrvr@sparc.sws.uiuc.edu The development of the El Nìno
Monthly Long Range Weather Commentary Issued: SEPTEMBER 19, 2016 Steven A. Root, CCM, Chief Analytics Officer, Sr. VP,
 Monthly Long Range Weather Commentary Issued: SEPTEMBER 19, 2016 Steven A. Root, CCM, Chief Analytics Officer, Sr. VP, sroot@weatherbank.com SEPTEMBER 2016 Climate Highlights The Month in Review The contiguous
ZUMWALT WEATHER AND CLIMATE ANNUAL REPORT ( )
") ZUMWALT WEATHER AND CLIMATE ANNUAL REPORT (26-29) FINAL DRAFT (9 AUGUST 21) J.D. HANSEN 1, R.V. TAYLOR 2, AND V.S. JANSEN 3 INTRODUCTION The Zumwalt Prairie in northeastern Oregon is a unique grassland
ZUMWALT WEATHER AND CLIMATE ANNUAL REPORT (26-29) FINAL DRAFT (9 AUGUST 21) J.D. HANSEN 1, R.V. TAYLOR 2, AND V.S. JANSEN 3 INTRODUCTION The Zumwalt Prairie in northeastern Oregon is a unique grassland
Technical note on seasonal adjustment for M0
 Technical note on seasonal adjustment for M0 July 1, 2013 Contents 1 M0 2 2 Steps in the seasonal adjustment procedure 3 2.1 Pre-adjustment analysis............................... 3 2.2 Seasonal adjustment.................................
January 2006 Climate Summary
 Ashley Brooks (765) 494-6574 Feb 9, 2006 http://www.iclimate.org January 1-3 January 2006 Climate Summary Unseasonably warm conditions welcomed in the New Year with highs in the 40s across the northern
Memo. I. Executive Summary. II. ALERT Data Source. III. General System-Wide Reporting Summary. Date: January 26, 2009 To: From: Subject:
 Memo Date: January 26, 2009 To: From: Subject: Kevin Stewart Markus Ritsch 2010 Annual Legacy ALERT Data Analysis Summary Report I. Executive Summary The Urban Drainage and Flood Control District (District)
8.1 Attachment 1: Ambient Weather Conditions at Jervoise Bay, Cockburn Sound
 8.1 Attachment 1: Ambient Weather Conditions at Jervoise Bay, Cockburn Sound Cockburn Sound is 20km south of the Perth-Fremantle area and has two features that are unique along Perth s metropolitan coast
Seasonal Climate Watch November 2017 to March 2018
 Seasonal Climate Watch November 2017 to March 2018 Date issued: Oct 26, 2017 1. Overview The El Niño Southern Oscillation (ENSO) continues to develop towards a La Niña state, and is expected to be in at
Monthly Magnetic Bulletin
 BRITISH GEOLOGICAL SURVEY Ascension Island Observatory Monthly Magnetic Bulletin December 2008 08/12/AS Crown copyright; Ordnance Survey ASCENSION ISLAND OBSERVATORY MAGNETIC DATA 1. Introduction Ascension
= observed volume on day l for bin j = base volume in jth bin, and = residual error, assumed independent with mean zero.
 QB research September 4, 06 Page -Minute Bin Volume Forecast Model Overview In response to strong client demand, Quantitative Brokers (QB) has developed a new algorithm called Closer that specifically
Summary of Seasonal Normal Review Investigations. DESC 31 st March 2009
 Summary of Seasonal Normal Review Investigations DESC 31 st March 9 1 Introduction to the Seasonal Normal Review The relationship between weather and NDM demand is key to a number of critical processes
RTO Winter Resource Adequacy Assessment Status Report
 RTO Winter Resource Adequacy Assessment Status Report RAAS 03/31/2017 Background Analysis performed in response to Winter Season Resource Adequacy and Capacity Requirements problem statement. Per CP rules,
peak half-hourly South Australia
 Forecasting long-term peak half-hourly electricity demand for South Australia Dr Shu Fan B.S., M.S., Ph.D. Professor Rob J Hyndman B.Sc. (Hons), Ph.D., A.Stat. Business & Economic Forecasting Unit Report
Colorado s 2003 Moisture Outlook
 Colorado s 2003 Moisture Outlook Nolan Doesken and Roger Pielke, Sr. Colorado Climate Center Prepared by Tara Green and Odie Bliss http://climate.atmos.colostate.edu How we got into this drought! Fort
DORMOUSE MONITORING IN FREEHOLDERS WOOD 2015
 DORMOUSE MONITORING IN FREEHOLDERS WOOD 2015 Photo: Ian Court YDNPA Ian Court, Wildlife Conservation Officer, Yorkshire Dales National Park Authority Ian White, People s Trust for Endangered Species March
JRC MARS Bulletin Crop monitoring in Europe January 2019
 Online version Issued: 21 January 2019 r JRC MARS Bulletin Vol. 27 No 1 JRC MARS Bulletin Crop monitoring in Europe January 2019 Continued mild winter Improved hardening of winter cereals in central and
NatGasWeather.com Daily Report
 NatGasWeather.com Daily Report Issue Time: 5:15 am EDT Wednesday, March 22 nd, 2017 1-7 Day Weather Summary (Mar 22-28 th ): A cold blast will sweep across the Great Lakes and eastern US today and Thursday
Here s what a weak El Nino usually brings to the nation with temperatures:
 Time again for my annual Winter Weather Outlook. Here's just a small part of the items I considered this year and how I think they will play out with our winter of 2018-2019. El Nino / La Nina: When looking
2003 Moisture Outlook
 2003 Moisture Outlook Nolan Doesken and Roger Pielke, Sr. Colorado Climate Center Prepared by Tara Green and Odie Bliss http://climate.atmos.colostate.edu Through 1999 Through 1999 Fort Collins Total Water
Name of research institute or organization: Bundesamt für Gesundheit, Sektion Umweltradioaktivität, Bern
 Activity Report 1 Name of research institute or organization: Bundesamt für Gesundheit, Sektion Umweltradioaktivität, Bern Title of project: Aerosol radioactivity monitoring RADAIR and DIGITEL Project
STATISTICAL FORECASTING and SEASONALITY (M. E. Ippolito; )
") STATISTICAL FORECASTING and SEASONALITY (M. E. Ippolito; 10-6-13) PART I OVERVIEW The following discussion expands upon exponential smoothing and seasonality as presented in Chapter 11, Forecasting, in
STATISTICAL FORECASTING and SEASONALITY (M. E. Ippolito; 10-6-13) PART I OVERVIEW The following discussion expands upon exponential smoothing and seasonality as presented in Chapter 11, Forecasting, in
WIND DATA REPORT. Vinalhaven
 WIND DATA REPORT Vinalhaven April 1, 2004 June 30, 2004 Prepared for Fox Islands Electric Cooperative By Melissa L. Ray Anthony L. Rogers April 4, 2005 Renewable Energy Research Laboratory 160 Governors
Computer Activity #3 SUNRISE AND SUNSET: THE SEASONS
 NAME(S)!!!!!!!!!!!!!!!!!!!!!!!!!!!!!!!!!! ASTRONOMY 25 Computer Activity #3 SUNRISE AND SUNSET: THE SEASONS SECTION DAY/TIME S. V. LLOYD Overview The seasonal variation in temperature is due to two changes
WIND DATA REPORT. Vinalhaven
 WIND DATA REPORT Vinalhaven July 1, 2004 September 30, 2004 Prepared for Fox Islands Electric Cooperative By Melissa L. Ray Anthony L. Rogers April 4, 2005 Renewable Energy Research Laboratory 160 Governors
Laboratory Exercise #7 - Introduction to Atmospheric Science: The Seasons
 Laboratory Exercise #7 - Introduction to Atmospheric Science: The Seasons page - 1 Section A - Introduction: This lab consists of both computer-based and noncomputer-based questions dealing with atmospheric
Jackson County 2013 Weather Data
 Jackson County 2013 Weather Data 61 Years of Weather Data Recorded at the UF/IFAS Marianna North Florida Research and Education Center Doug Mayo Jackson County Extension Director 1952-2008 Rainfall Data
Application and verification of ECMWF products 2012
 Application and verification of ECMWF products 2012 Instituto Português do Mar e da Atmosfera, I.P. (IPMA) 1. Summary of major highlights ECMWF products are used as the main source of data for operational
Summary report for Ruamāhanga Whaitua Committee The climate of the Ruamāhanga catchment
 Summary report for Ruamāhanga Whaitua Committee The climate of the Ruamāhanga catchment The Tararua and Rimutaka ranges have a large influence on the climate of the Ruamāhanga catchment. The ranges shelter
Renewables and the Smart Grid. Trip Doggett President & CEO Electric Reliability Council of Texas
 Renewables and the Smart Grid Trip Doggett President & CEO Electric Reliability Council of Texas North American Interconnected Grids The ERCOT Region is one of 3 North American grid interconnections. The
Winter Forecast. Allan Huffman RaleighWx
 Winter 2014-15 Forecast Allan Huffman RaleighWx Winter 2014-15 Combination of weak/moderate El Nino/+PDO/-QBO and well above average snow cover and snow cover increase this Fall in Siberia point to a winter
Supplementary appendix
 Supplementary appendix This appendix formed part of the original submission and has been peer reviewed. We post it as supplied by the authors. Supplement to: Lowe R, Stewart-Ibarra AM, Petrova D, et al.
Exemplar for Internal Achievement Standard. Mathematics and Statistics Level 3
 Exemplar for internal assessment resource Mathematics and Statistics for Achievement Standard 91580 Exemplar for Internal Achievement Standard Mathematics and Statistics Level 3 This exemplar supports
U.S. Outlook For October and Winter Thursday, September 19, 2013
 About This report coincides with today s release of the monthly temperature and precipitation outlooks for the U.S. from the Climate Prediction Center (CPC). U.S. CPC October and Winter Outlook The CPC
The Energy Markets. Use and interpretation of medium to extended range products. ECMWF, Reading, 14 th of November 2005
 The Energy Markets Use and interpretation of medium to extended range products ECMWF, Reading, 14 th of November 2005 drs. Stefan Meulemans, MSc Sempra Energy Europe Ltd. London smeulemans@sempracommodities.com
Cost of Inflow Forecast Uncertainty for Day Ahead Hydropower Production Scheduling
 Cost of Inflow Forecast Uncertainty for Day Ahead Hydropower Production Scheduling HEPEX 10 th University Workshop June 25 th, 2014 NOAA Center for Weather and Climate Thomas D. Veselka and Les Poch Argonne
SYSTEM BRIEF DAILY SUMMARY
 SYSTEM BRIEF DAILY SUMMARY * ANNUAL MaxTemp NEL (MWH) Hr Ending Hr Ending LOAD (PEAK HOURS 7:00 AM TO 10:00 PM MON-SAT) ENERGY (MWH) INCREMENTAL COST DAY DATE Civic TOTAL MAXIMUM @Max MINIMUM @Min FACTOR
Monthly Long Range Weather Commentary Issued: APRIL 25, 2016 Steven A. Root, CCM, Chief Analytics Officer, Sr. VP, sales
 Monthly Long Range Weather Commentary Issued: APRIL 25, 2016 Steven A. Root, CCM, Chief Analytics Officer, Sr. VP, sales sroot@weatherbank.com MARCH 2016 Climate Highlights The Month in Review The March
FORECAST ACCURACY REPORT 2017 FOR THE 2016 NATIONAL ELECTRICITY FORECASTING REPORT
 FORECAST ACCURACY REPORT 2017 FOR THE 2016 NATIONAL ELECTRICITY FORECASTING REPORT Published: November 2017 Purpose The National Electricity Rules (Rules) require AEMO to report to the Reliability Panel