Tennessee Valley Authority. Thermal Assessment of Existing 161kv & 500kv Transmission Lines
|
|
|
- Karin Clarke
- 6 years ago
- Views:
Transcription
1 Tennessee Valley Authority Thermal Assessment of Existing 161kv & 500kv Transmission Lines

2 TVA Power Service Area
3 Why are we gathering aerial laser survey & doing thermal assessments? Before 1977; NESC ground clearance 120 o F (49 o C) 1977 NESC code required clearances at maximum operating temperature Have generally designed new lines for 100 o C since 1977
4 Transmission Line Assessment and Background Up-Rate Program NESC Code for Lines Built Before 1977 Required Clearance be Maintained for a Conductor Temperature of 49 Degrees C 1977 NESC Code Revision Required Clearances be Maintained Based on Actual Operating Temperatures Peak Conditions Typically Require Operation between Degrees C Transmission Line Operation and Clearance Requirements are a Matter of NERC Compliance. The scope includes 8,137 Miles of Transmission Line 2,405 Miles of 500-kV Transmission Lines 5,662 Miles of 161-kV Transmission Lines 70 Miles of 46/69-kV Transmission Lines Current Asset Condition Could Impact Reputation and Cost Assumed Rating Could Lead to NERC Reportable Flashover Events Increased Risk of Public Contact Events NESC or NERC Violations Receive More Scrutiny Since Blackout of 2003
5 TVA in-house engineering assessed about 30% of our lines Burns & McDonnell Mesa Associates Sargent & Lundy Aerotec LLC Optimal Geomatics Geodigital Network Mapping Terrapoint USA Inc Tuck Engineering MESA coupled with Optimal Geomatics S&L coupled with Geodigital Burns & Mac and Network Mapping
6 Vertical clearance of conductors above roads, driveways, parking lots, areas subject to truck traffic, unpaved land subject to cultivating. 69kV 161kV 230kV 500kV TVA NESC delta Lidar NESC + 1 ft
7 Buffer is 1ft. Need to model as accurate as possible with lidar Why?- affects the sag/clearance (long spans could change sag several feet) If there is a violation, could be significat cost for modification
8
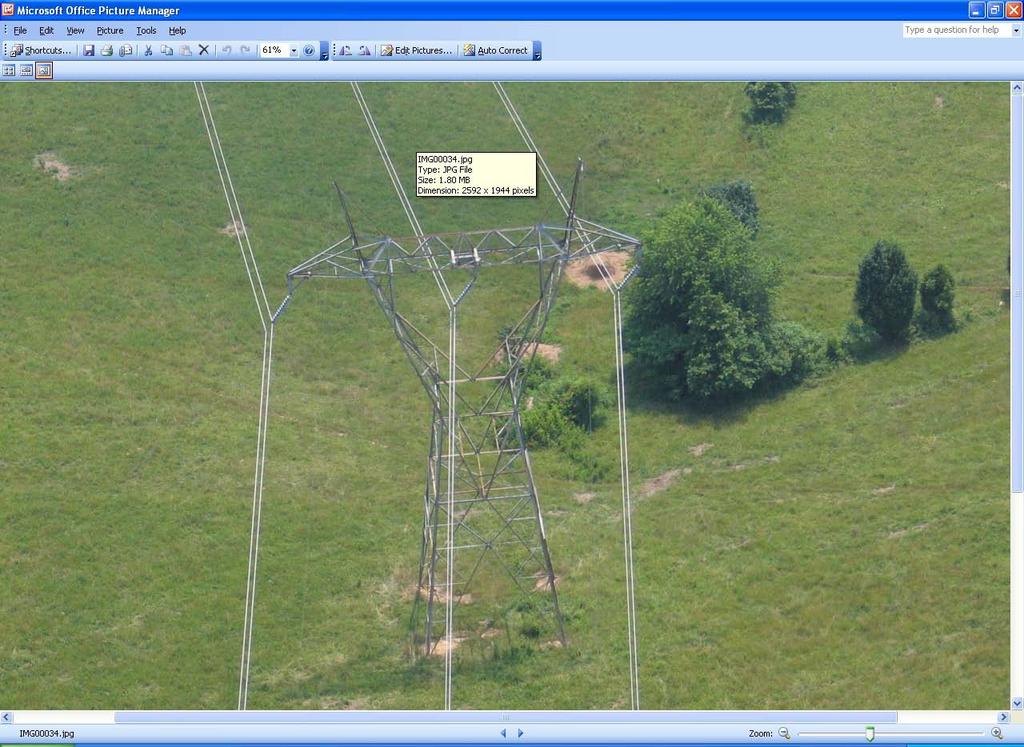
9 With lidar Structure location ft Wire tension lbs Ground/obstacles ft However, Temperature not directly measured. Derived from IEEE 738
10 As Captured Match Lidar 110.3deg Creep FE
11 212 deg F creep FE
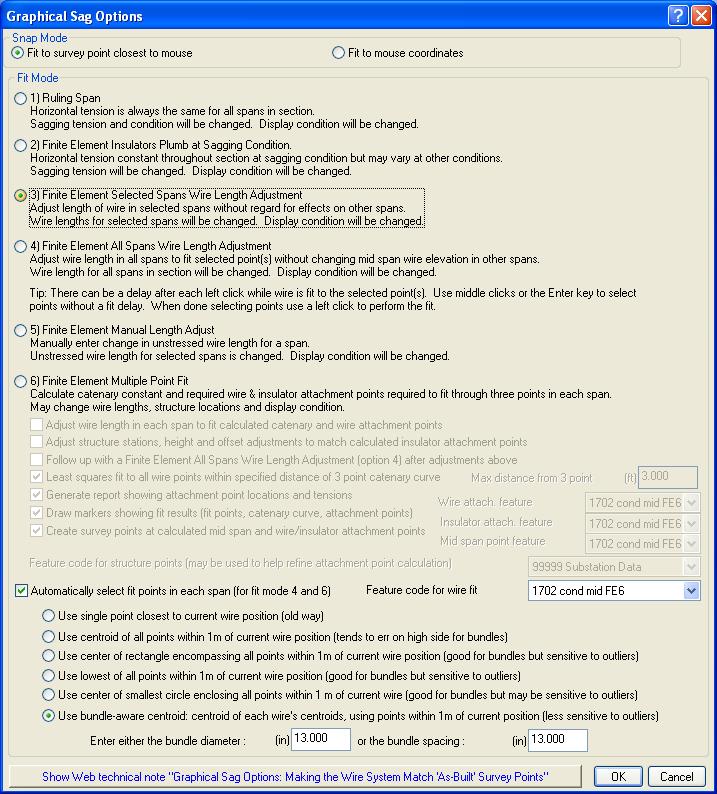
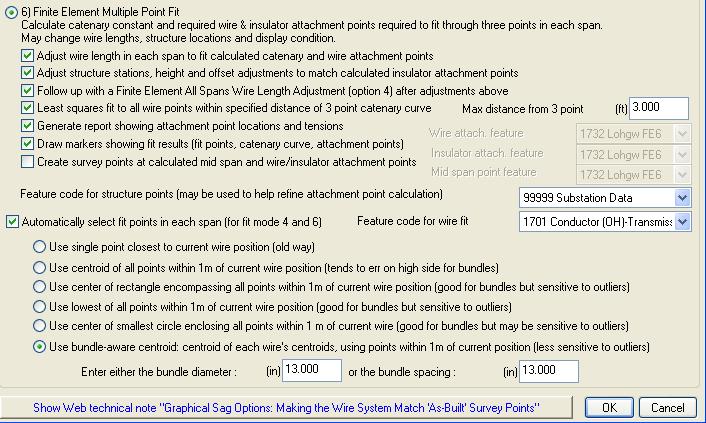
12 Steps to get FE sag Alignment Structure locations (station/offset) Conductor temperature (weather data) Assume sagging temperature (plumb INS) As captured least square best fit Tension (FE6) Used to get tension not move structures Adjust each span at mid span (non-plumb INS)FE3
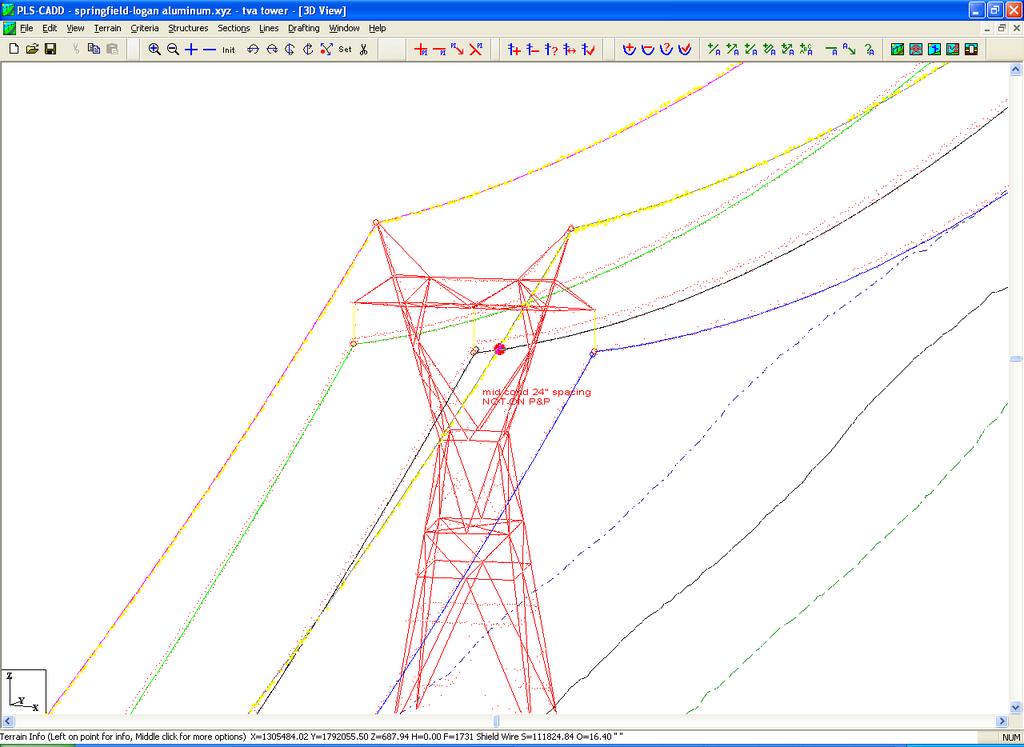
13 First locate structures (cross section view)
14 Example of locating structures to match the lidar ghost
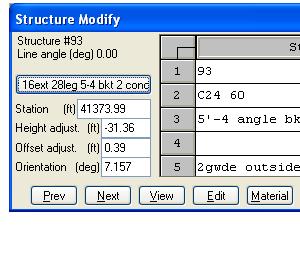
15 Present Location (hgt=4.0 offset 0.0)
16 Adjust Height & Offset (hgt=4.4 offset 0.5)
17
18

19 Adjust Station ( to )
20
21 Example of angle tower
22 Example of special configuration Special conductor spacing
23 2 ft spacing C phase
24


25
26

27 2ft conductor spacing C phase

28 Example of As built not on Drawing str 154 no special conductor spacing
29
30
31 Before you can do graphical sag you must determine as capture conductor temperature
32

33 Flight Time 5/01/ :09CDT-17:59CDT
34 For Example, From the weather data Str 124-Colbert 17:56-17:59 CDT

35 Not use 22.5 Average about WNW Temp not variable but wind speed and direction are

36 Easting & Northing from PI report gives Azimuth Convert Flight Time to Sun Time Using difference between Azimuth and wind direction gives wind angle, for example from str 124 to Colbert AZ=59deg Wind Dir = 298.9deg

37 IEEE uses cond elev, Latitude, and Amps Longitude is used for Sun Time
38 Conductor Bearing 59deg
39 To Demonstrate Graphically Using F7 (measure) azi line shows angle between conductor & wind Angle = 60.1deg But from the weather data variance in wind direction +- Therefore, use 75deg (more cooling)
40 Weather instruments: Multiple Davis Instruments Weather Wizard III portable weather stations with recording equipment in vinyl container and with weather probes mounted on telescopic masts. Temperature accuracy: +/- 1 degree F Temperature range: -50 degrees F to 140 degrees F Wind speed accuracy: +/- 5% Wind speed range: 2 mph to 150 mph (2.9 ft/sec to 220 ft/sec) Wind direction accuracy: +/- 7 degrees
41 Equation for Sun Time
42 =CT+(1/15)*(IF(OR(C8="CST",C8="CDT"),90,IF(OR(C8="EST",C8="E DT"),75,"Check"))-A8)+(0.165*SIN(2*RADIANS(360*(n-81)/364)) *COS(RADIANS(360*(n-81)/364))-0.025*SIN(RADIANS(360*(n- 81)/364)))- IF(OR(C8="CST",C8="EST"),0,IF(OR(C8="CDT",C8="EDT"),1,"Check" )) Equation in EXCEL
43 Also, use website
44 -48/60 = :59 = = (matches spreadsheet)
45 IEEE Std method of calculation Air temperature is (deg F) Wind speed is 5.27 (ft/s) Angle between wind and conductor is 75 (deg) Conductor elevation above sea level is 506 (ft) Conductor bearing is 59 (deg) (user specified bearing, may not be value producing maximum solar heating) Sun time is hours (solar altitude is 19 deg. and solar azimuth is -85 deg.) Conductor latitude is 34.8 (deg) Atmosphere is CLEAR Day of year is 121 (corresponds to May 1 in year 2009) (user specified day, may not be day producing maximum solar heating) Conductor description: 795 kcmil 26/7 Strands DRAKE ACSR - Adapted from 1970's Publicly Available Data Conductor diameter is (in) Conductor resistance is (Ohm/mile) at 77.0 (deg F) and (Ohm/mile) at (deg F) Emissivity is 0.7 and solar absorptivity is 0.9 Solar heat input is (Watt/ft) (corresponds to Global Solar Radiation of (Watt/ft^2) - which was calculated) Radiation cooling is (Watt/ft) Convective cooling is (Watt/ft) Given a constant ac current of amperes, The conductor surface temperature is 74.6 (deg F) Surface? Change in PLS
46 Range Ambient 66.1 to Only Uncertain Variable No Wind 90.7 previous 74.6 IEEE Std method of calculation Air temperature is (deg F) Wind speed is 0.00 (ft/s) Angle between wind and conductor is 75 (deg) Conductor elevation above sea level is 506 (ft) Conductor bearing is 59 (deg) (user specified bearing, may not be value producing maximum solar heating) Sun time is hours (solar altitude is 19 deg. and solar azimuth is -85 deg.) Conductor latitude is 34.8 (deg) Atmosphere is CLEAR Day of year is 121 (corresponds to May 1 in year 2009) (user specified day, may not be day producing maximum solar heating) Conductor description: 795 kcmil 26/7 Strands DRAKE ACSR - Adapted from 1970's Publicly Available Data Conductor diameter is (in) Conductor resistance is (Ohm/mile) at 77.0 (deg F) and (Ohm/mile) at (deg F) Emissivity is 0.7 and solar absorptivity is 0.9 Solar heat input is (Watt/ft) (corresponds to Global Solar Radiation of (Watt/ft^2) - which was calculated) Radiation cooling is (Watt/ft) Convective cooling is (Watt/ft) Given a constant ac current of amperes, The conductor surface temperature is 90.7 (deg F) Lower Bound Ambient too Conservative Upper Bound No wind not realistic 2fps min

47 Clear is clean air and industrial is dirty air, Particulates increase conductivity
48 History : Weather Underground Sky Not Always Clear Time: Temp.: DewPoint: Humidity: Sea Visibility: WindDir:Wind:Gust (CDT) Level: SpeedSpeed: Precip: Events:Conditions: Pressure 8:53 AM 53.1 F 41.0 F 64% in 10.0 miles Calm Calm - N/A Clear 9:53 AM 59.0 F 37.0 F 44% in 10.0 miles Calm Calm - N/A Clear 10:53 AM 61.0 F 33.1 F 35% in 10.0 miles WNW 9.2 mph - N/A Clear 11:53 AM 63.0 F 33.1 F 33% in 10.0 miles WNW 10.4 mph 16.1 mph N/A Clear 12:53 PM 64.0 F 34.0 F 33% in 10.0 miles Variable 6.9 mph - N/A Clear 1:53 PM 64.0 F 35.1 F 34% in 10.0 miles Variable 4.6 mph - N/A Partly Cloudy 2:53 PM 64.9 F 37.0 F 36% in 10.0 miles Variable 4.6 mph - N/A Clear 3:53 PM 66.0 F 39.0 F 37% in 10.0 miles WNW 6.9 mph - N/A ScatteredClouds 4:53 PM 66.0 F 37.0 F 34% in 10.0 miles WNW 13.8 mph - N/A Partly Cloudy 5:53 PM 6.0 F 36.0 F 33% in 10.0 miles NW 10.4 mph - N/A Clear 6:53 PM 63.0 F 35.1 F 35% in 10.0 miles NW 6.9 mph - N/A Clear 7:53 PM 55.9 F 39.9 F 55% in 10.0 miles Calm Calm - N/A Clear 8:53 PM 51.1 F 43.0 F 74% in 10.0 miles South 3.5 mph - N/A Partly Cloudy 9:53 PM 48.0 F 43.0 F 83% in 10.0 miles SSW 3.5 mph - N/A Partly Cloudy 10:53 PM 46.0 F 41.0 F 83% in 10.0 miles Calm Calm - N/A Clear 11:53 PM 45.0 F 42.1 F 90% in 10.0 miles Calm Calm - N/A Clear

49 NOT ALL WEATHER DATA REPORTS GAVE SOLAR RADIATION
50 IEEE Std method of calculation Air temperature is (deg F) Wind speed is 5.27 (ft/s) Angle between wind and conductor is 75 (deg) Conductor elevation above sea level is 506 (ft) Conductor bearing is 59 (deg) (user specified bearing, may not be value producing maximum solar heating) Sun time is hours (solar altitude is 8 deg. and solar azimuth is -77 deg.) Conductor latitude is 34.8 (deg) Atmosphere is CLEAR Day of year is 121 (corresponds to May 1 in year 2009) (user specified day, may not be day producing maximum solar heating) Conductor description: 795 kcmil 26/7 Strands DRAKE ACSR - Adapted from 1970's Publicly Available Data Conductor diameter is (in) Conductor resistance is (Ohm/mile) at 77.0 (deg F) and (Ohm/mile) at (deg F) Emissivity is 0.7 and solar absorptivity is 0.9 Solar heat input is (Watt/ft) (corresponds to Global Solar Radiation of (Watt/ft^2) - which was calculated) Radiation cooling is (Watt/ft) Convective cooling is (Watt/ft) Given a constant ac current of amperes, The conductor surface temperature is 71.2 (deg F) Iterate on Sun time to get Watts/ft^2 to match Changed conductor temp from 74.6 to 71.2 (Very Cloudy would be significant)
51 Steps to get FE sag Alignment Structure locations (station/offset) Conductor temperature (weather data) Assume sagging temperature (plumb INS) As captured least square best fit Tension (FE6) Used to get tension not move structures Adjust each span at mid span (non-plumb INS)FE3
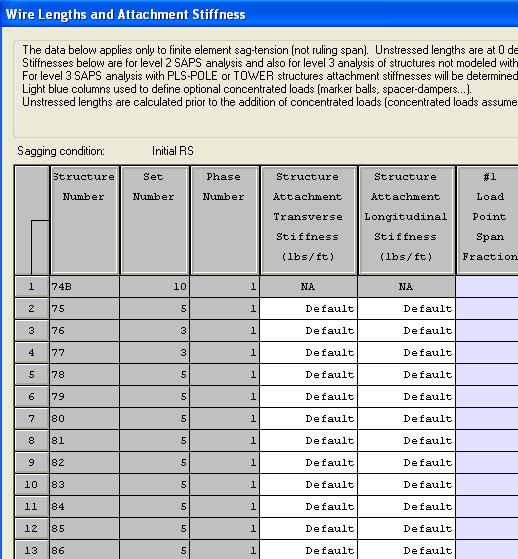
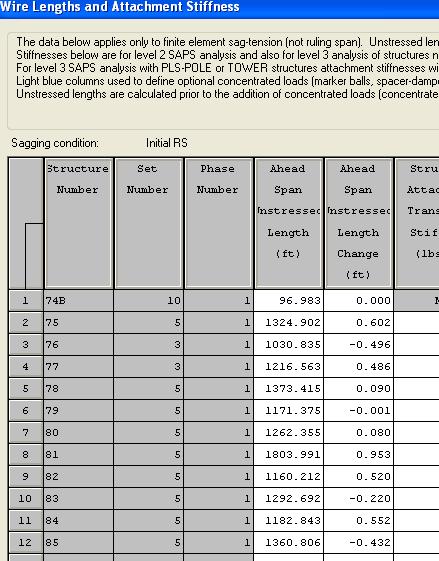
52 Assumed stringing condition 60deg Initial insulators plumb As Captured Temp Sagging Tension is derived from least square best fit of As Captured
53 Least Square Best Fit FE gives a different tension in each span FE gives insulator swing at every condition besides Sagging Condition Thus, FE gives insulator swings at As Captured Temperature Must determine if swing/sag is due to FE or insulator installed out of plumb initially Input Sagging condition Tension(60deg Initial) is one value Determine outliers (spans that do not match FE tension)
54 To Illistrate Using Sagging Tension = 6000 Note: str are adjusted

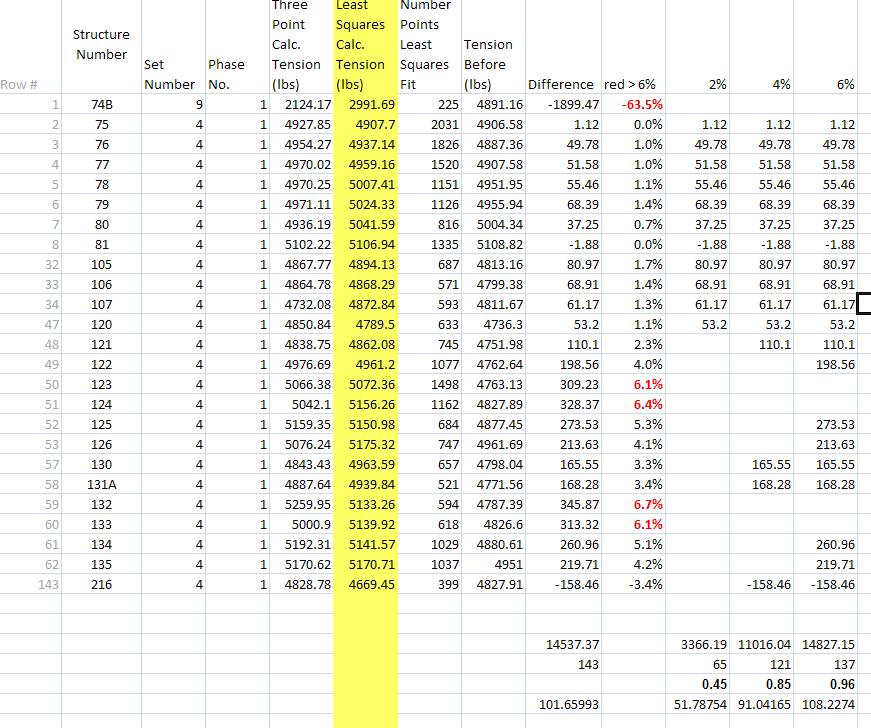
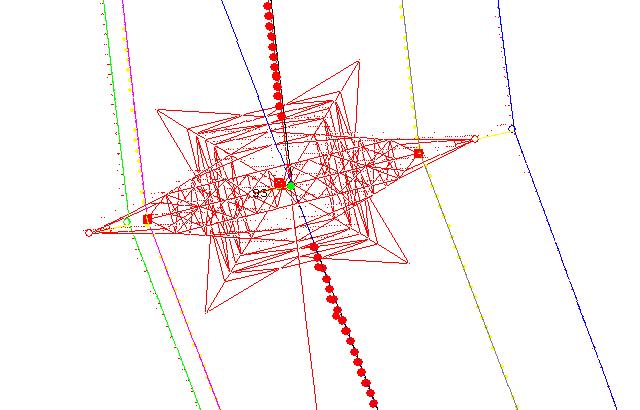
55 Least Square Best Fit
56 Graphical Sag Tension Report Structure Set Phase Three Least Number Tension Tension Tension Number Number No. Point Squares Points Before After Error Calc. Calc. Least (lbs) (lbs)-tension Tension Tension Squares Before (lbs) (lbs) Fit (lbs) B Least Square Answers do not change with Sagging input Based on lidar points only

57
58
59 Stringing condition 60deg Initial Assumed insulators plumb (to be corrected)
60 Before Adjustments
61 As captured temperature no adjustment
62 As captured temperature no adjustment
63
64 All phases As captured temperature with adjustment
65 Center phase As captured temperature with adjustment
66 As captured temperature with adjustment
67 After Adjustments
68 Stringing condition 60deg Initial with adjustments (Assumption of plumb Insulator removed)
69 Angle brackets 3-5

70 Brackets do not swing with Level 2
71 Only Insulators Swing (not brackets)
72 Use all adjustments
73 Moved Structure based on one phase only bundle conductor located tower to centroid


74 Using FE6 adjust str moved str of PI

75 FE6 first three options not selected FE6 with first three options selected
76 Also Longitudinal Loads on the structure will be determined from modeled insulator swings at As captured and sagging conditions
77 Str Loads FE3 wire adjustment As Capture

78 Str Loads FE3 wire adjustment 60deg Intial
79 Str Loads FE3 wire adjustment NESC 1 Ice 250D
80 Str Loads FE4 wire adjustment As Capture
81 Str Loads FE4 wire adjustment 60deg Initial
82 Structural Loads Longitudinal loads will depend on Sagging Conditions FE3 (Initial 60) FE4 (AS Captured Final) NESC ICE (250D) loads will be influenced by As Capture Swing Additional Longitudinal Load created by Cut/Slide to provide clearances
83 Conclusion Assumption of insulators are plumb is removed by FE3 adjustment with correct sags in each span Results are still based on how well derive the conductor Temperature from weather data Range Ambient 66.1deg to No Wind 90.7deg Using all the weather data including solar radiation gave 71.2deg Thermal Rating is impacted approximately an equal temperature from the input conductor temperature Cost of additional modifications
Temperature calculations and LiDAR positions
 Temperature calculations and LiDAR positions A presentation to; 2011 PLS-CADD advanced training and user group meeting Presented by; Paul Richardson, Network Mapping 07/19/11 Scope for today s talk Increasing
Increasing Transmission Capacities with Dynamic Monitoring Systems
 INL/MIS-11-22167 Increasing Transmission Capacities with Dynamic Monitoring Systems Kurt S. Myers Jake P. Gentle www.inl.gov March 22, 2012 Concurrent Cooling Background Project supported with funding
LOCAL CLIMATOLOGICAL DATA Monthly Summary July 2013
 Deg. Days Precip Ty Precip Wind Solar Hu- Adj. to Sea Level mid- ity Avg Res Res Peak Minute 1 fog 2 hvy fog 3 thunder 4 ice plt 5 hail 6 glaze 7 duststm 8 smk, hz 9 blw snw 1 2 3 4A 4B 5 6 7 8 9 12 14
LOCAL CLIMATOLOGICAL DATA Monthly Summary September 2016
 Deg. Days Precip Ty Precip Wind Solar Hu- Adj. to Sea Level mid- ity Avg Res Res Peak 2 Minute 1 fog 2 hvy fog 3 thunder 4 ice plt 5 hail 6 glaze 7 duststm 8 smk, hz 9 blw snw 1 2 3 4A 4B 5 6 7 8 9 11
LOCAL CLIMATOLOGICAL DATA Monthly Summary November 2006
 Deg. Days Precip Ty Precip Wind Sun Hu- Adj. to Sea Level mid- ity Avg Res Res Peak Minute 1 fog 2 hvy fog 3 thunder 4 ice plt 5 hail 6 glaze 7 duststm 8 smk, hz 9 blw snw 1 2 3 4A 4B 5 6 7 8 9 12 14 15
Composite Conductor Field Trial Summary Report: Western Area Power Administration FARGO
 Composite Conductor Field Trial Summary Report: Western Area Power Administration FARGO Installation Date October, 2002 Field trial Location Fargo, North Dakota, USA Line Characteristics Utility: Western
High Temperature Overhead Conductor Rating Considerations
 High Temperature Overhead Conductor Rating Considerations Joseph Coffey Director Overhead Transmission, Prysmian Group/General Cable Littleton, Colorado Abstract Transmission utilities are deploying an
Composite Conductor Field Trial Summary Report: Western Area Power Administration Phoenix
 Composite Conductor Field Trial Summary Report: Western Area Power Administration Phoenix Installation Date January 2004 Field trial Location Phoenix, Arizona, USA Line Characteristics Utility: Western
APPENDIX I. Line T-198, Structures , over the Ashuelot River, Swanzey, NH
 APPENDIX I Line T-198, Structures 122-123, 123-124 over the Ashuelot River, Swanzey, NH 1. The location of this crossing is shown on the attached location map marked as Exhibit Ii. 2. The design and proposed
DE PUBLIC SERVICE COMPANY OF NEW HAMPSHIRE
 DE 05-142 PUBLIC SERVICE COMPANY OF NEW HAMPSHIRE Petition for License to Construct and Maintain Electric Lines Over and Across the Public Waters of the Nashua River in the City of Nashua, New Hampshire
Power transfer capacity improvements of existing overhead line systems
 Power transfer capacity improvements of existing overhead line systems K. Kopsidas, S. M. Rowland, M. N. R. Baharom, and I. Cotton School of Electrical & Electronic Engineering The University of Manchester,
APPENDIX G-7 METEROLOGICAL DATA
 APPENDIX G-7 METEROLOGICAL DATA METEOROLOGICAL DATA FOR AIR AND NOISE SAMPLING DAYS AT MMR Monthly Normals and Extremes for Honolulu International Airport Table G7-1 MMR RAWS Station Hourly Data Tables
APPENDIX A DEFINITIONS, NOTATIONS, AND SI CONVERSION FACTORS
 APPENDIX A DEFINITIONS, NOTATIONS, AND SI CONVERSION FACTORS A.1 DEFINITION OF STRUCTURE TYPES Tangent Structure: Minimum line deflection angle. Usually suspension or some type of post insulators (line
ANALYSIS OF DIFFERENT DYNAMIC LINE RATING SYSTEM CONFIGURATIONS IN A DISTRIBUTION LINE
 23 rd International Conference on Electricity Distribution Lyon, 15-18 June 215 Paper 176 ANALYSIS OF DIFFERENT DYNAMIC LINE RATING SYSTEM CONFIGURATIONS IN A DISTRIBUTION LINE Jon G. OLAZARRI, A. Javier
3.2 Wind direction / wind velocity
 3.2 Wind direction / wind velocity The direction from which air moves to is called the wind direction, and the distance air moves per unit time is the wind velocity. Wind has to be measured not only as
Vantage Pro Technical Reference
 Vantage Pro Technical Reference Davis Instruments 3465 Diablo Ave. Hayward, CA 94545 Created: 9/11/01 Calculations of Derived Variables The following parameters do not have any sensors or circuitry. They
Energy Balance and Temperature. Ch. 3: Energy Balance. Ch. 3: Temperature. Controls of Temperature
 Energy Balance and Temperature 1 Ch. 3: Energy Balance Propagation of Radiation Transmission, Absorption, Reflection, Scattering Incoming Sunlight Outgoing Terrestrial Radiation and Energy Balance Net
Energy Balance and Temperature
 Energy Balance and Temperature 1 Ch. 3: Energy Balance Propagation of Radiation Transmission, Absorption, Reflection, Scattering Incoming Sunlight Outgoing Terrestrial Radiation and Energy Balance Net
Red Butte Creek Oil Release Air Monitoring Journal Date Location (Time) Analyte Method Result GPS Location Comment
 Analyte Method Result GPS Location Comment") Date Location (Time) Analyte Method Result GPS Location Comment 8/23/10 Miller Park, along Red Butte Creek (1130-1150) Confluence of Jordan River and Red Butte Creek (1030-1040) Garden Park Ward, 1140
Date Location (Time) Analyte Method Result GPS Location Comment 8/23/10 Miller Park, along Red Butte Creek (1130-1150) Confluence of Jordan River and Red Butte Creek (1030-1040) Garden Park Ward, 1140
Climate. Annual Temperature (Last 30 Years) January Temperature. July Temperature. Average Precipitation (Last 30 Years)
 January Temperature. July Temperature. Average Precipitation (Last 30 Years)") Climate Annual Temperature (Last 30 Years) Average Annual High Temp. (F)70, (C)21 Average Annual Low Temp. (F)43, (C)6 January Temperature Average January High Temp. (F)48, (C)9 Average January Low Temp.
Climate Annual Temperature (Last 30 Years) Average Annual High Temp. (F)70, (C)21 Average Annual Low Temp. (F)43, (C)6 January Temperature Average January High Temp. (F)48, (C)9 Average January Low Temp.
Nusselt Correlations for Select Substation Bus. Presented by: Tony Pribble IEEE JTC Orange County, CA January, 2019
 1 Nusselt Correlations for Select Substation Bus Presented by: Tony Pribble IEEE JTC Orange County, CA January, 2019 2 NEETRAC Overview Non-profit, 37 member industry consortium at Georgia Tech 37 Members
Stochastic modeling of Extinction coefficients for solar power applications
 1(77) Stochastic modeling of Extinction coefficients for solar power applications Ingemar Mathiasson January 2007 Department for Energy and Environment Division of Electric Power Engineering Chalmers University
Air Force Research Laboratory
 Air Force Research Laboratory Lidar Wind Sensing for Improved Precision Airdrop and Gunship Wind Sensing 27 Jun 2016 Integrity Service Excellence Wesley Jones InfoSciTex AFRL RQQD 1 AFRL PAD FCC and MS&A
Electric Distribution Storm Hardening Initiatives. Paul V. Stergiou Distribution Engineering October 14 th, 2015
 Consolidated Edison Company of New York, Inc. Electric Distribution Storm Hardening Initiatives Paul V. Stergiou Distribution Engineering October 14 th, 2015 Energy For New York City And Westchester 3.3
Wind Tower Deployments and Pressure Sensor Installation on Coastal Houses Preliminary Data Summary _ Sea Grant Project No.
 Wind Tower Deployments and Pressure Sensor Installation on Coastal Houses Preliminary Data Summary _ Sea Grant Project No.:1020040317 Submitted to: South Carolina Sea Grant Consortium 287 Meeting Street
Format of CLIGEN weather station statistics input files. for CLIGEN versions as of 6/2001 (D.C. Flanagan).
.") Format of CLIGEN weather station statistics input files for CLIGEN versions 4.1-5.1 as of 6/2001 (D.C. Flanagan). updated 12/11/2008 - Jim Frankenberger These files are also known as CLIGEN state files
Format of CLIGEN weather station statistics input files for CLIGEN versions 4.1-5.1 as of 6/2001 (D.C. Flanagan). updated 12/11/2008 - Jim Frankenberger These files are also known as CLIGEN state files
Case Study Las Vegas, Nevada By: Susan Farkas Chika Nakazawa Simona Tamutyte Zhi-ya Wu AAE/AAL 330 Design with Climate
 Case Study Las Vegas, Nevada By: Susan Farkas Chika Nakazawa Simona Tamutyte Zhi-ya Wu AAE/AAL 330 Design with Climate Professor Alfredo Fernandez-Gonzalez School of Architecture University of Nevada,
2016 EXPLANATION OF OBSERVATIONS BY REFERENCE NUMBER
 S 2016 EXPLANATION OF OBSERVATIONS BY REFERENCE NUMBER tation was moved to 10905 Virginia Forest Court Glen Allen, Virginia in Henrico County on June 10, 2008. Latitude 37 39' 18.87" (37.65537) Longitude
IMPACT OF WEATHER CHANGES ON TVA NUCLEAR PLANT CHI/Q (χ/q) Kenneth G. Wastrack Doyle E. Pittman Jennifer M. Call Tennessee Valley Authority
 Kenneth G. Wastrack Doyle E. Pittman Jennifer M. Call Tennessee Valley Authority") IMPACT OF WEATHER CHANGES ON TVA NUCLEAR PLANT CHI/Q (χ/q) Kenneth G. Wastrack Doyle E. Pittman Jennifer M. Call Tennessee Valley Authority The TVA nuclear plants, like most others in the United States,
IMPACT OF WEATHER CHANGES ON TVA NUCLEAR PLANT CHI/Q (χ/q) Kenneth G. Wastrack Doyle E. Pittman Jennifer M. Call Tennessee Valley Authority The TVA nuclear plants, like most others in the United States,
DISTRIBUTION CONDUCTOR STRINGING EQUIPMENT & TECHNIQUES
 DISTRIBUTION CONDUCTOR STRINGING EQUIPMENT & TECHNIQUES FOR THE 21 ST CENTURY PRESENTED AT: SOUTHWEST TRAINING EXPO FEBRUARY, 2000 PRESENTED BY: JOHN R. WHITT SR. VICE PRESIDENT 1 When the decision is
Issued by: National Weather Service San Joaquin Valley - Hanford CA. Issue time: 409 AM PST Wed Jan
 Forecast Information Location: New_Exchequer_Dam Updated: January 16, 2019, 11:45 am NWS Weather Discussion: Issued by: National Weather Service San Joaquin Valley - Hanford CA Issue time: 409 AM PST Wed
A High Elevation Climate Monitoring Network
 A High Elevation Climate Monitoring Network Kelly T. Redmond Western Regional Climate Center Desert Research Institute Reno Nevada AGU San Francisco WRCC / OSU Nevada Precip-Elevation Distribution 100%
4 Forecasting Weather
 CHAPTER 2 4 Forecasting Weather SECTION Understanding Weather BEFORE YOU READ After you read this section, you should be able to answer these questions: What instruments are used to forecast weather? How
Weather Station: WH_500_Series. Battery Voltage
 Battery Voltage 12.800 12.795 12.790 Voltage 12.785 12.780 12.775 12.770 Apr 2015 8 Wed 15 Wed 22 Wed 1 Fri Time Page 1 Date Batt Volt Min 4/1/2015 12.77 4/2/2015 12.78 4/3/2015 12.80 4/4/2015 12.79 4/5/2015
Equilibrium in Three Dimensions
 C h a p t e r 7 Equilibrium in Three Dimensions In this chapter, you will learn the following to World Class standards: Forces in Three Different Axis Wind Load on the Antennae Pole Practice Problem -
Road Weather: The Science Behind What You Know
 The Weather Road Weather: The Science Behind What You Know Jon Tarleton Global Roads Marketing Manager Meteorologist Jon.tarleton@vaisala.com Page 2 / date / name / Internal use / Vaisala Weather and Our
Prototype Heat Island Application
 CHAM Limited Pioneering CFD Software for Education & Industry Prototype Heat Island Application PHOENICS-2011 Introduction Heat islands are large-scale phenomena in which the general urban temperature
1st Annual Southwest Ohio Snow Conference April 8, 2010 Abner F. Johnson, Office of Maintenance - RWIS Coordinator
 1st Annual Southwest Ohio Snow Conference April 8, 2010 Abner F. Johnson, Office of Maintenance - RWIS Coordinator The Ohio Department of Transportation ODOT has approximately 5500 full-time employees
^_ Key Observation Point Viewshed Model. Grazing Yak Solar Project. Key Observation Point Location Map KOP #6 KOP #3 KOP #1 KOP #2 KOP #4 KOP #5
 Liberty Rd Paint Mine Rd Mc Queen Rd Paint Mine Rd E q Funk Rd ^_ KOP #6 Currier Rd Washington Rd ^_ KOP #1 ^_ KOP #2 ^_ KOP #3 Hanisch Rd ^_ KOP #4 Judge Orr Rd ^_ KOP #5 0 1,000 2,000 Feet Solar Array
MODEL 107 TEMPERATURE PROBE INSTRUCTION MANUAL
 MODEL 107 TEMPERATURE PROBE INSTRUCTION MANUAL REVISION: 6/00 COPYRIGHT (c) 1983-2000 CAMPBELL SCIENTIFIC, INC. This is a blank page. Warranty and Assistance The MODEL 107 TEMPERATURE PROBE is warranted
Chapter 2. Heating Earth's Surface & Atmosphere
 Chapter 2 Heating Earth's Surface & Atmosphere Topics Earth-Sun Relationships Energy, Heat and Temperature Mechanisms of Heat Transfer What happens to Incoming Solar Radiation? Radiation Emitted by the
Red Butte Creek Oil Release Air Monitoring Journal Date Location (Time) Analyte Method Result GPS Location Comment
 Analyte Method Result GPS Location Comment") Date Location (Time) Analyte Method Result GPS Location Comment 6/30/10 ~1800 East Sunnyside Ave. (1110-1145) Miller Park, along Red Butte Creek (1150-1210) 0.2-1.0 ppm 1 Upstream of pressure-washing crews.
Date Location (Time) Analyte Method Result GPS Location Comment 6/30/10 ~1800 East Sunnyside Ave. (1110-1145) Miller Park, along Red Butte Creek (1150-1210) 0.2-1.0 ppm 1 Upstream of pressure-washing crews.
Guide for Application of Direct Real-Time Monitoring Systems
 498 Guide for Application of Direct Real-Time Monitoring Systems Working Group B2.36 June 2012 Guide for Application of Direct Real- Time Monitoring Systems Working Group B2.36 Members R. Stephen (ZA)
NATIVE PLANT CONSERVATION ON THE PINAL CENTRAL TO TORTOLITA 500 KV TRANSMISSION LINE PROJECT
 NATIVE PLANT CONSERVATION ON THE PINAL CENTRAL TO TORTOLITA 500 KV TRANSMISSION LINE PROJECT Diana Shiel Leslie Carpenter PART 1: SAGUARO CONFLICT ASSESSMENT TRANSMISSION LINE (CONDUCTORS) & PREDICTED
EECE421 Power System Analysis. Chapter 4: Transmission Line Capacitance
 EECE421 Power System Analysis Chapter 4: Transmission Line Capacitance 1 Capacitance C: Capacitance Caused by the potential difference between the conductors (Charge) per (unit of potential difference)
Power System Engineering Prof. Debrapriya Das Department of Electrical Engineering Indian Institute of Technology, Kharagpur
 Power System Engineering Prof. Debrapriya Das Department of Electrical Engineering Indian Institute of Technology, Kharagpur Lecture - 01 Overhead Line Insulators So, welcome to this another course that
FINAL REPORT. On Project Supplemental Guidance on the Application of FHWA s Traffic Noise Model (TNM) APPENDIX J Wind and Temperature Gradients
 APPENDIX J Wind and Temperature Gradients") FINAL REPORT On Project 25-34 Supplemental Guidance on the Application of FHWA s Traffic Noise Model (TNM) APPENDIX J Wind and Temperature Gradients Prepared for: National Cooperative Highway Research
FINAL REPORT On Project 25-34 Supplemental Guidance on the Application of FHWA s Traffic Noise Model (TNM) APPENDIX J Wind and Temperature Gradients Prepared for: National Cooperative Highway Research
Chapter 2 Weather Patterns Guided Notes Objective(s): 7.E.1.4 Predict weather conditions and patterns based on information obtained from:
: 7.E.1.4 Predict weather conditions and patterns based on information obtained from:") Chapter 2 Weather Patterns Guided Notes Objective(s): 7.E.1.4 Predict weather conditions and patterns based on information obtained from: Weather data collected from direct observations and measurement
Chapter 2 Weather Patterns Guided Notes Objective(s): 7.E.1.4 Predict weather conditions and patterns based on information obtained from: Weather data collected from direct observations and measurement
Aerial Power Cables Profile, Sag and Tension Calculations Jorge R. López, MSME, PE José A. López, MSCE, PE
 Aerial Power Cables Profile, Sag and Tension Calculations Jorge R. López, MSME, PE José A. López, MSCE, PE Introduction With the events of Hurricane Hugo, Georges and others, the design of aerial power
The Atmosphere and Atmospheric Energy Chapter 3 and 4
 The Atmosphere and Atmospheric Energy Chapter 3 and 4 Size of the Earth s Atmosphere Atmosphere produced over 4.6 billion years of development Protects us from radiation Completely surrounds the earth
Section 7: Hazard Avoidance
 7.1 In-Flight Hazard Awareness Section 7: Hazard Avoidance As technology improves, pilots have more and more real-time information within reach in all phases of flight. Terrain proximity, real-time weather
BACK TO BASICS: PIPE INSULATION
 BACK TO BASICS: PIPE INSULATION INDUSTRIAL REFRIGERATION CONSORTIUM RESEARCH & TECHNOLOGY FORUM MAY 2-3, 2012 Todd Jekel, Ph.D., P.E. Assistant Director, IRC Overview 1 2 3 4 Basics of insulation & insulation
BEFORE THE NEW MEXICO PUBLIC REGULATION COMMISSION
 BEFORE THE NEW MEXICO PUBLIC REGULATION COMMISSION IN THE MATTER OF THE APPLICATION ) OF SAGAMORE WIND ENERGY LLC ) FOR APPROVAL OF THE LOCATION OF ) THE SAGAMORE WIND PROJECT ) IN ROOSEVELT COUNTY, NEW
WEATHER FORECAST DHAKA
 WEATHER FORECAST DHAKA 21.10.2017 Hourly 1 PM 4 PM 8 PM 11 PM Temp. / Dew Point 26 / 24 26 / 23 26 / 22 26 / 22 Wind 20 km/h S 29 km/h SSW 17 km/h SW 13 km/h WSW Humidity 91% 86% 79% 78% Chance of Precip
Applications of GIS in Electrical Power System
 Applications of GIS in Electrical Power System Abdulrahman M. AL-Sakkaf 201102310 CRP 514 May 2013 Dr. Baqer M. AL-Ramadan Abstract GIS has been widely used in various areas and disciplines. This paper
Chapter 9 Atmosphere Study Guide
 Science Chapter 9 Atmosphere Study Guide Name Due 1. What is the definition for: a. Conduction: The transfer of thermal energy by collisions between particles in matter. (Heats air close to Earth s surface)
OASIS WIRELESS WEATHER STATION
 User Manual 3910-B Royal Avenue, Simi Valley, Ca 93063 805-527-4498 RMIS Part No. 500760 TABLE OF CONTENTS INTRODUCTION General Description 3 General Precautions 3 INSTALLATION Base Preparation 6 Tower
Qualification Test Report. Modular Plugs, Unshielded and Shielded
 Qualification Test Report 501-131013 26 JAN 16 Rev. A Modular Plugs, Unshielded and Shielded 1. INTRODUCTION 1.1. Purpose Testing was performed on modular plugs to determine their conformance to the requirements
Summit Station, Greenland. Science on the Ice Sheet
 Summit Station, Greenland Science on the Ice Sheet Where is Greenland? Facts About Greenland - Independent country within the Kingdom of Denmark - Population of ~56,000 people - Least populated country
WEATHER FORECAST DHAKA
 WEATHER FORECAST DHAKA 02.01.2019 Hourly 2 PM 4 PM 8 PM 11 PM Temp. / Dew Point 26 / 12 25 / 12 20 / 12 18 / 13 Wind 15 km/h WNW 13 km/h WNW 4 km/h WNW 6 km/h WNW Humidity 41% 43% 62% 71% Chance of Precip
Warming Earth and its Atmosphere The Diurnal and Seasonal Cycles
 Warming Earth and its Atmosphere The Diurnal and Seasonal Cycles Or, what happens to the energy received from the sun? First We Need to Understand The Ways in Which Heat Can be Transferred in the Atmosphere
METEOROLOGY AND AIR POLLUTION. JAI PRAKASH Civil Engineering IIT Delhi 1 AUGUST, 2011
 METEOROLOGY AND AIR POLLUTION JAI PRAKASH Civil Engineering IIT Delhi 1 AUGUST, 2011 METEOROLOGY Aerosols particles which are emitted from the sources they are transported and dispersed through meteorological
WEATHER. Review Note Cards
 WEATHER Review Note Cards Thermometer Weather instrument that measures air temperature Units include F, C, and K ESRT 13 Sling Psychrometer Weather instrument that measures relative humidity and dewpoint
Comparison of ice accumulation on simplex and duplex conductors in parallel overhead transmission lines in Iceland.
 Comparison of ice accumulation on simplex and duplex conductors in parallel overhead transmission lines in Iceland. Árni Jón Elíasson 1, Árni Björn Jónasson 2 and Pétur Thor Gunnlaugsson 3 1 Landsnet,
The Atmosphere. Importance of our. 4 Layers of the Atmosphere. Introduction to atmosphere, weather, and climate. What makes up the atmosphere?
 The Atmosphere Introduction to atmosphere, weather, and climate Where is the atmosphere? Everywhere! Completely surrounds Earth February 20, 2010 What makes up the atmosphere? Argon Inert gas 1% Variable
Expedited Filing Draft August 22, 2017
 Applicability 1 Section 304.9 applies to: (a) (b) Requirements Expedited Filing Draft August 22, 2017 the legal owner of a wind or solar aggregated generating facility connected to the interconnected electric
The Climate of Payne County
 The Climate of Payne County Payne County is part of the Central Great Plains in the west, encompassing some of the best agricultural land in Oklahoma. Payne County is also part of the Crosstimbers in the
The Study of Overhead Line Fault Probability Model Based on Fuzzy Theory
 Energy and Power Engineering, 2013, 5, 625-629 doi:10.4236/epe.2013.54b121 Published Online July 2013 (http://www.scirp.org/journal/epe) The Study of Overhead Line Fault Probability Model Based on Fuzzy
MxVision WeatherSentry Web Services Content Guide
 MxVision WeatherSentry Web Services Content Guide July 2014 DTN 11400 Rupp Drive Minneapolis, MN 55337 00.1.952.890.0609 This document and the software it describes are copyrighted with all rights reserved.
ARCHITECTURE IN THE DAYLIGHT
 ARCHITECTURE IN THE DAYLIGHT Site Location MANUS LEUNG HARVARD GSD FALL 2015 The house is located in Jl. Intern Corn Kebun Jeruk Blok U3 No.18, Kembangan District of Jakarta 11640 Indonesia. 01 OBJECTIVES
Applications. Remote Weather Station with Telephone Communications. Tripod Tower Weather Station with 4-20 ma Outputs
 Tripod Tower Weather Station with 4-20 ma Outputs Remote Weather Station with Telephone Communications NEMA-4X Enclosure with Two Translator Boards and Analog Barometer Typical Analog Output Evaporation
The Climate of Kiowa County
 The Climate of Kiowa County Kiowa County is part of the Central Great Plains, encompassing some of the best agricultural land in Oklahoma. Average annual precipitation ranges from about 24 inches in northwestern
Texas Statewide Mesonet Network (TexMesonet) Dr. Kantave Greene 11/15/17
 Dr. Kantave Greene 11/15/17") Texas Statewide Mesonet Network (TexMesonet) Dr. Kantave Greene 11/15/17 1 Observe weather features Why Mesonets? Thunderstorms Squall lines Dry-lines Sea breezes Improve weather & flood forecasts Drought
Texas Statewide Mesonet Network (TexMesonet) Dr. Kantave Greene 11/15/17 1 Observe weather features Why Mesonets? Thunderstorms Squall lines Dry-lines Sea breezes Improve weather & flood forecasts Drought
Coefficient of Thermal Expansion for 477-T16 ACCR
 Coefficient of Thermal Expansion for 477-T16 ACCR Summary: The Coefficient of Thermal Expansion (CTE) was measured for a 477-T16 ACCR conductor. Thermal expansion as a function of temperature displays
Road Weather: Pavement Forecasting
 Road Weather: Pavement Forecasting By Jon Tarleton Marketing Development Manager Meteorologist Surface Systems, Inc. (SSI ) QTT Quixote Transportation Technologies 314-872-0509 jdt@surface.com 2006 APWA
Assignment 4: VBA Programming
 CEE 3804: Computer Applications in Civil Engineering Spring 2012 Assignment 4: VBA Programming Date Due: February 21, 2012 Instructor: Trani Problem 1 The distance between two points on the surface of
The Climate of Grady County
 The Climate of Grady County Grady County is part of the Central Great Plains, encompassing some of the best agricultural land in Oklahoma. Average annual precipitation ranges from about 33 inches in northern
The Climate of Murray County
 The Climate of Murray County Murray County is part of the Crosstimbers. This region is a transition between prairies and the mountains of southeastern Oklahoma. Average annual precipitation ranges from
1. (a) Describe the difference between over-expanded, under-expanded and ideallyexpanded
 Describe the difference between over-expanded, under-expanded and ideallyexpanded") Code No: R05322106 Set No. 1 1. (a) Describe the difference between over-expanded, under-expanded and ideallyexpanded rocket nozzles. (b) While on its way into orbit a space shuttle with an initial mass
Code No: R05322106 Set No. 1 1. (a) Describe the difference between over-expanded, under-expanded and ideallyexpanded rocket nozzles. (b) While on its way into orbit a space shuttle with an initial mass
Day 1 of Global Warming. Copyright 2008 Pearson Education, Inc., publishing as Pearson Benjamin Cummings
 Day 1 of Global Warming Copyright 2008 Pearson Education, Inc., publishing as Pearson Benjamin Cummings The Atmosphere Atmosphere = the thin layer (1/100 th of Earth s diameter) of gases that surrounds
,Solar Energy, Greenhouse effect, Convection.notebook October 31, 2016
 Essential Question: How is weather created? What is Solar Energy? The driving source of energy for Earth. 1. Heats Earth's land, water, and air. 2. Causes movement in the atmosphere. Key Topics: The sun
AERMOD Sensitivity to AERSURFACE Moisture Conditions and Temporal Resolution. Paper No Prepared By:
 AERMOD Sensitivity to AERSURFACE Moisture Conditions and Temporal Resolution Paper No. 33252 Prepared By: Anthony J Schroeder, CCM Managing Consultant TRINITY CONSULTANTS 7330 Woodland Drive Suite 225
Design strategy for Low e windows with effective insulation
 Design strategy for Low e windows with effective insulation Michael P.C. Watts, Impattern Solutions, www.impattern.com Keywords; insulating windows. low emission glass, ABSTRACT Optimal window glass assemblies
Meteorological Instruments for Solar Energy
 Meteorological Instruments for Solar Energy gillinstruments.com Gill Instruments has been designing and manufacturing professional use compact weather stations and ultrasonic wind speed and direction sensors
Definitions Weather and Climate Climates of NYS Weather Climate 2012 Characteristics of Climate Regions of NYS NYS s Climates 1.
 Definitions Climates of NYS Prof. Anthony Grande 2012 Weather and Climate Weather the state of the atmosphere at one point in time. The elements of weather are temperature, t air pressure, wind and moisture.
Asteroids: Introduction
 Asteroids: Introduction Name Read through the information below. Then complete the Fill-Ins at the bottom of page. Asteroids are rocky objects that orbit the Sun in our solar system. Also known as minor
A Novel Approach for Increasing the Reliability of Power Transmission Lines in Galloping Conditions
 21, rue d Artois, F-75008 PARIS CIGRE US National Committee http: //www.cigre.org 2014 Grid of the Future Symposium A Novel Approach for Increasing the Reliability of Power Transmission Lines in Galloping
London Heathrow Field Site Metadata
 London Heathrow Field Site Metadata Field Site Information Name: Heathrow src_id (Station ID number): 708 Geographic Area: Greater London Latitude (decimal ): 51.479 Longitude (decimal ): -0.449 OS Grid
Implementation of Rail Temperature Predictions on Amtrak. Authors
 Implementation of Rail Temperature Predictions on Amtrak Authors Radim Bruzek ENSCO, Inc. 5400 Port Royal Road, Springfield, VA 22151 Phone: (703) 321 4773 E-Mail: bruzek.radim@ensco.com Michael Trosino
CHAPTER 3. The sun and the seasons. Locating the position of the sun
 zenith 90 observer summer solstice 75 altitude angles equinox 52 winter solstice 29 Figure 3.1: Solar noon altitude angles for Melbourne SOUTH winter midday shadow WEST summer midday shadow summer EAST
Expansion of the ice deposition monitoring network in Germany
 Expansion of the ice deposition monitoring network in Germany Bodo Wichura, German Meteorological Service, Climate and Environment Consultancy Potsdam, Germany (51) Long-term ice deposition measurements
The Climate of Marshall County
 The Climate of Marshall County Marshall County is part of the Crosstimbers. This region is a transition region from the Central Great Plains to the more irregular terrain of southeastern Oklahoma. Average
SIMPLE LOW CONCENTRATING MODULE DESIGN INCRESES SOLAR CELL OUTPUT 25%
 SIMPLE LOW CONCENTRATING MODULE DESIGN INCRESES SOLAR CELL OUTPUT 25% Daniel Simon 3D Solar, Inc. 5555 N. Sheridan Rd. #1003 Chicago, IL 60640 e-mail: daniel@3dsolar.com ABSTRACT We present a simple low
TAPM Modelling for Wagerup: Phase 1 CSIRO 2004 Page 41
 We now examine the probability (or frequency) distribution of meteorological predictions and the measurements. Figure 12 presents the observed and model probability (expressed as probability density function
Measuring Planet Earth Regents Review. 2. State the altitude of Polaris as seen by an observer at the North Pole.
 Name Measuring Planet Earth Regents Review ase your answers to questions 1 through 3 on the diagram below, which represents a north polar view of Earth on a specific day of the year. Solar times at selected
Complex Terrain (EDUCT) experiment, conducted by the National Center for Atmospheric
 experiment, conducted by the National Center for Atmospheric") Alex Ameen Shenandoah Trip Paper I visited Shenandoah National Park on April 11, 2009 to investigate the Education in Complex Terrain (EDUCT) experiment, conducted by the National Center for Atmospheric
Alex Ameen Shenandoah Trip Paper I visited Shenandoah National Park on April 11, 2009 to investigate the Education in Complex Terrain (EDUCT) experiment, conducted by the National Center for Atmospheric
A Dynamic Ampacity Model for the Testing of Advanced Conductors
 University of Tennessee, Knoxville Trace: Tennessee Research and Creative Exchange Masters Theses Graduate School 12-2005 A Dynamic Ampacity Model for the Testing of Advanced Conductors Matthew Benjamin
Lufft Ceilometer Series
 Lufft Ceilometer Series Lufft CHM 15k and CHM 8k a passion for precision passion pour la précision pasión por la precisión passione per la precision www.lufft.com Lufft Ceilometer Series // 1 Lufft Ceilometers
also known as barometric pressure; weight of the air above the surface of the earth; measured by a barometer air pressure, high
 Weather Vocabulary Vocabulary Term Meaning/Definition air mass * large bodies of air that have the similar properties throughout such as temperature, humidity, and air pressure; causes most of the weather
Weather Practice. 4. As wind velocity decreases, the distance between isobars on a weather map will A) decrease B) increase C) remain the same
 decrease B) increase C) remain the same") 1. The chart below shows the air temperature and the dewpoint temperature near the ground at a given location for four consecutive days. All temperatures were recorded at noon. Which statement is best
1. The chart below shows the air temperature and the dewpoint temperature near the ground at a given location for four consecutive days. All temperatures were recorded at noon. Which statement is best