IMPACT OF WEATHER FACTORS ON GO-AROUND OCCURRENCE BHARATH DONAVALLI THESIS
|
|
|
- Charles Cobb
- 6 years ago
- Views:
Transcription
1 IMPACT OF WEATHER FACTORS ON GO-AROUND OCCURRENCE by BHARATH DONAVALLI THESIS Submitted in partial fulfillment of the requirements for the degree of Master of Science in Civil Engineering at The University of Texas at Arlington May, 2016 Arlington, Texas Supervising Committee: Stephen P Mattingly, Supervising Professor Siamak A Ardekani James C Williams
2 Copyright by Bharath Donavalli 2016 ii
3 ACKNOWLEDGEMENT I would like to express my sincere gratitude to professor Dr. Stephen P Mattingly for lending his support and steering me in the right direction, both in research and course work. His guidance, mentoring and knowledge helped in the successful accomplishment of this study. I thank the National Aeronautical and Space Administration/ Federal Aviation Administration facility, North Texas Research Station for providing the Airport Surface Detection Equipment, Model X (ASDE-X) data. iii
4 ABSTRACT IMPACT OF WEATHER FACTORS ON GO-AROUND OCCURENCE Bharath Donavalli, MS The University of Texas at Arlington, 2016 Supervising Professor: Stephen P Mattingly A go-around occurs when an aircraft, which is on final approach, aborts it landing due to unsatisfactory conditions. Go-arounds have a significant impact on the capacity of the airports and pose a serious concern at large airports, especially for airports with diagonal runways. Go-arounds occur due to manual errors, mechanical faults and weather factors. This study focuses on the impact of weather factors on go-around occurrence. The study includes wind gust, storm events (thunderstorm, rain and snow) and visibility as the weather factors under investigation. The author uses a factorial sampling strategy where these factors are segmented into additional categories to create a sampling matrix. After classifying all days into one of the matrix cells, the study randomly selects a single day from each cell for a total of eighteen 18 days. The author uses Airport Surface Detection Equipment, Model X (ASDE-X) data for this study. After cleaning the raw data and extracting the arrival aircraft data, the researcher identifies the total number of go-arounds using mapping software. The study compares the categories for each factor of interest to determine if their goaround rates appear significantly different from each other using the two proportion Z test. The statistical analysis indicates that wind gust (>29 mph) and thunderstorm significantly increase the probability of a go-around. However, visibility does not show a significant impact. iv
5 TABLE OF CONTENTS ACKNOWLEDGEMENT... iii ABSTRACT... iv LIST OF FIGURES AND TABLES... vi CHAPTER 1: INTRODUCTION... 1 CHAPTER 2: CIRCUMSTANCES LEADING TO A GO-AROUND... 4 CHAPTER 3: METHODOLOGY... 6 Data Type... 6 Data Cleaning... 7 CHAPTER 4: CASE STUDY... 8 Selection of Variables and Their Ranges CHAPTER 5: ANALYSIS Two Proportion Z Tests Model CHAPTER 6: CONCLUSION FUTURE RECOMMENDATIONS REFERENCES APPENDIX Appendix A: Tables Appendix B: Models and their ANOVA tables v
6 LIST OF FIGURES AND TABLES FIGURE 1 Percentage of fatal accidents and onboard fatalities (Boeing, 2015) FIGURE 2 Intersection of flight paths of diagonal runways FIGURE 3 DFW Airport Diagram (Federal Aviation Administration, n.d.)... 9 FIGURE 4 Cluster matrix FIGURE 5 Tracking of go-around flights using Google Earth Pro TABLE 1 Proportion of Go-Arounds of Each Individual Variable Range TABLE 2 Two Proportion Z Tests vi
.")
7 CHAPTER 1 INTRODUCTION The United States had more fatal aviation crashes than any other nation. According to the Aviation Safety Network, a total number of 10,625 fatalities occurred since 1945 (Flight Safety Foundation, 2016). In 2014, 1287 civil aviation crashes occurred, resulting in 261 fatalities (National Transportation Safety Board). According to the Boeing 2014 statistics shown in Figure 1, most of the fatal aviation accidents (48%) are observed within the final approach and landing stages (Boeing, 2015). This proves that the final approach and landing stages are the critical stages in airborne operation. Pilots may avoid an incident at the final approach stage by aborting landing and returning to the landing path when the conditions are satisfactory. This process of aborting the landing of an aircraft which is on final approach is called a go-around. FIGURE 1 Percentage of fatal accidents and onboard fatalities (Boeing, 2015). A go-around has a significant effect on the capacity of airports with diagonal runways. When an arriving aircraft on the diagonal runway has to perform a go-around (Figure 2), it might collide with an aircraft taking off at the same time on a parallel runway, at the point of intersection of flight paths/ traffic patterns of two runways (circle marked portion in Figure 2). In 1
8 order to avoid this conflict, air traffic operators halt the takeoff operation on parallel runways until the arriving aircraft takes a taxi way or performs a go-around. This shows the interdependency of the operations of the two runways. This scenario has a significant effect on the capacity of the airport during peak hours. FIGURE 2 Intersection of flight paths of diagonal runways. Understanding the possible causes for go-arounds may allow air traffic control to increase the operational efficiency of an airport during the peak hours. Realizing this need, the study tries to identify the weather factors that influence or impact the need for a go-around operation. In addition, the study analyzes the impact of the identified weather factors at different levels, on the go-around occurrence rate by performing statistical tests. The study also aims to develop a model that defines the proportions of daily go-arounds with these identified factors. The study provides 2
9 a detailed description of identified key weather factors and assess their impact on go-around occurrence. Airport agencies can use the proposed framework to understand the risk and causes of go-arounds, and plan airport operations accordingly. 3
10 CHAPTER 2 CIRCUMSTANCES LEADING TO A GO-AROUND The following circumstances may lead an aircraft to perform a go-around: Obstacles on the runway: Landing has to be aborted when obstacles are present on the runway safety area, which is an imaginary surface surrounding the runway (Federal Aviation Administration, 2004). Separation: Separation is the minimum vertical, lateral and longitudinal distance that an aircraft has to maintain from another aircraft to avoid a collision. If proper separation is not maintained by an arriving aircraft from the preceding arriving aircraft or departing aircraft on the same or diagonal runway, a go-around has to be performed to avoid a conflict (Namowitz). Inclement weather conditions (events): Thunderstorm, fog, snow, and rain are the weather conditions that may lead to go-around (Federal Aviation Administration, 2004). Wind: During heavy wind conditions, wind gust in particular, an aircraft may tend to lean in the direction of the wind, and thus, the aircraft will miss the center-line alignment with the runway and has to go-around (Federal Aviation Administration, 2004). Visibility: Lack of visibility may also lead an aircraft to abort landing. Sometimes birds are also a reason for poor visibility. Glide path: If an aircraft does not maintain the exact line and rate of descent to land, might miss the exact touchdown point and has to abort landing. (Federal Aviation Administration, 2004). Aircraft mechanical problems: Most aircraft crashes occur due to mechanical problems caused by turbulence, landing gear, engine, etc. (Federal Aviation Administration, 2004). 4
11 This study focuses on the impact of wind gust, storm events (thunderstorm, rain and snow) and visibility factors on the go-around occurrence rate and developing a model with these factors that defines the proportion of daily go-arounds. 5
12 CHAPTER 3 METHODOLOGY This study uses observed and recorded flight data to assess when a go-around occurs. The goaround rate may vary depending on the weather conditions; the study determines the aggregate go-around rate on a daily basis. By combining the daily go-around data with the observed weather conditions, the author may establish comparative scenarios for different conditions and explore the aggregate go-around rates for statistically significant differences. The Case Study section provides a detailed presentation of the comparative scenarios and sample structure considered in this particular study. The rest of this section provides a description of the data used in the study and the procedure necessary to clean and use it. Data Type Airport Surface Detection Equipment, Model X, or ASDE-X is a safety tool that detects potential conflicts on the runways and taxiways by tracking the location of aircraft and airport vehicles at each second. The location data of aircraft and vehicles are obtained from surveillance radar located on the top of the aircraft and remote tower, and other surveillance equipment present at the airport. ASDE-X tracks the aircraft flying within a 5-mile radius of the airport (Federal Aviation Administration, 2010). ASDE-X stores the track data in an XML format. At each second, the location (longitude and latitude), altitude, track number (specific number given to an aircraft when the tracking starts for the first time), name and other relevant information of the aircraft are stored. 6
13 Data Cleaning ASDE-X may not record complete information for every aircraft at each second, which creates missing fields. These missing field values may be obtained from other data points in the same flight track. The analysis of go-arounds only requires a subset of all of the ASDE-X data fields (i.e. altitude, longitude, latitude, track, and time). The cleaning of the raw data to obtain the required data is performed using a spreadsheet. First, the data for every aircraft is grouped by sorting the raw data using the track number followed by time. Then, the relevant information (latitude, longitude, altitude, track, and time) required to distinguish the departing and arriving aircrafts is retained and rest is excluded. The relevant information is further filtered by altitude and time to obtain all arrival aircraft data. A track number may be assigned to more than one aircraft on the same day, but, they can be differentiated by the time. Having the required track information of all the arrival aircraft, a go-around aircraft can be identified by applying latitude/longitude thresholds to the runway. When an arriving aircraft cross the thresholds, which are opposite to the arriving side of the runway, it is identified as a goaround. 7
14 CHAPTER 4 CASE STUDY The study investigates go-around rates at Dallas/Fort-Worth (DFW) International airport, which ranks as the fourth busiest airport in operations (landing and takeoffs) and ninth busiest among passengers served, in the world (Dallas/Fort Worth International Airport, n.d.). In 2015, a total number of 681,261 operations were recorded with an average daily capacity of 2,814 operations (reportable hours: 7.00 AM to 9:59 PM) (Federal Aviation Administration, 2016). DFW has ASDE-X data available, and a large number of flights daily, which makes it a strong candidate for this study. DFW has a runway configuration that fits the potential problem of intersecting flight paths during go-arounds. As shown in Figure 3 DFW has seven runways; five are parallel runways and the other two are diagonal. DFW operates in south flow about seventy percent of the time due to prevailing winds; during the remaining thirty percent of the time, it operates in north flow. In the case of crosswinds, especially from the west or north-west, the diagonal runways are brought into operation (Dallas/For Worth International Airport, n.d.). Despite DFW sharing its airspace with other airports west and south-east of its location, the study distinguishes the aircraft arriving to or departing from DFW from other aircraft by their flight paths. 8


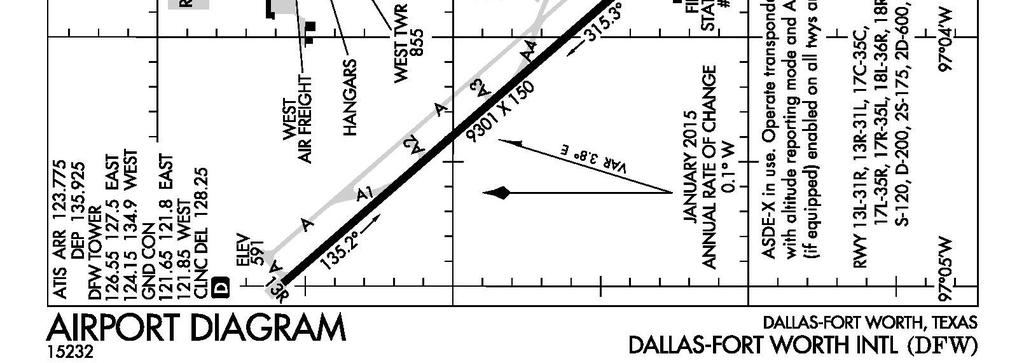
15 FIGURE 3 DFW Airport Diagram (Federal Aviation Administration, n.d.). 9
16 Selection of Variables and Their Ranges Based on the literature review, weather conditions (e.g. thunderstorm, rain, and snow), wind gust and visibility, which may range from zero to ten miles, represent the key weather factors impacting the need for an aircraft to perform a go-around. From weather underground website, the author obtains the event, wind gust and visibility data at DFW airport for every day in the years 2014 and Weather underground website provides a combined and accurate data of the various weather parameters observed from its personal weather stations and other sources used by National Weather Service (NWS) (Weather Underground, n.d.). The study defines wind gust as the highest gust speed observed throughout a day; this is a single value for each day. Visibility is the average value of each hour visibility in miles. The wind gust varies between two and sixty miler per hour during the years 2014 and In order to develop data clusters for analysis and sampling, the author creates a distribution of the daily wind gust and visibility; these distributions may be divided into three roughly equal groups or thirds. Wind gust has significant variability and Figure 4 describes the values used to define the low, medium and high thirds. Visibility does not separate as easily into equal thirds or even halves because a majority of the days have a visibility of 10 miles; therefore, the study just separates visibility into two groups with visibility equal to ten miles in one group and all other visibility in the other group (Figure 4). Among the events, a thunderstorm creates a greater likelihood of go-around than rain and snow. Thus, weather conditions are categorized into three groups; Occurrence of thunderstorm Occurrence of Rain and/or snow Note: (If two events occur on any given day, the event with higher intensity takes prominence) 10
17 No event Considering the three classes of wind gust and events and two classes of visibility, the study develops a cluster matrix (3*3*2) (Figure 4) for sampling and analysis. The author classifies each of the 730 days into one of these cells and randomly samples a day from each cell for a total of eighteen days. If the DFW airport was partially or fully closed during any of the selected days, the author excludes that day and picks a fully operated day from the same cell. The author obtains the total number of go-arounds and arrivals for these eighteen days using the above mentioned data cleaning process. FIGURE 4 Sampling and analysis cluster matrix. As DFW shares its airspace, the data includes aircraft flying above DFW airport at high altitudes. Hence, latitude/longitude thresholds could not be applied to the runways in identifying aircraft that performed go-arounds. Instead, the author visually inspected each flight using 11
 performing a go-around, with 217 being its track number and dots representing its location at each")
18 mapping software. As ASDE-X starts tracking (every second) all aircraft that enter the 5-mile radius of the airport, the path of the aircraft can be easily observed in mapping software. Figure 5 is a screenshot of mapping software, which depicts an arriving aircraft (on runway 18R) performing a go-around, with 217 being its track number and dots representing its location at each second. FIGURE 5 Tracking of go-around flights. 12
19 CHAPTER 5 ANALYSIS Using the previously established weather condition scenarios, the study seeks to determine significant differences in go-around rates between the scenarios. The paper describes two proportion Z tests within each weather condition and a linear regression model. The study uses Minitab and SAS software to complete the analysis. Two Proportion Z Tests Table 1 presents the total number of arrivals, go-arounds and proportion, which is the ratio of total number of go-arounds to the total number arrivals for each weather condition scenario. A ten percent level of significance (α) is considered throughout the analysis. TABLE 1 Proportion of Go-Arounds of Each Individual Variable Range Variable Range Total Arrivals Go-arounds Proportion of Go-around High Wind Gust Medium Low Thunderstorm Event Rain- Snow No event Visibility High visibility Low visibility The sample size (total number of arrivals) of each scenario is greater than 30. Hence, the author considered two proportion Z test. Table 2 presents the two proportion Z tests of the variables. From these tests, high wind gust (> 29 mph) significantly increases the likelihood of go around events over the medium and low wind gust dates. Similarly, the thunderstorm event appears to have a significantly greater rate of go-arounds than rain, snow or clear days. However, visibility appears to have no significant impact on the rate of go-arounds. 13
20 Variable Wind Gust Wind Gust Wind Gust Event Event Event Visibility Comparing (Range) TABLE 2 Two Proportion Z Tests. Result Hypothesis P- Remark Value Go-around rate during high wind gust is significantly greater than medium range No significant difference between medium and low range wind gust Go-around rate during high wind gust is significantly greater than low range Go-around rate during thunderstorm event is significantly greater than the rate during rain-snow events No significant difference between rain-snow events and no events Go-around rate during thunderstorm event is significantly greater than the rate during no events No significant difference between high and low visibility High Null: p₁ - p₂ = 0 Medium Alternative: p₁ - p₂ > 0 Medium Null: p₁ - p₂ = 0 Low Alternative: p₁ - p₂ 0 High Null: p₁ - p₂ = 0 Low Alternative: p₁ - p₂ > 0 Thunderstorm Null: p₁ - p₂ = 0 Rain-Snow Alternative: p₁ - p₂ > 0 Rain-Snow Null: p₁ - p₂ = 0 No event Alternative: p₁ - p₂ 0 Thunderstorm Null: p₁ - p₂ = 0 No event Alternative: p₁ - p₂ > 0 High Null: p₁ - p₂ = 0 Low Alternative: p₁ - p₂ 0 Model The aggregated daily data is used to develop a linear regression model that defines the proportion of daily go-arounds as the dependent variable. In this model data, wind gust and visibility are considered continuous variables, and the event is defined as a dummy variable. The author reduces the event variable to only two cases (thunderstorm or no), because the proportions of goarounds with events rain-snow and without any events are not significantly different in the previous analysis. Various models, with and without transformations of both the response and predictor variables were previewed (Appendix B). The best model among these is represented in equation1. 14
21 = ( ) ( h ) ( ) + Equation 1 The model indicates that the proportion of go-arounds increases with increase in wind gust decrease of visibility occurrence of thunderstorm All the variables in the model have a P-value greater than assumed level of significance (0.1), which indicates that none of the variables are significant (represented in Appendix B.1). The R- Square and Adjusted R-Square of the model are and respectively. This indicates that this model is not an ideal model for making any policy decisions, but it does provide limited insight into the relationship of a change in weather condition. The lack of definitive fit exhibited by this model indicates that many factors other than weather conditions significantly contribute to the liklihood of go-around occurrence and linking these factors into the model appears critical for estimating a stronger model. 15
22 CHAPTER 6 CONCLUSION While the modeling provides inconclusive results, certain weather conditions appear to increase the risk of go-around occurrence. A high wind gust (> 29 mph) increases the likelihood of goaround occurrence. Thunderstorm also presents a significantly greater probability of go-arounds compared to other events. Visibility appears to have no significant impact on the occurrence of go-arounds. This may be due to the limited variability in visibility at DFW airport; however, the role of visibility in go-around occurrence requires further investigation and quantification. While the factors discussed in this paper may not be the direct cause of go-arounds, they provide some indication of the conditions where go-arounds will occur more frequently. Furthermore, the observed go-around rates may vary at other airports; however, the factors indicating an increased risk appear likely to remain the same. FUTURE RECOMMENDATIONS The analysis only considers a sample of 18 days. A larger sample size may be able to estimate a stronger model. This study only focused on Dallas/Fort Worth international airport. Expanding the study to multiple airports, would help us better understand the impact of the weather factors on occurrence of a go-around. Instead of aggregate modeling, disaggregate modeling with detailed weather conditions during each flight s approach may help in quantifying the significance of the weather factors. Maintaining a detailed record of go-arounds at each airport, would be of great help in future research work. These records should include aircraft name, date, time and 16
23 reason for performing a go-around, to properly characterizing the causes of goarounds. 17
24 REFERENCES 1. Boeing. (2015, August). Aviation Safety. Retrieved from Boeing Website: 2. Dallas/For Worth International Airport. (n.d.). Aircraft Noise. Retrieved from Dallas/For Worth International Airport: 3. Dallas/Fort Worth International Airport. (n.d.). DFW Fast Facts. Retrieved from DFW Airport: 4. Donoghue, J. (n.d.). Flight Safety Foundation. Retrieved from Flight Safety : 5. Federal Aviation Administration. (2004). Airport Traffic Patterns. Airplane Flying Handbook, 7-1 to Federal Aviation Administration. (2004). Approaches and Landings. Airplane Flying Handbook, 8-1 to Federal Aviation Administration. (2010, October 05). Fact Sheets. Retrieved from Federal Aviation Administration: 8. Federal Aviation Administration. (2015). Order JO W. Air Traffic Organization Policy. 9. Federal Aviation Administration. (2016, February 17). NextGEN. Retrieved from Federal Aviation Administration: Federal Aviation Administration. (n.d.). Airport Diagrams. Retrieved from Flight Safety Foundation. (2016, March 31). Worst geographical regions. Retrieved from Aviation Safety Network: Kanji, G. K. (2006). 100 Statistical Tests. Sage Publications. 13. Kutner, M. H., Nachtsheim, C. J., Neter, J., & Li, W. (2005). Applied Linear Statistical Models. McGraw-Hill/Irwin. 14. Namowitz, D. (n.d.). 10 Reason to Go-Around. The Best of Flight Training Magazine. Aircraft Owners and Pilots Association. 15. National Transportation Safety Board. (n.d.). Aviation Statistics. Retrieved from National Transportation Safety Board: 18
25 16. Sandberg, M. (2012). Applications of ASDE-X Data to the Analysis of Airport. Massachusetts Institute of Technology. 17. Weather Underground. (n.d.). Retrieved from The Weather Company, LLC: 19
26 CHAPTER 7 Appendix A: Tables APPENDIX TABLE A1 Total Number of Arrivals and Go-arounds from Each Cell Date Wind Gust range Event Visibility- Range Total Go-arounds Total Arrivals 26-Apr High Thunderstorm High Apr High Rain/Snow High May High No event High Apr High Thunderstorm Low Dec High Rain/Snow Low Apr High No event Low Apr Medium Thunderstorm High May Medium Rain/Snow High May Medium No event High May Medium Thunderstorm Low Jun Medium Rain/Snow Low May Medium No event Low May Low Thunderstorm High Nov Low Rain/Snow High Jun Low No event High Nov Low Thunderstorm Low Aug Low Rain/Snow Low Nov Low No event Low Total
27 TABLE A2 Aggregate Data Used for the Analysis Proportions of Go-around (of each day) Wind Gust (mph) Event (Thunderstorm or No) Visibility (miles) 21
28 Appendix B: Models and their ANOVA tables TABLE B1 Proportion of Go-arounds vs. Wind gust, Event and Visibility Source DF Sum of Squares Analysis of Variance Mean Square F Value Pr > F Model Error Corrected Total Root MSE R-Square Dependent Mean Adj R-Sq Coeff Var Variable DF Parameter Estimate Parameter Estimates Standard Error t Value Pr > t Variance Inflation Intercept Wind Gust Event Visibility
29 TABLE B.2 Proportion of Go-arounds vs. Inverse Wind Gust Analysis of Variance Source DF Sum of Squares Mean Square F Value Pr > F Model Error Corrected Total Root MSE R-Square Dependent Mean Adj R-Sq Coeff Var Parameter Estimates Variable DF Parameter Estimate Standard Error t Value Pr > t Intercept In Wind Gust TABLE B.3 Proportion of Go-arounds vs. Wind Gust and Event Analysis of Variance Source DF Sum of Squares Mean Square F Value Pr > F Model Error Corrected Total Root MSE R-Square Dependent Mean Adj R-Sq Coeff Var Parameter Estimates Variable DF Parameter Estimate Standard Error t Value Pr > t Variance Inflation Intercept Wind Gust Event
30 TABLE B.4 Exponential of Proportion of Go-arounds vs. Inverse-Square Root Wind Gust Analysis of Variance Source DF Sum of Squares Mean Square F Value Pr > F Model Error Corrected Total Root MSE R-Square Dependent Mean Adj R-Sq Coeff Var Parameter Estimates Variable DF Parameter Estimate Standard Error t Value Pr > t Intercept <.0001 InSqrt Wind Gust TABLE B.5 Proportion of go-arounds vs. Inverse-Square Root Wind Gust Analysis of Variance Source DF Sum of Squares Mean Square F Value Pr > F Model Error Corrected Total Root MSE R-Square Dependent Mean Adj R-Sq Coeff Var Parameter Estimates Variable DF Parameter Estimate Standard Error t Value Pr > t Intercept InSqrt Wind Gust
31 TABLE B.6 Exponential (Proportion of Go-arounds) vs. Inverse-Square Root Wind Gust and Visibility Analysis of Variance Source DF Sum of Squares Mean Square F Value Pr > F Model Error Corrected Total Root MSE R-Square Dependent Mean Adj R-Sq Coeff Var Parameter Estimates Variable DF Parameter Estimate Standard Error t Value Pr > t Variance Inflation Intercept < InSqrt Wind Gust Visibility TABLE B.7 Exponential (Proportion of Go-arounds) vs. Wind Gust and Events Analysis of Variance Source DF Sum of Squares Mean Square F Value Pr > F Model Error Corrected Total R-Square Adj R-Sq Parameter Estimates Variable DF Parameter Estimate Standard Error t Value Pr > t Intercept <.0001 Wind Gust Event
32 TABLE B.8 Exponenetial (Proportion of Go-arounds) vs. Wind Gust and Visibility Analysis of Variance Source DF Sum of Squares Mean Square F Value Pr > F Model Error Corrected Total R-Square Adj R-Sq Parameter Estimates Variable DF Parameter Estimate Standard Error t Value Pr > t Intercept <.0001 Wind Gust Visibility
An Application of the Improved Models for Risk Assessment of Runway Excursion in Korea
 , pp.86-92 http://dx.doi.org/10.14257/astl.2016.138.20 An Application of the Improved Models for Risk Assessment of Runway Excursion in Korea Seuing-Beom Hong 1, Tukhtaev Dilshod 1, DoHyun Kim 1, 1 1 Department
Doppler Weather Radars and Weather Decision Support for DP Vessels
 Author s Name Name of the Paper Session DYNAMIC POSITIONING CONFERENCE October 14-15, 2014 RISK SESSION Doppler Weather Radars and By Michael D. Eilts and Mike Arellano Weather Decision Technologies, Inc.
Predicting flight on-time performance
 1 Predicting flight on-time performance Arjun Mathur, Aaron Nagao, Kenny Ng I. INTRODUCTION Time is money, and delayed flights are a frequent cause of frustration for both travellers and airline companies.
Tornado Hazard Risk Analysis: A Report for Rutherford County Emergency Management Agency
 Tornado Hazard Risk Analysis: A Report for Rutherford County Emergency Management Agency by Middle Tennessee State University Faculty Lisa Bloomer, Curtis Church, James Henry, Ahmad Khansari, Tom Nolan,
RISK FACTORS FOR FATAL GENERAL AVIATION ACCIDENTS IN DEGRADED VISUAL CONDITIONS
 RISK FACTORS FOR FATAL GENERAL AVIATION ACCIDENTS IN DEGRADED VISUAL CONDITIONS Jana M. Price Loren S. Groff National Transportation Safety Board Washington, D.C. The prevalence of weather-related general
NJ SURVEYORS CONFERENCE
 NJ SURVEYORS CONFERENCE PART 107 Ground School TODAY S AGENDA Regulations National Airspace System Operations Weather Loading and Performance 1 REGULATIONS Remote Pilot Certifications and Privileges When
METEOROLOGY PANEL (METP) WORKING GROUP- METEOROLOGICAL OPERATION GROUP (MOG) FIRST MEETING
 WORKING GROUP- METEOROLOGICAL OPERATION GROUP (MOG) FIRST MEETING") 8 28/7/15 METEOROLOGY PANEL (METP) WORKING GROUP- METEOROLOGICAL OPERATION GROUP (MOG) FIRST MEETING Gatwick, United Kingdom, 08 to 11 September 2015 Agenda Item 3: Matters relating to SADIS 3.3: Operations
8 28/7/15 METEOROLOGY PANEL (METP) WORKING GROUP- METEOROLOGICAL OPERATION GROUP (MOG) FIRST MEETING Gatwick, United Kingdom, 08 to 11 September 2015 Agenda Item 3: Matters relating to SADIS 3.3: Operations
NCAR UCAR. 50 th Anniversary Lecture
 NCAR & UCAR 50 th Anniversary Lecture Turbulence, Wind Shear, Toxin Attacks, and Other Things That Go Bump In the Night: Applied Research for Real-Life Problems Bill Mahoney National Center for Atmospheric
A Tree-Based Ensemble Method for the Prediction and Uncertainty Quantification of Aircraft Landing Times*
 2.2 A Tree-Based Ensemble Method for the Prediction and Uncertainty Quantification of Aircraft Landing Times* Yan Glina, Richard Jordan, Mariya Ishutkina MIT Lincoln Laboratory Lexington, MA, USA yglina@ll.mit.edu,
UNCERTAINTY ANALYSIS FOR EVENT SEQUENCE DIAGRAMS IN AVIATION SAFETY
 0 0 UNCERTAINTY ANALYSIS FOR EVENT SEQUENCE DIAGRAMS IN AVIATION SAFETY Azin Zare Noghabi George Mason University Tel: 0-- Email: azarenog@masonlive.gmu.edu John F. Shortle George Mason University 00 University
Section 7: Hazard Avoidance
 7.1 In-Flight Hazard Awareness Section 7: Hazard Avoidance As technology improves, pilots have more and more real-time information within reach in all phases of flight. Terrain proximity, real-time weather
Montréal, 7 to 18 July 2014
 INTERNATIONAL CIVIL AVIATION ORGANIZATION WORLD METEOROLOGICAL ORGANIZATION MET/14-WP/34 28/5/14 Meteorology (MET) Divisional Meeting (2014) Commission for Aeronautical Meteorology Fifteenth Session Montréal,
Paine Field Airport Existing and Future Environmental Assessment, Initiation of Commercial Service Noise Analysis
 Paine Field Airport Existing and Future Environmental Assessment, Initiation of Commercial Service Noise Analysis July 2012 Prepared by: BridgeNet International 3151 Airway Avenue Building I-2 Costa Mesa,
Effect of Environmental Factors on Free-Flow Speed
 Effect of Environmental Factors on Free-Flow Speed MICHAEL KYTE ZAHER KHATIB University of Idaho, USA PATRICK SHANNON Boise State University, USA FRED KITCHENER Meyer Mohaddes Associates, USA ABSTRACT
Airbus A320 registered TS-IMC Date and time 12 March 2013 at 10 h 15 UTC (1) Operator
 Operator") www.bea.aero REPORT INCIDENT Runway overrun during taxiing after landing (1) Except where otherwise stated, the times shown in this report are expressed in Universal Time Coordinated (UTC). Aircraft Airbus
www.bea.aero REPORT INCIDENT Runway overrun during taxiing after landing (1) Except where otherwise stated, the times shown in this report are expressed in Universal Time Coordinated (UTC). Aircraft Airbus
P1.1 THE NATIONAL AVIATION WEATHER PROGRAM: AN UPDATE ON IMPLEMENTATION
 P1.1 THE NATIONAL AVIATION WEATHER PROGRAM: AN UPDATE ON IMPLEMENTATION Thomas S. Fraim* 1, Mary M. Cairns 1, and Anthony R. Ramirez 2 1 NOAA/OFCM, Silver Spring, MD 2 Science and Technology Corporation,
and SUMMARY preliminary parameters. 1.1 MET/14-IP/ /15 In line 1.2 WORLD INTERNATIONAL CIVIL AVIATION ORGANIZATION 2/6/14 English only
 INTERNATIONAL CIVIL AVIATION ORGANIZATION Meteorology (MET) Divisional Meeting (2014) WORLD METEOROLOGICAL ORGANIZATION Commission for Aeronautical Meteorology Fifteenth Session MET/14-IP/ /15 2/6/14 English
1.1 ATM-WEATHER INTEGRATION AND TRANSLATION MODEL. Steve Bradford, David J. Pace Federal Aviation Administration, Washington, DC
 1.1 ATM-WEATHER INTEGRATION AND TRANSLATION MODEL Steve Bradford, David J. Pace Federal Aviation Administration, Washington, DC Matt Fronzak *, Mark Huberdeau, Claudia McKnight, Gene Wilhelm The MITRE
Sources of Hourly Surface Data and Weather Maps for the U.S.
 Sources of Hourly Surface Data and Weather Maps for the U.S. Weather Underground Weather Underground http://www.wunderground.com/history/ maintains a deep archive of hourly reports for around the world.
Predictive Analytics on Accident Data Using Rule Based and Discriminative Classifiers
 Advances in Computational Sciences and Technology ISSN 0973-6107 Volume 10, Number 3 (2017) pp. 461-469 Research India Publications http://www.ripublication.com Predictive Analytics on Accident Data Using
AOPA. Mitigating Turbulence Impacts in Aviation Operations. General Aviation Perspective
 AOPA Mitigating Turbulence Impacts in Aviation Operations General Aviation Perspective Rune Duke Senior Director, Airspace & Air Traffic Services Aircraft Owners & Pilots Association AOPA Air Safety Institute
Human Factors Assessment of Runway Status Lights (RWSL) and Final Approach Runway Occupancy Signal (FAROS) Maria Picardi Kuffner
 and Final Approach Runway Occupancy Signal (FAROS) Maria Picardi Kuffner") Human Factors Assessment of Runway Status Lights (RWSL) and Final Approach Runway Occupancy Signal (FAROS) FAA Operational Evaluations at Dallas Ft. Worth and San Diego International Airports Maria Picardi
Human Factors Assessment of Runway Status Lights (RWSL) and Final Approach Runway Occupancy Signal (FAROS) FAA Operational Evaluations at Dallas Ft. Worth and San Diego International Airports Maria Picardi
Sources of Hourly Surface Data and Weather Maps for the U.S.
 Sources of Hourly Surface Data and Weather Maps for the U.S. Weather Underground Weather Underground http://www.wunderground.com/history/ maintains a deep archive of hourly reports for around the world.
Deriving Meteorological Data from free-to-air Mode-S broadcasts in an Australian Context.
 Deriving Meteorological Data from free-to-air Mode-S broadcasts in an Australian Context. Douglas Body Bureau of Meteorology, Melbourne, Australia d.body@bom.gov.au ABSTRACT Using free to air Automatic
P5.3 EVALUATION OF WIND ALGORITHMS FOR REPORTING WIND SPEED AND GUST FOR USE IN AIR TRAFFIC CONTROL TOWERS. Thomas A. Seliga 1 and David A.
 P5.3 EVALUATION OF WIND ALGORITHMS FOR REPORTING WIND SPEED AND GUST FOR USE IN AIR TRAFFIC CONTROL TOWERS Thomas A. Seliga 1 and David A. Hazen 2 1. Volpe National Transportation Systems Center, Cambridge,
Dr. Thomas A. Seliga
 EE 500 GRADUATE COLLOQUIUM Spring 2014 You are cordially invited to DEVELOPMENT OF THE TALL VESSEL DETECTION SYSTEM (TVDS) AT BOSTON S LOGAN INTERNATIONAL AIRPORT AND THE OPPORTUNISTIC DEMONSTRATION OF
ADL110B ADL120 ADL130 ADL140 How to use radar and strike images. Version
 ADL110B ADL120 ADL130 ADL140 How to use radar and strike images Version 1.00 22.08.2016 How to use radar and strike images 1 / 12 Revision 1.00-22.08.2016 WARNING: Like any information of the ADL in flight
MINISTRY OF DEFENCE MILITARY AIRCRAFT ACCIDENT SUMMARY
 MINISTRY OF DEFENCE MILITARY AIRCRAFT ACCIDENT SUMMARY AIRCRAFT ACCIDENT TO ROYAL AIR FORCE TORNADO F3 ZG751 AIRCRAFT: RAF Tornado F3 ZG751 DATE: 25 August 2003 LOCATION: PARENT UNIT: CREW: INJURIES: CFB
Preventing Runway Excursions. Landing on wet / Contaminated Runways
 Preventing Runway Excursions Landing on wet / Contaminated Runways Overview Introduction Definition Runway Condition Runway Condition Reporting Pilot Operational Aspects Landing Performance Airport Operational
Data evaluation of BDS registers from airborne transponders
 Data evaluation of BDS registers from airborne transponders Jan Angelis Department of Air Transport Czech Technical University in Prague angelis.cz@gmail.com Jiří Frei Planning and Development Division
Preventing Runway Excursions. Landing on wet / Contaminated Runways
 Preventing Runway Excursions Landing on wet / Contaminated Runways Overview Introduction Definition Runway Condition Runway Condition Reporting Pilot Operational Aspects Landing Performance Airport Operational
The Climate of Payne County
 The Climate of Payne County Payne County is part of the Central Great Plains in the west, encompassing some of the best agricultural land in Oklahoma. Payne County is also part of the Crosstimbers in the
The Montague Doppler Radar, An Overview
 ISSUE PAPER SERIES The Montague Doppler Radar, An Overview June 2018 NEW YORK STATE TUG HILL COMMISSION DULLES STATE OFFICE BUILDING 317 WASHINGTON STREET WATERTOWN, NY 13601 (315) 785-2380 WWW.TUGHILL.ORG
Three-Dimensional Aerial Zoning around a Lebanese Airport
 Three-Dimensional Aerial Zoning around a Lebanese Airport Abstract by Oussama C. Jadayel and Rita Y. Ibrahim GIS Center, Faculty of Engineering, University of Balamand, P.O. Box: 100, Tripoli, LEBANON
Real-Time defenses. FlightOPS
 Real-Time defenses By Wayne Rosenkrans Integrating data from terminal Doppler weather radar and anemometer-based wind shear alerting systems during the past years has further reduced, but not eliminated,
Acquisition of Multi-Function Equipment at DIA: Conditions, Factors, Considerations & Integration. Presented by Mike Carlson September 20, 2012
 Acquisition of Multi-Function Equipment at DIA: Conditions, Factors, Considerations & Integration Presented by Mike Carlson September 20, 2012 1 Denver International Airport 5 Runways 12,000 /. (3,658m)
IMPROVING THE ACCURACY OF RUNWAY ALLOCATION IN AIRCRAFT NOISE PREDICTION
 IMPROVING THE ACCURACY OF RUNWAY ALLOCATION IN AIRCRAFT NOISE PREDICTION David G. Southgate and Jonathan P. Firth Aviation Operations, Dept of Transport and Regional Services (DOTARS), Canberra, Australia
SAMPLE. SITE SPECIFIC WEATHER ANALYSIS Wind Report. Robinson, Smith & Walsh. John Smith REFERENCE:
 SAMPLE SITE SPECIFIC WEATHER ANALYSIS Wind Report PREPARED FOR: Robinson, Smith & Walsh John Smith REFERENCE: JACK HIGGINS / 4151559-01 CompuWeather Sample Report Please note that this report contains
Multi-objective optimization of workload to study the locus of control in a novel airspace
 Multi-objective optimization of workload to study the locus of control in a novel airspace KENN C. NELSON Department of pplied Mathematics and Statistics University of California, Santa Cruz ugust 2, 2015
Federal Aviation Administration Optimal Aircraft Rerouting During Commercial Space Launches
 Federal Aviation Administration Optimal Aircraft Rerouting During Commercial Space Launches Rachael Tompa Mykel Kochenderfer Stanford University Oct 28, 2015 1 Motivation! Problem: Launch vehicle anomaly
MASSACHUSETTS INSTITUTE OF TECHNOLOGY. 244 Wood Street LEXINGTON, MA Project Memorandum No. 42PM-TCAS-0070 Date: 5 November 2008
 Unclassified MASSACHUSETTS INSTITUTE OF TECHNOLOGY LINCOLN LABORATORY 244 Wood Street LEXINGTON, MA 02420-9108 Project Memorandum No. 42PM-TCAS-0070 Date: 5 November 2008 Subject: White Paper on SA01 Near
WYANDOTTE MUNICIPAL SERVICES COMMUNITY WIND ENERGY PROJECT WIND RESOUCE SUMMARY
 WYANDOTTE MUNICIPAL SERVICES COMMUNITY WIND ENERGY PROJECT WIND RESOUCE SUMMARY MONTHLY REPORT October 15, 2007 Black & Veatch Project: 144374 Prepared by: Black & Veatch Corporation 6300 S. Syracuse Way
Aircraft Operation Anomaly Detection Using FDR Data
 Aircraft Operation Anomaly Detection Using FDR Data Lishuai Li, Maxime Gariel, R. John Hansman IAB/Airline Industry Consortium Nov 4, 2010 1 Motivation Commercial aircraft accident rate has dropped significantly.
Texas A&M University
 Texas A&M University CVEN 658 Civil Engineering Applications of GIS Hotspot Analysis of Highway Accident Spatial Pattern Based on Network Spatial Weights Instructor: Dr. Francisco Olivera Author: Zachry
Traffic Flow Impact (TFI)
") Traffic Flow Impact (TFI) Michael P. Matthews 27 October 2015 Sponsor: Yong Li, FAA ATO AJV-73 Technical Analysis & Operational Requirements Distribution Statement A. Approved for public release; distribution
Traffic Flow Impact (TFI) Michael P. Matthews 27 October 2015 Sponsor: Yong Li, FAA ATO AJV-73 Technical Analysis & Operational Requirements Distribution Statement A. Approved for public release; distribution
AWOS Level Descriptions
 AWOS Level Descriptions AWOS System Configurations. The AWOS is a modular system utilizing a central processor which may receive input from several sensors. Eight standard groups of sensors are defined
Analysis of Variance. Source DF Squares Square F Value Pr > F. Model <.0001 Error Corrected Total
 Math 221: Linear Regression and Prediction Intervals S. K. Hyde Chapter 23 (Moore, 5th Ed.) (Neter, Kutner, Nachsheim, and Wasserman) The Toluca Company manufactures refrigeration equipment as well as
SAMPLE. SITE SPECIFIC WEATHER ANALYSIS Wind Report. Robinson, Smith & Walsh. John Smith. July 1, 2017 REFERENCE: 1 Maple Street, Houston, TX 77034
 SAMPLE SITE SPECIFIC WEATHER ANALYSIS Wind Report PREPARED FOR: Robinson, Smith & Walsh John Smith July 1, 2017 REFERENCE: JACK HIGGINS / 4151559-01 1 Maple Street, Houston, TX 77034 CompuWeather Sample
Airport Meteorology Analysis
 Airport Meteorology Analysis Alex Alshtein Kurt Etterer October 2014 Presented at ICAO Business Class 2014 ICAO, Montreal, Canada Approved for Public Release: 14-3466. Distribution Unlimited. October 2014
Plan for operational nowcasting system implementation in Pulkovo airport (St. Petersburg, Russia)
") Plan for operational nowcasting system implementation in Pulkovo airport (St. Petersburg, Russia) Pulkovo airport (St. Petersburg, Russia) is one of the biggest airports in the Russian Federation (150
Plan for operational nowcasting system implementation in Pulkovo airport (St. Petersburg, Russia) Pulkovo airport (St. Petersburg, Russia) is one of the biggest airports in the Russian Federation (150
IMPROVING THE CONVECTIVE FORECASTS OF THE FEDERAL AVIATION ADMINISTRATION
 The Pennsylvania State University The Graduate School College of Earth and Mineral Sciences IMPROVING THE CONVECTIVE FORECASTS OF THE FEDERAL AVIATION ADMINISTRATION A Thesis in Meteorology by Marikate
The Climate of Marshall County
 The Climate of Marshall County Marshall County is part of the Crosstimbers. This region is a transition region from the Central Great Plains to the more irregular terrain of southeastern Oklahoma. Average
the issue of for Aviation
 2/3/12 INTERNATIONAL VOLCANIC ASH TASK FORCE (IVATF) SECOND MEETING Montréal, 11 to 15 July 2011 List of Recommendations The second meeting of the International Volcanic Ash Task Force (IVATF/2), held
APPENDIX G-7 METEROLOGICAL DATA
 APPENDIX G-7 METEROLOGICAL DATA METEOROLOGICAL DATA FOR AIR AND NOISE SAMPLING DAYS AT MMR Monthly Normals and Extremes for Honolulu International Airport Table G7-1 MMR RAWS Station Hourly Data Tables
ANALYSIS OF AIRCRAFT LATERAL PATH TRACKING ACCURACY AND ITS IMPLICATIONS FOR SEPARATION STANDARDS
 ANALYSIS OF AIRCRAFT LATERAL PATH TRACKING ACCURACY AND ITS IMPLICATIONS FOR SEPARATION STANDARDS Michael Cramer, The MITRE Corporation, McLean, VA Laura Rodriguez, The MITRE Corporation, McLean, VA Abstract
FIELD EVALUATION OF SMART SENSOR VEHICLE DETECTORS AT RAILROAD GRADE CROSSINGS VOLUME 4: PERFORMANCE IN ADVERSE WEATHER CONDITIONS
 CIVIL ENGINEERING STUDIES Illinois Center for Transportation Series No. 15-002 UILU-ENG-2015-2002 ISSN: 0197-9191 FIELD EVALUATION OF SMART SENSOR VEHICLE DETECTORS AT RAILROAD GRADE CROSSINGS VOLUME 4:
On the Modeling of Airport Arrival and Departure Delay Distributions
 International Symposium on Computers & Informatics (ISCI 215) On the Modeling of Airport Arrival and Departure Delay Distributions Qian Wu School of Information Engineering, MinZu University of China,
Smoother Rides Through Better Turbulence Forecasting
 Smoother Rides Through Better Turbulence Forecasting White Paper www.dtn.com / 1.800.610.0777 Copyright 2017 DTN DTN has devoted years of research with some of the top scientists in the aviation weather
Weather and Travel Time Decision Support
 Weather and Travel Time Decision Support Gerry Wiener, Amanda Anderson, Seth Linden, Bill Petzke, Padhrig McCarthy, James Cowie, Thomas Brummet, Gabriel Guevara, Brenda Boyce, John Williams, Weiyan Chen
Unmanned Aircraft System Well Clear
 Unmanned Aircraft System Well Clear Dr. Roland Weibel 18 November 2014 Sponsors: Neal Suchy, FAA TCAS Program Manager, Surveillance Services, AJM-233 Jim Williams, FAA Unmanned Aircraft Systems Integration
J11.3 Aviation service enhancements across the National Weather Service Central Region
 J11.3 Aviation service enhancements across the National Weather Service Central Region Brian P. Walawender * National Weather Service Central Region HQ, Kansas City, MO Jennifer A. Zeltwanger National
Guidance to Instructors on Subject Delivery PILOT NAVIGATION. This is a suggested programme for the delivery of this subject.
 Programme of learning: Guidance to Instructors on Subject Delivery This is a suggested programme for the delivery of this subject. The main headings are the Learning Outcomes (LO1, LO2, etc), with sub
SAMPLE. SITE SPECIFIC WEATHER ANALYSIS Rainfall Report. Bevens Engineering, Inc. Susan M. Benedict REFERENCE:
 SAMPLE SITE SPECIFIC WEATHER ANALYSIS Rainfall Report PREPARED FOR: Bevens Engineering, Inc. Susan M. Benedict REFERENCE: DUBOWSKI RESIDENCE / FILE# 11511033 CompuWeather Sample Report Please note that
Uncertainty Limits for an Aircraft-Based Runway Friction Assessment Method
 Uncertainty Limits for an Aircraft-Based Runway Friction Assessment Method Angela Campbell, Ph.D. and Andrew Cheng, Ph.D. Aviation Research Division FAA William J. Hughes Technical Center Atlantic City,
09 December 2005 snow event by Richard H. Grumm National Weather Service Office State College, PA 16803
 09 December 2005 snow event by Richard H. Grumm National Weather Service Office State College, PA 16803 1. INTRODUCTION A winter storm produced heavy snow over a large portion of Pennsylvania on 8-9 December
On the Probabilistic Modeling of Runway Inter-departure Times
 On the Probabilistic Modeling of Runway Inter-departure Times The MIT Faculty has made this article openly available. Please share how this access benefits you. Your story matters. Citation As Published
Pilot briefing ENTC - Tromsø airport, Langnes
 Pilot briefing ENTC - Tromsø airport, Langnes NOTE: The content in this briefing will not be updated as frequently as AIP Norway. Make sure you always check relevant information in the latest edition of
The Climate of Haskell County
 The Climate of Haskell County Haskell County is part of the Hardwood Forest. The Hardwood Forest is characterized by its irregular landscape and the largest lake in Oklahoma, Lake Eufaula. Average annual
The Climate of Texas County
 The Climate of Texas County Texas County is part of the Western High Plains in the north and west and the Southwestern Tablelands in the east. The Western High Plains are characterized by abundant cropland
Daily Rainfall Disaggregation Using HYETOS Model for Peninsular Malaysia
 Daily Rainfall Disaggregation Using HYETOS Model for Peninsular Malaysia Ibrahim Suliman Hanaish, Kamarulzaman Ibrahim, Abdul Aziz Jemain Abstract In this paper, we have examined the applicability of single
The Climate of Bryan County
 The Climate of Bryan County Bryan County is part of the Crosstimbers throughout most of the county. The extreme eastern portions of Bryan County are part of the Cypress Swamp and Forest. Average annual
NATIONAL TRANSPORTATION SAFETY BOARD WASHINGTON, D.C. SAFETY RECOMMENDATION LETTER TO THE FAA dated NOVEMBER 21, 1994, AND RESPONSES.
 DOCKET NO.: SA-517 EXHIBIT NO. 3-R NATIONAL TRANSPORTATION SAFETY BOARD WASHINGTON, D.C. SAFETY RECOMMENDATION LETTER TO THE FAA dated NOVEMBER 21, 1994, AND RESPONSES (22 pages) / /7 8!?>3 @. National
Example of Aircraft Climb and Maneuvering Performance. Dr. Antonio A. Trani Professor
 Example of Aircraft Climb and Maneuvering Performance CEE 5614 Analysis of Air Transportation Systems Dr. Antonio A. Trani Professor Example - Aircraft Climb Performance Aircraft maneuvering performance
Traffic and Weather. Soaring Safety Foundation. Tom Johnson CFIG
 Traffic and Weather Soaring Safety Foundation Tom Johnson CFIG Weather Contents Weather Gathering Sources Weather Acquisition Enroute Weather Analysis Weather Hazards Weather in the Landing Pattern Basic
COLLINS WXR-2100 MULTISCAN RADAR FULLY AUTOMATIC WEATHER RADAR. Presented by: Rockwell Collins Cedar Rapids, Iowa 52498
 COLLINS WXR-2100 MULTISCAN RADAR FULLY AUTOMATIC WEATHER RADAR Presented by: Rockwell Collins Cedar Rapids, Iowa 52498 TABLE OF CONTENTS MultiScan Overview....................................................................................1
Statistics Diagnostic. August 30, 2013 NAME:
 Statistics Diagnostic August 30, 013 NAME: Work on all six problems. Write clearly and state any assumptions you make. Show what you know partial credit is generously given. 1 Problem #1 Consider the following
Gleim Private Pilot FAA Knowledge Test 2015 Edition, 1st Printing Updates July 2015
 Page 1 of 6 Gleim Private Pilot FAA Knowledge Test 2015 Edition, 1st Printing Updates July 2015 NOTE: Deleted text is displayed with a line through it. New text is shown with a blue background. If you
Weather in the Connected Cockpit
 Weather in the Connected Cockpit What if the Cockpit is on the Ground? The Weather Story for UAS Friends and Partners of Aviation Weather November 2, 2016 Chris Brinton brinton@mosaicatm.com Outline Mosaic
Advanced Weather Technology
 Advanced Weather Technology Tuesday, October 16, 2018, 1:00 PM 2:00 PM PRESENTED BY: Gary Pokodner, FAA WTIC Program Manager Agenda Overview Augmented reality mobile application Crowd Sourcing Visibility
Corridor Integrated Weather System (CIWS) MIT Lincoln Laboratory. CIWS D. Meyer 10/21/05
 MIT Lincoln Laboratory. CIWS D. Meyer 10/21/05") Corridor Integrated Weather System () Outline Example of Weather Impacting Air traffic Impacts on worst delay day Ways to reduce delay Improve forecasts Aid traffic flow management Aviation Delay Problem
Corridor Integrated Weather System () Outline Example of Weather Impacting Air traffic Impacts on worst delay day Ways to reduce delay Improve forecasts Aid traffic flow management Aviation Delay Problem
Responsive Traffic Management Through Short-Term Weather and Collision Prediction
 Responsive Traffic Management Through Short-Term Weather and Collision Prediction Presenter: Stevanus A. Tjandra, Ph.D. City of Edmonton Office of Traffic Safety (OTS) Co-authors: Yongsheng Chen, Ph.D.,
4A.1 RESULTS OF THE NATIONAL AVIATION WEATHER PROGRAM S 10-YEAR GOAL TO REDUCE WEATHER-RELATED ACCIDENTS BY 80 PERCENT
 4A.1 RESULTS OF THE NATIONAL AVIATION WEATHER PROGRAM S 10-YEAR GOAL TO REDUCE WEATHER-RELATED ACCIDENTS BY 80 PERCENT Samuel P. Williamson, Judson E. Stailey*, and Mark J. Welshinger Office of the Federal
July 13, 2017 Session #1 In Lieu of the Surface Observation Including EWINS Authority, RTMA, Web Cams, and Remote Observation Systems
 July 13, 2017 Session #1 In Lieu of the Surface Observation Including EWINS Authority, RTMA, Web Cams, and Remote Observation Systems Part 121 Operator Perspective: Equivalent Level of Safety Using Remote
AVIATION INVESTIGATION REPORT A04A0057 WING SCRAPE DURING A REJECTED LANDING
 AVIATION INVESTIGATION REPORT A04A0057 WING SCRAPE DURING A REJECTED LANDING CARGOJET AIRWAYS LIMITED BOEING 727-225 C-GCJB GREATER MONCTON INTERNATIONAL AIRPORT MONCTON, NEW BRUNSWICK 28 MAY 2004 The
Evaluation of fog-detection and advisory-speed system
 Evaluation of fog-detection and advisory-speed system A. S. Al-Ghamdi College of Engineering, King Saud University, P. O. Box 800, Riyadh 11421, Saudi Arabia Abstract Highway safety is a major concern
Evolving Meteorological Services for the Terminal Area
 Evolving Meteorological Services for the Terminal Area Towards an new participatory approach in ATM H. Puempel Chief, Aeronautical Meteorology Division Weather and Disaster Risk Reduction Dept. WMO The
The Climate of Kiowa County
 The Climate of Kiowa County Kiowa County is part of the Central Great Plains, encompassing some of the best agricultural land in Oklahoma. Average annual precipitation ranges from about 24 inches in northwestern
Deploying the Winter Maintenance Support System (MDSS) in Iowa
 in Iowa") Deploying the Winter Maintenance Support System (MDSS) in Iowa Dennis A. Kroeger Center for Transportation Research and Education Iowa State University Ames, IA 50010-8632 kroeger@iastate.edu Dennis Burkheimer
Deploying the Winter Maintenance Support System (MDSS) in Iowa Dennis A. Kroeger Center for Transportation Research and Education Iowa State University Ames, IA 50010-8632 kroeger@iastate.edu Dennis Burkheimer
City of Camrose Winter Road Maintenance Policy
 City of Camrose Winter Road Maintenance Policy The purpose of this policy is to outline the level of service that the City of Camrose delivers regarding the maintenance of roads in winter conditions. 1.
The Climate of Seminole County
 The Climate of Seminole County Seminole County is part of the Crosstimbers. This region is a transition region from the Central Great Plains to the more irregular terrain of southeastern Oklahoma. Average
HAZUS-MH: Earthquake Event Report
 HAZUS-MH: Earthquake Event Report Region Name: El Paso County Earthquake Scenario: El Paso County Random EQ Print Date: February 08, 2006 Disclaimer: The estimates of social and economic impacts contained
Regression Models for Forecasting Fog and Poor Visibility at Donmuang Airport in Winter
 Regression Models for Forecasting Fog and Poor Visibility at Donmuang Airport in Winter S. Ruangjun 1,* and R. H. B. Exell 2 1 Weather Division (Beside Military Airport, Wing 6), Paholyothin Road, Donmuang,
SAMPLE. SITE SPECIFIC WEATHER ANALYSIS Rainfall Report. Bevins Engineering, Inc. Susan M. Benedict. July 1, 2017 REFERENCE:
 SAMPLE SITE SPECIFIC WEATHER ANALYSIS Rainfall Report PREPARED FOR: Bevins Engineering, Inc. Susan M. Benedict July 1, 2017 REFERENCE: DUBOWSKI RESIDENCE / FILE# 11511033 1500 Water Street, Pensacola,
Transportation and Road Weather
 Portland State University PDXScholar TREC Friday Seminar Series Transportation Research and Education Center (TREC) 4-18-2014 Transportation and Road Weather Rhonda Young University of Wyoming Let us know
The Climate of Murray County
 The Climate of Murray County Murray County is part of the Crosstimbers. This region is a transition between prairies and the mountains of southeastern Oklahoma. Average annual precipitation ranges from
Weather History on the Bishop Paiute Reservation
 Weather History on the Bishop Paiute Reservation -211 For additional information contact Toni Richards, Air Quality Specialist 76 873 784 toni.richards@bishoppaiute.org Updated 2//214 3:14 PM Weather History
P10.3 HOMOGENEITY PROPERTIES OF RUNWAY VISIBILITY IN FOG AT CHICAGO O HARE INTERNATIONAL AIRPORT (ORD)
") P10.3 HOMOGENEITY PROPERTIES OF RUNWAY VISIBILITY IN FOG AT CHICAGO O HARE INTERNATIONAL AIRPORT (ORD) Thomas A. Seliga 1, David A. Hazen 2 and Stephen Burnley 3 1. Volpe National Transportation Systems
P10.3 HOMOGENEITY PROPERTIES OF RUNWAY VISIBILITY IN FOG AT CHICAGO O HARE INTERNATIONAL AIRPORT (ORD) Thomas A. Seliga 1, David A. Hazen 2 and Stephen Burnley 3 1. Volpe National Transportation Systems
Active Traffic & Safety Management System for Interstate 77 in Virginia. Chris McDonald, PE VDOT Southwest Regional Operations Director
 Active Traffic & Safety Management System for Interstate 77 in Virginia Chris McDonald, PE VDOT Southwest Regional Operations Director Interstate 77 at Fancy Gap Mountain Mile markers 0-15 Built in late
Investigation of the validity of the ASTM standard for computation of International Friction Index
 University of South Florida Scholar Commons Graduate Theses and Dissertations Graduate School 2008 Investigation of the validity of the ASTM standard for computation of International Friction Index Kranthi
AN INVESTIGATION INTO THE IMPACT OF RAINFALL ON FREEWAY TRAFFIC FLOW
 AN INVESTIGATION INTO THE IMPACT OF RAINFALL ON FREEWAY TRAFFIC FLOW Brian L. Smith Assistant Professor Department of Civil Engineering University of Virginia PO Box 400742 Charlottesville, VA 22904-4742