AN INSIDE LOOK AT THE U.S. DROUGHT MONITOR
|
|
|
- Shanon Chambers
- 5 years ago
- Views:
Transcription


1 AN INSIDE LOOK AT THE U.S. DROUGHT MONITOR Great Basin Climate Forum Desert Research Institute Reno, Nevada December 6, 2018 David B. Simeral U.S. Drought Monitor Author Associate Research Scientist - Climatology Western Regional Climate Center & Desert Research Institute
2 Presentation Outline General overview of the USDM (who, what, where, when) Nuts and bolts of the collaborative process, data, methods, and analysis
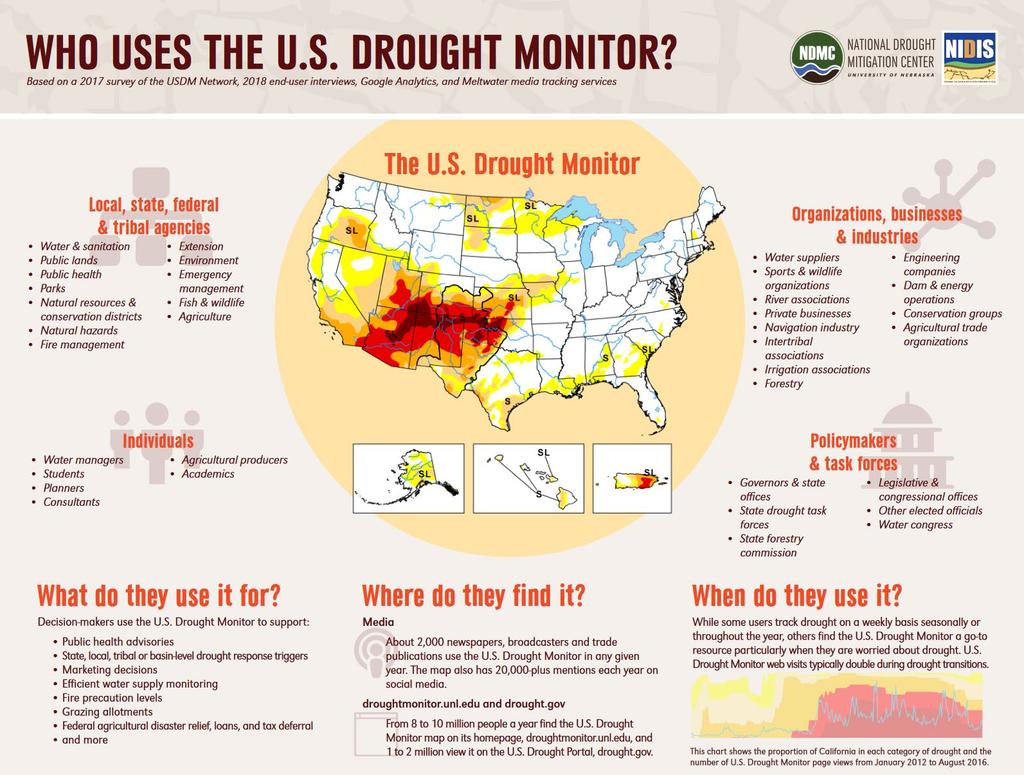
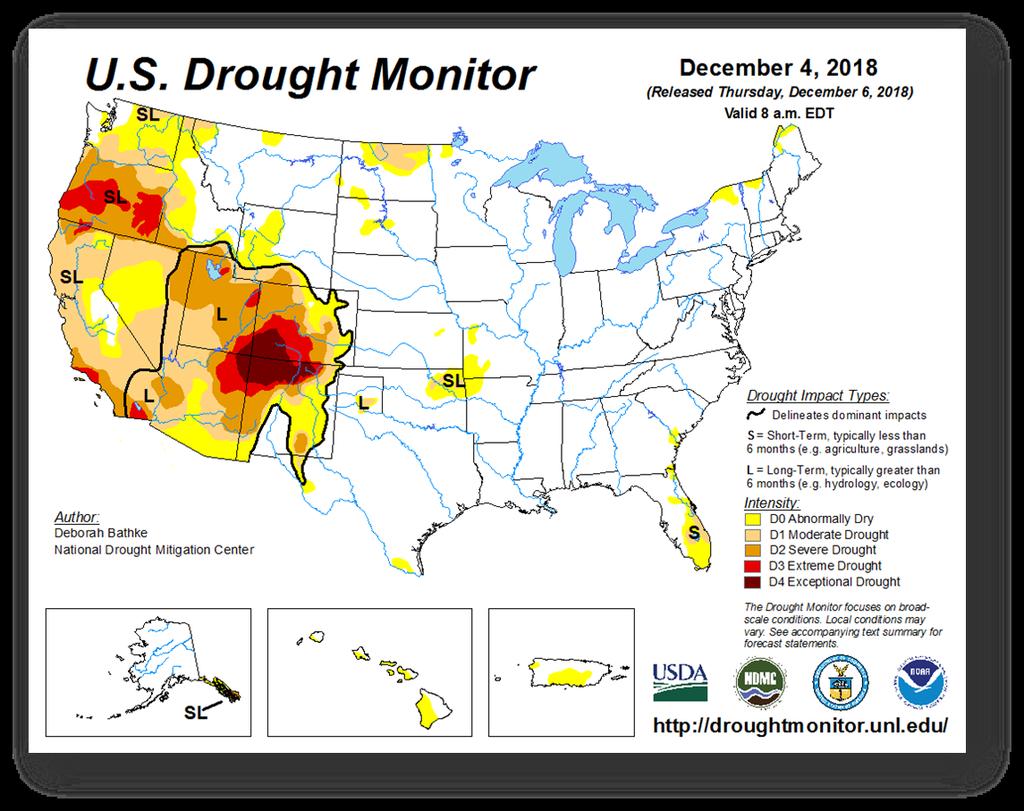
3 What is the USDM? Weekly composite drought map which conveys current information on the spatial extent & intensity of drought Jointly produced by National Drought Mitigation Center at the University of Nebraska-Lincoln, U.S. Department of Agriculture, and the National Oceanic & Atmospheric Administration Part of a drought early warning system (NOAA NIDIS)


4 Evolution of the USDM THE VERY FIRST U.S. DROUGHT MONITOR! THE MAP WAS CREATED IN CORELDRAW (BASIC DRAWING SOFTWARE) AUTHORS SWITCH FROM CORELDRAW TO GIS (GEOGRAPHIC INFORMATION SYSTEM) TO CREATE THE MAP MY FIRST SHIFT. INITIATION BY FIRE CURRENT MAP CONFIGURATION

5 Drought Monitor Expansion U.S. Virgin Islands (USVI) and U.S. Affiliated Pacific Islands (USAPI) including: Republic of Palau, Mariana Islands, Federated States of Micronesia, & Republic of the Marshall Islands Expected to go operational in early 2019 Adding a second weekly author to cover Puerto Rico, USAPI, & USVI USGS National Climate Adaptation Science Center hosted drought workshops in San Juan, PR & Honolulu, HI to discuss what drought looks like in these regions and related topics - data availability, drought impacts to agriculture, ecosystems, and water supply sectors


6 Who creates the weekly map? 12 national authors Authors work at regional or national centers, government or academia/research Authors work rotating shifts - typically two or three 2-week shifts annually A weekly Page 2 author will be added in 2019 to cover analysis of Puerto Rico, USVI, & USAPI


7 Our Contributors Backbone of the USDM Provide ground-truth 400+ contributors Configuration varies State coordination teams (For example, AZ, NM, MT) Regional or basin teams (CA-NV Upper Colorado River Basin)

8 USDM-NADM Forums Lincoln, NE 2000 Asheville, NC 2002 NADM Ashville, NC 2003 Cedar City, UT 2003 NADM Regina, SK 2004 Washington D.C NADM Mexico City, MEX 2006 Portland, OR 2007 NADM Ottawa, ON 2008 Austin, TX 2009 NADM Asheville, NC 2010 Washington D.C NADM Cancun, MEX 2012 West Palm Beach, FL 2013 NADM Toronto, ON 2014 Reno, NV 2015 NADM Fort Worth, TX 2016 Keystone, SD 2017 NDMC Calgary, AB 2018 Bowling Green, KY Spring 2019
 spatial extent probability of occurrence impacts")
9 The Drought Monitor Concept A consolidation of indices and indicators into one comprehensive national drought map Try to capture these characteristics: drought magnitude (duration + intensity) spatial extent probability of occurrence impacts

 Convergence of evidence")
10 Overall Objectives/Approach USDM is not a model, forecast, or drought declaration An assessment of current conditions Applies a Fujita-like scale to drought Identify drought impacts (short-term and long-term) Incorporate local expert input Be as objective as possible (percentiles) Convergence of evidence approach
.")
11 Drought Severity Classification Drought intensity based upon: Key indicators (PDSI, soil moisture, streamflow, SPI, Objective Drought Indicator Blends) and dozens of additional parameters Drought impacts Local reports Drought categories are associated with historical occurrence/likelihood (percentile ranking). It s not anecdotal or subjective, like it s really, really dry or I don t ever remember is being this dry we have to be D4.


12 State-Specific Drought Impacts Classification Table For questions or comments contact Mary Noel at
13


14 Who uses the USDM? USDA - drought disaster declarations FSA Livestock Forage Disaster Program IRS tax deferrals on forced livestock sales due to drought NWS Drought Information Statements State, local, tribal, and basin-level decision makers trigger drought responses Media & general public
: 2011 Calendar Year: $ 286,776,568 2012 Calendar Year: $ 2,621,500,028 2013 Calendar Year: $ 1,651,745,226 2014 Calendar Year: $ 925,559,268 2015 Calendar Year: $ 536,347,785")
15 2014 Farm Bill Livestock Forage Disaster Program payouts (financial assistance to producers who suffered grazing losses due to drought or fire on or after October 1, 2011, during the calendar year in which the loss occurred): 2011 Calendar Year: $ 286,776, Calendar Year: $ 2,621,500, Calendar Year: $ 1,651,745, Calendar Year: $ 925,559, Calendar Year: $ 536,347, Calendar Year: $ 287,976, Calendar Year: $ 358,830, Calendar Year: $ 160,751,027 LFDP Total, : $ 6,829,486,921 (Updated through 8/29/2018) Nevada 2012: $14,096, : $15,707, : $15,702, : $12,694, : $ 6,998, : $ 176,895 Data credit: USDA-OCE


16 NOAA NIDIS DEWS Utilizes new and existing federal, tribal, state, local, and academic partners to make climate & drought information accessible and useful to decision makers Focus on improving the capacity of stakeholders to monitor, forecast, plan for, and cope with the impacts of drought CA-NV DEWS hosts bi-monthly drought & climate outlook webinars and stakeholder calls/meetings. Website: Recent activities in the Great Basin working on improving inter-agency and stakeholder participation and development of the Utah Drought Monitoring Working Group NIDIS hosted drought coordination workshops in collaboration with the Utah Department of Water Resources and USDA Southwest Climate Hub
17

18 Most droughts do not have all the indicators in agreement Look at where most of the indicators are pointing Reported impacts help to paint a clearer picture

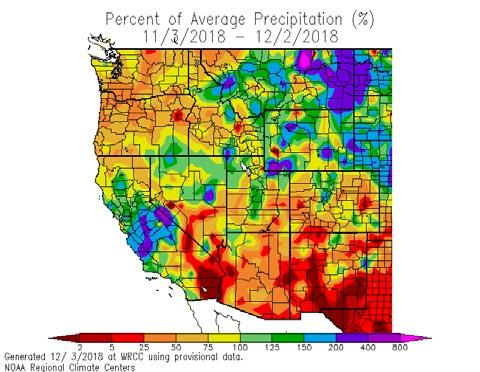


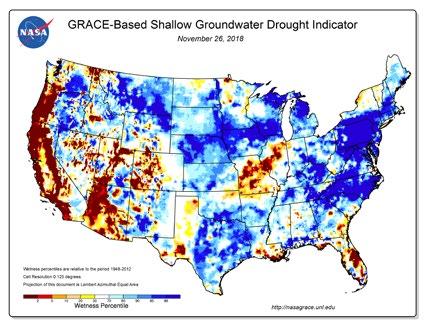

19 Convergence of Evidence Indices: SPI/PDSI Precipitation Snowpack Soil Moisture Expert Local Input Streamflow Reservoirs Remote Sensing

 Hydrological USGS Water Watch, USGS Groundwater Watch, NRCS & USBR reservoir levels, NASA GRACE Shallow Groundwater Soil moisture NOAA NLDAS,")
 Fire Danger Keetch-Byram drought index (KBDI) Evaporative Demand Drought Indices")
20 Meteorological & Climate Data NWS Advanced Hydrologic Prediction Service (AHPS), NWS WPC forecast discussions, NWS QPF forecasts, Westwide Drought Tracker, NOAA NCEI Temperature & Precipitation Products, ACIS Climate Maps, Climate Engine, NRCS SNOTEL, California Snow Surveys, NWS National Operational Hydrologic Remote Sensing Center, CoCoRaHS, RAWS, local mesonets (i.e., OK Mesonet, NICE Net) Hydrological USGS Water Watch, USGS Groundwater Watch, NRCS & USBR reservoir levels, NASA GRACE Shallow Groundwater Soil moisture NOAA NLDAS, NASA GRACE, NASA SMAP, NOAA CPC, NOAA Crop Moisture Index, NASA GRACE Surface & Root-Zone Soil Moisture, NOAA CRN, NRCS SCAN, local mesonets Objective Drought Indicator Blends NOAA CPC Vegetation Health Indices NOAA VHI, NDMC/USGS VEGDRI, Climate Engine (NDVI - Landsat & MODIS) Fire Danger Keetch-Byram drought index (KBDI) Evaporative Demand Drought Indices NOAA EDDI, NOAA/USDA ESI Impacts NDMC Drought Impact Reporter, CoCoRaHS Conditions Monitoring, NASS crop condition reports, NOAA Quarterly Regional Climate Impacts Reports


21 Local Input During a shift, traffic is very heavy with 100 s of s in addition to numerous coordination calls with state & regional drought teams. Contributor inputs come in many forms


22
23


24 And then there s Texas (all 254 counties) Texas Recommendations Author s Interpretation


25 USDM Timeline Thursday, Friday, and over the weekend ramp up looking at indicators, obtain dx shapefiles, look at 5-day QPF forecast, review transition , & address lingering issues Monday draft #1 goes out, respond to s, various coordination calls Tuesday respond to s from contributors, more conference calls, map editing, & input verification. Data cutoff is 7 a.m. EST. Draft #2/3 goes out Wednesday author responds to final comments and last minute map edits. Author writes narrative for each region. Final map goes out to the listserv. Final map shapefiles sent out to NDMC for processing and to NOAA CPC Thursday - final map and narrative are released at 8:30 a.m. (ET) and the process starts over again

26 Data Analysis & Map Creation Data Analysis Begins with pulling in the latest Dx shapefiles into ArcMap as well as acquiring the latest data from various sources.

27 Data Analysis Overlay the NWS Advanced Hydrologic Prediction Service (AHPS) 7-day observed precipitation totals over the Dx layers and identify areas of interest
 layer to help verify the radar")
28 Data Analysis Overlay radar beam coverage (at or below 10,000 ft AGL) layer to help verify the radar data
29 Data Analysis Zoom in to take a closer look and add other spatial layers (towns/city, roads, shaded relief)
30 Data Analysis Add other indices (SPI) to see how the precipitation event impacted the numbers at various time scales
31 Data Analysis Add real-time streamflow layer to look at the streamflow response to the event and to identify other areas where flows are low (keeping in mind many rivers are highly managed)

32 Data Analysis add drought impacts layer to see what impacts are being reported through CoCoRaHS

33 Data Analysis add VHI layer to check vegetative health/rangeland conditions
34 Data Analysis start editing the Dx polygon and verification of local input


35 With more input from local experts and higherresolution datasets, the level of detail in the drought depiction has increased considerably over the past 5 years.


36 Weekly Narrative Final step for the USDM author Written Wednesday morning after the map is completed Describes the significant weather events of the week, an overview of the regional changes on the map, drought impacts, and what to expect weather-wise for the week One of the most challenging elements of an authoring shift


37 Website - Accessing USDM Maps & Data

38 New USDM Editing Tool All data contained in an enterprise database with a redundant backup Centralized data storage and access Collaborators can give input directly onto a map layer Data will be available on ArcGIS Pro as an alternative to the on-line tool System allows another author to assume editing duties if an author becomes unavailable System is mirrored at another location

39 Drought Monitoring Challenges in the Great Basin Low density of observing stations Scarcity of drought impacts information (agricultural, ecological, hydrological, socioeconomic) from rural areas across Nevada and western Utah Need to define what specific drought impacts occur in the Great Basin and when they re likely to occur Need for expanded and more consistent coordination with relevant federal, state, and municipal agencies/entities Broaden the mindset that drought in the region impacts sectors beyond water resources

40 THANK YOU! Photo credit: Dave Simeral
The U.S. Drought Monitor: Parameters, People, Process, Policy
 The U.S. Drought Monitor: Parameters, People, Process, Policy Mark Svoboda, Climatologist Monitoring Program Area Leader National Drought Mitigation Center School of Natural Resources University of Nebraska-Lincoln
The History and Making of the U.S. Drought Monitor
 The History and Making of the U.S. Drought Monitor Mike Hayes, Director Mark Svoboda, Climatologist/Monitoring Program Area Leader Kelly Smith, Communications Specialist National Drought Mitigation Center
The United States Drought Monitor How is it Made?
 The United States Drought Monitor How is it Made? Brian Fuchs, Climatologist National Drought Mitigation Center School of Natural Resources University of Nebraska-Lincoln September 14-17, 2009 Bamako,
The U.S. Drought Monitor and tools from the National Drought Mitigation Center
 The U.S. Drought Monitor and tools from the National Drought Mitigation Center Brian Fuchs, Climatologist National Drought Mitigation Center School of Natural Resources University of Nebraska-Lincoln Winter
The U.S. Drought Monitor: A Composite Indicator Approach
 The U.S. Drought Monitor: A Composite Indicator Approach Mark Svoboda, Climatologist Monitoring Program Area Leader National Drought Mitigation Center School of Natural Resources University of Nebraska-Lincoln
The U.S. Drought Monitor: A Composite Indicator Approach
 The U.S. Drought Monitor: A Composite Indicator Approach Mark Svoboda, Climatologist Monitoring Program Area Leader National Drought Mitigation Center University of Nebraska-Lincoln NWS IN Climate Services
NIDIS Intermountain West Drought Early Warning System December 18, 2018
 NIDIS Intermountain West Drought Early Warning System December 18, 2018 Precipitation The images above use daily precipitation statistics from NWS COOP, CoCoRaHS, and CoAgMet stations. From top to bottom,
NIDIS Intermountain West Drought Early Warning System May 23, 2017
 NIDIS Drought and Water Assessment NIDIS Intermountain West Drought Early Warning System May 23, 2017 Precipitation The images above use daily precipitation statistics from NWS COOP, CoCoRaHS, and CoAgMet
NIDIS Intermountain West Drought Early Warning System December 11, 2018
 NIDIS Drought and Water Assessment NIDIS Intermountain West Drought Early Warning System December 11, 2018 Precipitation The images above use daily precipitation statistics from NWS COOP, CoCoRaHS, and
NIDIS Intermountain West Drought Early Warning System January 15, 2019
 NIDIS Drought and Water Assessment NIDIS Intermountain West Drought Early Warning System January 15, 2019 Precipitation The images above use daily precipitation statistics from NWS COOP, CoCoRaHS, and
GIS Tools, Data, & Methods in the Weekly US Drought Monitor
 GIS Tools, Data, & Methods in the Weekly US Drought Monitor International Workshop on Agromet and GIS Applications for Agricultural Decision Making Jeju, South Korea December 5, 2016 Eric Luebehusen USDA/OCE/WAOB
NIDIS Intermountain West Drought Early Warning System September 4, 2018
 NIDIS Drought and Water Assessment NIDIS Intermountain West Drought Early Warning System September 4, 2018 Precipitation The images above use daily precipitation statistics from NWS COOP, CoCoRaHS, and
NIDIS Intermountain West Drought Early Warning System April 16, 2019
 NIDIS Intermountain West Drought Early Warning System April 16, 2019 Precipitation The images above use daily precipitation statistics from NWS COOP, CoCoRaHS, and CoAgMet stations. From top to bottom,
NIDIS Intermountain West Drought Early Warning System January 16, 2018
 NIDIS Drought and Water Assessment NIDIS Intermountain West Drought Early Warning System January 16, 2018 Precipitation The images above use daily precipitation statistics from NWS COOP, CoCoRaHS, and
NIDIS Intermountain West Drought Early Warning System November 14, 2017
 NIDIS Intermountain West Drought Early Warning System November 14, 2017 Precipitation The images above use daily precipitation statistics from NWS COOP, CoCoRaHS, and CoAgMet stations. From top to bottom,
NIDIS Intermountain West Drought Early Warning System November 13, 2018
 NIDIS Intermountain West Drought Early Warning System November 13, 2018 Precipitation The images above use daily precipitation statistics from NWS COOP, CoCoRaHS, and CoAgMet stations. From top to bottom,
NIDIS Intermountain West Drought Early Warning System February 12, 2019
 NIDIS Intermountain West Drought Early Warning System February 12, 2019 Precipitation The images above use daily precipitation statistics from NWS COOP, CoCoRaHS, and CoAgMet stations. From top to bottom,
NIDIS Intermountain West Drought Early Warning System January 22, 2019
 NIDIS Drought and Water Assessment NIDIS Intermountain West Drought Early Warning System January 22, 2019 Precipitation The images above use daily precipitation statistics from NWS COOP, CoCoRaHS, and
NIDIS Intermountain West Drought Early Warning System October 17, 2017
 NIDIS Drought and Water Assessment NIDIS Intermountain West Drought Early Warning System October 17, 2017 Precipitation The images above use daily precipitation statistics from NWS COOP, CoCoRaHS, and
National Drought Mitigation Center. Drought Services: Collaborative Efforts Towards Drought Early Warning and Information Systems
 National Drought Mitigation Center Drought Services: Collaborative Efforts Towards Drought Early Warning and Information Systems Mark Svoboda, Climatologist Monitoring Program Area Leader National Drought
NIDIS Intermountain West Drought Early Warning System July 18, 2017
 NIDIS Drought and Water Assessment NIDIS Intermountain West Drought Early Warning System July 18, 2017 Precipitation The images above use daily precipitation statistics from NWS COOP, CoCoRaHS, and CoAgMet
NIDIS Intermountain West Drought Early Warning System February 6, 2018
 NIDIS Intermountain West Drought Early Warning System February 6, 2018 Precipitation The images above use daily precipitation statistics from NWS COOP, CoCoRaHS, and CoAgMet stations. From top to bottom,
NIDIS Intermountain West Drought Early Warning System March 26, 2019
 NIDIS Intermountain West Drought Early Warning System March 26, 2019 The images above use daily precipitation statistics from NWS COOP, CoCoRaHS, and CoAgMet stations. From top to bottom, and left to right:
Precipitation. Standardized Precipitation Index. NIDIS Intermountain West Regional Drought Early Warning System January 3, 2017
 1/3/2017 NIDIS Drought and Water Assessment NIDIS Intermountain West Regional Drought Early Warning System January 3, 2017 Precipitation The images above use daily precipitation statistics from NWS COOP,
NIDIS Intermountain West Drought Early Warning System November 21, 2017
 NIDIS Drought and Water Assessment NIDIS Intermountain West Drought Early Warning System November 21, 2017 Precipitation The images above use daily precipitation statistics from NWS COOP, CoCoRaHS, and
NIDIS Intermountain West Drought Early Warning System December 30, 2018
 1/2/2019 NIDIS Drought and Water Assessment NIDIS Intermountain West Drought Early Warning System December 30, 2018 Precipitation The images above use daily precipitation statistics from NWS COOP, CoCoRaHS,
NIDIS Intermountain West Drought Early Warning System February 19, 2019
 NIDIS Intermountain West Drought Early Warning System February 19, 2019 Precipitation The images above use daily precipitation statistics from NWS COOP, CoCoRaHS, and CoAgMet stations. From top to bottom,
NIDIS Intermountain West Regional Drought Early Warning System February 7, 2017
 NIDIS Drought and Water Assessment NIDIS Intermountain West Regional Drought Early Warning System February 7, 2017 Precipitation The images above use daily precipitation statistics from NWS COOP, CoCoRaHS,
Funding provided by NOAA Sectoral Applications Research Project MONITORING DROUGHT. Basic Climatology Colorado Climate Center
 Funding provided by NOAA Sectoral Applications Research Project MONITORING DROUGHT Basic Climatology Colorado Climate Center DEFINING DROUGHT First off, just what is drought? Define a tornado Define a
NIDIS Intermountain West Drought Early Warning System October 30, 2018
 10/30/2018 NIDIS Drought and Water Assessment NIDIS Intermountain West Drought Early Warning System October 30, 2018 Precipitation The images above use daily precipitation statistics from NWS COOP, CoCoRaHS,
NIDIS Intermountain West Drought Early Warning System August 8, 2017
 NIDIS Drought and Water Assessment 8/8/17, 4:43 PM NIDIS Intermountain West Drought Early Warning System August 8, 2017 Precipitation The images above use daily precipitation statistics from NWS COOP,
The North American Drought Monitor - The Canadian Perspective -
 The North American Drought Monitor - The Canadian Perspective - Trevor Hadwen National Agroclimate Information Service AAFC-PFRA, Regina Canmore, Alberta March 16-18, 2008 Background The NADM is a cooperative
Precipitation. Standardized Precipitation Index. NIDIS Intermountain West Drought Early Warning System September 5, 2017
 9/6/2017 NIDIS Drought and Water Assessment NIDIS Intermountain West Drought Early Warning System September 5, 2017 Precipitation The images above use daily precipitation statistics from NWS COOP, CoCoRaHS,
NIDIS Intermountain West Drought Early Warning System May 1, 2018
 NIDIS Intermountain West Drought Early Warning System May 1, 2018 Precipitation The images above use daily precipitation statistics from NWS COOP, CoCoRaHS, and CoAgMet stations. From top to bottom, and
Precipitation. Standardized Precipitation Index. NIDIS Intermountain West Regional Drought Early Warning System December 6, 2016
 12/9/2016 NIDIS Drought and Water Assessment NIDIS Intermountain West Regional Drought Early Warning System December 6, 2016 Precipitation The images above use daily precipitation statistics from NWS COOP,
The National Integrated Drought Information System (NIDIS) Moving the Nation from Reactive to Proactive Drought Risk Management
 Moving the Nation from Reactive to Proactive Drought Risk Management") The National Integrated Drought Information System (NIDIS) Moving the Nation from Reactive to Proactive Drought Risk Management CSG-West Annual Meeting Agriculture & Water Committee Snowbird, UT September
The National Integrated Drought Information System (NIDIS) Moving the Nation from Reactive to Proactive Drought Risk Management CSG-West Annual Meeting Agriculture & Water Committee Snowbird, UT September
NIDIS Intermountain West Drought Early Warning System April 18, 2017
 1 of 11 4/18/2017 3:42 PM Precipitation NIDIS Intermountain West Drought Early Warning System April 18, 2017 The images above use daily precipitation statistics from NWS COOP, CoCoRaHS, and CoAgMet stations.
NIDIS Intermountain West Drought Early Warning System December 4, 2018
 12/4/2018 NIDIS Drought and Water Assessment NIDIS Intermountain West Drought Early Warning System December 4, 2018 Precipitation The images above use daily precipitation statistics from NWS COOP, CoCoRaHS,
Drought Decision Support
 Drought Decision Support Doug Kluck Regional Climate Services Director Kansas City, MO NOAA s National Centers for Environmental Information September 12, 2018 NOAA Satellite and Information Service Mission
New Assessment Tools in Monitoring Drought
 New Assessment Tools in Monitoring Drought David Miskus Supervisory Meteorologist Joint Agricultural Weather Facility, Climate Prediction Center, NCEP/NWS/NOAA Washington, D.C. David.Miskus@noaa.gov Prepared
Drought and Climate Extremes Indices for the North American Drought Monitor and North America Climate Extremes Monitoring System. Richard R. Heim Jr.
 Drought and Climate Extremes Indices for the North American Drought Monitor and North America Climate Extremes Monitoring System Richard R. Heim Jr. NOAA/NESDIS/National Climatic Data Center Asheville,
NIDIS Intermountain West Drought Early Warning System April 24, 2018
 NIDIS Intermountain West Drought Early Warning System April 24, 2018 Precipitation The images above use daily precipitation statistics from NWS COOP, CoCoRaHS, and CoAgMet stations. From top to bottom,
NIDIS Drought and Water Assessment
 NIDIS Drought and Water Assessment PRECIPITATION The images above use daily precipitation statistics from NWS COOP, CoCoRaHS, and CoAgMet stations. From top to bottom, and left to right: most recent 7-days
NATIONAL WATER RESOURCES OUTLOOK
 NATIONAL WATER RESOURCES OUTLOOK American Meteorological Society Annual Meeting 24 th Hydrology Conference 9.2 James Noel Service Coordination Hydrologist National Weather Service-Ohio River Forecast Center
Doug Kluck NOAA Kansas City, MO National Center for Environmental Information (NCEI) National Integrated Drought Information System (NIDIS)
 National Integrated Drought Information System (NIDIS)") National Integrated Drought Information System (NIDIS) for the Missouri River Basin Drought Early Warning Information System (DEWS) & Runoff Trends in the Missouri Basin & Latest Flood Outlook Doug Kluck
National Integrated Drought Information System (NIDIS) for the Missouri River Basin Drought Early Warning Information System (DEWS) & Runoff Trends in the Missouri Basin & Latest Flood Outlook Doug Kluck
Water Availability in Alaska: Using and Understanding NOAA s Drought Monitor and Drought Outlook
 Water Availability in Alaska: Using and Understanding NOAA s Drought Monitor and Drought Outlook Douglas Le Comte,, Drought Specialist, NOAA/NWS/Climate Prediction Center June 10, 2008 Water is Important
CARIWIN Regional Seminar January 14-15, 2010, Georgetown, Guyana
 Creating the North American Drought Monitor Angel (Bennett) McCoy Angel.M.Bennett@noaa.gov NOAA/Climate Prediction Center Camp Springs, Maryland, U.S.A. Doug LeComte NOAA/Climate Prediction Center Richard
-Assessment of current water conditions. - Precipitation Forecast. - Recommendations for Drought Monitor
 2 May 1 st, 2012 -Assessment of current water conditions - Precipitation Forecast - Recommendations for Drought Monitor AHPS Water Year Precipitation as Percentage of Normal 7-day average
Drought Impacts in the Southern Great Plains. Mark Shafer University of Oklahoma Norman, OK
 Drought Impacts in the Southern Great Plains Mark Shafer University of Oklahoma Norman, OK Causes of Drought: Large-Scale, Stationary High Pressure Air rotates clockwise around high pressure steers storms
Indices and Indicators for Drought Early Warning
 Indices and Indicators for Drought Early Warning ADRIAN TROTMAN CHIEF, APPLIED METEOROLOGY AND CLIMATOLOGY CARIBBEAN INSTITUTE FOR METEOROLOGY AND HYDROLOGY IN COLLABORATION WITH THE NATIONAL DROUGHT MITIGATION
NIDIS Weekly Climate, Water and Drought Assessment Summary. Upper Colorado River Basin
 NIDIS Weekly Climate, Water and Drought Assessment Summary Upper Colorado River Basin August 3, 2010 Precipitation and Snowpack Fig. 1: July precipitation in inches Fig. 2: July precip as percent of average
NADM, NACEM, and Opportunities for Future Collaboration
 NADM, NACEM, and Opportunities for Future Collaboration Richard R. Heim Jr. NOAA/NESDIS/National Climatic Data Center Asheville, North Carolina, U.S.A. 4th Annual DRI Workshop 26-28 January 2009, Regina,
PRECIPITATION. Last Week Precipitation:
 12/3/2014 NIDIS Drought and Water Assessment PRECIPITATION The images above use daily precipitation statistics from NWS COOP, CoCoRaHS, and CoAgMet stations. From top to bottom, and left to right: most
WSWC/NOAA Workshops on S2S Precipitation Forecasting
 WSWC/NOAA Workshops on S2S Precipitation Forecasting San Diego, May 2015 Salt Lake City at NWS Western Region HQ, October 2015 Las Vegas at Colorado River Water Users Association, December 2015 College
The U.S. National Integrated Drought Information System. Roger S. Pulwarty National Oceanic and Atmospheric Administration USA
 The U.S. National Integrated Drought Information System Roger S. Pulwarty National Oceanic and Atmospheric Administration USA Drought: Weather-climate continuum and adaptation deficits 2010 2011 2012 2015
NOAA S2S Planning. Dave DeWitt Fred Toepfer
 NOAA S2S Planning Dave DeWitt Fred Toepfer 1 Agenda 1. Brief synopsis of The Weather Research and Forecasting Act of 2017 2. Report to Congress a. Timeline b. Process c. Document Outline 3. Some Preliminary
High Resolution Indicators for Local Drought Monitoring
 High Resolution Indicators for Local Drought Monitoring REBECCA CUMBIE, STATE CLIMATE OFFICE OF NC, NCSU Monitoring Drought Multiple indicators, multiple sources Local detail important 1 Point-Based Climate-Division
Funding provided by NOAA Sectoral Applications Research Project MONITORING DROUGHT. Basic Climatology Oklahoma Climatological Survey
 Funding provided by NOAA Sectoral Applications Research Project MONITORING DROUGHT Basic Climatology Oklahoma Climatological Survey DEFINING DROUGHT First off, just what is drought? Define a tornado Define
USGS/EROS Accomplishments and Year 3 Plans. Enhancement of the U.S. Drought Monit Through the Integration of NASA Vegetation Index Imagery
 USGS/EROS Accomplishments and Year 3 Plans Enhancement of the U.S. Drought Monit Through the Integration of NASA Vegetation Index Imagery Jesslyn Brown Team Meeting, Austin, TX, 10/6/09 U.S. Department
NIDIS Weekly Climate, Water and Drought Assessment Summary Upper Colorado River Basin Pilot Project 13 July 2010
 NIDIS Weekly Climate, Water and Drought Assessment Summary Upper Colorado River Basin Pilot Project 13 July 2010 Precipitation and Snowpack Over the past week, precipitation in the Upper Colorado River
-Assessment of current water conditions. - Precipitation Forecast. - Recommendations for Drought Monitor
 2 May 8 th, 2012 -Assessment of current water conditions - Precipitation Forecast - Recommendations for Drought Monitor AHPS Analysis 5/7/12 7-day average discharge compared to historical
What Can Citizen Scientists Tell Us about Drought?
 What Can Citizen Scientists Tell Us about Drought? Using CoCoRaHS to Improve the Monitoring and Reporting of Drought Impacts Amanda Farris, Kirsten Lackstrom Carolinas Integrated Sciences & Assessments
Midwest/Great Plains Climate-Drought Outlook August 17, 2017
 Midwest/Great Plains Climate-Drought Outlook August 17, 2017 Brian Fuchs National Drought Mitigation Center University of Nebraska-Lincoln School of Natural Resources General Information Providing climate
Brian McGurk, P.G. DEQ Office of Water Supply. Contents. Overview of Virginia s Drought Assessment & Response Plan
 Drought Preparedness in Virginia Or, Whatcha Gonna Do When the Well, Creek, River, or Reservoir (Might) Run Dry? Rappahannock-Rapidan Regional Commission Living Lands Workshop November 18, 2014 Brian McGurk,
Oregon Water Conditions Report April 17, 2017
 Oregon Water Conditions Report April 17, 2017 Mountain snowpack continues to maintain significant levels for mid-april. By late March, statewide snowpack had declined to 118 percent of normal after starting
Applications/Users for Improved S2S Forecasts
 Applications/Users for Improved S2S Forecasts Nolan Doesken Colorado Climate Center Colorado State University WSWC Precipitation Forecasting Workshop June 7-9, 2016 San Diego, CA First -- A short background
From a North American to a Global Drought Monitor Richard R. Heim Jr.
 From a North American to a Global Drought Monitor Richard R. Heim Jr. NOAA/NESDIS/ Asheville, North Carolina, USA GEO-DRI Drought Monitoring Workshop Winnipeg, Manitoba, Canada 10-11 May 2010 NADM History
NIDIS Weekly Climate, Water and Drought Assessment Summary. Upper Colorado River Basin February 28, 2012
 NIDIS Weekly Climate, Water and Drought Assessment Summary Upper Colorado River Basin February 28, 2012 PrecipitaGon and Snowpack Fig. 1: February month- to- date precipitagon in inches. Fig. 2: February
COMPARISON OF DROUGHT INDICES AND SC DROUGHT ALERT PHASES
 COMPARISON OF DROUGHT INDICES AND SC DROUGHT ALERT PHASES Ekaterina Altman 1 AUTHORS : 1 Master of Environmental Resource Management Candidate, Environment and Sustainability Program, University of South
Improving Drought Forecasts: The Next Generation of Seasonal Outlooks
 Improving Drought Forecasts: The Next Generation of Seasonal Outlooks Douglas Le Comte, CPC Douglas.lecomte@noaa.gov Outline Review of how the current Drought Outlooks are made Sample experimental products
NATIONAL HYDROPOWER ASSOCIATION MEETING. December 3, 2008 Birmingham Alabama. Roger McNeil Service Hydrologist NWS Birmingham Alabama
 NATIONAL HYDROPOWER ASSOCIATION MEETING December 3, 2008 Birmingham Alabama Roger McNeil Service Hydrologist NWS Birmingham Alabama There are three commonly described types of Drought: Meteorological drought
NIDIS Drought and Water Assessment
 7/23/13 1:57 PM PRECIPITATION The images above use daily precipitation statistics from NWS COOP, CoCoRaHS, and CoAgMet stations. From top to bottom, and left to right: most recent 7-days of accumulated
Missouri River Basin Water Management
 Missouri River Basin Water Management US Army Corps of Engineers Missouri River Navigator s Meeting February 12, 2014 Bill Doan, P.E. Missouri River Basin Water Management US Army Corps of Engineers BUILDING
Using ArcGIS 10 to Estimate the U.S. Population Affected by Drought
 Using ArcGIS 10 to Estimate the U.S. Population Affected by Drought Jeff Nothwehr National Drought Mitigation Center University of Nebraska-Lincoln Overview What is the U.S. Drought Monitor Mapping Process
Chapter 12 Monitoring Drought Using the Standardized Precipitation Index
 University of Nebraska - Lincoln DigitalCommons@University of Nebraska - Lincoln Drought Mitigation Center Faculty Publications Drought -- National Drought Mitigation Center 2000 Chapter 12 Monitoring
Oregon Water Conditions Report May 1, 2017
 Oregon Water Conditions Report May 1, 2017 Mountain snowpack in the higher elevations has continued to increase over the last two weeks. Statewide, most low and mid elevation snow has melted so the basin
Midwest/Great Plains Climate-Drought Outlook September 20, 2018
 Midwest/Great Plains Climate-Drought Outlook September 20, 2018 Brian Fuchs National Drought Mitigation Center University of Nebraska-Lincoln School of Natural Resources September 20, 2018 General Information
Michael B. Ek 1, Youlong Xia 1,2, Jesse Meng 1,2, and Jiarui Dong 1,2
 Michael B. Ek 1, Youlong Xia 1,2, Jesse Meng 1,2, and Jiarui Dong 1,2 1 Land-Hydrology Team Environmental Modeling Center (EMC) National Centers for Environmental Prediction (NCEP) National Weather Service
Upper Missouri River Basin December 2017 Calendar Year Runoff Forecast December 5, 2017
 Upper Missouri River Basin December 2017 Calendar Year Runoff Forecast December 5, 2017 Calendar Year Runoff Forecast Explanation and Purpose of Forecast U.S. Army Corps of Engineers, Northwestern Division
Doug Kluck Regional Climate Services Director Kansas City, MO
 Climate Resilience and Information: Opportunities with Tribes and the National Oceanic and Atmospheric Administration (NOAA) and Partners National Congress of American Indians Annual Convention (October
NIDIS Weekly Climate, Water and Drought Assessment Summary. Upper Colorado River Basin February 12, 2013
 NIDIS Weekly Climate, Water and Drought Assessment Summary Upper Colorado River Basin February 12, 2013 Fig. 1: January precipitagon as a percent of average. Fig. 2: February 1 9 precipitagon in inches.
NOAA Water Resources Monitor and Outlook
 NOAA Water Resources Monitor and Outlook 1 Andrea J. Ray, NOAA/ESRL Physical Sciences Division, Michelle Stokes, NOAA Colorado Basin River Forecast Center, and the WRMO steering team: Robert Hartman -
Enhancement of the U.S. Drought Monitor Through the Integration of NASA Vegetation Index Imagery
 Enhancement of the U.S. Drought Monitor Through the Integration of NASA Vegetation Index Imagery Project and Related Activities at USGS/EROS Jim Verdin, Jesslyn Brown, Yingxin Gu, Gail Schmidt, Troy McVay
NIDIS Weekly Climate, Water and Drought Assessment Summary. Upper Colorado River Basin May 29, 2012
 NIDIS Weekly Climate, Water and Drought Assessment Summary Upper Colorado River Basin May 29, 2012 PrecipitaFon and Snowpack Fig. 1: May 1 19 precipitafon in inches. Fig. 2: May 20 27 precipitafon in inches.
The MRCC and Monitoring Drought in the Midwest
 The and Monitoring Drought in the Midwest Steve Hilberg Director, Illinois State Water Survey Prairie Research Institute, University of Illinois The A partner of a national climate service program that
Webinar and Weekly Summary February 15th, 2011
 Webinar and Weekly Summary February 15th, 2011 -Assessment of current water conditions - Precipitation Forecast - Recommendations for Drought Monitor Upper Colorado Normal Precipitation Upper Colorado
NOAA/WSWC Workshop on Seasonal Forecast Improvements. Kevin Werner, NOAA Jeanine Jones, CA/DWR
 NOAA/WSWC Workshop on Seasonal Forecast Improvements Kevin Werner, NOAA Jeanine Jones, CA/DWR Outline Workshop motivation Goals Agenda 2 Workshop Motivation Opportunity for application of improved seasonal
An introduction to drought indices
 An introduction to drought indices WMO-ETSCI Workshop, Barbados 17 February 2015 Acacia Pepler Australian Bureau of Meteorology "Drought" by Tomas Castelazo - Own work. Licensed under CC BY 3.0 via Commons
NIDIS Weekly Climate, Water and Drought Assessment Summary. Upper Colorado River Basin July 31, 2012
 NIDIS Weekly Climate, Water and Drought Assessment Summary Upper Colorado River Basin July 31, 2012 Fig. 1: July month-to-date precipitation in inches. Fig. 2: SNOTEL WYTD precipitation percentiles (50%
PRECIPITATION. Last Week Precipitation:
 2/24/2015 NIDIS Drought and Water Assessment PRECIPITATION The images above use daily precipitation statistics from NWS COOP, CoCoRaHS, and CoAgMet stations. From top to bottom, and left to right: most
The Recent Long Island Drought
 The Recent Long Island Drought David J. Tonjes Department of Technology and Society Stony Brook University david.tonjes@stonybrook.edu Abstract Drought is a qualitatively defined and determined phenomenon.
-Assessment of current water conditions. - Precipitation Forecast. - Recommendations for Drought Monitor
 2 June 12, 2012 -Assessment of current water conditions - Precipitation Forecast - Recommendations for Drought Monitor 7-day average discharge compared to historical discharge for the day
March 1, 2003 Western Snowpack Conditions and Water Supply Forecasts
 Natural Resources Conservation Service National Water and Climate Center 101 SW Main Street, Suite 1600 Portland, OR 97204-3224 Date: March 17, 2003 Subject: March 1, 2003 Western Snowpack Conditions and
NIDIS Remote Sensing Workshop: Showcase of Products & Technologies
 Feature Article From Intermountain West Climate Summary, April 2008 NIDIS Remote Sensing Workshop: Showcase of Products & Technologies By Christina Alvord of WWA Three knowledge assessment workshops are
Upper Missouri River Basin February 2018 Calendar Year Runoff Forecast February 6, 2018
 Upper Missouri River Basin February 2018 Calendar Year Runoff Forecast February 6, 2018 Calendar Year Runoff Forecast Explanation and Purpose of Forecast U.S. Army Corps of Engineers, Northwestern Division
The Kentucky Mesonet: Entering a New Phase
 The Kentucky Mesonet: Entering a New Phase Stuart A. Foster State Climatologist Kentucky Climate Center Western Kentucky University KCJEA Winter Conference Lexington, Kentucky February 9, 2017 Kentucky
4) At the end of this presentation we have an operator that will organize the Q & A s.
 At the end of this presentation we have an operator that will organize the Q & A s.") Hello and welcome to the next in a series of Missouri Basin specific climate outlook Webinars 2011-2012. My name is Dennis Todey and I am the State Climatologist for the State of South Dakota. We are taking
Hello and welcome to the next in a series of Missouri Basin specific climate outlook Webinars 2011-2012. My name is Dennis Todey and I am the State Climatologist for the State of South Dakota. We are taking
Improving Understanding of Drought Impacts through Citizen Science
 Improving Understanding of Drought Impacts through Citizen Science Amanda Brennan, Janae Davis, Kirstin Dow, Kirsten Lackstrom, Sumi Selvaraj North Carolina Water Resources Research Institute Annual Meeting
National Drought Summary August 14, 2018
 National Drought Summary August 14, 2018 The discussion in the Looking Ahead section is a description of what the official national guidance from the National Weather Service (NWS) National Centers for
Missouri River Basin Water Management Monthly Update
 Missouri River Basin Water Management Monthly Update Participating Agencies 255 255 255 237 237 237 0 0 0 217 217 217 163 163 163 200 200 200 131 132 122 239 65 53 80 119 27 National Oceanic and Atmospheric