Taking the garbage out of energy modeling through calibration
|
|
|
- Harvey Francis
- 5 years ago
- Views:
Transcription


1 Taking the garbage out of energy modeling through calibration Presented to the Madison Chapter of ASHRAE February 8, 2016 Presented by Benjamin Skelton P.E. BEMP President, Cyclone Energy Group
2 Acknowledgments Jason Robbin Walgreen Co Nathan Kegel IES Irina Susorova Cyclone Energy Group Igor Seryapin Cyclone Energy Group Joanne Choi Cyclone Energy Group

3 Agenda Do You Know Your Energy Modeling Basics? Why Do We Need Calibrated Energy Models? How Do You Calibrate A Model Without Losing Years of Your Life? A Real World Example Questions

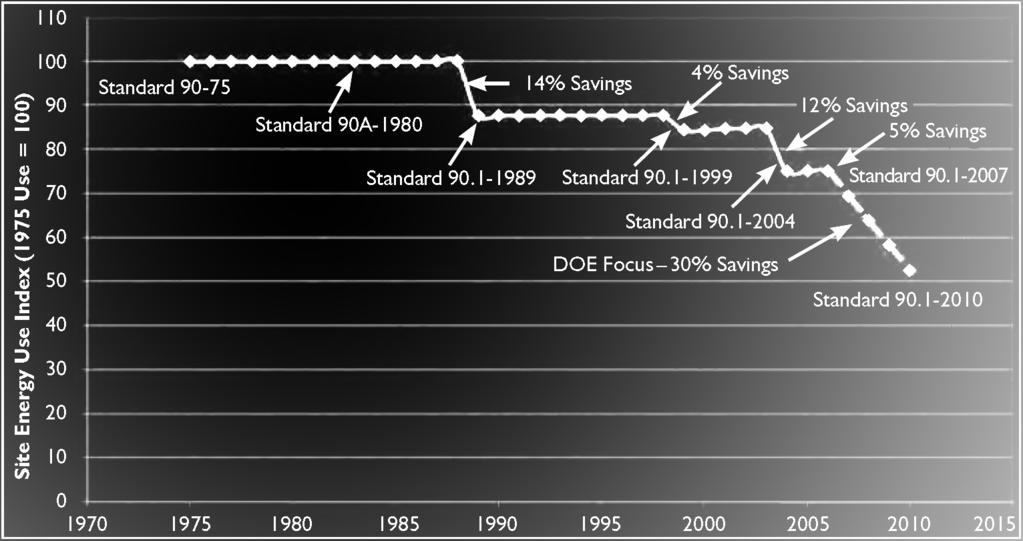
4 History of 90.1 Performance


5 How accurate are energy models? Source: NBI Energy Performance of LEED for New Construction

6 What is an energy model? A model is a device or structure that helps us: Understand the world around us, Understand a piece of the world around us, A simplified representation of our surroundings in order that we may pursue understanding
7 What is an energy model? Can be simple or complex Can be time consuming Both an art and a science Only as good as the person creating the model Not the same as a load model!

8 What is an energy model?

9 How is it different than a load model?


10 How is it different than a load model? Scheduled Pattern of Use Occupancy Lights Equipment
11 What is an energy model? Input variables Controllable variables (e.g. internal gains) Uncontrollable variables (e.g. weather) System structure & parameters/properties Physical description (e.g. thermal properties) Output Response variables *Fundamentals Handbook 2013 Chapter 19
12 What is an energy model? Two types of energy models: Data-driven Modeling (Existing Building) Forward Modeling (Design) *Fundamentals Handbook 2013 Chapter 19

13 What is a Data-Driven Model? Input & output variables are known and measured, the objective is to create a mathematical description of the system and estimate parameters. Steady State System Modeling Methods: BIN Method Degree Day Regression *Fundamentals Handbook 2013 Chapter 19
14 Degree Day Analysis R 2 = 1.00 Perfect correlation (idealistic) Recommendations Performance Measurement Protocols for Commercial Buildings (PMP) R 2 > 0.80 International Performance Measurement & Verification Protocol R 2 > 0.75
15 Regression
16 BIN Calculation

17 What is a Forward Model? Predict the output variables of a model based on known parameters and specified input variables. *Fundamentals Handbook 2013 Chapter 19

18 Computer Simulation Models

19 Albert Einstein Everything should be made as simple as possible, but not simpler

20 What do you want to accomplish? Verify a design model? Identify potential?

21 How to create a calibrated model? An existing building, no previous model created A newly built building, with design energy model created
22 How to create a calibrated model? Input variables Controllable variables (e.g. internal gains) Uncontrollable variables (e.g. weather) System structure & parameters/properties Physical description (e.g. thermal properties) Output Response variables *Fundamentals Handbook 2013 Chapter 19
23 How to model an operating building? Building Assessment Data collection Nameplates Schedules of operation Operating setpoints Spot Measurements Amp draw from constant speed loads Air / water flow measurements Building characteristics (e.g. thermal performance) Trend data Variable speed equipment trending (>10 min intervals) Weather!
24 How to model an operating building Unknown variables Infiltration Occupancy (can be measured)

25 Weather (8,760) Dry-bulb temperature Wet-bulb temperature External dew-point temperature Wind speed Wind direction Direct radiation Diffuse radiation Global radiation Solar altitude Cloud cover Atmospheric pressure External relative humidity External moisture content
26 What weather file should you use? TMY (Typical Meteorological Year) TMY2 Most Common TMY3 IWEC CWEC TRY DSY TMY(7) TMY(15) AMY TMY2 ( ) TMY3 ( ) TMY(15) TMY(7)
27 TMY & Shifting Weather Data


28 Understanding TMY Increasing average/median temperature Increasing average/median enthalpy No year is typical
29 Actual Meteorological Year: 2012 vs AMY 2012 AMY
30 How accurate are energy models? ASHRAE Guideline ASHRAE Standard International Performance Measurement & Verification Protocol (IPMPV) Normalized Mean Bias Error (NMBE) 5% with Monthly Data 10% with Hourly Data Coefficient of Variation of the Root Mean Square Error (CVRMSE) 15% with Monthly Data 30% with Hourly Data
31 Calibrated model results Annual electricity use (MBtu) Annual gas use (MBtu) 3,500 3,000 2,500 2,000 1,500 1, ,500 3,000 2,500 2,000 1,500 1, Annual electricity use Jan Feb Mar Apr May Jun Jul Aug Sep Oct Nov Dec Utility bills Modeled Annual gas use Jan Feb Mar Apr May Jun Jul Aug Sep Oct Nov Dec Utility bills Modeled
32 Model assumptions Known: Building context and surrounding buildings Building geometry Envelope materials Room temperature settings HVAC system components and capacities Spot measurements Unknown: Individual floor tenants layouts Energy usage profiles (occupancy, lighting, equipment schedules) Weather data and microclimate HVAC system settings and performance Air infiltration rates
33 Importance of selecting right weather data Chicago 2011 file (1) VS. Chicago TMY3 file (2) Annual gas use (MBtu) Annual electricity use (MBtu) 3,000 2,500 2,000 1,500 1, ,000 2,500 2,000 1,500 1, Annual electricity use Jan Feb Mar Apr May Jun Jul Aug Sep Oct Nov Dec Weather file 1 Weather file 2 Annual gas use - Jan Feb Mar Apr May Jun Jul Aug Sep Oct Nov Dec Weather file 1 Weather file 2


34 Daily energy usage profiles Occupancy Lights Equipment Elevators 0:00 2:00 4:00 6:00 8:00 10:00 12:00 14:00 16:00 18:00 20:00 22:00 0: :00 2:00 4:00 6:00 8:00 10:00 12:00 14:00 16:00 18:00 20:00 22:00 0: :00 2:00 4:00 6:00 8:00 10:00 12:00 14:00 16:00 18:00 20:00 22:00 0:00 Actual daily energy use profile (from ComEd Energy Insights) Power consumption (kw) :00 2:00 4:00 6:00 8:00 10:00 12:00 14:00 16:00 18:00 20:00 22:00 0:00 Average weekday Average weekend

 2 chillers (500 tons each) 1")
35 HVAC systems 7 HVAC systems with air handling units: Serving south perimeter zones Serving east, west, & north perimeter zones Serving central core zones 1 unit serving the main lobby 1 unit serving retail zones (no information available) 1,200 fan coil units 2 steam boilers (10,000 MBH each) 2 chillers (500 tons each) 1 cooling tower
36 Energy savings results Existing Window 1 Window 2 Window 3 Energy use Electricity (kbtu/year) 15,401,917 15,157,815 15,135,081 15,142,421 Gas (kbtu/year) 11,740,434 7,877,407 7,397,939 7,537,130 Total (kbtu/year) 27,142,351 23,035,221 22,533,019 22,679,551 Electricity savings (%) 2% 2% 2% Gas savings (%) 33% 37% 36% Total savings (%) 15% 17% 16% Energy use intensity (kbtu/ft 2 ) Energy cost Electricity ($/year) 1 478, , , ,851 Gas ($/year) 2 79,350 53,241 50,001 50,941 Total ($/year) 558, , , ,793 Total savings ($) 33,699 37,647 36,478 Total savings (%) 6% 7% 7% Total savings ($/ft 2 ) N. Michigan blended electricity tariff: 0.11 $/kw-hr as of 2011


37 Image Credit: Walgreens, Co.
 EPA Target Finder International Energy Conservation Code 2012 IESNA")
38 Resources Reference Materials: ASHRAE Handbook Fundamentals 2013 Chapter 19 ASHRAE Guideline ASHRAE Standard ASHRAE Standard / 2010 ASHRAE Standard / 2010 / 2013 ASHRAE Standard ASHRAE Standard Energy Information Administration (Average Utility Data) EPA Target Finder International Energy Conservation Code 2012 IESNA Lighting Handbook, 9 th Edition IPMPV Building Energy Modeling An ASHRAE Certification Study Guide Software: DOE Approved Software equest (Free) Trane Trace 700 (30-day Trial) IES<VE>(30-day Trial) Weather Data: ENERGY PLUS Weather Files Degree Days.net NREL (TMY2 / TMY3) Weather Analytics
PROPOSAL OF SEVEN-DAY DESIGN WEATHER DATA FOR HVAC PEAK LOAD CALCULATION
 Ninth International IBPSA Conference Montréal, Canada August 5-8, PROPOSAL OF SEVEN-DAY DESIGN WEATHER DATA FOR HVAC PEAK LOAD CALCULATION Hisaya ISHINO Faculty of Urban Environmental Sciences, Metropolitan
GAMINGRE 8/1/ of 7
 FYE 09/30/92 JULY 92 0.00 254,550.00 0.00 0 0 0 0 0 0 0 0 0 254,550.00 0.00 0.00 0.00 0.00 254,550.00 AUG 10,616,710.31 5,299.95 845,656.83 84,565.68 61,084.86 23,480.82 339,734.73 135,893.89 67,946.95
Time Series Model of Photovoltaic Generation for Distribution Planning Analysis. Jorge Valenzuela
 Time Series Model of Photovoltaic Generation for Distribution Planning Analysis Jorge Valenzuela Overview Introduction: The solar problem and our limitations Modeling What information do we have? Solar
Investigations on effect of the orientation on thermal comfort in terraced housing in Malaysia
 Investigations on effect of the orientation on thermal comfort in terraced housing in Malaysia Dr Mohamed Ali Abdul Hussain Al-Obaidi 1 and Prof. Peter Woods 2 1 Senior lecturer, Center for Equatorial
announcements 4/17/08
 Heat Transfer and the Building Envelope ARCH 331/431 Spring 2008 Lecture 6 announcements 4/17/08 A3: Envelope Heat Transfer Assignment: Available later today (course website) References: Available by this
A FACILITY MANAGER S INTRODUCTION TO WEATHER CORRECTION FOR UTILITY BILL TRACKING. John Avina, Director Abraxas Energy Consulting
 A FACILITY MANAGER S INTRODUCTION TO WEATHER CORRECTION FOR UTILITY BILL TRACKING John Avina, Director Abraxas Energy Consulting ABSTRACT Utility bill tracking is at the heart of an effective energy management
Experimental measurements and analysis of the indoor conditions in Italian museum storerooms: a study case
 Experimental measurements and analysis of the indoor conditions in Italian museum storerooms: a study case F. Cappelletti, P. Romagnoni and A. Birra University Iuav of Venezia, Italy Aims and methods Analysis
UWM Field Station meteorological data
 University of Wisconsin Milwaukee UWM Digital Commons Field Station Bulletins UWM Field Station Spring 992 UWM Field Station meteorological data James W. Popp University of Wisconsin - Milwaukee Follow
C L I M A T E R E S P O N S I V E U R B A N D E S I G N F O R G R E E K P U B L I C S P A C E
 C L I M A T E R E S P O N S I V E U R B A N D E S I G N F O R G R E E K P U B L I C S P A C E Prepared by: Ioannis Karakounos With the guidance of: Raphael Lafargue Kristina Von Bomhard Concept Make public
Site Description: Tower Site
 Resource Summary for Fort Collins Site Final Report Colorado Anemometer Loan Program Monitoring Period: /0/00 11/03/007 Report Date: January 1, 00 Site Description: The site is located adjacent to the
Increasing Transmission Capacities with Dynamic Monitoring Systems
 INL/MIS-11-22167 Increasing Transmission Capacities with Dynamic Monitoring Systems Kurt S. Myers Jake P. Gentle www.inl.gov March 22, 2012 Concurrent Cooling Background Project supported with funding
NSP Electric - Minnesota Annual Report Peak Demand and Annual Electric Consumption Forecast
 Page 1 of 5 7610.0320 - Forecast Methodology NSP Electric - Minnesota Annual Report Peak Demand and Annual Electric Consumption Forecast OVERALL METHODOLOGICAL FRAMEWORK Xcel Energy prepared its forecast
Institut national des sciences appliquées de Strasbourg GENIE CLIMATIQUE ET ENERGETIQUE APPENDICES
 Institut national des sciences appliquées de Strasbourg GENIE CLIMATIQUE ET ENERGETIQUE APPENDICES DEVELOPMENT OF A TOOL, BASED ON THE THERMAL DYNAMIC SIMULATION SOFTWARE TRNSYS, WHICH RUNS PARAMETRIC
Lessons Learned From Labs 21. Retrofitting of Chemistry Laboratories University of Toronto
 Lessons Learned From Labs 21 Retrofitting of Chemistry Laboratories University of Toronto Presented by: Mike Dymarski, PhD Technical and Administrative Manager Department of Chemistry University of Toronto.
SYSTEM BRIEF DAILY SUMMARY
 SYSTEM BRIEF DAILY SUMMARY * ANNUAL MaxTemp NEL (MWH) Hr Ending Hr Ending LOAD (PEAK HOURS 7:00 AM TO 10:00 PM MON-SAT) ENERGY (MWH) INCREMENTAL COST DAY DATE Civic TOTAL MAXIMUM @Max MINIMUM @Min FACTOR
Site Description: Tower Site
 Resource Summary for Elizabeth Site Final Report Colorado Anemometer Loan Program Monitoring Period: 7/3/06 /26/07 Report Date: January, 0 Site Description: The site is.6 miles northeast of the town of
SYSTEM BRIEF DAILY SUMMARY
 SYSTEM BRIEF DAILY SUMMARY * ANNUAL MaxTemp NEL (MWH) Hr Ending Hr Ending LOAD (PEAK HOURS 7:00 AM TO 10:00 PM MON-SAT) ENERGY (MWH) INCREMENTAL COST DAY DATE Civic TOTAL MAXIMUM @Max MINIMUM @Min FACTOR
Validation of IDA Indoor Climate and Energy
 Technical report: Validation of IDA Indoor Climate and Energy 4.0 build 4 with respect to ANSI/ASHRAE Standard 140-2004 April 2010 Equa Simulation AB Råsundavägen 100 169 57 Solna Sweden Contents 1 Introduction
Enerpool v Swimming Pool Simulation Simulation File: C:\ENERPOOL\SANDA.EPL Run on: Fri Feb 07 19:27:
 Enerpool v. 2.1.6 - Swimming Pool Simulation Simulation File: C:\ENERPOOL\SANDA.EPL Run on: Fri Feb 07 19:27:43 2003 POOL CONFIGURATION: - Solar Collector - No Heat Exchanger - Auxiliary Heater - Weather
APPENDIX G-7 METEROLOGICAL DATA
 APPENDIX G-7 METEROLOGICAL DATA METEOROLOGICAL DATA FOR AIR AND NOISE SAMPLING DAYS AT MMR Monthly Normals and Extremes for Honolulu International Airport Table G7-1 MMR RAWS Station Hourly Data Tables
Colorado PUC E-Filings System
 Attachment A.1 RES Summary Colorado PUC E-Filings System Total RECs Acquired Non-Distributed Generation Distributed Generation Retail Distributed Generation Carry Forward Previous Carry Forward Total Carry
In Centre, Online Classroom Live and Online Classroom Programme Prices
 In Centre, and Online Classroom Programme Prices In Centre Online Classroom Foundation Certificate Bookkeeping Transactions 430 325 300 Bookkeeping Controls 320 245 225 Elements of Costing 320 245 225
Colorado PUC E-Filings System
 Colorado PUC E-Filings System Attachment A.1 RES Summary Total Acquired Non-Distributed Generation Distributed Generation Retail Distributed Generation Carry Forward Previous Carry Forward Total Carry
Calendarization & Normalization. Steve Heinz, PE, CEM, CMVP Founder & CEO EnergyCAP, Inc.
 Calendarization & Normalization Steve Heinz, PE, CEM, CMVP Founder & CEO EnergyCAP, Inc. Calendarization EnergyCAP Reporting Month Each utility bill is assigned to a reporting month when entered, called
The Effects of Weather on Urban Trail Use: A National Study
 The Effects of Weather on Urban Trail Use: A National Study Alireza Ermagun, Tracy Haden-Loh, Greg Lindsey May 3, 2016 Rails to Trails Conservancy Trail Modeling and Assessment Platform Objectives Monitor
CAVE CLIMATE COMPARISON ACTIVITY BETWEEN THE SURFACE AND THE CAVERN
 CAVE CLIMATE COMPARISON ACTIVITY BETWEEN THE SURFACE AND THE CAVERN Created by Ray Bowers For the Virtual Center for the Environment (VCE) A part of the Institute of Natural Resources Analysis and Management
Yucca Mountain climate: Past, present, and future
 Publications (YM) Yucca Mountain 2007 Yucca Mountain climate: Past, present, and future Saxon E. Sharpe Desert Research Institute, saxon.sharpe@dri.edu Follow this and additional works at: https://digitalscholarship.unlv.edu/yucca_mtn_pubs
Chapter 3. Regression-Based Models for Developing Commercial Demand Characteristics Investigation
 Chapter Regression-Based Models for Developing Commercial Demand Characteristics Investigation. Introduction Commercial area is another important area in terms of consume high electric energy in Japan.
Average Monthly Solar Radiations At Various Places Of North East India
 Average Monthly Solar Radiations At Various Places Of North East India Monmoyuri Baruah Assistant Professor,Department of Physics, Assam Don Bosco University, Assam, India Lavita Sarma Assistant Professor,Department
CAISO Participating Intermittent Resource Program for Wind Generation
 CAISO Participating Intermittent Resource Program for Wind Generation Jim Blatchford CAISO Account Manager Agenda CAISO Market Concepts Wind Availability in California How State Supports Intermittent Resources
Jackson County 2018 Weather Data 67 Years of Weather Data Recorded at the UF/IFAS Marianna North Florida Research and Education Center
 Jackson County 2018 Weather Data 67 Years of Weather Data Recorded at the UF/IFAS Marianna North Florida Research and Education Center Doug Mayo Jackson County Extension Director 1952-2008 Rainfall Data
Operation and Maintenance of Networking of CAAQM stations at Bangalore and Chennai.
 2014-15 CENTRAL POLLUTION NTROL BOARD ZONAL OFFICE (SOUTH), BENGALURU 560079 Project II-.Scientific & Technical Activities and R & D Operation and Maintenance of Networking of CAAQM stations at Bangalore
2003 Moisture Outlook
 2003 Moisture Outlook Nolan Doesken and Roger Pielke, Sr. Colorado Climate Center Prepared by Tara Green and Odie Bliss http://climate.atmos.colostate.edu Through 1999 Through 1999 Fort Collins Total Water
2016 Meteorology Summary
 2016 Meteorology Summary New Jersey Department of Environmental Protection AIR POLLUTION AND METEOROLOGY Meteorology plays an important role in the distribution of pollution throughout the troposphere,
Global Climates. Name Date
 Global Climates Name Date No investigation of the atmosphere is complete without examining the global distribution of the major atmospheric elements and the impact that humans have on weather and climate.
Jackson County 2013 Weather Data
 Jackson County 2013 Weather Data 61 Years of Weather Data Recorded at the UF/IFAS Marianna North Florida Research and Education Center Doug Mayo Jackson County Extension Director 1952-2008 Rainfall Data
Colorado s 2003 Moisture Outlook
 Colorado s 2003 Moisture Outlook Nolan Doesken and Roger Pielke, Sr. Colorado Climate Center Prepared by Tara Green and Odie Bliss http://climate.atmos.colostate.edu How we got into this drought! Fort
The Effect of Cloudy Days on the Annual Typical Meteorological Solar Radiation for Armidale NSW, Australia
 IOSR Journal of Engineering (IOSRJEN) ISSN (e): 2250-3021, ISSN (p): 2278-8719 Vol. 04, Issue 08 (August. 2014), VX PP 14-20 www.iosrjen.org The Effect of Cloudy Days on the Annual Typical Meteorological
SOLAR POWER FORECASTING BASED ON NUMERICAL WEATHER PREDICTION, SATELLITE DATA, AND POWER MEASUREMENTS
 BASED ON NUMERICAL WEATHER PREDICTION, SATELLITE DATA, AND POWER MEASUREMENTS Detlev Heinemann, Elke Lorenz Energy Meteorology Group, Institute of Physics, Oldenburg University Workshop on Forecasting,
Wind Resource Data Summary Cotal Area, Guam Data Summary and Transmittal for December 2011
 Wind Resource Data Summary Cotal Area, Guam Data Summary and Transmittal for December 2011 Prepared for: GHD Inc. 194 Hernan Cortez Avenue 2nd Floor, Ste. 203 Hagatna, Guam 96910 January 2012 DNV Renewables
Time Series Analysis
 Time Series Analysis A time series is a sequence of observations made: 1) over a continuous time interval, 2) of successive measurements across that interval, 3) using equal spacing between consecutive
NEGST. New generation of solar thermal systems. Advanced applications ENEA. Comparison of solar cooling technologies. Vincenzo Sabatelli
 NEGST New generation of solar thermal systems Advanced applications Comparison of solar cooling technologies Vincenzo Sabatelli ENEA vincenzo.sabatelli@trisaia.enea.it NEGST Workshop - Freiburg - June
Climatography of the United States No
 Climate Division: CA 5 NWS Call Sign: Elevation: 6 Feet Lat: 37 Month (1) Min (2) Month(1) Extremes Lowest (2) Temperature ( F) Lowest Month(1) Degree s (1) Base Temp 65 Heating Cooling 1 Number of s (3)
Climatography of the United States No
 Climate Division: CA 4 NWS Call Sign: Elevation: 2 Feet Lat: 37 Month (1) Min (2) Month(1) Extremes Lowest (2) Temperature ( F) Lowest Month(1) Degree s (1) Base Temp 65 Heating Cooling 1 Number of s (3)
Climatography of the United States No
 Climate Division: CA 4 NWS Call Sign: Elevation: 13 Feet Lat: 36 Month (1) Min (2) Month(1) Extremes Lowest (2) Temperature ( F) Lowest Month(1) Degree s (1) Base Temp 65 Heating Cooling 1 Number of s
Climatography of the United States No
 Climate Division: CA 5 NWS Call Sign: Elevation: 1,14 Feet Lat: 36 Month (1) Min (2) Month(1) Extremes Lowest (2) Temperature ( F) Lowest Month(1) Degree s (1) Base Temp 65 Heating Cooling 1 Number of
Drought in Southeast Colorado
 Drought in Southeast Colorado Nolan Doesken and Roger Pielke, Sr. Colorado Climate Center Prepared by Tara Green and Odie Bliss http://climate.atmos.colostate.edu 1 Historical Perspective on Drought Tourism
2000 LOCAL CLIMATOLOGICAL DATA Annual Summary with Comparative Data
 - - Freezing.............. JAN FEB MAR APR MAY JUN JUL AUG EP OC NOV DEC EMPERAURE PRECIPIAION PREURE Fahrenheit Inches Inches of Hg LOCAL CLIMAOLOGICAL DAA Annual ummary with Comparative Data aunton W
Mountain View Community Shuttle Monthly Operations Report
 Mountain View Community Shuttle Monthly Operations Report December 6, 2018 Contents Passengers per Day, Table...- 3 - Passengers per Day, Chart...- 3 - Ridership Year-To-Date...- 4 - Average Daily Ridership
University of Florida Department of Geography GEO 3280 Assignment 3
 G E O 3 2 8 A s s i g n m e n t # 3 Page 1 University of Florida Department of Geography GEO 328 Assignment 3 Modeling Precipitation and Elevation Solar Radiation Precipitation Evapo- Transpiration Vegetation
Generation of a reduced temperature year as an input data for building climatization purposes: an application for Palermo (Italy)
") Generation of a reduced temperature year as an input data for building climatization purposes: an application for Palermo (Italy) S. Barbaro, S. Costanzo & C. Giaconia Department of Energy and Environment
Generation of a reduced temperature year as an input data for building climatization purposes: an application for Palermo (Italy) S. Barbaro, S. Costanzo & C. Giaconia Department of Energy and Environment
Climatography of the United States No
 Climate Division: CA 6 NWS Call Sign: LAX Elevation: 1 Feet Lat: 33 Month (1) Min (2) Month(1) Extremes Lowest (2) Temperature ( F) Lowest Month(1) Degree s (1) Base Temp 65 Heating Cooling 1 Number of
Climatography of the United States No
 Climate Division: CA 6 NWS Call Sign: TOA Elevation: 11 Feet Lat: 33 2W Temperature ( F) Month (1) Min (2) Month(1) Extremes Lowest (2) Lowest Month(1) Degree s (1) Base Temp 65 Heating Cooling 1 Number
Multivariate Regression Model Results
 Updated: August, 0 Page of Multivariate Regression Model Results 4 5 6 7 8 This exhibit provides the results of the load model forecast discussed in Schedule. Included is the forecast of short term system
Average 175, , , , , , ,046 YTD Total 1,098,649 1,509,593 1,868,795 1,418, ,169 1,977,225 2,065,321
 AGRICULTURE 01-Agriculture JUL 2,944-4,465 1,783-146 102 AUG 2,753 6,497 5,321 1,233 1,678 744 1,469 SEP - 4,274 4,183 1,596 - - 238 OCT 2,694 - - 1,032 340-276 NOV 1,979-5,822 637 3,221 1,923 1,532 DEC
Average 175, , , , , , ,940 YTD Total 944,460 1,284,944 1,635,177 1,183, ,954 1,744,134 1,565,640
 AGRICULTURE 01-Agriculture JUL 2,944-4,465 1,783-146 102 AUG 2,753 6,497 5,321 1,233 1,678 744 1,469 SEP - 4,274 4,183 1,596 - - 238 OCT 2,694 - - 1,032 340-276 NOV 1,979-5,822 637 3,221 1,923 1,532 DEC
Draft for comment (613) Public Works Canada Design & Construction Technology DRAn' 1 July, Computer-Aided Design Centre (CAD) TSS COPY
 Public Works Canada Design & Construction Technology DRAn' 1 July, Computer-Aided Design Centre (CAD) TSS COPY") ~------------ 6. (c) Public Works Canada Design & Construction Technology DRAn' 1 July, 1980 Draft for comment Computer-Aided Design Centre (CAD) TSS COPY DO NOT REMOVE User enquiries and requests for
~------------ 6. (c) Public Works Canada Design & Construction Technology DRAn' 1 July, 1980 Draft for comment Computer-Aided Design Centre (CAD) TSS COPY DO NOT REMOVE User enquiries and requests for
FORECAST-BASED OPERATIONS AT FOLSOM DAM AND LAKE
 FORECAST-BASED OPERATIONS AT FOLSOM DAM AND LAKE 255 237 237 237 217 217 217 200 200 200 0 163 131 Bridging the Gap163Conference 255 0 132 255 0 163 122 The Dana on Mission Bay San Diego, CA January 28,
peak half-hourly New South Wales
 Forecasting long-term peak half-hourly electricity demand for New South Wales Dr Shu Fan B.S., M.S., Ph.D. Professor Rob J Hyndman B.Sc. (Hons), Ph.D., A.Stat. Business & Economic Forecasting Unit Report
Climatography of the United States No
 Month (1) Min (2) Month(1) Extremes Lowest (2) Temperature ( F) Lowest Month(1) Degree s (1) Base Temp 65 Heating Cooling 100 Number of s (3) Jan 63.9 39.3 51.6 86 1976 16 56.6 1986 20 1976 2 47.5 1973
Climatography of the United States No
 Temperature ( F) Month (1) Min (2) Month(1) Extremes Lowest (2) Lowest Month(1) Degree s (1) Base Temp 65 Heating Cooling 100 Number of s (3) Jan 32.8 21.7 27.3 62 1918 1 35.8 1983-24 1950 29 10.5 1979
ARCHITECTURE IN THE DAYLIGHT
 ARCHITECTURE IN THE DAYLIGHT Site Location MANUS LEUNG HARVARD GSD FALL 2015 The house is located in Jl. Intern Corn Kebun Jeruk Blok U3 No.18, Kembangan District of Jakarta 11640 Indonesia. 01 OBJECTIVES
List of Exposure and Dose Metrics
 List of Exposure and Dose Metrics First approved by the TOAR Steering Committee on July 31, 2015, and revised on June 27, 2016 to add two additional metrics. Following is the list of exposure and dose
2003 Water Year Wrap-Up and Look Ahead
 2003 Water Year Wrap-Up and Look Ahead Nolan Doesken Colorado Climate Center Prepared by Odie Bliss http://ccc.atmos.colostate.edu Colorado Average Annual Precipitation Map South Platte Average Precipitation
Flow Monitoring in the Collection System September 11, 2014
 Flow Monitoring in the Collection System September 11, 2014 FISHBECK, THOMPSON, CARR, & HUBER INC. Lori Lloyd, PE, LEED AP BD+C Definitions Why Flow Monitor? Flow Monitoring Applications Site Selection
Climatography of the United States No
 Climate Division: AK 5 NWS Call Sign: ANC Month (1) Min (2) Month(1) Extremes Lowest (2) Temperature ( F) Lowest Month(1) Degree s (1) Base Temp 65 Heating Cooling 90 Number of s (3) Jan 22.2 9.3 15.8
AREP GAW. AQ Forecasting
 AQ Forecasting What Are We Forecasting Averaging Time (3 of 3) PM10 Daily Maximum Values, 2001 Santiago, Chile (MACAM stations) 300 Level 2 Pre-Emergency Level 1 Alert 200 Air Quality Standard 150 100
STATISTICAL FORECASTING and SEASONALITY (M. E. Ippolito; )
") STATISTICAL FORECASTING and SEASONALITY (M. E. Ippolito; 10-6-13) PART I OVERVIEW The following discussion expands upon exponential smoothing and seasonality as presented in Chapter 11, Forecasting, in
STATISTICAL FORECASTING and SEASONALITY (M. E. Ippolito; 10-6-13) PART I OVERVIEW The following discussion expands upon exponential smoothing and seasonality as presented in Chapter 11, Forecasting, in
INVOICE EXPLAINER GAS
 INVOICE EXPLAINER GAS A 999/9999 XXXXXXXXXXXXXXXXXXXXXXXXXXXXXXXXXXXXXXXXXXXXXXXXXXXXXXXXXXXXXX COMPANY SAMPLE PTY LTD 99 SAMPLE ST SAMPLEVILLE VIC 3080 Important Information B GAS C E Your Gas Invoice
Climatography of the United States No
 Climate Division: CA 4 NWS Call Sign: Month (1) Min (2) Month(1) Extremes Lowest (2) Temperature ( F) Lowest Month(1) Degree s (1) Base Temp 65 Heating Cooling 100 Number of s (3) Jan 55.6 39.3 47.5 77
Climatography of the United States No
 Climate Division: CA 5 NWS Call Sign: Month (1) Min (2) Month(1) Extremes Lowest (2) Temperature ( F) Lowest Month(1) Degree s (1) Base Temp 65 Heating Cooling 100 Number of s (3) Jan 56.6 36.5 46.6 81
Climatography of the United States No
 Climate Division: CA 1 NWS Call Sign: Month (1) Min (2) Month(1) Extremes Lowest (2) Temperature ( F) Lowest Month(1) Degree s (1) Base Temp 65 Heating Cooling 100 Number of s (3) Jan 57.9 38.9 48.4 85
Climatography of the United States No
 Climate Division: CA 5 NWS Call Sign: Month (1) Min (2) Month(1) Extremes Lowest (2) Temperature ( F) Lowest Month(1) Degree s (1) Base Temp 65 Heating Cooling 100 Number of s (3) Jan 44.8 25.4 35.1 72
Climatography of the United States No
 Climate Division: CA 4 NWS Call Sign: Month (1) Min (2) Month(1) Extremes Lowest (2) Temperature ( F) Lowest Month(1) Degree s (1) Base Temp 65 Heating Cooling 100 Number of s (3) Jan 49.4 37.5 43.5 73
Climatography of the United States No
 Climate Division: CA 6 NWS Call Sign: Month (1) Min (2) Month(1) Extremes Lowest (2) Temperature ( F) Lowest Month(1) Degree s (1) Base Temp 65 Heating Cooling 100 Number of s (3) Jan 69.4 46.6 58.0 92
Annual Average NYMEX Strip Comparison 7/03/2017
 Annual Average NYMEX Strip Comparison 7/03/2017 To Year to Year Oil Price Deck ($/bbl) change Year change 7/3/2017 6/1/2017 5/1/2017 4/3/2017 3/1/2017 2/1/2017-2.7% 2017 Average -10.4% 47.52 48.84 49.58
Climatography of the United States No
 Climate Division: CA 4 NWS Call Sign: Month (1) Min (2) Month(1) Extremes Lowest (2) Temperature ( F) Lowest Month(1) Degree s (1) Base Temp 65 Heating Cooling 1 Number of s (3) Jan 58.5 38.8 48.7 79 1962
Climatography of the United States No
 Climate Division: CA 6 NWS Call Sign: Month (1) Min (2) Month(1) Extremes Lowest (2) Temperature ( F) Lowest Month(1) Degree s (1) Base Temp 65 Heating Cooling 1 Number of s (3) Jan 67.5 42. 54.8 92 1971
Climatography of the United States No
 Climate Division: CA 1 NWS Call Sign: Month (1) Min (2) Month(1) Extremes Lowest (2) Temperature ( F) Lowest Month(1) Degree s (1) Base Temp 65 Heating Cooling 1 Number of s (3) Jan 57.8 39.5 48.7 85 1962
Climatography of the United States No
 No. 2 1971-2 Asheville, North Carolina 2881 COOP ID: 46175 Climate Division: CA 6 NWS Call Sign: 3L3 Elevation: 1 Feet Lat: 33 Month (1) Min (2) Month(1) Extremes Lowest (2) Temperature ( F) Lowest Month(1)
Climatography of the United States No
 No. 2 1971-2 Asheville, North Carolina 2881 COOP ID: 42713 Climate Division: CA 7 NWS Call Sign: Elevation: -3 Feet Lat: 32 Month (1) Min (2) Month(1) Extremes Lowest (2) Temperature ( F) Lowest Month(1)
Jackson County 2014 Weather Data
 Jackson County 2014 Weather Data 62 Years of Weather Data Recorded at the UF/IFAS Marianna North Florida Research and Education Center Doug Mayo Jackson County Extension Director 1952-2008 Rainfall Data
Interannual variation of MODIS NDVI in Lake Taihu and its relation to climate in submerged macrophyte region
 Yale-NUIST Center on Atmospheric Environment Interannual variation of MODIS NDVI in Lake Taihu and its relation to climate in submerged macrophyte region ZhangZhen 2015.07.10 1 Outline Introduction Data
Climatography of the United States No
 Climate Division: ND 8 NWS Call Sign: BIS Month (1) Min (2) Month(1) Extremes Lowest (2) Temperature ( F) Lowest Month(1) Degree s (1) Base Temp 65 Heating Cooling 100 Number of s (3) Jan 21.1 -.6 10.2
Climatography of the United States No
 Climate Division: TN 1 NWS Call Sign: Month (1) Min (2) Month(1) Extremes Lowest (2) Temperature ( F) Lowest Month(1) Degree s (1) Base Temp 65 Heating Cooling 100 Number of s (3) Jan 47.6 24.9 36.3 81
BACK TO BASICS: PIPE INSULATION
 BACK TO BASICS: PIPE INSULATION INDUSTRIAL REFRIGERATION CONSORTIUM RESEARCH & TECHNOLOGY FORUM MAY 2-3, 2012 Todd Jekel, Ph.D., P.E. Assistant Director, IRC Overview 1 2 3 4 Basics of insulation & insulation
Climatography of the United States No
 Climate Division: CA 5 NWS Call Sign: FAT Month (1) Min (2) Month(1) Extremes Lowest (2) Temperature ( F) Lowest Month(1) Degree s (1) Base Temp 65 Heating Cooling 1 Number of s (3) Jan 53.6 38.4 46. 78
Climatography of the United States No
 Climate Division: CA 6 NWS Call Sign: 1L2 N Lon: 118 3W Month (1) Min (2) Month(1) Extremes Lowest (2) Temperature ( F) Lowest Month(1) Degree s (1) Base Temp 65 Heating Cooling 1 Number of s (3) Jan 63.7
Climatography of the United States No
 Climate Division: CA 5 NWS Call Sign: BFL Month (1) Min (2) Month(1) Extremes Lowest (2) Temperature ( F) Lowest Month(1) Degree s (1) Base Temp 65 Heating Cooling 1 Number of s (3) Jan 56.3 39.3 47.8
Development and performance evaluation of a methodology, based on distributed computing, for speeding EnergyPlus simulation
 Development and performance evaluation of a methodology, based on distributed computing, for speeding EnergyPlus simulation Vishal Garg a*, Kshitij Chandrasen a, Jyotirmay Mathur b, Surekha Tetali a, Akshey
Available online at ScienceDirect. Energy Procedia 78 (2015 )
") Available online at www.sciencedirect.com ScienceDirect Energy Procedia 78 (2015 ) 2560 2565 6th International Building Physics Conference, IBPC 2015 The influence of different hourly typical meteorological
Available online at www.sciencedirect.com ScienceDirect Energy Procedia 78 (2015 ) 2560 2565 6th International Building Physics Conference, IBPC 2015 The influence of different hourly typical meteorological
Load Forecasting Technical Workshop. January 30, 2004
 Load Forecasting Technical Workshop January 30, 2004 Agenda New Commercial Survey Results (20 Minutes) Changing Commercial Saturation s (20 Minutes) Conditional Demand Analysis (30 Minutes) Changing Commercial
Memo. I. Executive Summary. II. ALERT Data Source. III. General System-Wide Reporting Summary. Date: January 26, 2009 To: From: Subject:
 Memo Date: January 26, 2009 To: From: Subject: Kevin Stewart Markus Ritsch 2010 Annual Legacy ALERT Data Analysis Summary Report I. Executive Summary The Urban Drainage and Flood Control District (District)
Climatography of the United States No
 Climate Division: TN 3 NWS Call Sign: BNA Month (1) Min (2) Month(1) Extremes Lowest (2) Temperature ( F) Lowest Month(1) Degree s (1) Base Temp 65 Heating Cooling 100 Number of s (3) Jan 45.6 27.9 36.8
NASA Products to Enhance Energy Utility Load Forecasting
 NASA Products to Enhance Energy Utility Load Forecasting Erica Zell, Battelle zelle@battelle.org, Arlington, VA ESIP 2010 Summer Meeting, Knoxville, TN, July 20-23 Project Overview Funded by the NASA Applied
Computing & Telecommunications Services Monthly Report January CaTS Help Desk. Wright State University (937)
") January 215 Monthly Report Computing & Telecommunications Services Monthly Report January 215 CaTS Help Desk (937) 775-4827 1-888-775-4827 25 Library Annex helpdesk@wright.edu www.wright.edu/cats/ Last
January 215 Monthly Report Computing & Telecommunications Services Monthly Report January 215 CaTS Help Desk (937) 775-4827 1-888-775-4827 25 Library Annex helpdesk@wright.edu www.wright.edu/cats/ Last
The Climate of Payne County
 The Climate of Payne County Payne County is part of the Central Great Plains in the west, encompassing some of the best agricultural land in Oklahoma. Payne County is also part of the Crosstimbers in the
Temporal and spatial variations in radiation and energy fluxes across Lake Taihu
 Temporal and spatial variations in radiation and energy fluxes across Lake Taihu Wang Wei YNCenter Video Conference May 10, 2012 Outline 1. Motivation 2. Hypothesis 3. Methodology 4. Preliminary results
Distributed Generation. Retail Distributed Generation
 Attachment A.1 RES Summary Total RECs Acquired NonDistributed Generation Distributed Generation Retail Distributed Generation Carry Forward to 2017 Previous Carry Forward to 2017 Total Carry Forward to
Variability of Reference Evapotranspiration Across Nebraska
 Know how. Know now. EC733 Variability of Reference Evapotranspiration Across Nebraska Suat Irmak, Extension Soil and Water Resources and Irrigation Specialist Kari E. Skaggs, Research Associate, Biological